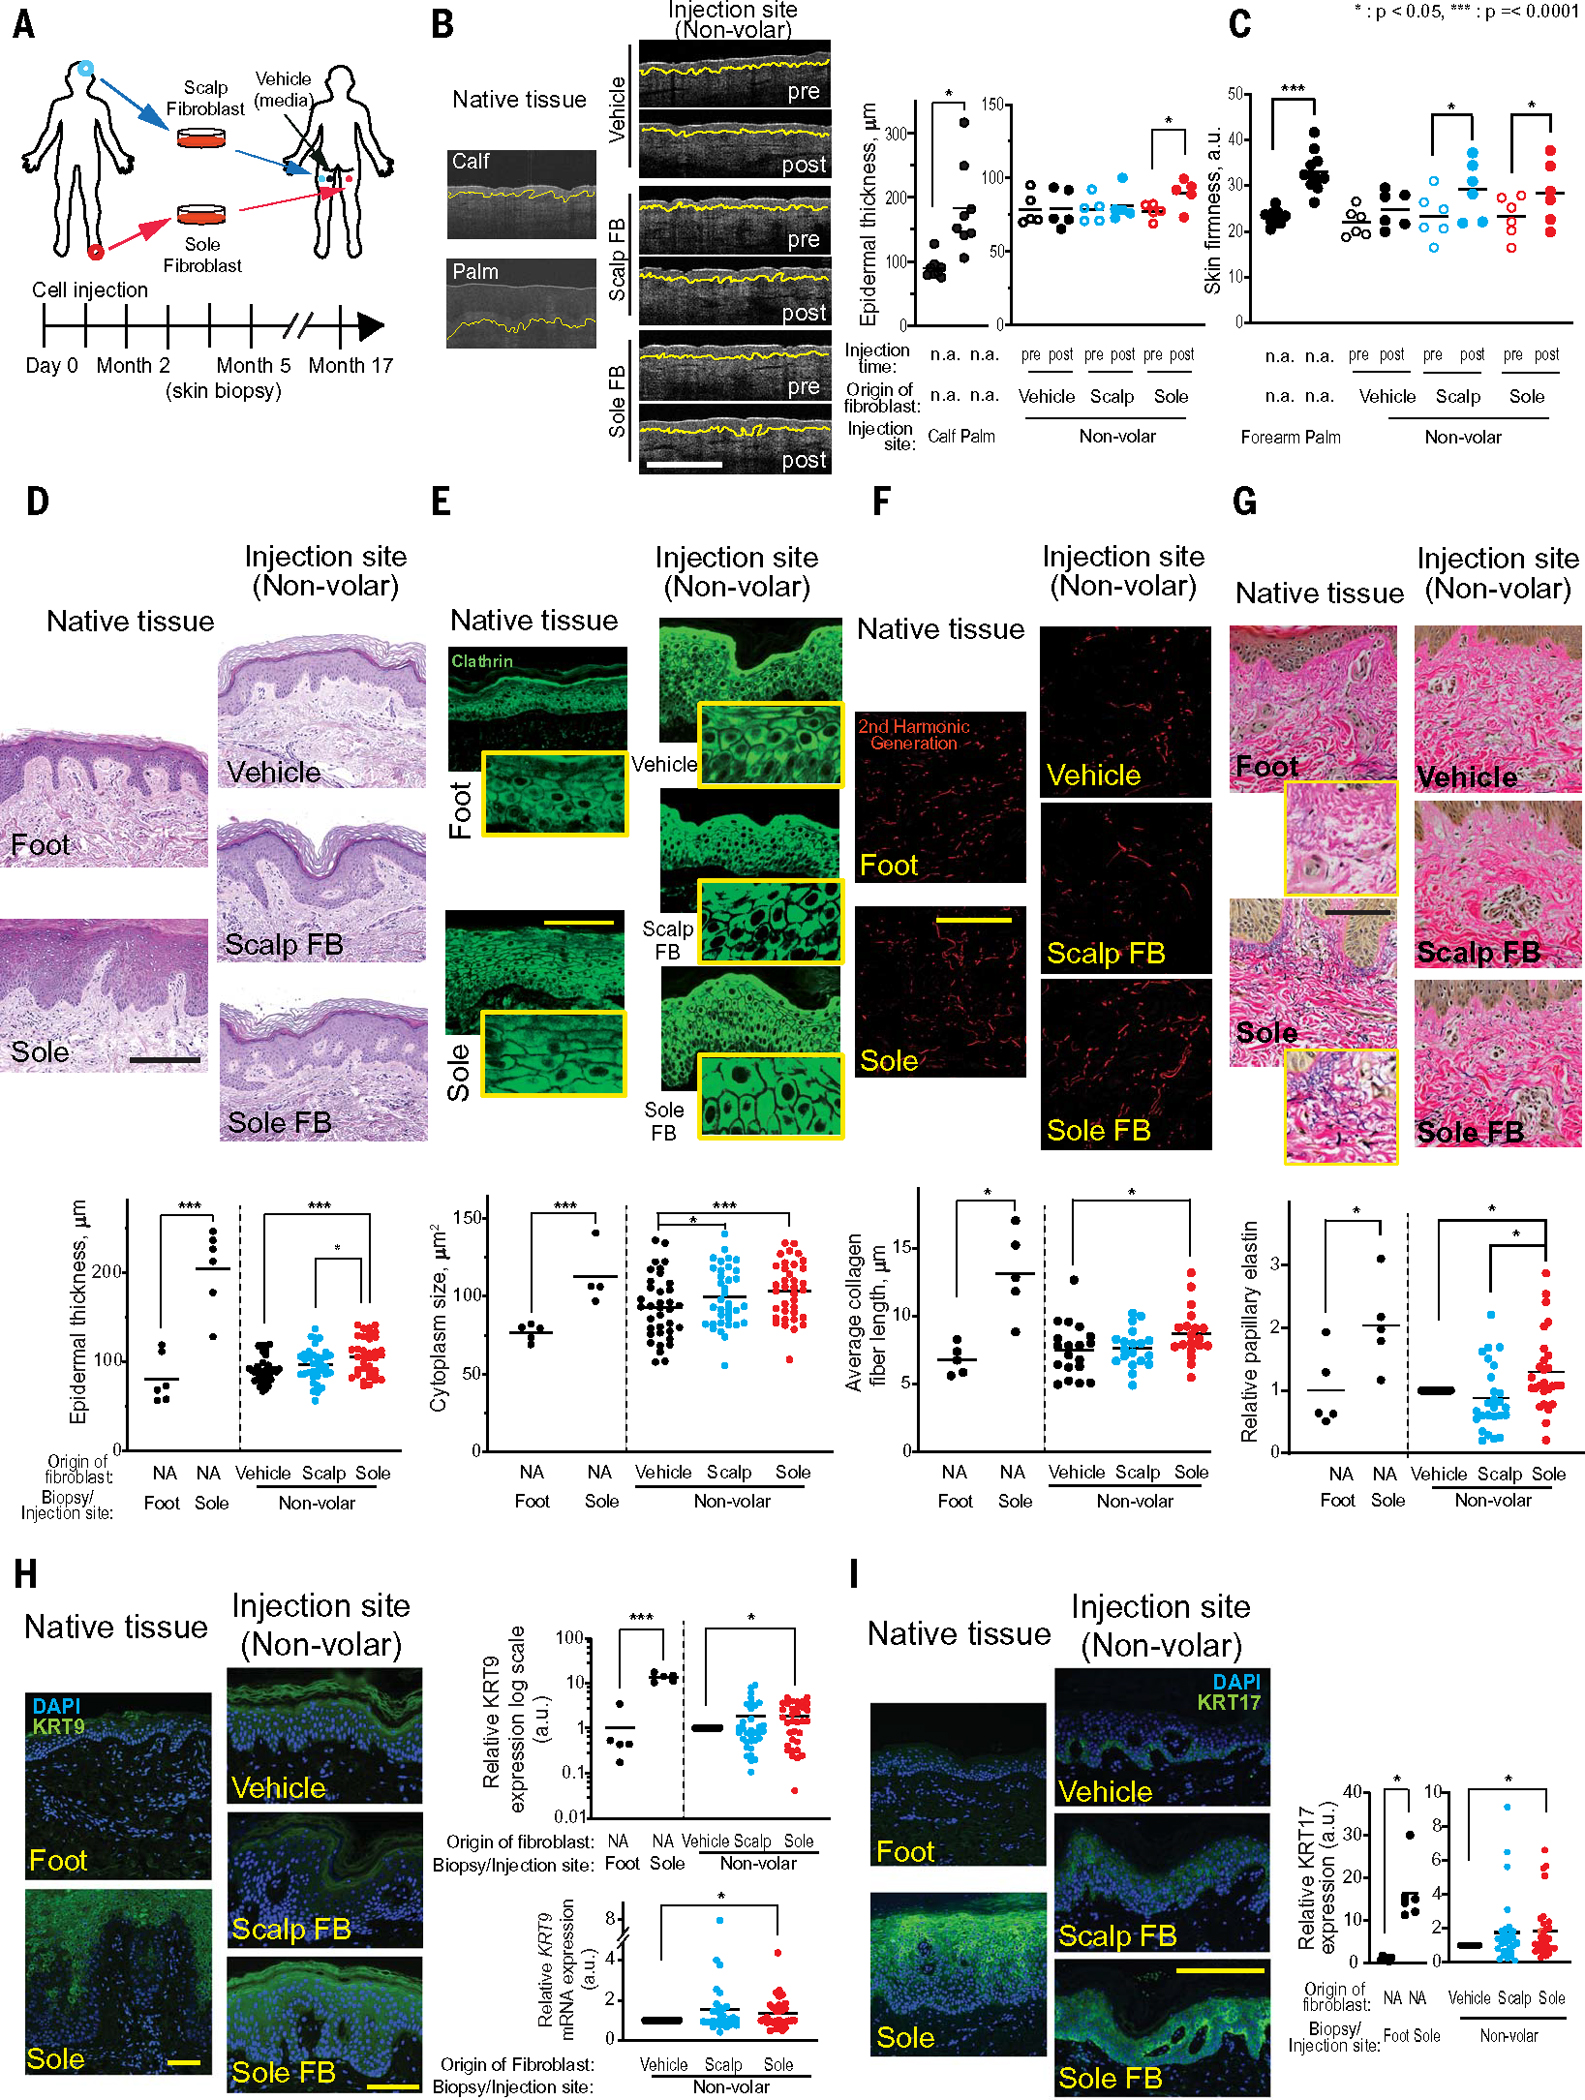
Fig. 2. In a human trial, ectopic volar fibroblasts induced histologic changes in nonvolar skin.

(A) Schematic presentation of experimental design for human clinical trial. (B) Representative images from OCT. Yellow line indicates dermal-epidermal junction (DEJ). Pre- and post-fibroblast injection time points showed that native volar (palm) epidermis was significantly thicker than native nonvolar (calf) epidermis (P = 0.002, n = 8 distinct subjects with 4 readings). The epidermis of sole fibroblast–injected sites (Sole FB-post) was significantly thicker compared to preinjection (Sole FB-pre, P = 0.009) or post-vehicle–injected control sites (Vehicle, P = 0.042, n = 5 distinct subjects with 4 readings). Scale bar, 500 μm. (C) Skin firmness measurement by durometer. Native volar (palm) skin was significantly firmer than native nonvolar (forearm) epidermis (P < 0.0001, n = 10 distinct subjects with 4 readings). Skin at scalp fibroblast–injected and sole fibroblast–injected sites was firmer than at preinjection (P = 0.007 and P = 0.015, respectively, n = 6 distinctive subjects with 4 readings). (D) Representative images of H&E stain from native and injection sites. Histological imaging of epidermal thickness in excised native tissue and injected sites. Native volar (sole) epidermis was significantly thicker than nonvolar (foot) epidermis (P < 0.0001, n = 6 distinct subjects with 1 repeat). Epidermal thickness in the Sole FB–injected sites was significantly thicker than that in the Scalp FB–injected sites (P = 0.04) or Vehicle-injected sites (P = 0.0001, n = 32 distinct subjects with 1 repeat). Scale bar, 100 μm. (E) Representative images of clathrin stain. Fluorescent imaging of clathrin protein to determine cytoplasm size in keratinocytes of native tissue and injected sites. Cytoplasm was significantly larger in native volar tissue compared to native nonvolar tissue (P < 0.0001, n = 5 distinct subjects with 1 repeat). Cytoplasm size in Sole FB– or Scalp FB–injected sites was larger compared to Vehicle-injected sites (P = 0.0001 and 0.006, respectively, n = 32 distinct subjects with 1 repeat). Scale bar, 100 μm. (F) Representative images of collagen fibers by second harmonic generation (SHG). Collagen fibers in dermis of native tissue and injected sites were detected by SHG. Collagen fiber lengths were measured according to collagen fibril detection. Fibers were significantly longer in native volar tissue compared to native nonvolar tissue (P = 0.01, n = 5 distinct subjects with 1 repeat). Fibers in the Sole FB–injected sites were significantly larger compared with Vehicle-injected sites (P = 0.04, n = 18 distinct subjects with 1 repeat). Scale bar, 100 μm. (G) Representative images of elastin stain. Native volar region (sole) had more elastin than native nonvolar regions (foot) (P = 0.04, n = 5 distinct subjects with 1 repeat). Injection of volar fibroblast in a nonvolar site led to increased elastin compared with similar sites’ vehicular injections (P = 0.05) and nonvolar injections (P = 0.002, n = 27 distinct subjects with 1 repeat). Scale bar, 100 μm. (H) Protein and mRNA expression of epidermal KRT9. Representative images are protein KRT9 stain. Scale bar, 100 μm. Epidermal KRT9 expression in native volar tissue was higher compared with native non-volar tissue (P < 0.0001, n = 5 distinct subjects with 1 repeat). Epidermal protein and mRNA KRT9 expression in the Sole FB–injected sites (n = 31 distinct subjects with 2 repeats) was significantly higher than in Vehicle-injected sites (P = 0.004 and 0.04, respectively). (I) KRT17 in native tissue and injected sites. KRT17 expression in native volar tissue was significantly higher than that in nonvolar tissue (P = 0.0003, n = 5 distinct subjects with 1 repeat). KRT17 expression in the Sole FB–injected sites was significantly higher compared with Vehicle-injected sites (P = 0.02, n = 31 distinct subjects with 1 repeat). Scale bar, 100 μm.
