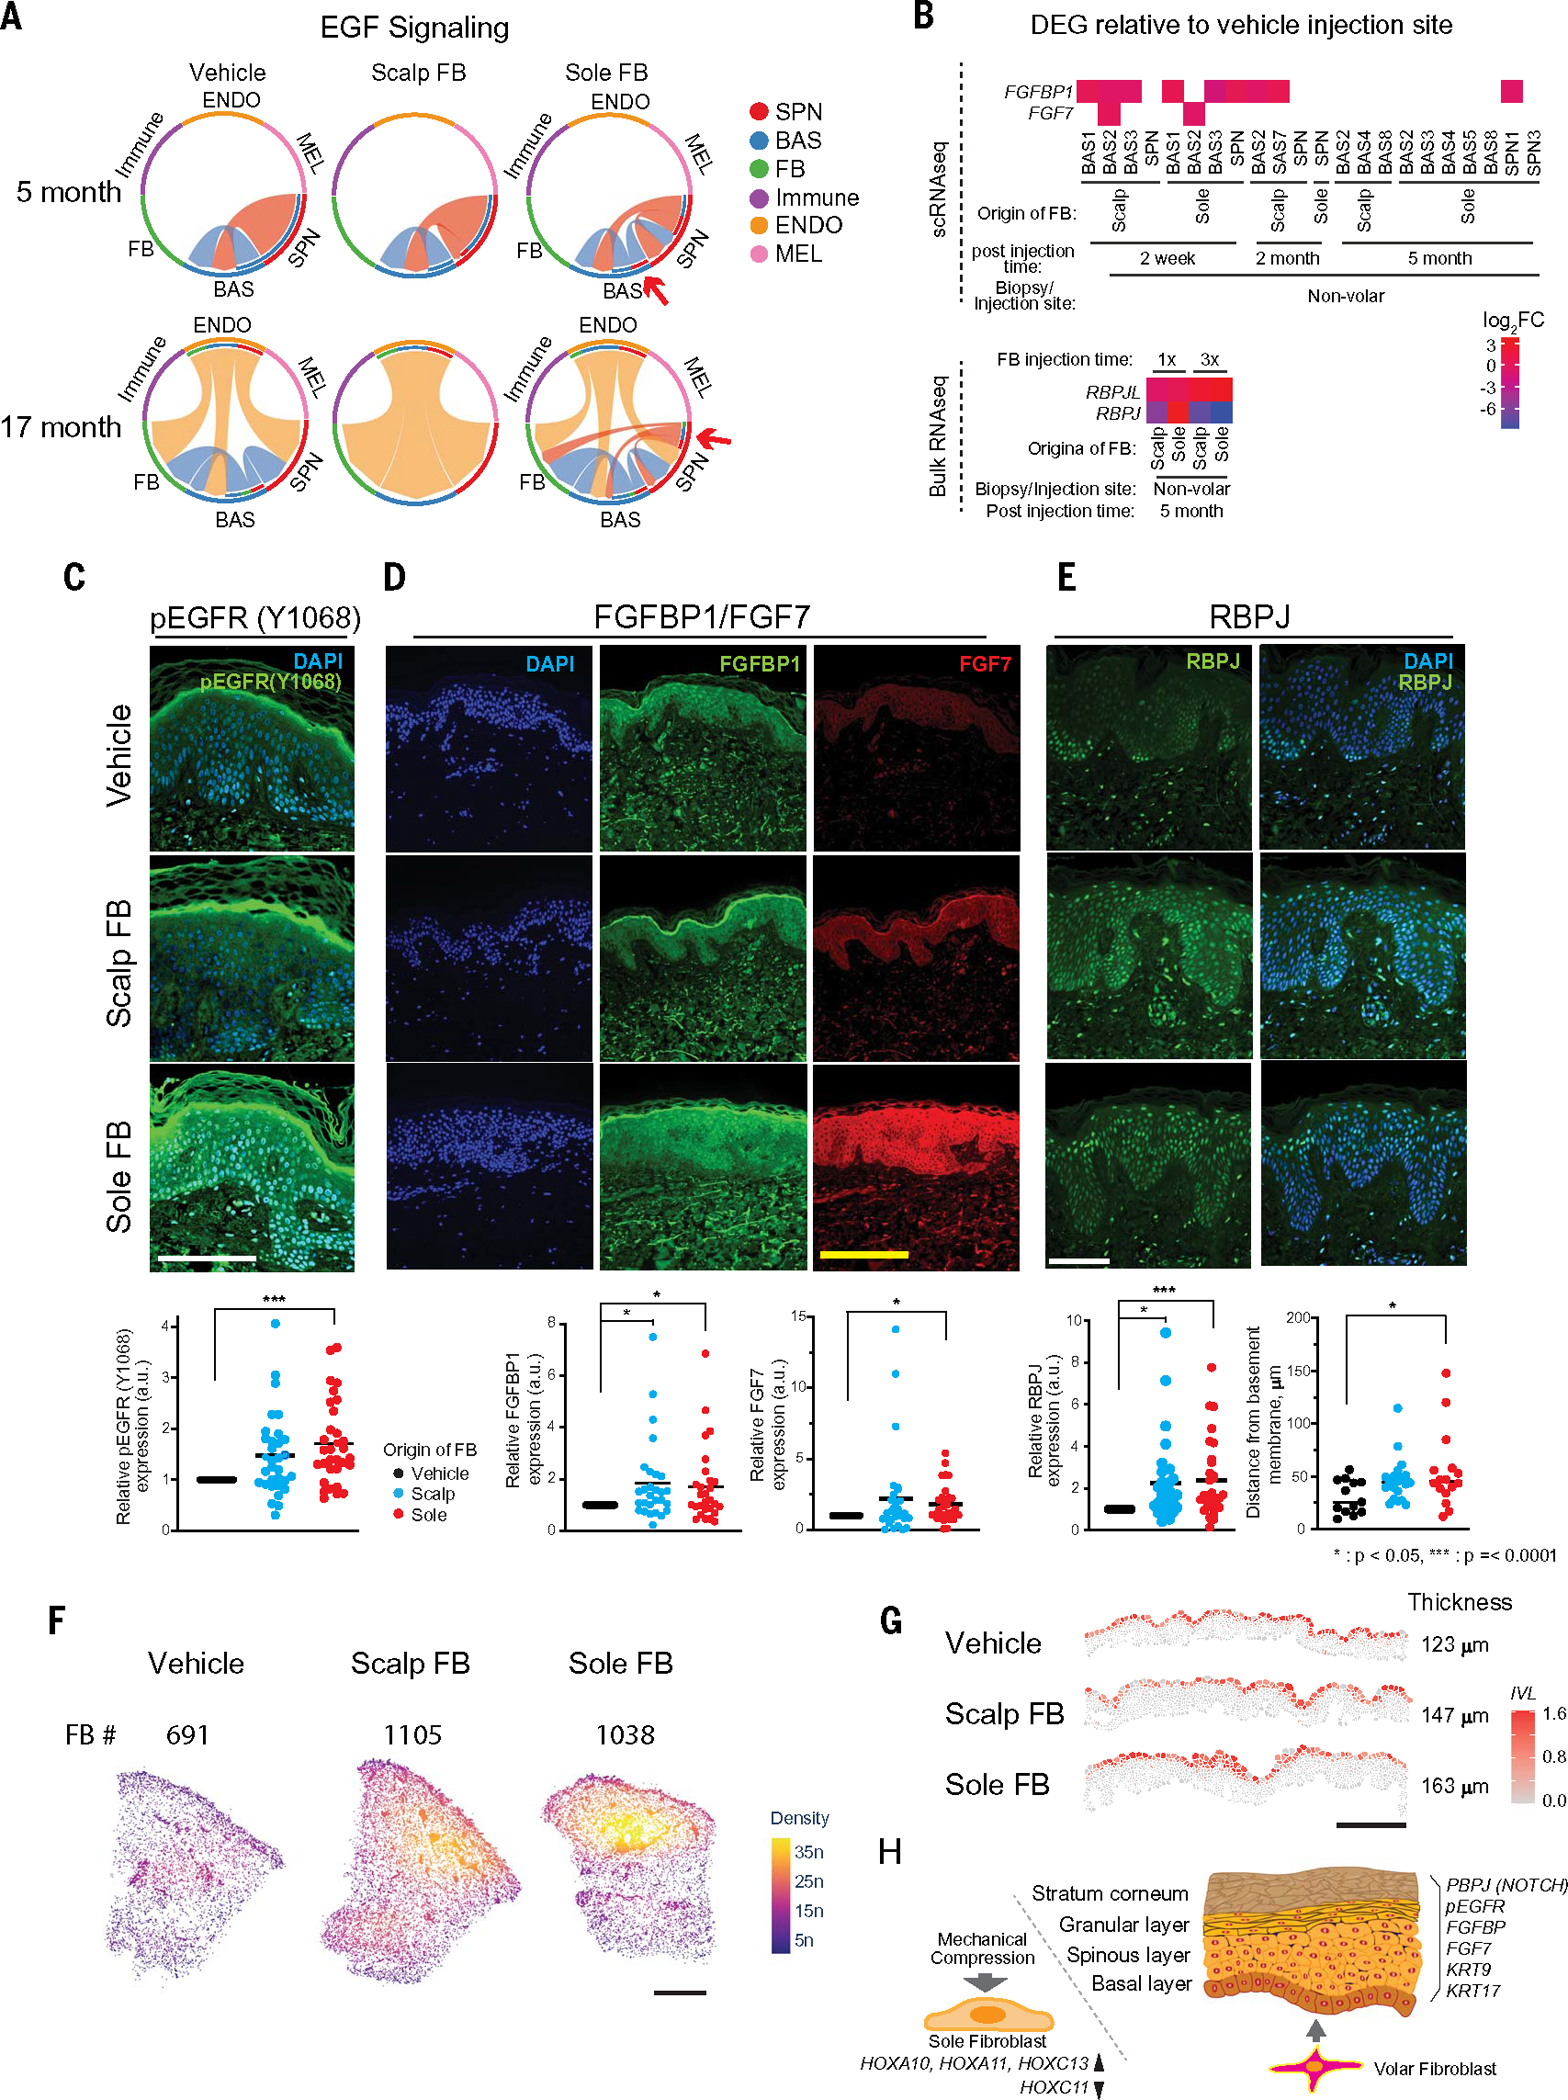
Fig. 4. Cell-to-cell signaling through EGF, FGF, and NOTCH pathways was modified by ectopic fibroblasts.

(A) Circle plots by CellChat show sender-receptor relationships in EGF signaling pathways at 5-month and 17-month postinjection time points. The signal sender is located on the outer circle, and the recipient is located on the inner circle. Shading visualizes the pathway connections. SPN, spinous; BAS, basal; ENDO, endothelial; MEL, melanocyte. (B) FGF pathway (top, FGF7/FGFBP1) and NOTCH pathway (bottom, RBPJL/RBPJ) expression in scRNA-seq analysis (top) and bulk RNA-seq analysis (bottom). DEG with P < 0.05 were selected for presentation. (C) Representative images of pEGFR-Y1068 stain, showing pEGFR-Y1068 protein expression in injected sites. Expression was significantly higher in Sole FB–injected sites compared with Vehicle-injected sites (P = 0.0001, n = 32 distinct subjects with 1 repeat). Scale bar, 100 μm. (D) Representative images of FGFBP1 and FGF7 stains. FGFBP1 and FGF7 protein expression in injected sites. Sole FB–injected sites exhibited greater expression of FGFBP1 (P = 0.04) and FGF7 (P = 0 0.007) compared with Vehicle-injected sites. The Scalp FB–injected sites also exhibited greater FGFBP1 expression compared with Vehicle-injected sites (P = 0.024, n = 28 distinct subjects with 1 repeat). Scale bar, 100 μm. (E) Representative images of RBPJ stain. RBPJ (RBPSUH) protein expression in injected sites. RBPJ was expressed at significantly higher levels in the Sole FB– or Scalp FB–injected sites as compared with Vehicle-injected sites (P = 0.001 and 0.007, respectively, n = 29 distinct subjects with 1 repeat). Scale bar, 100 μm. Distance of RBPJ (RBPSUH)–positive keratinocytes from the basement membrane was measured. RBPJ-positive keratinocytes in Sole FB–injected sites were located significantly farther from the basement membrane compared with the keratinocytes in the Vehicle-injected sites (P = 0.03, n = 20 distinct subjects with 1 repeat). (F) Fibroblast density by Xenium in situ spatial transcriptomics at the 2-month postinjection time point. Increased fibroblast densities in the papillary dermis were detected at Scalp and Sole FB injection sites. Fibroblast cell numbers are indicated above the Xenium spatial plot. Scale bar, 1 mm. (G) Epidermal IVL expression at the 2-month postinjection time point as shown in (F). Higher levels of IVL expression across multiple keratinocyte layers were detected at the Sole FB sites. The IVL expressions in the entire epidermis are depicted in fig. S26F. Scale bar, 250 μm. (H) Schematic presentation of volar fibroblast response to pressure and modification of epidermal differentiation.
