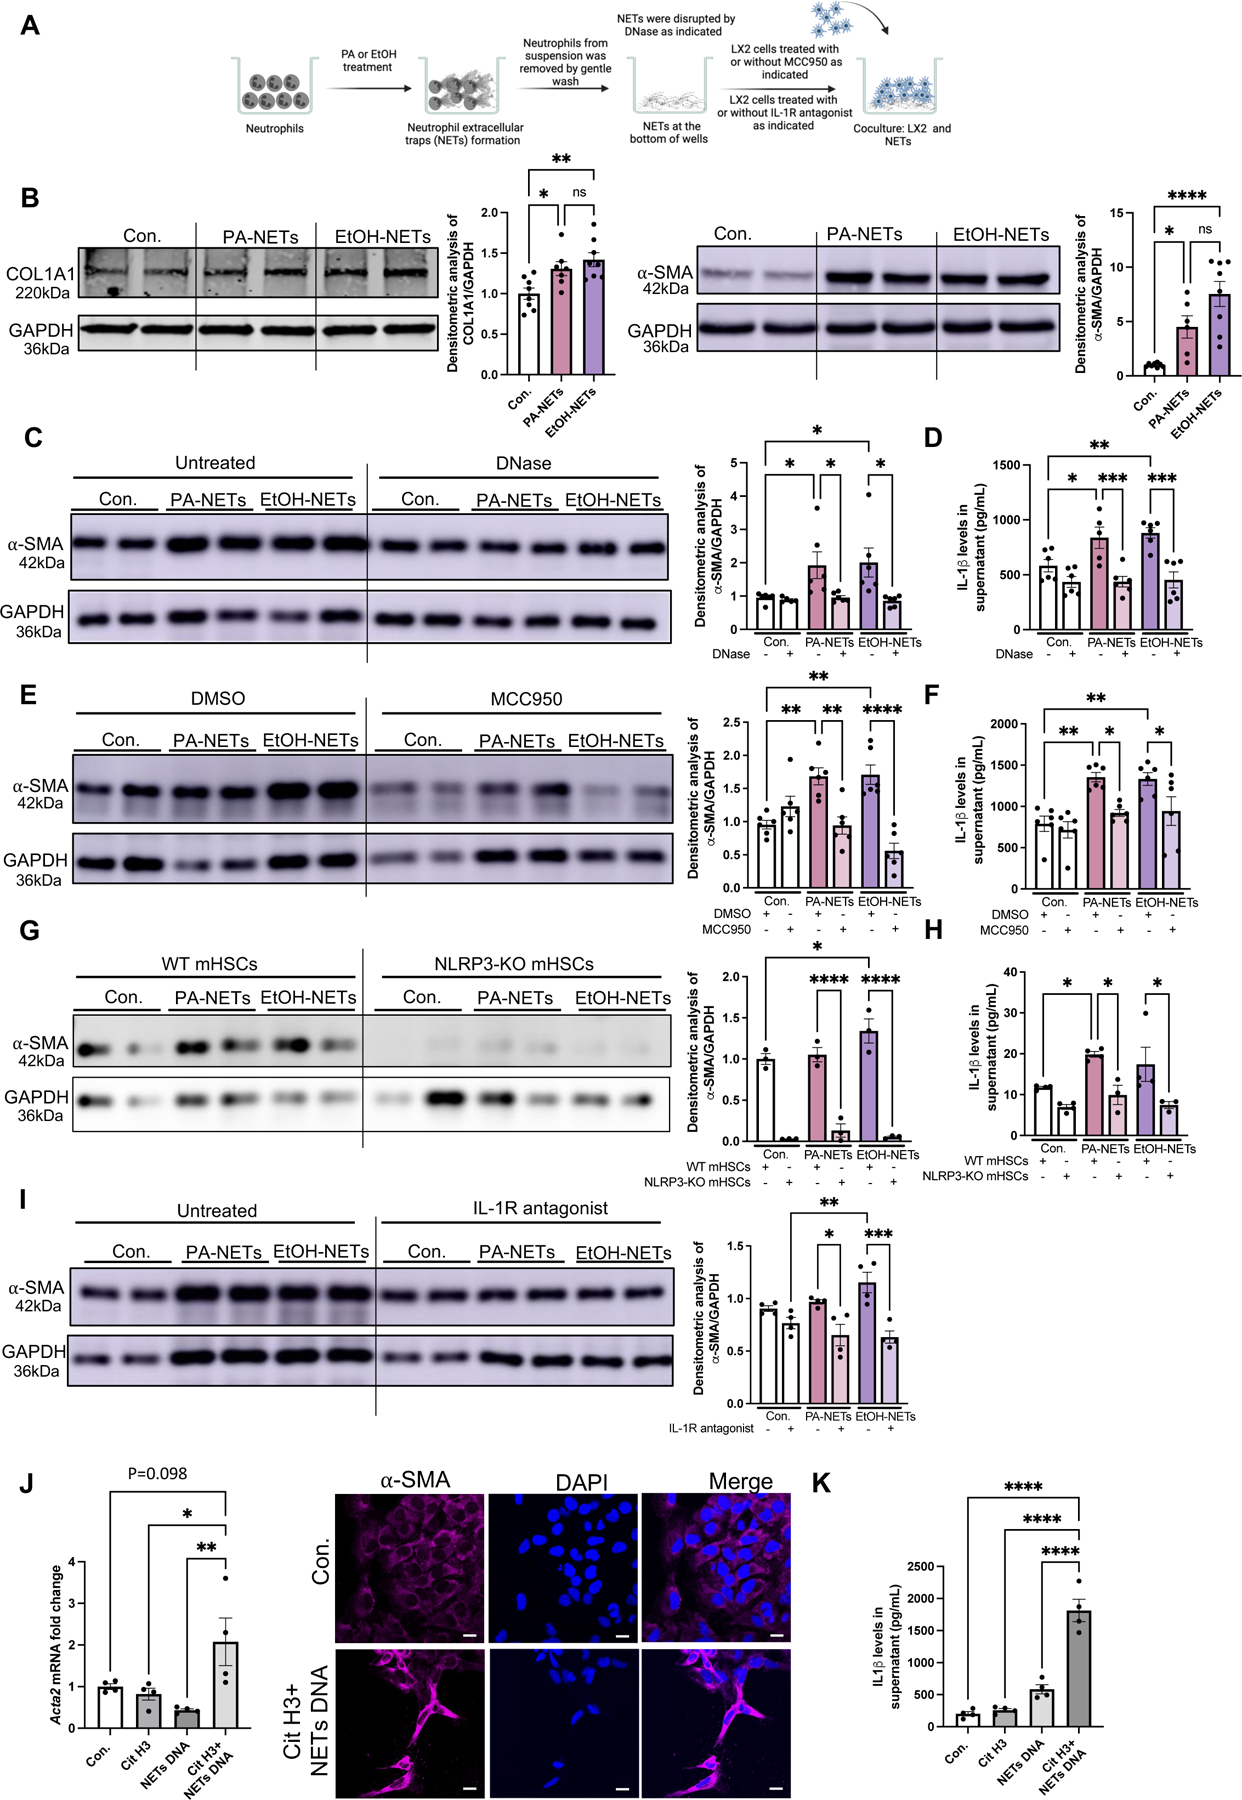
Fig 5. In vitro neutrophil extracellular traps activate stellate cells activation via NLRP3.

(A) Human neutrophils were treated with PA or EtOH for NETs formation, followed by coculturing NETs with LX2 cells. (B) LX2-lysates were used to detect α-SMA and COL1A1 by Western blot. The densitometry analysis is shown as bar graph (n=8). (C) LX2 lysates after coculturing with DNase treated NETs were used to detect α-SMA by Western blot. The densitometry analysis is shown as bar graph (n=6). (D) LX2 supernatant after coculturing with DNase treated NETs were used to detect IL-1β by ELISA (n=6). (E) EtOH/PA-induced NETs were cocultured with MCC950-treated LX2 cells. LX2 cell lysates were used to detect α-SMA by western blot. The densitometry analysis is shown as bar graph (n=6). (F) MCC950/DMSO-treated LX2 supernatant after coculturing with EtOH/PA NETs were used to detect IL-1β by ELISA (n=6). (G) EtOH/PA-induced NETs from WT neutrophils were cocultured with WT mouse HSCs or NLRP3-KO HSCs. The densitometry analysis is shown as bar graph (n=3). (H) WT mouse HSCs or NLRP3-KO HSCs supernatants after coculturing with EtOH/PA NETs were used to detect IL-1β by ELISA. The densitometry analysis is shown as bar graph (n=3). (I) EtOH/PA-induced NETs were cocultured with IL-1 receptor antagonist-treated LX2 cells. LX2 cell lysates were used to detect α-SMA by western blot. The densitometry analysis is shown as bar graph (n=4). (J) LX2 cells RNA after culturing with recombinant cit-H3, NETs DNA or combination of cit-H3 and NETs DNA (n=4). Acta2 mRNA levels was determined by qPCR. 18s was used to normalize Cq values. Immunofluorescence staining with α-SMA and DAPI after culturing LX2 cells with recombinant cit-H3, and NETs DNA, scale bar=50 μm. (K) LX2 supernatant after treating LX2 cells with cit-H3, NETs DNA or combination of citH3 and NETs DNA were used to detect IL-1β by ELISA (n=4). * p<0.05, **p<0.005, ***p<0.0005, ****p<0.00005
