

Abstract
Accessibility is one of the crucial criteria for measuring the ease of access to public services in a region. Given China’s historical rural–urban dualism and rapid urbanization process, there exist significant disparities in public services within metropolises. This study selects Nanjing as a representative metropolis and employs the Gaussian two-step floating catchment area method and an improved potential model to calculate the accessibility of comprehensive hospitals. Spatial autocorrelation and urban–rural disparities are analyzed, confirming spatial variations in healthcare service equity. The results show that: ①The spatial variability of accessibility to comprehensive hospitals is significant. The Gaussian two-step floating catchment method overestimates overall accessibility, and for Nanjing, the improved potential model with β = 1.5 proves more suitable. ②Accessibility exhibits pronounced clustering characteristics. Healthcare conditions for residents in the northern part of Liuhe District, eastern part of Qixia District, western part of Pukou District, peripheral areas of Jiangning District, eastern part of Gaochun District, and residents in Lishui District need improvement. ③Comprehensive healthcare services are relatively lacking in nearly 60% of rural areas. Our research findings provide valuable insights for improving spatial justice in public infrastructure in metropolises of developing countries.
Keywords: Spatial accessibility, Inequality, China, Metropolis, Urban–rural relationship
Subject terms: Environmental social sciences, Health care
Introduction
Access to healthcare is essential for human well-being, but it is partly limited by the distribution of healthcare resources in relation to the geographically spread out human population1. This creates a conflict between the regional demand for healthcare services and its spatial accessibility. This means that individuals living in non-densely populated areas around the world often face longer travel times and higher costs when seeking healthcare services2. In China’s dual social structure3, this imbalance exacerbates the vulnerability of rural subgroups, leading to increased mortality and morbidity from treatable diseases1. How to achieve equalization of public services from a healthcare perspective, to promote urban–rural coordination and ensure sustainable human development, is a critical issue currently facing spatial justice on a global scale4.
One of the major new sustainable development goals set by UN-Habitat is to create equitable cities and ensure a fair urban living environment. Numerous studies focused on spatial justice within the domain of healthcare services5–7. The Indian government, for instance, announced the Ayushman Bharat Program (ABP), which aims to provide comprehensive primary healthcare services (PHC) to the entire population, while also improving access to secondary and tertiary hospital services for the bottom 40% of the population8. In countries such as Bangladesh, Kenya, Nigeria, and Pakistan, slum dwellers found it increasingly difficult to access healthcare facilities during the COVID-19 pandemic, and their healthcare expenditures increased as well9. Faced with overburdened healthcare systems, developed countries have proposed the establishment of Public–Private Partnerships (PPPs) to diversify healthcare service delivery channels and achieve spatial justice in healthcare10. A temporal analysis of ICU bed accessibility in Texas, USA, has confirmed that the COVID-19 pandemic exacerbated spatial inequalities in access to healthcare resources11. Existing research has explored healthcare accessibility and equity across different contexts, such as edge cities12, high social vulnerability areas13, low- and middle-income countries (Mongolia and Ghana)14,15, developing countries (China and Thailand)16,17, and high-income countries (Japan and the United States)6,18. These studies have revealed the existence of systemic inequalities, which are related to disparities in infrastructure, resource allocation, and social support systems. Furthermore, research has focused on vulnerable groups, such as Latina women, impoverished populations, the elderly, and maternal patients2,19–21, contributing to the call for policy interventions to improve healthcare accessibility for these disadvantaged groups. However, attention to the urban–rural divide remains limited, particularly with regard to empirical evidence from developing countries. It is undeniable that spatial justice between urban and rural areas is an unavoidable critical issue, especially in developing countries, where the stage of development often entails more severe infrastructure disparities between urban and rural areas.
In China, rapid development has led to the emergence of 14 metropolises, each with a population ranging between 5 to 10 million. Within these metropolises, the disparity in accessibility to healthcare services, particularly between urban and rural areas, has become increasingly pronounced22. In these metropolises, private transportation and moderate living standards are common in both urban and rural regions23. Consequently, the uneven distribution of road accessibility and healthcare resources has become a major factor contributing to the disparity in healthcare service availability between urban and rural areas. Previous research on healthcare accessibility has widely employed methods such as spatial interaction models5–7,24,25, machine learning approaches26, patient surveys27, and case interviews19. Additionally, interdisciplinary research methods incorporating perspectives from economics, sociology, and design have also been utilized26,28,29. Spatial interaction methods include potential models and the two-step floating catchment area (2SFCA) method, with various improvements and enhancements to these models30–33. For example, the Hierarchical 2SFCA (H2SFCA) model considers hospital hierarchies3, while the reliability-based two-step floating catchment area (2SFCA) method accounts for dynamic travel times34, and the improved potential model based on Web Mapping API takes into account traffic congestion35. These methods and their improved models provide good matching for healthcare facility distribution and population demand under different conditions. Therefore, they are well-suited for rapidly urbanizing areas and regions facing significant challenges in transportation accessibility.
In China’s hospital system, medical institutions are categorized into three levels. The first level consists of primary healthcare institutions, including community hospitals and township health centers, which provide basic and primary healthcare services. The second level includes township-level hospitals, which offer more robust services to meet the needs of patients within the region. The third level comprises city-level hospitals, which cater to broader and more complex medical demands. However, it remains unclear how the urban–rural disparities in healthcare services manifest in metropolises, especially concerning advanced, comprehensive healthcare services, since primary healthcare services are relatively dense and evenly distributed within these cities. This study focuses on comprehensive hospitals within township-level and city-level hospitals. Taking Nanjing, a city in the Yangtze River Delta of China, as a case study to explore the spatial distribution of high-level comprehensive medical resources in metropolises of developing countries, with a particular focus on the accessibility differences for urban and rural residents. The study employs an improved potential model and Gaussian two-step floating catchment area (Gauss-2SFCA) method to calculate and assess the spatial distribution pattern of healthcare accessibility in the region, identifying areas lacking medical facilities from urban and rural perspectives. The research findings contribute empirical evidence to enrich studies on regional public facility accessibility and provide insights for the effective and rational allocation of public service facilities in metropolises.
Data and methods
Study area
Nanjing, situated in the southwestern region of Jiangsu Province, holds great significance as a constituent of both the Yangtze River Delta urban cluster and the Yangtze River Economic Belt. Spanning across a substantial area of 6,587.02 square kilometers, Nanjing exercises administrative control over 11 districts, including the municipal districts of Xuanwu, Qinhuai, Jianye, Gulou, Qixia, and Yuhuatai, as well as the recently established districts of Pukou, Luhe, Jiangning, Lishui, and Gaochun. The majority of the population resides in the six municipal districts, as well as the southern portions of Pukou and Luhe districts, the central area of Jiangning district, and the centers of Lishui and Gaochun districts. Additionally, there are scattered clusters of population elsewhere.
The reason for selecting Nanjing as the study area is that it is one of China’s 14 metropolises. Metropolises in developing countries share similarities in terms of area, population, infrastructure development, and socio-economic conditions. Unlike highly urbanized metropolises or more balanced, developing small cities, urban–rural disparities tend to be more pronounced in these metropolis36. Nanjing has several high-level hospitals and medical research institutions, while also facing issues such as urban–rural disparity and uneven distribution of resources. As a central city in the Yangtze River Delta economic zone, it has a rich historical and cultural background and a high degree of internationalization, representing some of the best medical conditions within the surrounding provinces and cities. Although it may not match the megacities like New York City or Shanghai in terms of medical standards and global influence, Nanjing, as a first-tier or quasi-first-tier city in China, plays an important regional center role and undoubtedly possesses representative characteristics of a metropolis. These attributes make Nanjing representative in studies of healthcare equity, reflecting the challenges and opportunities faced by metropolises in providing medical services. This study aims to explore the spatial distribution of high-level comprehensive healthcare resources in metropolis of developing countries, with Nanjing chosen as the study area to reflect the common conditions in such regions.
Nanjing has established a comprehensive healthcare system, which includes hospitals of various levels and types, as well as other health, prevention, and emergency institutions. In 2022, the city had a total of 3,607 healthcare institutions, including 296 hospitals. These institutions provided a total of 70,710 beds, with hospitals alone offering 63,951 beds. Regarding medical personnel, Nanjing had 108,640 healthcare professionals, including 40,610 doctors. In 2022, the number of beds per thousand people was 6.74. The healthcare service statistics for the past four years are presented in Table 1 (The Statistics yearbook is published up to 2023, but the data is only available up to 2022). The influx of a large population during the urbanization process has posed challenges to the accessibility of medical resources within the city. From 2019 to 2022, the number of hospital beds per thousand people and the number of doctors per thousand people followed an “U” shaped trend, first decreasing and then increasing.
Table 1.
Statistics on Nanjing’s health facilities, beds and personnel.
| Year | Medical and health institutions (pcs) | Hospitals (pcs) | Hospital Beds (sheet) | Number of professional (Assistant) doctors (person) | Number of doctors per thousand people (person) | Number of hospital beds per thousand people (sheet) |
|---|---|---|---|---|---|---|
| 2019 | 3242 | 248 | 53,499 | 35,735 | 4.20 | 6.29 |
| 2020 | 3439 | 271 | 57,455 | 37,823 | 4.06 | 6.17 |
| 2021 | 3451 | 277 | 59,748 | 39,326 | 4.17 | 6.34 |
| 2022 | 3607 | 296 | 63,951 | 40,610 | 4.28 | 6.74 |
Data source: Nanjing Health Statistics Yearbook (2020–2023).
The distribution of the population in Nanjing is illustrated in Fig. 1. In this investigation, a total of 34 general hospitals of level 2 or higher were carefully chosen. To gain a comprehensive understanding of the overall distribution of medical resources in Nanjing, an initial analysis was undertaken employing the number of beds per 1,000 individuals as a measuring indicator. The proportion of resources to the population in demand was then utilized to roughly determine the allocation of medical resources in the area. The outcomes of this analysis can be seen in Fig. 2. Among the 11 administrative districts, Gulou District, Qinhuai District, and Jianye District exhibit more favorable circumstances, with Gulou District boasting the highest level in the city at 12.50 beds per 1,000 people. Xuanwu, Gaochun, and Luhe follow with approximately 3 to 5 beds per 1,000 people. Qixia, on the other hand, has the most unfavorable situation, with less than 1.5 beds per 1,000 people, while the remaining districts fall somewhere in between.
Fig. 1.

Map of population density in Nanjing.
Fig. 2.
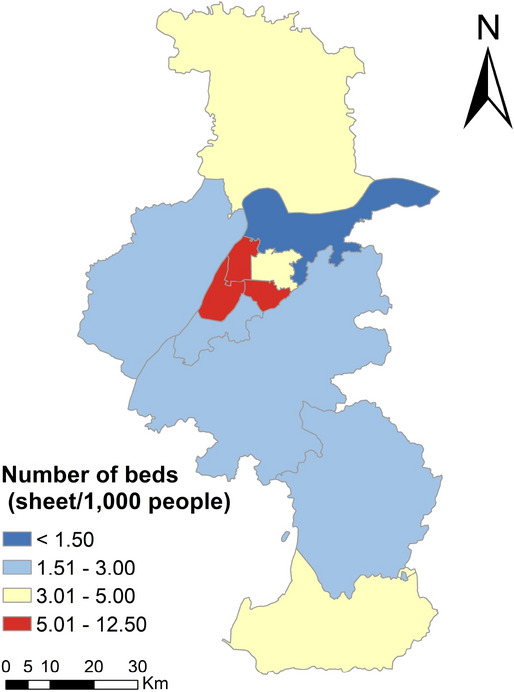
Map of beds per 1,000 people by district.
Data
The study used three main types of data: demographic data, basic geographic data, and healthcare resource data. The Nanjing administrative division map was obtained from the Ali Cloud data visualization platform. Population data was downloaded from the world pop website (https://dx.doi.org/10.5258/SOTON/WP00647). It was uncorrected 1 km × 1 km grid population data for 2020. This data was then corrected using the Nanjing sub-census population statistics from the 7th Census published in 2021. The basic geographic data, including road vectors, road grades, river networks, and water system vectors in Nanjing, were obtained from the 1:250,000 national basic geographic database in the National Catalogue Service For Geographic Information. Road speed standards were adopted from JTG B01-2014 road engineering technical standards. The geographic coordinates of hospitals were downloaded from Gaode Open Maps. The grade and facility scale of hospitals were determined by referencing the National Hospital Database (https://y.dxy.cn/hospital/), Jiujiu Health Network, official websites or Wechat blogs of each hospital, and information released by the Nanjing Municipal Health Commission. The data has been cross-verified. The distribution of hospitals selected for this study is illustrated in Fig. 3.
Fig. 3.

Distribution of general hospitals.
The initial steps of data processing involved projection, masking, mosaicking, and fusion of geographic data. The WGS1984 coordinate system was chosen for the projection, with a central longitude set at 117°E based on UTM ZONE 50N. Subsequently, the road and population data were carefully examined and corrected. Correction coefficients were calculated using data from the 7th Census and world pop, and a fishing net approach was employed for statistical analysis. Due to data confidentiality issues, the exact population size of each community is not available. Therefore, a population grid simulating the size of the community is constructed as an alternative. Nanjing has a total area of 6,587.04 km2 , with 906 urban communities and 352 rural communities, and the average community administrative area is about 5.2 km2. Considering the denser communities in the central area, we set the side length of the population grid to 2 km, and extract the centroid of each grid as a vector object for analysis. Topological checks were conducted and any topological errors were rectified to ensure road connectivity and establish correct topological relationships. Finally, attribute fields were calculated. Geographic attribute fields, such as road length, were obtained using ArcGIS. Additional fields, including road grade, speed, travel time, hospital grades, number of beds, and population counts, were established. Values for these fields were assigned through aggregation, connection, or calculation methods.
Cost matrix construction
The OD cost matrix is used to determine the connectivity cost between multiple origin and destination points. The construction of the OD cost matrix is a prerequisite for the development of the Gaussian 2SFCA method model and the improved potential model. The complete model flow diagram is shown in Fig. 4.
Fig. 4.

A working diagram of models.
In this study, a time cost matrix is constructed to reflect the real-life accessibility scenario. The demand points serve as the starting points, while the supply points represent the destination points. By creating a matrix that encompasses the minimum time required to connect various starting and destination points, the rows of the matrix represent the demand point elements, and the columns represent the supply point elements. To implement this process, a novel network dataset is generated in ArcGIS, and the network analysis tool is employed to construct the OD cost matrix. The start and destination points are loaded into the system, and subsequently solved in order to generate the OD lines as an output. Essentially, this enables the determination of the shortest connection time from each residential point to each medical point, which can then be utilized for subsequent filtering based on search thresholds, as well as for further accessibility calculations.
Gaussian two-step floating catchment area method model
The two-step floating catchment area (2SFCA) method was originally developed to measure the spatial accessibility of healthcare providers. Its advantage lies in simultaneously considering spatial interactions between supply and demand sides, objectively characterizing the accessibility of healthcare facilities, which refers to the opportunity for residents to access medical resources. The original 2SFCA adopts a dichotomous form of distance decay function, which has been considered a major limitation. Several improved forms of 2SFCA have been developed to address this limitation, which can be categorized into four main areas of modification, namely: changes for the form of distance decay, changes for the search radius, changes to consider competition on the supply and demand side, and changes for different modes of travel37–39.
To address the discontinuities in the original 2SFCA, this study incorporates a Gaussian decay function that aligns with the characteristics of transportation networks in metropolises40. Compared to linear and exponential functions, Gaussian function’s can reduce the error arising from the effect of increasing distance on people’s willingness to travel. This is because the Gaussian function is consistent with the characteristics of real-life demand for medical care compared to linear and exponential functions. Patients located near general hospitals have relatively stable access to medical services, while those at moderate distances may face significantly increased travel costs as distance increases. Patients residing far from general hospitals incur high travel costs with little variation41–43. These characteristics align with the properties of the Gaussian function, which initially decays slowly, then declines more rapidly, and finally levels off. The Gaussian 2SFCA method replaces the constant in the original model with a continuous decay function, thereby addressing the traditional model’s neglect of distance decay patterns44. The Gaussian 2SFCA principle aims to assess the level of accessibility by determining the quantity of facilities that can be accessed within a specified radius threshold. A higher number of accessible facilities indicates a better level of accessibility.
The Gaussian 2SFCA method is calculated as follows (Fig. 4). In the first step, the weighted population sum is calculated. It is necessary to consider the supply points for resources. In the case of hospitals, a spatial threshold, denoted as , is established. This threshold defines the range within which the hospital can serve the population. When a demand point falls within this range, the individuals residing in that demand point become potential users of the healthcare resource. By summing the population of these demand points, the total number of potential users can be obtained.
In the second step, calculate the supply–demand ratio . is calculated by dividing the size of the resource by the number of potential users.
| 1 |
where is the number of people in the population point , and is the size of the facility, expressed in the text as the number of beds in the hospital , and () is the travel cost measured by distance, travel time or total cost. In this study, it refers to travel time.
In the third step, calculate the accessibility . Take the demand points as objects. Consider the population grid points, within a spatial threshold . The supply/demand ratios within this scope are summed to obtain the total available resources at each demand point. The total supply/demand ratio available at each demand point is obtained, namely the medical accessibility .
| 2 |
Thus, the general formula for 2SFCA is expressed as follows.
| 3 |
However, the improvement made to this model by the Gaussian function is reflected in the change to the friction coefficient. It acts on the population as well as the spatial friction process of the supply/demand ratio. The Gaussian equation is calculated as followed.
| 4 |
Therefore, in the Gauss-2SFCA, the improved accessibility is expressed as
| 5 |
Improved potential model
The French scholar Lagrange expanded the concept of gravitational potential based on the law of universal gravitation, and related research in human geography has since extended this idea to represent interactions between regions, therefore the exponential form is retained. A novel impact factor termed as the healthcare facility class size index, has been proposed by Song45, with the intention of quantifying the capacity of healthcare facilities. This index takes into consideration the limiting travel distance (or travel time) as well as the supply–demand distance (or travel time), and diminishes to zero when the limit is surpassed. A healthcare facility class size index is introduced so that the improved potential model is able to differentiate between different classes of hospitals in terms of their service capacity, while limiting the scope of the facility’s services, correcting the lack of a search radius in the traditional potential model. In this way, both Gaussian 2SFCA and the improved potential model have the properties of search radius and distance decay. The study’s utilization of these two models is valuable in exploring what differences arise when using them to study general hospital accessibility. The improved potential model with healthcare facility class size index is presented as follows. The improved potential model is calculated as follows (Fig. 4). In the first step, calculate the population size of the destination where competition is considered. In the second step, calculate the supply of facilities considering . In the third step, sum to obtain accessibility .
| 6 |
where is the sum of the potential resources generated by all facilities for population point i, which is the accessibility of population point i. is the facility size of hospital j. is the friction coefficient, and is the time distance from population point i to hospital j. The impact factor represents the size of the population. denotes the population volume of the specific population unit k. The variables n and m respectively indicate the number of healthcare facility sites and population units. is the health care facility class size impact factor. represents the limiting travel time of the hospital, which is determined by the specific class to which hospital j belongs. Notably, if the exceeds the limiting travel time, the corresponding becomes zero. This model introduces a search radius restriction to the conventional potential model.
Determining the friction coefficient poses a challenging task when employing the potential model. It has been observed that the value of is usually centred between [1, 2]46. Regions with advanced development are better suited for a lower value47, whereas less developed areas benefit from a higher value48. In this study, different travel impedance coefficients (1, 1.5, 2) are configured to investigate sensitivities in spatial accessibility.
Grading thresholds based on hospital level are established ( in Eq. (2) and in Eq. (6)), they are used to calculate health care facility class size impact factor ( in Eq. (6)) and Gaussian equation. The road speed standard is determined by referencing the JTG B01-2014 road engineering technical standards. Due to the high traffic flow in Nanjing, the speed of all roads is set at the lowest of the design speeds, taking into account possible congestion. Specific parameters utilized in this study are listed in Table 2. In accordance with previous research as well as considering the city size and transportation convenience, the search threshold for level II hospitals () was set as 30 minutes49,50. Referencing existing studies3,51, the catchment area size was set as the maximum travel time from each demand node to the closest facility. Therefore, is established as 69 min.
Table 2.
Threshold and speed parameter design.
| Parameters | Threshold (min) | Road speed (km/h) | |||||
|---|---|---|---|---|---|---|---|
| Level II Hospital () | Level III Hospital | Express Way | Grade 1 Roads | Grade 2 Roads | Grade 3 Roads | Grade 4 Roads | |
| Values | 30 | 69 | 80 | 60 | 60 | 30 | 20 |
Ordinary kriging interpolation
Ordinary kriging interpolation was chosen to present the results of Gaussian 2SFCA and improved potential model. Kriging method is known as spatial optimal unbiased estimator (spatial BLUP) in geostatistics. Unlike IDW (Inverse Distance Weighting) and spline function methods, it considers spatial relationships. The spatial relationship of accessibility can be better represented by using kriging interpolation in the study. Accessibility estimation and kriging interpolation were done using ArcGIS 10.2.
Urban/rural boundary demarcation
With the continuous urbanization of suburban regions, a singular and fixed boundary is no longer suitable for defining urban and rural areas52. Therefore, this study draws upon existing research and utilizes night-time light intensity and light undulation as indicators for classifying urban and rural areas. By employing a long-term series of yearly artificial nighttime light datasets from the National Tibetan Plateau Science Data Centre in China and utilizing the 2020 artificial nightlight data53, the light undulation was calculated, and an unsupervised classification using ISO clustering was conducted to demarcate Nanjing into urban and rural areas.
Accessibility evaluation based on Gaussian 2SFCA
The spatial accessibility calculated by Eq. (5) is based on the Gaussian 2SFCA method for general hospital accessibility. As shown in Fig. 5, the spatial variation in accessibility around the city is not significant, indicating a generally favorable accessibility level throughout the city. The highest value, 5.69, is observed in Luhe. When considering the average accessibility at the district level, the highest value is found in Gulou, reaching 4.63, while the lowest value is recorded in Gaochun, measuring 1.43. The overall city-wide average accessibility is calculated to be 2.11, with a standard deviation of 1.38. Notably, Luhe, Lishui, and Gaochun have accessibility levels below the city-wide average. Although most of the districts exhibit relatively similar accessibility levels, some peripheral areas display unevenness.
Fig. 5.

Accessibility to general hospital by Gaussian 2SFCA in Nanjing.
Accessibility evaluation based on an improved potential model
Figure 6 shows the spatial accessibility to general healthcare facilities when is set to 1, 1.5, and 2, respectively. The results of the improved potential model calculations show that there are significant spatial differences in accessibility between population units. At the same time, there are still some certain patterns to be followed. When , the accessibility mean is 0.83 and the standard deviation is 1.19, 32% of the population units have accessibility above the mean, and 77.72% of the city’s total population is distributed within these population units. When , the accessibility mean is 0.91 and the standard deviation is 2.55, 25% of the population units with accessibility greater than the mean and 71.67% of the city’s total population are located in these population units. When , the accessibility mean is 0.93, the standard deviation is 4.71, with 15% of the population units with accessibility greater than the mean and 59.44% of the city’s total population distributed in these population units.
Fig. 6.

Accessibility to general hospital by improved potential model in Nanjing (a) β = 1. (b) β = 1.5. (c).
The distribution of medical services in Nanjing exhibits a clear circular pattern with varying levels of friction coefficients. The central city and sub-city centers have higher accessibility, forming a multi-core center-periphery arrangement. Table 3 shows that the level of the friction coefficient has almost no effect on the accessibility ranking. The district with the highest accessibility is Gulou, followed by Qinhuai or Yuhuatai. Jianye and Xuanwu districts have similar accessibility levels, while Luhe and Lishui districts have the lowest accessibility, below 0.6. Regardless of the friction coefficients, there is a clear two-stage differentiation in accessibility across all districts, indicating a significant spatial distribution imbalance. The districts can be broadly categorized into four echelons: excellent (Gulou, Qinhuai, and Yuhuatai districts); good (Xuanwu and Jianye districts); average (Qixia, Pukou, and Gaochun districts); and poor (Jiangning, Luhe, and Lishui districts).
Table 3.
Ranking of accessibility averages for different friction coefficients (sheets/thousand people).
| Ranking | = 1.0 | = 1.5 | = 2.0 | |||
|---|---|---|---|---|---|---|
| 1 | Gulou | 5.39 | Gulou | 8.32 | Gulou | 10.11 |
| 2 | Qinhuai | 3.42 | Qinhuai | 3.99 | Yuhuatai | 5.08 |
| 3 | Jianye | 2.48 | Yuhuatai | 3.57 | Qinhuai | 4.01 |
| 4 | Yuhuatai | 2.42 | Jianye | 2.87 | Jianye | 3.21 |
| 5 | Xuanwu | 2.39 | Xuanwu | 2.30 | Xuanwu | 1.88 |
| 6 | Qixia | 0.86 | Gaochun | 1.14 | Gaochun | 1.32 |
| 7 | Jiangning | 0.78 | Qixia | 0.85 | Qixia | 0.76 |
| 8 | Gaochun | 0.78 | Pukou | 0.73 | Pukou | 0.65 |
| 9 | Pukou | 0.77 | Jiangning | 0.72 | Jiangning | 0.60 |
| 10 | Luhe | 0.53 | Lishui | 0.58 | Lishui | 0.52 |
| 11 | Lishui | 0.50 | Luhe | 0.56 | Luhe | 0.52 |
Under the scenario with a frictional coefficient of β = 1.5, 68% of the city’s total population has access to more than 1 comprehensive hospital bed per 1,000 people (42% have access to more than 2 beds, and 15% have access to more than 5 beds). It is realistic to assume that approximately 70% of the population can obtain basic medical resources (one bed in a comprehensive hospital). Therefore, β = 1.5 is considered more appropriate for assessing the spatial accessibility in a metropolis. The following research is based on the scenario β = 1.5.
Identification of integrated healthcare shortage area (IHSA)
Spatial autocorrelation analyses were employed to gain insights into clustered or discrete spatial divergence features of accessibility. First, it is observed that the Moran’s I value is 0.28, with a z-score of 24.66 > 2.58, and a p-value of less than 0.01, indicating positive spatial correlation. This suggests that the accessibility in Nanjing demonstrates a significant aggregation effect rather than a random distribution. Secondly, the high/low clustering method was used to determine the spatial distribution of cold spots and hot spots. The outcomes of this analysis are presented in Fig. 7. Further, based on the data of the third national land survey in 2019, the average accessibility level for each street or town is aggregated according to their respective boundaries, and the results are displayed in Fig. 8.
Fig. 7.
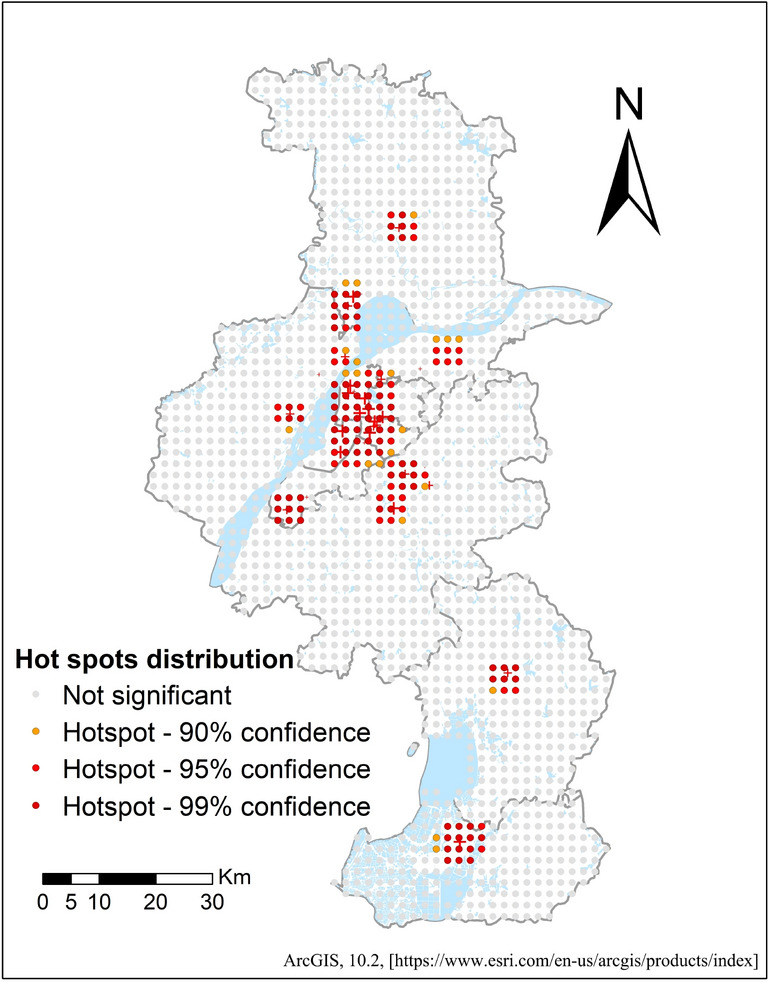
Distribution of hot spots.
Fig. 8.
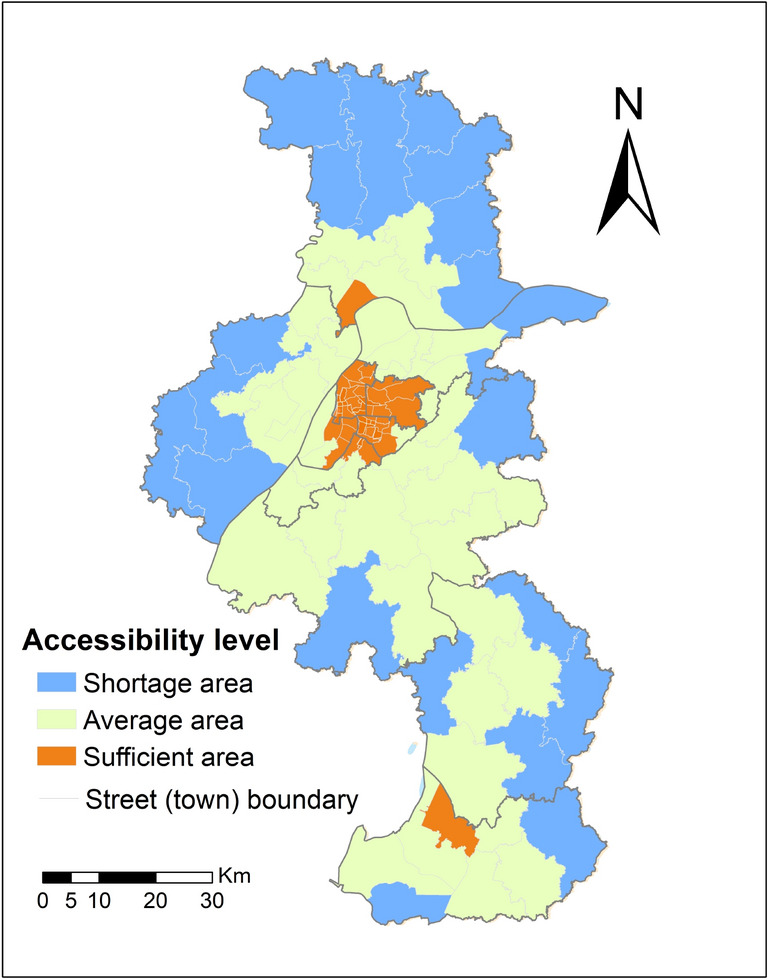
Accessibility levels (divided by streets/towns).
There are 158 hotspots, with approximately 9.70% of the areas being statistically significant hotspots. The hotspot areas are mainly concentrated in Gulou District, Xuanwu District, Jianye District, Qinhuai District, and the southwestern part of Yuhuatai District. Additionally, there are high-level clustering areas in parts of Pukou District along the river and along the border between Pukou District and Luhe District, which possess abundant and concentrated medical service resources. Overall, the spatial distribution of hotspot areas follows a star-like pattern centered on the six core main city districts, complemented by a dot-like distribution centered on densely populated areas in the other five districts.
Based on the mean accessibility values aggregated by street, the city’s streets are classified into three categories: shortage areas, average areas, and sufficient areas. Figure 8 illustrates that Luhe District has the highest number of IHSA, totaling seven, with a mean accessibility value of 3.14. Maan Street, Chengqiao Street, Hengliang Street, Jinniuhu Street, and Longbao Street in the north of Luhe District; Longtan Street and Xigang Street in the east of Qixia District; Yongning Street, Tangquan Street, Xingdian Street, and Qiaolin Street in the west of Pukou District; Hengxi Street and Tangshan Street on both sides of Jiangning District; Dongping Street in the eastern part of Lishui District; and Qixi Street in the eastern part of Gaochun District are considered IHSA. This suggests that residents in these streets generally experience longer travel times for medical care, indicating the need to improve their medical treatment.
Lack of general healthcare resources in rural areas
China’s long-standing dual system of urban and rural areas has potentially caused disparities in access to medical resources. The study uses nightlight data to delineate urban and rural areas. The results of the classification and the distribution of general hospitals are shown in Fig. 9.
Fig. 9.
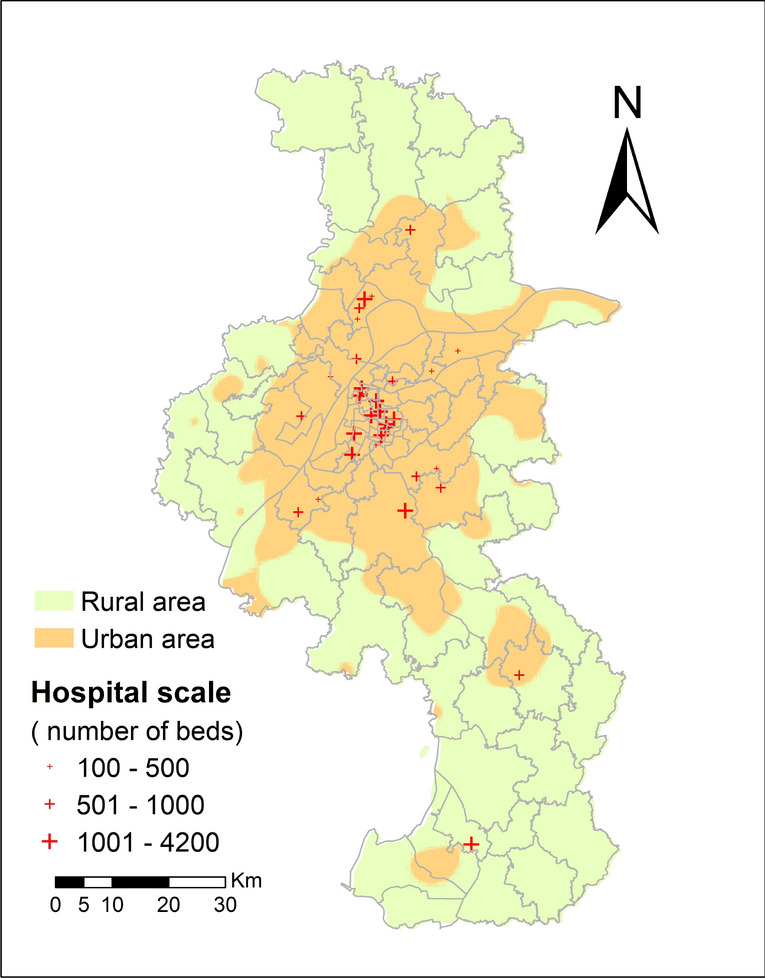
Nanjing urban–rural regional general hospital distribution map.
Figure 10 shows the accessibility level distribution in urban and rural areas of Nanjing. It reveals the overlap between IHSA and rural areas. More than half of the rural areas are classified as IHSA. This indicates a severe imbalance in the distribution of general hospital resources between urban and rural areas. The average accessibility score in urban areas is 3.11, whereas in rural areas it is only 0.46. Notably, the rural population accounts for 16.54% of the total population, but it only possesses 3.95% of the integrated healthcare resources. These results highlight the significant disparity in the accessibility of general hospitals between urban and rural areas.
Fig. 10.
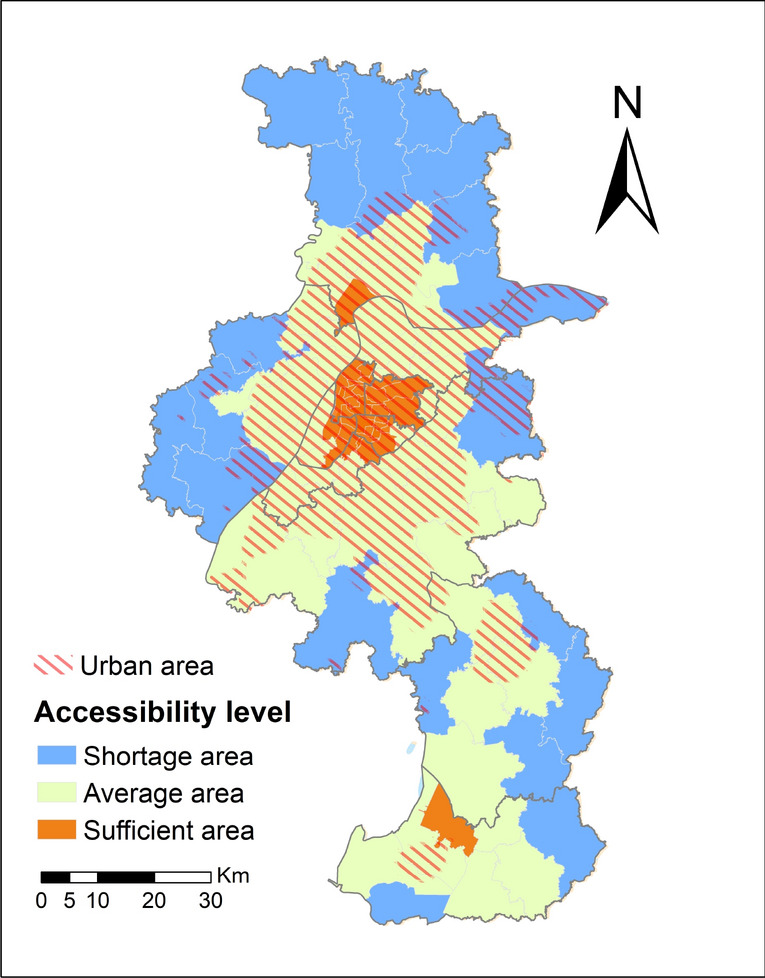
Distribution of accessibility levels in Nanjing urban–rural regions.
Discussion
Modelling spatial accessibility of metropolises in developing countries
In the improved potential model, higher distance friction coefficients widen the spatial variation in accessibility, resulting in higher accessibility in the areas near the hospital layout and an increase in the extent of areas with low accessibility values, which leads to a more discrete overall distribution. Conversely, the smaller the friction coefficient, the smoother the overall accessibility. The results of the study show that an improved potential model with a friction coefficient of 1.5 is the most appropriate method for assessing the accessibility of general hospitals in Nanjing. This result can be used as a reference for model selection when assessing spatial justice in public services in similar metropolises. Reggiani et al.54 calculated β values using regression analysis based on daily commuting flow data from residents of 439 regions in Germany. This method might be more appropriate, but the data costs are high and implementation is relatively difficult. This study adopts a multi-scenario analysis approach for parameter selection (1, 1.5, 2), which can provide a reference for parameter selection in accessibility calculations for facilities in developing countries. Furthermore, the Gaussian 2SFCA method overestimates the accessibility results for peripheral areas, which may be due to the slow rate of distance decay55. Differences in travel times for residents of different areas are influenced by the current structure of the transport system. The extent of this variation is not fully captured even when the Gaussian distance decay function is used.
Problems arising from spatial injustice in healthcare services
The pursuit of the Healthy China 2030 initiative has placed significant emphasis on the attainment of equitable and easily accessible distribution of healthcare resources, thereby playing a pivotal role in the pursuit of enhanced overall well-being. Nevertheless, empirical evidence indicates the existence of substantial discrepancies in the impartiality of comprehensive healthcare resources, both across various regions and between urban and rural areas. As one of China’s metropolises, Nanjing is representative of its population, city size, level of healthcare technology, economic development, and its ability to radiate to neighboring cities. Metropolises play the role of central hubs in their respective regions; they represent advanced healthcare resources and have the ability to influence multiple surrounding cities. Healthcare resource inequality can lead to additional problems, such as displacement of low-income communities from neighborhoods due to capitalization of high-quality healthcare resources in the real estate market56. Many patients and caregivers often reside near these hospitals to gain access to healthcare facilities, but these apartments often face issues like overloaded water and electricity facilities or overcrowding, making them unsafe22. Therefore, optimizing the transportation system and distributing healthcare resources may help address the disparities in healthcare resource supply between urban and rural areas in these cities47. Measures such as establishing comprehensive hospitals in urban sub-centers and districts, and increasing the density of high-grade roads, could be beneficial.
Policy implications
To narrow the gap in healthcare services between urban and rural areas and achieve spatial justice, this paper proposes the following suggestions. (1) Enhancing the public service capacity of county-level regions. Strengthen the construction of county-level medical centers and improve the medical standards at the county level. Establish a scientifically rational and well-distributed grid layout of medical resources. (2) Promoting online telemedicine partnerships between primary hospitals and higher-level general hospitals. Facilitate the downward extension of high-quality resources to primary healthcare institutions through online telemedicine. (3) Implementing bidirectional referral systems. Keep mild and common diseases at primary hospitals. Fully utilize primary healthcare resources, thereby reducing the waste of high-quality healthcare resources. Refer patients with severe, critical, and complex conditions to general hospitals. Accelerate the medical treatment process for critically ill patients in rural areas to reduce the time required for them to receive care. Alleviate the imbalance in the distribution of general healthcare resources between urban and rural areas.
Limitations and future research directions
The limitations of this study are as follows. Firstly, due to the constraints associated with data acquisition, this article fails to incorporate indicators such as the count of occupational (assistant) physicians, as well as the healthcare devices and equipment. Consequently, the measurement of healthcare resource scale solely utilizing the number of beds might introduce a bias. In future assessments of accessibility, it is imperative to encompass a multitude of indicators within the evaluation system. Secondly, the study treats residents in each residential unit as an ideal homogeneous group, disregarding factors such as age, gender, and other socio-economic attributes that may influence their healthcare service needs. In reality, residents with different attributes have varying requirements for healthcare services. To address this, future research should aim to analyze the accessibility needs of the population based on age, gender, and socio-economic attributes through the use of questionnaires. Finally, the disparities in comprehensive healthcare resources may stem from various factors. In urban areas, 17.69% are categorized as IHSA. However, the IHSA accounts for a staggering 59.16% of rural areas. Further analysis is needed to determine whether this inequity arises from facility distribution or transportation factors. In future research, we will consider residents’ health beliefs, diverse modes of transportation, healthcare insurance coverage, and economic conditions, to obtain effective solutions to reduce inequalities in healthcare in metropolises in developing countries.
Conclusions
Through continuous expansion, metropolises in developing countries have developed comprehensive transportation, healthcare, and education systems. However, the urban–rural gap persists. Achieving coordinated urban and rural development does not mean making urban and rural areas identical, but rather ensuring equal rights and equal access to services for residents in both areas. Like many metropolises in developing countries worldwide, Nanjing also faces the challenge of how to allocate urban and rural healthcare services to achieve spatial justice. This study evaluates the potential accessibility of general hospitals for residents in Nanjing using the Gaussian 2SFCA method and an improved potential model. The results reveal significant spatial disparities in hospital accessibility, which exhibits distinct clustering characteristics. The model’s parameter patterns indicate that an enhanced potential model with β = 1.5 is more suitable for Nanjing. Additionally, the study identifies IHSA and analyzes the urban–rural accessibility differences based on urban–rural boundaries delineated using nighttime light data. Nearly 60% of rural areas are IHSA. The findings provide valuable insights for improving the spatial justice of public infrastructure in metropolises in developing countries.
Supplementary Information
Author contributions
Xinyi Du: Conceptualization, Investigation, Formal analysis, Writing – Original Draft, Revising. Yating Du: Methodology, Validation, Revising. Yijia Zhang: Data Curation, Methodology, Resources. Yaqiu Zhu: Validation data, Revising. Yadong Yang: Writing—Review & Editing, Supervision.
Funding
Yadong Yang would like to acknowledge the financial support from National Natural Science Foundation of China (42271401) and Special funds for basic scientific research business of central public welfare research institutes (G2024-18–1, 1610132023015, G2024-01–17, GJ2024-18–4).
Data availability
The administrative boundary dataset is available at https://lbs.amap.com/. The 2020 gridded population data (1 km × 1 km) is available at https://hub.worldpop.org/geodata/listing?id=64. The China Geographic Information Resources Directory Service System’s 1:250,000 China Basic Geographic Database can be found at https://www.webmap.cn/main.do?method=index. The authors declare that the data supporting the findings of this study are available within the paper and its supplementary information files. Data related to townships comes from the Third National Land Survey by the Ministry of Natural Resources of China. The data cannot be shared publicly but are available upon request from the authors. To request data, please email the author, Xinyi Du (1124670018@qq.com). Restrictions apply to the availability of these data, which were used under license for the current study, and so are not publicly available.
Declarations
Competing interests
The authors declare no competing interests.
Footnotes
Publisher’s note
Springer Nature remains neutral with regard to jurisdictional claims in published maps and institutional affiliations.
Supplementary Information
The online version contains supplementary material available at 10.1038/s41598-024-74816-4.
References
- 1.Weiss, D. J. et al. Global maps of travel time to healthcare facilities. Nat. Med.10.1038/s41591-020-1059-1 (2020). [DOI] [PubMed] [Google Scholar]
- 2.Burger, R. & Christian, C. Access to health care in post-apartheid South Africa: availability, affordability, acceptability. Health Econ. Policy Law15, 43–55. 10.1017/S1744133118000300 (2020). [DOI] [PubMed] [Google Scholar]
- 3.Tao, Z. L., Cheng, Y. & Liu, J. X. Hierarchical two-step floating catchment area (2SFCA) method: measuring the spatial accessibility to hierarchical healthcare facilities in Shenzhen, China. Int. J. Equity Health10.1186/s12939-020-01280-7 (2020). [DOI] [PMC free article] [PubMed] [Google Scholar]
- 4.Boakye, J., Guidotti, R., Gardoni, P. & Murphy, C. The role of transportation infrastructure on the impact of natural hazards on communities. Reliab. Eng. Syst. Safe.10.1016/j.ress.2021.108184 (2022). [Google Scholar]
- 5.Lu, C., Zhang, Z. X. & Lan, X. T. Impact of China’s referral reform on the equity and spatial accessibility of healthcare resources: A case study of Beijing. Soc. Sci. Med.10.1016/j.socscimed.2019.112386 (2019). [DOI] [PubMed] [Google Scholar]
- 6.Liu, D., Kwan, M. P. & Kan, Z. H. Analyzing disparities in transit-based healthcare accessibility in the Chicago Metropolitan Area. Canad. Geographer-Geographe Canadien66, 248–262. 10.1111/cag.12708 (2022). [Google Scholar]
- 7.Jia, P. et al. Inequalities of spatial primary healthcare accessibility in China. Soc. Sci. Med.10.1016/j.socscimed.2022.115458 (2022). [DOI] [PubMed] [Google Scholar]
- 8.Lahariya, C. Health & wellness centers to strengthen primary health care in India: concept, progress and ways forward. Indian J. Pediatr.87, 916–929. 10.1007/s12098-020-03359-z (2020). [DOI] [PMC free article] [PubMed] [Google Scholar]
- 9.Ahmed, S. et al. Impact of the societal response to COVID-19 on access to healthcare for non-COVID-19 health issues in slum communities of Bangladesh, Kenya, Nigeria and Pakistan: results of pre-COVID and COVID-19 lockdown stakeholder engagements. BMJ Global Health10.1136/bmjgh-2020-003042 (2020). [DOI] [PMC free article] [PubMed] [Google Scholar]
- 10.Baxter, D. & Casady, C. B. Proactive and strategic healthcare public-private partnerships (PPPs) in the coronavirus (Covid-19) epoch. Sustainability10.3390/su12125097 (2020). [Google Scholar]
- 11.Park, J., Michels, A., Lyu, F., Han, S. Y. & Wang, S. W. Daily changes in spatial accessibility to ICU beds and their relationship with the case-fatality ratio of COVID-19 in the state of Texas, USA. Appl. Geogr.10.1016/j.apgeog.2023.102929 (2023). [DOI] [PMC free article] [PubMed] [Google Scholar]
- 12.Gu, Z. N., Luo, X. L., Tang, M. & Liu, X. M. Does the edge effect impact the healthcare equity? An examination of the equity in hospitals accessibility in the edge city in multi-scale. J. Transp. Geogr.10.1016/j.jtrangeo.2022.103513 (2023). [Google Scholar]
- 13.Contreras, D., Bhamidipati, S. & Wilkinson, S. Social vulnerability and spatial inequality in access to healthcare facilities: The case of the Santiago Metropolitan Region (RMS), Chile. Socio-Econ. Plann. Sci.10.1016/j.seps.2023.101735 (2023). [Google Scholar]
- 14.Kim, J. et al. Developing and evaluating transit-based healthcare accessibility in a low- and middle-income country: A case study in Ulaanbaatar, Mongolia. Habitat Int10.1016/j.habitatint.2022.102729 (2023). [Google Scholar]
- 15.Dumedah, G. et al. Characterizing the geography of potential healthcare accessibility in informal settlements in the Greater Kumasi area of Ghana. Afr. Geogr. Rev.42, 46–71. 10.1080/19376812.2021.1991811 (2023). [Google Scholar]
- 16.Chi, Z. & Han, H. Urban-rural differences: The impact of social support on the use of multiple healthcare services for older people. Front. Public Health10.3389/fpubh.2022.851616 (2022). [DOI] [PMC free article] [PubMed] [Google Scholar]
- 17.Sritart, H., Tuntiwong, K., Miyazaki, H. & Taertulakarn, S. Disparities in healthcare services and spatial assessments of mobile health clinics in the border regions of Thailand. Int. J. Environ. Res. Public Health10.3390/ijerph182010782 (2021). [DOI] [PMC free article] [PubMed] [Google Scholar]
- 18.Du, M. G. & Zhao, S. C. An equity evaluation on accessibility of primary healthcare facilities by using V2SFCA Method: Taking Fukuoka City, Japan, as a Case Study. Land10.3390/land11050640 (2022). [Google Scholar]
- 19.Guhlincozzi, A. R. Making visible the Chicagoland suburban healthcare landscape of latina women: a qualitative GIS approach. Soc. Cult. Geogr.25, 275–294. 10.1080/14649365.2022.2139857 (2024). [Google Scholar]
- 20.Dahab, R. & Sakellariou, D. Barriers to accessing maternal care in low income Countries in Africa: A systematic review. Int. J. Environ. Res Public Health10.3390/ijerph17124292 (2020). [DOI] [PMC free article] [PubMed] [Google Scholar]
- 21.Cheng, L., Yang, M., De Vos, J. & Witlox, F. Examining geographical accessibility to multi-tier hospital care services for the elderly: A focus on spatial equity. J. Transp. Health10.1016/j.jth.2020.100926 (2020). [Google Scholar]
- 22.Zhao, P. J., Li, S. X. & Liu, D. Unequable spatial accessibility to hospitals in developing megacities: New evidence from Beijing. Health Place10.1016/j.healthplace.2020.102406 (2020). [DOI] [PMC free article] [PubMed] [Google Scholar]
- 23.Liu, P. Y., Bai, X. & Ravenscroft, N. Counterurbanization, gentrification and the potential for rural revitalisation in China. Popul. Space Place10.1002/psp.2680 (2023). [Google Scholar]
- 24.Tao, Z. L. & Han, W. C. Assessing the impacts of hierarchical healthcare system on the accessibility and spatial equality of healthcare services in Shenzhen, China. ISPRS Int. J. Geo-Inform.10.3390/ijgi10090615 (2021). [Google Scholar]
- 25.Gong, S. Z. et al. Evaluating healthcare resource inequality in Beijing, China based on an improved spatial accessibility measurement. T Gis25, 1504–1521. 10.1111/tgis.12737 (2021). [Google Scholar]
- 26.Kazazi, A. K., Amiri, F., Rahmani, Y., Samouei, R. & Rabiei-Dastjerdi, H. A new hybrid model for mapping spatial accessibility to healthcare services using machine learning methods. Sustainability10.3390/su142114106 (2022). [Google Scholar]
- 27.Banke-Thomas, A., Wong, K. L. M., Ayomoh, F. I., Giwa-Ayedun, R. O. & Benova, L. “In cities, it’s not far, but it takes long”: comparing estimated and replicated travel times to reach life-saving obstetric care in Lagos, Nigeria. BMJ Global Health10.1136/bmjgh-2020-004318 (2021). [DOI] [PMC free article] [PubMed] [Google Scholar]
- 28.Tao, Z. L., Yao, Z. X., Kong, H., Duan, F. & Li, G. C. Spatial accessibility to healthcare services in Shenzhen, China: improving the multi-modal two-step floating catchment area method by estimating travel time via online map APIs. BMC Health Serv. Res.10.1186/s12913-018-3132-8 (2018). [DOI] [PMC free article] [PubMed] [Google Scholar]
- 29.Sabokbar, H. F., Mohammadi, H., Tahmasbi, S., Rafii, Y. & Hosseini, A. Measuring spatial accessibility and equity to healthcare services using fuzzy inference system. Appl. Geogr.10.1016/j.apgeog.2021.102584 (2021). [Google Scholar]
- 30.Majumder, S., Roy, S., Bose, A. & Chowdhury, I. R. Understanding regional disparities in healthcare quality and accessibility in West Bengal, India: A multivariate analysis. Reg. Sci. Policy Practice15, 1086–1113. 10.1111/rsp3.12607 (2023). [Google Scholar]
- 31.Dejen, A., Soni, S. & Semaw, F. Spatial accessibility analysis of healthcare service centers in Gamo Gofa Zone, Ethiopia through Geospatial technique. Remote Sens. Appl.-Soc. Environ.13, 466–473. 10.1016/j.rsase.2019.01.004 (2019). [Google Scholar]
- 32.Zafri, N. M., Nurullah, M., Neema, M. N. & Waliullah, M. Spatial accessibility to healthcare facilities in coastal region of Bangladesh. Int. J. Health Plann. Manage.36, 643–655. 10.1002/hpm.3107 (2021). [DOI] [PubMed] [Google Scholar]
- 33.Lee, S. Spatial and socioeconomic inequalities in accessibility to healthcare services in South Korea. Healthcare10.3390/healthcare10102049 (2022). [DOI] [PMC free article] [PubMed] [Google Scholar]
- 34.Chen, B. Y., Cheng, X. P., Kwan, M. P. & Schwanen, T. Evaluating spatial accessibility to healthcare services under travel time uncertainty: A reliability-based floating catchment area approach. J. Transp. Geogr.10.1016/j.jtrangeo.2020.102794 (2020). [Google Scholar]
- 35.Wang, J. Y. et al. Assessing the spatial accessibility of urban medical facilities in multi-level and multi-period scales based on web mapping API and an improved potential model. ISPRS Int. J. Geo-Inform.10.3390/ijgi11110545 (2022). [Google Scholar]
- 36.Li, J. G. et al. Spatiotemporal analysis of the relationship between urbanization and the eco-environment in the Kashgar metropolitan area, China. Ecol. Indic.10.1016/j.ecolind.2021.108524 (2022). [Google Scholar]
- 37.Zhang, S. Y., Song, X. Q. & Zhou, J. An equity and efficiency integrated grid-to-level 2SFCA approach: spatial accessibility of multilevel healthcare. Int. J. Equity Health10.1186/s12939-021-01553-9 (2021). [DOI] [PMC free article] [PubMed] [Google Scholar]
- 38.Tang, J. H., Chiu, Y. H., Chiang, P. H., Su, M. D. & Chan, T. C. A flow-based statistical model integrating spatial and nonspatial dimensions to measure healthcare access. Health Place47, 126–138. 10.1016/j.healthplace.2017.08.006 (2017). [DOI] [PubMed] [Google Scholar]
- 39.Ni, J. H., Liang, M., Lin, Y., Wu, Y. L. & Wang, C. Multi-mode two-step floating catchment area (2SFCA) method to measure the potential spatial accessibility of healthcare services. ISPRS Int. J. Geo-Inform.10.3390/ijgi8050236 (2019). [Google Scholar]
- 40.Khashoggi, B. F. & Murad, A. Use of 2SFCA method to identify and analyze spatial access disparities to healthcare in Jeddah, Saudi Arabia. Appl. Sci.-Basel10.3390/app11209537 (2021). [Google Scholar]
- 41.Fu, L., Wang, Y., Zeng, B., Mao, Y. & Gao, M. Spatial accessibility of medical facilities in Beibei district based on modified two-step floating catchment area method. J. Geo-Inform. Sci.21, 1565–1575 (2019). [Google Scholar]
- 42.Li, Y., Xie, Y., Sun, S. & Hu, L. Evaluation of park accessibility based on improved gaussian two-step floating catchment area method: A case study of Xi’an city. Buildings10.3390/buildings12070871 (2022). [Google Scholar]
- 43.Tong, D., Sun, Y. & Xie, M. Evaluation of green space accessibility based on improved Gaussian two-step floating catchment area method: A case study of Shenzhen City, China. Adv. Earth Sci.36, 1113–1126 (2021). [Google Scholar]
- 44.Guo, C. & Liang, J. Accessibility analysis of medical facilities based on multiple transportation modes of network map. J. Geo-Inform. Sci.24, 483–494 (2022). [Google Scholar]
- 45.Yang, N., Chen, S. Y., Hu, W. L., Wu, Z. G. & Chao, Y. Spatial distribution balance analysis of hospitals in Wuhan. Int. J. Environ. Res. Public Health10.3390/ijerph13100971 (2016). [DOI] [PMC free article] [PubMed] [Google Scholar]
- 46.Peeters, D. & Thomas, I. Distance predicting functions and applied location-allocation models. J. Geogr. Syst.2, 167–184. 10.1007/PL00011453 (2000). [Google Scholar]
- 47.Tao, Z. L. & Wang, Q. Facility or transport inequality? Decomposing healthcare accessibility inequality in Shenzhen, China. Int. J. Environ. Res. Public Health10.3390/ijerph19116897 (2022). [DOI] [PMC free article] [PubMed] [Google Scholar]
- 48.Liu, L. Y., Porr, A. & Miller, H. J. Realizable accessibility: evaluating the reliability of public transit accessibility using high-resolution real-time data. J. Geogr. Syst.25, 429–451. 10.1007/s10109-022-00382-w (2023). [DOI] [PMC free article] [PubMed] [Google Scholar]
- 49.Xiao, W. Y., Wei, Y. H. D. & Wan, N. Modeling job accessibility using online map data: An extended two-step floating catchment area method with multiple travel modes. J. Transp. Geogr.10.1016/j.jtrangeo.2021.103065 (2021). [Google Scholar]
- 50.Ma, X. Y. et al. Incorporating multiple travel modes into a floating catchment area framework to analyse patterns of accessibility to hierarchical healthcare facilities. J. Transp. Health10.1016/j.jth.2019.100675 (2019). [Google Scholar]
- 51.Cheng, G. et al. Spatial difference analysis for accessibility to high level hospitals based on travel time in Shenzhen, China. Habitat Int.53, 485–494. 10.1016/j.habitatint.2015.12.023 (2016). [Google Scholar]
- 52.Tao, Z. L., Cheng, Y., Zheng, Q. J. & Li, G. C. Measuring spatial accessibility to healthcare services with constraint of administrative boundary: a case study of Yanqing District, Beijing, China. Int. J. Equity. Health10.1186/s12939-018-0720-5 (2018). [DOI] [PMC free article] [PubMed] [Google Scholar]
- 53.Zhang Lixian, C. B. F. U. H. X. U. B. R. E. N. Z. G. P. (ed Center National Tibetan Plateau Data) (National Tibetan Plateau Data Center, 2021).
- 54.Reggiani, A., Bucci, P. & Russo, G. Accessibility and impedance forms: Empirical applications to the German commuting network. Int. Reg. Sci. Rev.34, 230–252. 10.1177/0160017610387296 (2010). [Google Scholar]
- 55.Wang, F. H. From 2SFCA to i2SFCA: Integration, derivation and validation. Int. J. Geogr. Inf. Sci.35, 628–638. 10.1080/13658816.2020.1811868 (2021). [DOI] [PMC free article] [PubMed] [Google Scholar]
- 56.Jones, P. & Lucas, K. The social consequences of transport decision-making: clarifying concepts, synthesising knowledge and assessing implications. J. Transp. Geogr.21, 4–16. 10.1016/j.jtrangeo.2012.01.012 (2012). [Google Scholar]
Associated Data
This section collects any data citations, data availability statements, or supplementary materials included in this article.
Supplementary Materials
Data Availability Statement
The administrative boundary dataset is available at https://lbs.amap.com/. The 2020 gridded population data (1 km × 1 km) is available at https://hub.worldpop.org/geodata/listing?id=64. The China Geographic Information Resources Directory Service System’s 1:250,000 China Basic Geographic Database can be found at https://www.webmap.cn/main.do?method=index. The authors declare that the data supporting the findings of this study are available within the paper and its supplementary information files. Data related to townships comes from the Third National Land Survey by the Ministry of Natural Resources of China. The data cannot be shared publicly but are available upon request from the authors. To request data, please email the author, Xinyi Du (1124670018@qq.com). Restrictions apply to the availability of these data, which were used under license for the current study, and so are not publicly available.