Abstract
The current study aimed to synthesize seven new metal coordination complexes (Q1–Q7) with potential biomedical applications. Novel mononuclear, polynuclear and mixed-ligand coordination compounds of the elements, cadmium(ii) and silver(i) derived from a pyridine containing ligand (2,4,6-tris-(2-pyridyl)-1,3,5-triazine (TPT)) have been synthesized successfully with the general formulae [Cd(TPT)Cl6]·H2O and [Agx(TPT)y(L)2(ClO4)](ClO4)z (x = 1,2,3, y = 1,2,3, L = PPh3 or phen, z = 1,2). The structural features were fully characterized using various spectroscopic techniques, such as infrared, ultraviolet-visible spectroscopy, 1D and 2D-NMR (1H, 13C, 31P, 1H–1H COSY and 1H–13C HSQCAD), CHN analysis, molar conductance (Λ), thermogravimetric analysis (TGA), and powder X-ray diffraction analysis. The structure of complex Q6 was also confirmed by single-crystal X-ray analysis. The luminescence and electrochemical properties of complexes, in solution, have been studied. X-ray crystallographic determination of the [Ag(TPT)(PPh3)2]ClO4·EtOH (Q6) complex shows that the Ag+ cation is bonded to one tridentate TPT ligand through NNN set of donor atoms and two triphenylphosphine ligands, giving the Ag+ a distorted trigonal bipyramidal geometry. X-ray powder diffraction analysis showed that metal complexes Q3, Q6 and Q7 display crystalline peaks. The complexes were evaluated for their in vitro antibacterial efficacy against various bacterial and fungal species. The in vitro efficacy against the MCF-7 human breast cancer cell line was assessed to determine the anticancer activities. The tri-nuclear silver complex Q3 shows great potential as a therapeutic candidate for treating breast cancer, since it exhibits a half-maximal inhibition concentration (IC50) of 13.45 ± 0.9 μM. Molecular docking simulations were also carried out to evaluate the interaction strength and properties of the metal complexes with selected cancer and bacteria relevant proteins namely cyclin-dependent kinase 2 (CDK2), cyclin-dependent kinase 6 (CDK6), signal transducer and activator of transcription 3 (STAT3), and beta-lactamases from Escherichia coli and Staphylococcus aureus.
Novel complexes of Cd(ii) and Ag(i) derived from TPT ligand have been synthesized. The silver complexes showed great potential as a therapeutic candidate for treating breast cancer.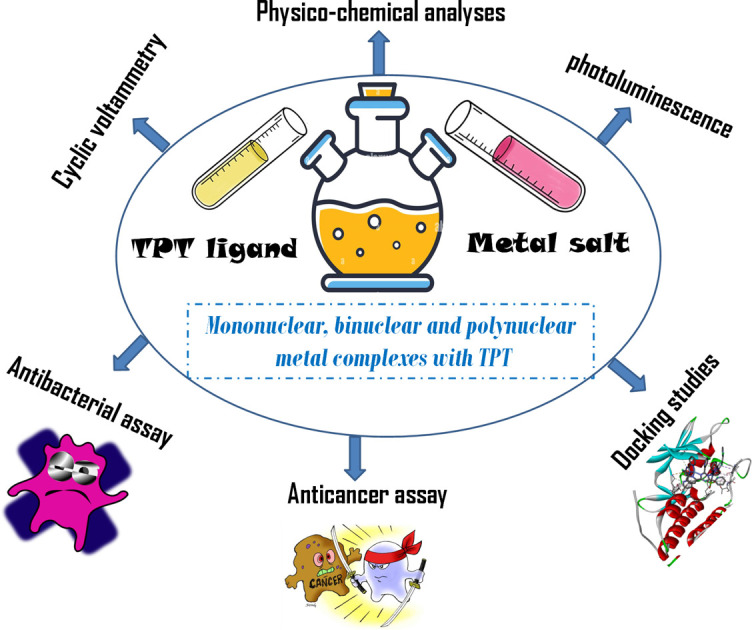
1. Introduction
Nowadays, transition metal complexes have gained considerable attention due to their structural, magnetic and electrochemical properties, as well as their potential use as models for biologically important species. Among their several biological functions, they show remarkable antifungal, antibacterial and antitumor activities.1–3 Recent research efforts have demonstrated the antibacterial and anticancer properties of several cadmium compounds.4–10 The Cd(ii) ion exhibits a strong attraction towards donor atoms such as sulfur and nitrogen. The coordination numbers commonly seen for Cd(ii) are four, five, and six due to its significant size.
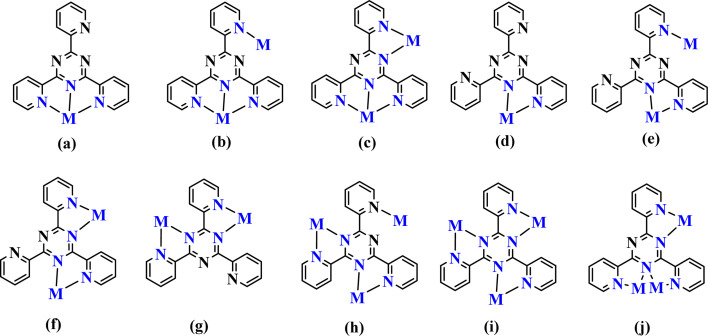
Silver(i), with an electronic configuration of [Kr] 4d10 5s1, has a diverse coordination chemistry with many geometries.11–13 The geometries of silver(i) complexes are often linear,14–16 triangular,17,18 T-shaped,14,19 tetrahedral,20,21 or square planar.14,22 Silver has the ability to form as well five to eight coordination numbers23–25 in some compounds, forming coordination polymers.26,27 The nitrogen atom has been identified as one of the most commonly utilized chelating atoms to Ag(i). It is typically present in polypyridyl ligands. TPT; 2,4,6-tris-(2-pyridyl)-1,3,5-triazine is a polypyridyl ligand that has been extensively researched. It has shown a broad range of coordination possibilities with the silver cation.28–35TPT is an appealing polydentate ligand with N atoms, capable of bridging metal ions through a bidentate site for chelation and an exo N-donor site for bridging.36 The TPT ligand has the capability to form mononuclear, dinuclear, and polynuclear complexes,28–36 as demonstrated in Scheme 1.
Scheme 1. The known coordination modes of TPT complexes.28–36.
The ability to adjust the chelation environment around the Ag(i) cation has facilitated the creation of very effective Ag compounds for medical purposes.37–45 Silver(i) complexes that have a greater propensity for ligand substitution by biological ligands, namely sulfur-containing compounds, have strong antibacterial properties. Consequently, it is logical to infer that complexes containing weak metal–ligand connections, specifically Ag–N and Ag–O bonds, would have a wider spectrum of antimicrobial activity compared to complexes with Ag–S and Ag–P links. The latter have been found to have little or no effect against bacteria, molds, and yeast.46–49 Silver compounds have gained significant attention in recent years as promising candidates for anticancer therapies. These complexes have shown effective activity against different types of cancer cells in numerous studies.50–52 The utilization of TPT in conjunction with Cd(ii) and Ag(i) ions yields the creation of complexes possessing a wide-ranging activity in terms of biological properties.
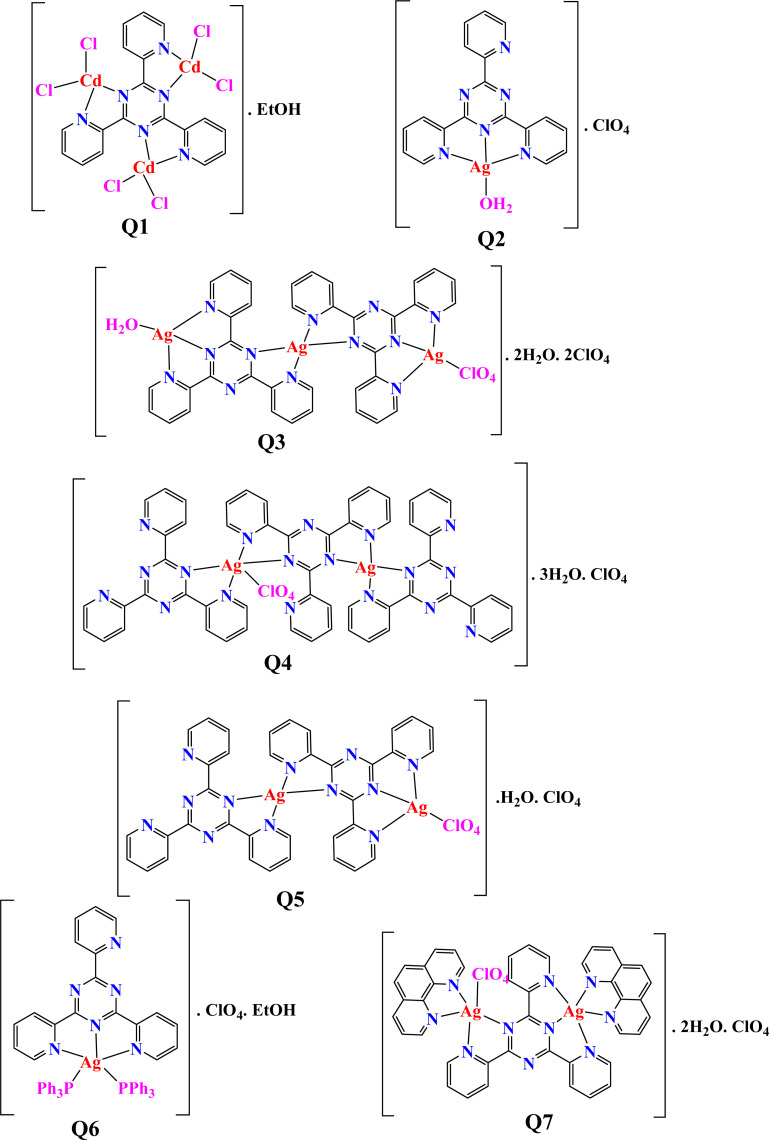
Many metal complexes possess both anti-microbial and cytotoxic properties, our study specifically aims to investigate this relationship in silver and cadmium complexes. We believe a deeper understanding of this connection can offer valuable insights for developing targeted anti-cancer drugs with minimal side effects. The link between antimicrobial and anticancer activities is a fascinating and evolving area of research.53 Some antimicrobial agents, particularly those targeting cell membranes, might have unintended consequences on cancer cells.54,55 Cancer cells often have rapid growth and altered membrane compositions, making them more susceptible to disruption by these agents. Therefore, the objective of this study was to focus on the synthesis, characterization, and biological investigations of cadmium and silver compounds of the TPT ligand. The title ligand can exhibit various coordination modes and accommodate varied numbers of metal centers. As a result, the properties of the resultant compounds may be influenced. In this context, we present the preparation of a new set of Cd(ii) and Ag(i) compounds. Our synthesized complexes in ethanol and at different ratios of reactants consist of mononuclear, polynuclear, and mixed ligand structures (Scheme 2). The main and/or primary chelating agent used is TPT, while the secondary chelating agents employed are triphenylphosphine (PPh3) and 1,10-phenanthroline (phen). The choice of PPh3 and phen as co-ligands is based on their electron-conjugated heterocyclic aromatic properties, which provide them a greater capacity to coordinate due to their N- or P- donor chelation nature, resulting in the formation of stable complexes. The CHN analysis, IR spectroscopy, molar conductivity tests, single-crystal X-ray diffraction examinations, and 1D and 2D-NMR techniques (including 1H, 13C, 31P, 1H–1H COSY, and 1H–13C HSQCAD) were used to completely characterize the structure, stoichiometry, and geometry of the produced compounds. Additionally, thermal degradation measurements were performed. Furthermore, the article delves into the examination of the photoluminescence and electrochemical characteristics of metal complexes. The antibacterial activity of the compounds (Q1–Q7) was assessed against various bacterial and fungal species. Furthermore, we examined the harmful effects of the analyzed complexes (Q1–Q7) on MCF-7, a type of breast cancer that is highly prevalent and a leading cause of mortality in women.
Scheme 2. Structures of the prepared TPT complexes.
2. Results and discussion
2.1. General aspects
The crystals and solid silver complexes remain air stable when preserved in darkness at ambient temperature. Complexes Q1–Q7 exhibit solubility in MeCN, CHCl3, CH2Cl2, DMSO and DMF. Molar conductivity measurements and 1H-NMR spectroscopy were used to investigate the complexes' solution stability over a 24 hours period in conditions that are relevant to biology, as these complexes are not soluble in water. The difference between the molar conductivity values in DMSO varied between 0.5 and 0.9 Ω−1 cm2 mol−1, with no notable differences detected. The stability of the compounds was assessed by comparing the 1H NMR spectra obtained in DMSO-d6 at 0 hours and 24 hours (Fig. S1–S7†). The 1H NMR spectra indicated that the compounds maintained their integrity for the entire 24 hours duration, implying that the stability of the compounds is unaffected by the DMSO solvent. The conductance measurements, recorded for 10−3 M solutions of the metal complexes in DMSO. The values of the complexes Q2–Q7 were determined to fall within the range of 36–64 Ω−1 cm2 mol−1, which suggests their electrolytic character.56–60 The cadmium complex Q1 has a comparatively low electrical conductivity of 23.8 Ω−1 cm2 mol−1, indicating that it is non-electrolytic nature.56–60 The test of chloride by silver nitrate to clarify the presence of chloride (out or inside the coordination) supports our results because the test showed that no white precipitate (AgCl) has been formed indicating the coordination of all of the chloride ions to cadmium ion in complex Q1.
2.2. Characterization of metal complexes Q1–Q7
2.2.1. Vibrational spectra
Several noteworthy findings were uncovered by a comparison of the IR spectra of the metal complexes (Fig. S8–S15†) with those of the free TPT.61,62 The infrared spectra exhibit a wide range of frequencies between 3200 and 3500 cm−1, which correspond to the anti-symmetric and symmetric stretching of the OH bond. Furthermore, there is a prominent peak observed at around 1600–1640 cm−1, which is ascribed to the bending motion of the H–O–H bond.63 The complexes have peaks in the spectrum range of 3100–2900 cm−1, suggesting the existence of the TPT ligand's aromatic C–H stretching vibrations. Additionally, peaks in the range of 770–778 cm−1 suggest the presence of aromatic C–H deformation vibrations.61–63 The C N and C C bonds exhibit stretching vibrations within the range of 1600–1550 cm−1, whereas the C–C and C–N bonds display vibrations within the range of 1477–1217 cm−1.61–63 The metal complexes demonstrate both downward and upward (C N) variations, which can be ascribed to the movement of the electron density of the imine nitrogen lone pair towards the metal atom.61–63 This suggests that there are interactions occurring between the core metal atoms and the TPT ligand via the nitrogen atom of the imine group.61–63 The spectra displayed new bands of moderate strength in the 412–449 and 516–580 cm−1 ranges, which correspond to the vibrations of M–N and M–O, respectively.63,64 The silver complex Q6 displayed a distinct peak at 1377 cm-1 in its spectra, as well as a less pronounced peak at 1159 cm−1. The presence of coordinated PPh3 in the complex48,49 is indicated by these bands, which are referred to as the ν(P-CPh) band. The band observed at around 490 cm−1 was attributed to the vibrational mode of the M–P bond.65 The perchlorate complexes Q2–Q7, which include silver, have a broad peak at 1090–1103 cm−1 (ν3) and a prominent peak at 621–625 cm−1 (ν4). The bands observed correspond to the stretching vibration of the ClO4 ion within the complex.66,67 The FTIR spectrum of compound Q7 displays four distinct peaks, providing confirmation of the presence of the 1,10-phenanthroline ligand. More precisely, the vibrations that occur when the C N and C C double bonds stretch are detected at frequencies of 1621 and 1587 cm−1, respectively. Furthermore, a peak that corresponds to the vibrations of the skeletal structure is detected at 1574 cm−1, whereas the bending oscillations of the C–H bond in a direction perpendicular to the plane are identified at 725 cm−1.63
2.2.2. Thermogravimetric analysis
The thermogram of [Cd3(TPT)Cl6]·EtOH (Q1) (Fig. S16†) exhibits three distinct stages within the temperature range of 26–396, 396–565, and 565–685 °C region. Their respective stages involve the removal of the following compounds: EtOH molecule + Cl2 (calculated 12.9, found 12.9%), 2Cl2 + 2HCN + 2H2 + ½N2 (calculated 23.5, found 23.6%) and fragments of {C16H6 and Cd3N3 residue species} (calculated 63.6, found 63.6%). In this study, we aimed to characterize silver complexes using Thermogravimetric Analysis (TGA). However, due to safety concerns associated with the use of silver perchlorate, which is known to be explosive under certain conditions, we were unable to perform TGA measurements directly on the silver complexes.
2.2.3. NMR spectra
The TPT ligand's 1H-NMR and 13C-NMR spectra were recorded in DMSO-d6 (Fig. S17 and S25†). Furthermore, 1H NMR, 13C NMR and gCOSY spectra (Fig. S18–S24, S26–S32 and S33–S38,† respectively) for complexes Q1–Q7 were recorded in DMSO-d6. The chemical shifts and their assignments are given in Tables S1 and S2.† The spectral data indicates that the organic component of the TPT moiety in the Q1–Q7 complexes matches its expected structure. Additionally, there are no notable changes in the chemical shifts upon complexation with TPT. However, new peaks are observed in complexes Q6 and Q7, which can be attributed to the presence of triphenylphosphine and 1,10-phenanthroline ligands, respectively. These findings can be attributed to the involvement of C N groups in various processes. These procedures involve the alignment of these groups with cadmium and silver cations, the breakdown of robust hydrogen bonds among the unattached ligand molecules, and the creation of hydrogen bonds that engage the unbound C N groups from one of the ligands. The 1H NMR spectra of TPT and the corresponding metal complexes associated to the pyridyl rings display two triplets signals for the protons H(4) and H(3) at δ = 7.67–8.22 and two doublets peaks for the protons H(2) and H(1) at δ = 8.64–8.99 ppm. The spectra of the cadmium complex Q1 exhibited broad or undetectable signals, possibly resulting from the complex's exceptionally low solubility. The distinct peaks corresponding to the aromatic hydrogens in the triphenylphosphine (PPh3) ligand were seen in compound Q6. The appearance of extra aromatic protons at δ = 7.33–7.59 ppm in complex Q6 indicated the coordination of the triphenylphosphine ligand. Additionally, the aromatic carbons of two PPh3 were seen at 128.73–133.46 ppm. The 31P NMR spectra (Fig. S39†) of the complex exhibited a single distinct signal at 25.56 ppm, referring to two chemically equivalent PPh3 ligands,68–70 which were confirmed by single-crystal X-ray structural analyses (the bond lengths of Ag(1)–P(1) and Ag(1)–P(2) are 2.4757(6) Å, 2.4715(6) Å, respectively). The presence of phenanthroline in compound Q7 was verified using 1H and 13C-NMR spectroscopy (Fig. S24 and S32†). Additionally, there are four resonances in the proton spectrum, located at around 9.12, 8.78, 8.23, and 8.01 ppm. Doublets were detected and assigned to the HA and HB protons, respectively, at the highest resonances of 9.12 and 8.79 ppm. It was determined that the 8.01 ppm resonance, which displayed a quartet pattern, was caused by HD proton. Ultimately, the 8.23 ppm resonance was finally determined to be a singlet and associated with the HC proton. The original proton assignments, determined by considering multiplicity and chemical shift, were subsequently validated using a COSY experiment (Fig. S38†). This experiment was employed to establish the connections between the ring's protons. At certain chemical shifts of 151.30, 141.93, 138.78, 129.01, 127.25, and 125.31 ppm, the carbon spectrum showed six aromatic signals that corresponded to CA, CB, CC, CD, CE, and CF carbons, respectively. The assignment of the CA, CC, CE, and CF carbons was accomplished by utilizing a 1H–13C HSQCAD experiment (Fig. S40†). So far, only the carbons from CB and CD have not been assigned. Resonances at 141.93 and 129.01 were respectively ascribed to CB and CD, according to the chemical shift.
2.2.4. Electronic spectra
When ligands formed chelates with metal ions, it caused notable shifts in the electronic properties of the system (Fig. S41†). The spectra of complexes exhibit a red shift in the n → π* transition, namely in the range of 315 nm to 324 nm. This shift is caused by the coordination between the cadmium or silver ions and the C N groups.71 The appearance of additional bands at a wavelength of 390 nm in the silver complexes mainly assigned to metal-to-ligand charge transfer (MLCT) transitions involving Ag and TPT or phen ligands.72,73 Clearly, the maximum intensity rises as the silver ratio in the complex composition increases. In addition, a supplementary band is seen at around 455 nm in compound Q6 that contains triphenylphosphine (PPh3). This band is possibly attributed to MLCT and ILCT (intraligand) transitions.72,73
2.2.5. Luminescence spectra
Luminescent complexes are highly important in the visualization of biological processes and the identification of significant molecules inside living systems. The TPT ligand has great promise in the development of luminous complexes because of its robust luminescence, adjustable characteristics, and potential for biocompatibility.30,32,74–77 The luminescent properties of both the TPT ligand62 and complexes Q1–Q7 were examined in DMSO. Fig. S42† shows that when excited at 200 nm, the TPT ligand emitted a wide emission at approximately 543.97 nm, as reported in our previous study.62 The highest intensity of emission bands were observed at wavelengths of 485 nm and 452 nm. Due to the striking resemblance in the locations and characteristics of the emission peaks in the TPT and the Q1–Q7 complexes, the observed emission in these complexes can be explained as intra-ligand n–π* and π–π* transitions within the 1,3,5-triazine derivative.
2.2.6. Cyclic voltammetry
In the voltammograms of the silver complexes Q5–Q7 (Fig. S43–S45†), one oxidation peak (Ia) at 396, 379 and 550 mV, respectively, was coupled to a broad reduction peak (Ic) at −384, −389 and −370 mV. The presence of these peaks suggests the involvement of the Ag(i)/silver(ii) system in a quasi-reversible process, with a ΔEp of 920–768 mV and the ratio of the faradaic oxidation current to that of the reduction current deviates from unity, i.e. Ianode/Icathode < 1 (−0.60, −0.58 and −0.98 for Q5, Q6 and Q7, respectively).78–82
2.2.7. X-ray diffraction
The crystallinity of the both TPT ligand54 and its complexes Q3, Q6, and Q7 were evaluated using the X-ray diffractograms. XRD diffraction patterns of the compounds were presented in Fig. S46.† The precise diffraction data, including the angle (2θ), interplanar spacing (d value, Angstrom), and relative intensity (%), are consolidated in Table S3.† All compounds exhibited sharp peaks in their XRD patterns, indicating their crystalline nature.
2.2.8. X-ray crystallography
2.2.8.1. SC-XRD description of complex Q6
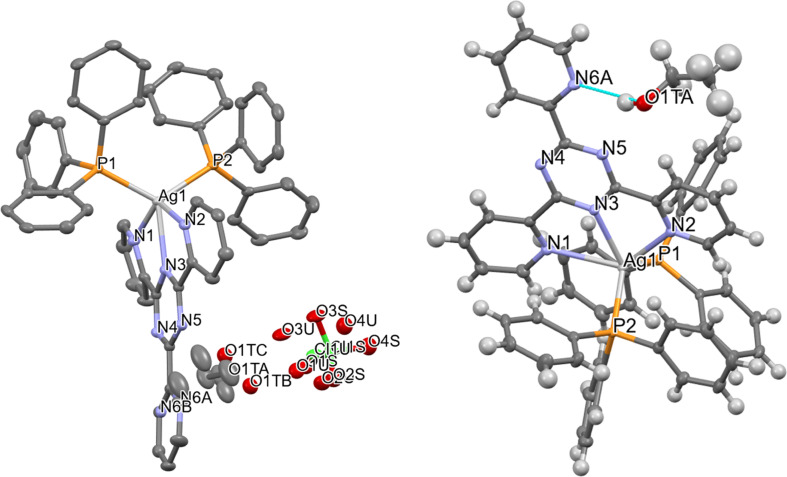
The SC-XRD technique is used to identify the crystal structure of complex Q6. Table S4† presents empirical data. The X-ray evaluation indicates that the target molecule formed crystals in the triclinic space group P1̄. The asymmetric unit consists of one Ag+ complex, one ClO4− counter ion, and one disordered ethanol solvent molecule, as shown in Fig. 1. The Ag+ ion is coordinated with three nitrogen atoms (N1, N2, and N3) from the TPT ligand and two phosphorus atoms (P1, P2) from triphenylphosphine. This coordination results in a distorted trigonal bipyramidal shape. The bond length between Ag(1) and N(3) is 2.419(18) Å, which is comparable to the bond lengths reported in previous studies.28–35 The bond distances between Ag(1) and N(1) and between Ag(1) and N(2) are 2.711 (2) Å and 2.572 (19) Å, respectively. These distances are slightly greater than the typical Ag–N bond length, suggesting a weak contact between Ag1 and N1 and N2 atoms.28–35 The lengths of the Ag(1)–P(1) and Ag(1)–P(2) bonds are 2.4757(6) and 2.4715(6) angstroms, respectively. The bond angles involving the silver(i) ions, specifically N(3)–Ag(1)–P(2), N(3)–Ag(1)–P(1), P(2)–Ag(1)–P(1), N(3)–Ag(1)–N(2), P(2)–Ag(1)–N(2), P(1)–Ag(1)–N(2), N(3)–Ag(1)–N(1), P(2)–Ag(1)–N(1), P(1)–Ag(1)–N(1), and N(2)–Ag(1)–N(1), fall within the approximate range of 64.63(6)–130.62(6) degrees. These angles correspond to a strongly distorted trigonal bipyramidal geometry. The PPh3 ligands are responsible for the deformation of the trigonal bipyramidal geometry. The bond lengths and bond angles that have been chosen are compiled in Tables S5 and S6.†
Fig. 1. Molecular structure of Q6, shown with 50% probability displacement ellipsoids and the selected atom-numbering scheme (left), hydrogen bonding connecting the molecule (right).
Two independent locations adequately characterized the ClO4− counter ion, which exhibited positional disorder. The ethanol solvent molecule exhibited positional disorder as well and was adequately represented over three distinct locations. As illustrated in Fig. 1, the alcohol group establishes a hydrogen bond with the N6 atom from the TPT ligand in the Ag+ complex in the first and primary location, which occupies about 75% of the space. Table S7† lists the hydrogen bonds. The disarray in the ethanol group is probably caused by the disarray in the TPT ligand. Since the N6 atom can only form hydrogen bonds with the ethanol about 64% of the time, the ethanol molecule can freely rotate to different positions the other 36% of the time, and it looks like it does so about 25% of the time.
2.3. Evaluation of biological activity
2.3.1. In Vitro anticancer activity
The newly synthesized complexes were assessed for cytotoxicity utilizing the MTT test. In this investigation, doxorubicin was employed as a benchmark medicine for the purpose of comparison. The drug concentrations were graphed against cell viability to determine the IC50 (μM) (Fig. S47†), which represents the concentration needed to inhibit 50% of cell viability. Table S8† displays the cytotoxicity of the recently created complexes against the MCF-7 cell line in a laboratory setting. Certain compounds shown noteworthy activity in comparison to doxorubicin. The trinuclear silver complex Q3 exhibited high cytotoxic potency (IC50 = 13.45 μM) comparing to the other synthesized complexes. Complexes Q1, Q5, and Q7 exhibited moderate activity, with IC50 values of 38.35 μM, 46.60 μM, and 22.54 μM, respectively, when compared to doxorubicin. Complexes Q2, Q4, and Q6 exhibited low activity with IC50 values of 51.71 μM, 80.95 μM, and 74.80 μM, respectively, in comparison to doxorubicin. The phosphine complex Q6 exhibited significantly higher activity compared to the bis-chelated complex Q4 due to the lipophilic nature of triphenylphosphine, which facilitated their passage across the cytoplasmic membrane.37 Furthermore, the potential toxicity of the compounds was evaluated by conducting an MTT experiment on MCF-10A cells, a normal cell line. The results of our study indicate that the compounds shown low cytotoxicity towards normal cells when used at quantities that were effective against cancer cells. Notably, all complexes showed minimal toxicity towards normal MCF-10A breast cells, with an IC50 value greater than 100 μM as tabulated in Table S8.†
2.3.2. Antibacterial activity
The biological properties of the complexes were compared to those of reference compounds in order to determine how the coordinated metal ion, metal to ligand ratio, and co-ligand presence affected the complexes' antibacterial activity. The antibacterial effectiveness was evaluated using ciprofloxacin and colitrimazole as benchmark drugs. In order to increase the probability of discovering antibiotic characteristics in the examined compounds, the antibacterial activity of complexes Q1–Q7 was evaluated using multiple test organisms. Staphylococcus aureus and Escherichia coli, two types of Gram-positive and Gram-negative bacteria, were used to investigate the antibacterial activity. The antifungal effects of the compounds were tested against Candida albicans. To measure the antibacterial activity, the inhibitory zone diameter was measured in millimetres, as shown in Table S9.† All of the complexes investigated showed a broad spectrum of antibacterial action, according to the inhibition zone diameter data (Table S9†). When tested against Candida albicans, the results showed that Q3, Q7, and Q1 were the most successful (77.8%, 70.4%, and 55.5% of the time, respectively). Complex Q4 exhibited weak antibacterial action against Gram-positive Staphylococcus aureus and Candida albicans, but no effect against Gram-negative Escherichia coli at the doses that were tested.
2.4. Molecular docking study
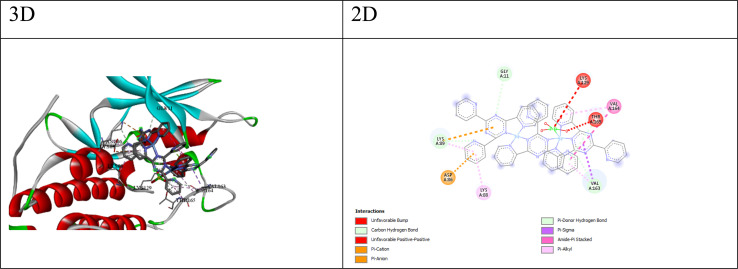
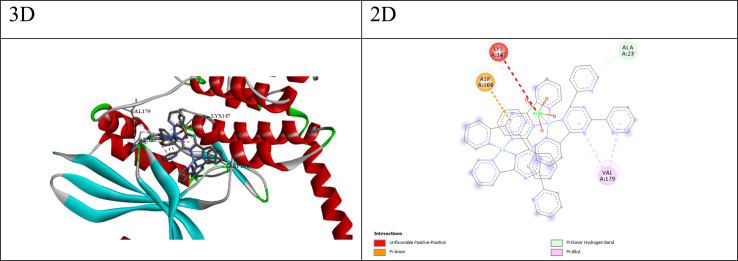
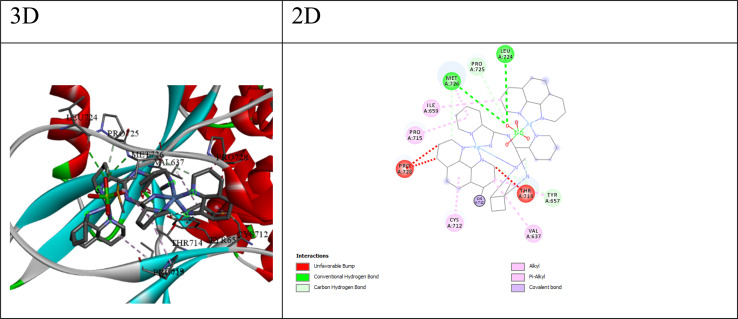
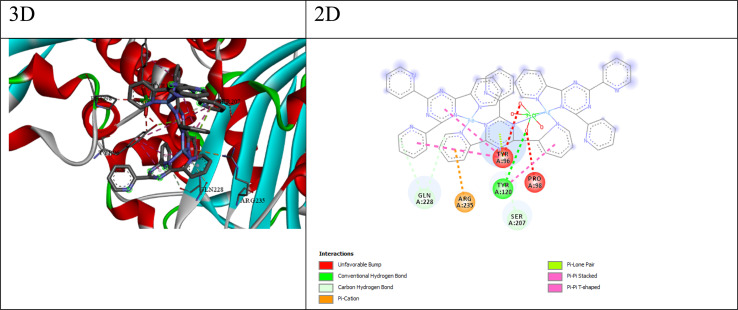
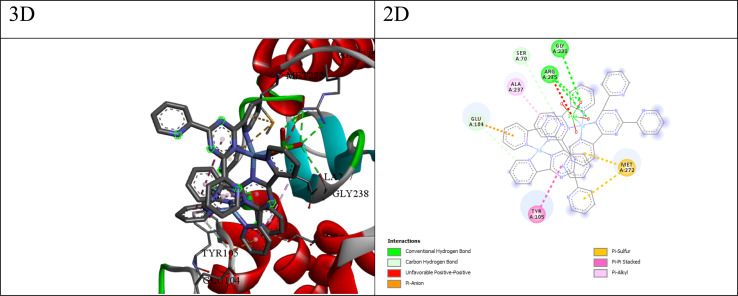
Implementing the MOE module, the docking process was executed between compounds Q1–Q7 and target proteins: cyclin-dependent kinase 2 (CDK2, UniProt: Q63699), cyclin-dependent kinase 6 (CDK6, UniProt: F1MA87), signal transducer and activator of transcription 3 (STAT3, UniProt: P52631), and beta-lactamases from Escherichia coli (PDB: 4OQG) and Staphylococcus aureus (UniProt: Q7BWD2). Findings from the molecular docking study are presented in Tables S10–S19.† The 2D/3D interaction of compounds and the proteins are presented in Fig. 2–6. Based on the molecular docking results, we can analyze the potential binding affinities of the compounds against various targets. The HDOCK scores represent the docking scores, while the ΔG values represent the predicted binding free energies (in kcal mol−1) obtained from the Prodigy server.
Fig. 2. 3D and 2D interaction between CDK2 and compound Q4.
Fig. 3. 3D and 2D interaction between CDK6 and compound Q4.
Fig. 4. 3D and 2D interaction between STAT3 and compound Q7.
Fig. 5. 3D and 2D interaction between β-lactamases s.auerus and compound Q4.
Fig. 6. 3D and 2D interaction between E. coli and compound Q4.
2.4.1. Docking studies with CDK2 and CDK6 proteins
For CDK2 and CDK6, which are cyclin-dependent kinases involved in cell cycle regulation, the docking scores and ΔG values suggest that some compounds have favorable binding affinities. Compounds Q3 and Q4 exhibit the lowest (most favorable) HDOCK scores and ΔG values for both CDK2 and CDK6, indicating their potential as inhibitors of these kinases. The best cpmpound for CDK2 appears to be compound Q4, with a docking score of −137.08 and a binding free energy (ΔG) of −5.13. The interactions between compound Q4 and CDK2 (as shown in Fig. 2) include; (a) carbon–hydrogen bonds: These involve interactions between the ligand and the backbone atoms of residues like GLY11, LYS89, and VAL163. Carbon–hydrogen bonds can contribute to binding affinity and specificity. (b) π–Cation interaction: the ligand forms a π–Cation interaction with the NZ atom of LYS89, suggesting an electrostatic attraction between the positively charged lysine side chain and the ligand's aromatic system. (c) π–Anion interaction: the ligand forms a π–anion interaction with the OD1 atom of ASP86, indicating an electrostatic attraction between the negatively charged aspartic acid side chain and the ligand's aromatic system. (d) π–Donor hydrogen bond: the ligand forms a hydrogen bond with the OG1 atom of THR165, involving the π electrons of the ligand as hydrogen bond acceptors. (e) Hydrophobic interactions: the ligand participates in π–sigma, amide–π stacked, and π–alkyl interactions with nearby hydrophobic residues like VAL163, VAL164, LYS88, and LYS89, suggesting favorable hydrophobic contacts. These interactions suggest that compound Q4 likely exhibits good binding affinity and complementarity with the CDK2 binding site through a combination of hydrogen bonding, electrostatic interactions, and hydrophobic contacts.
While, the best compound for CDK6 appears to be compound Q3, with a docking score of −149.39 and a binding free energy (ΔG) of −5.15. The interactions between compound 3 and CDK6 (as shown in Fig. 3) include; (a) π–anion interaction: the ligand forms a π–anion interaction with the OD2 atom of ASP104, indicating an electrostatic attraction between the negatively charged aspartic acid side chain and the ligand's aromatic system. (b) π–Donor hydrogen bond: the ligand forms a hydrogen bond with the N atom of ALA23, involving the π electrons of the ligand as hydrogen bond acceptors. (c) Hydrophobic interactions: the ligand participates in π–alkyl interactions with nearby hydrophobic residues like VAL179 and ALA23, suggesting favorable hydrophobic contacts. (d) The π–anion and π–donor hydrogen bond interactions suggest that compound 3 can form favorable electrostatic and hydrogen bonding interactions with the CDK6 binding site, while the hydrophobic interactions contribute to the overall binding affinity.
2.4.2. Docking studies with STAT3 protein
STAT3 (Signal Transducer and Activator of Transcription 3) is a transcription factor involved in various cellular processes, including cell growth, survival, and inflammation. For STAT3, compound Q7 shows the lowest HDOCK score (−138.64) and a relatively low ΔG value (−5.52 kcal mol−1), suggesting its potential as a STAT3 inhibitor. The best ligand for STAT3 appears to be compound 7, with a docking score of −138.64 and a binding free energy (ΔG) of −5.52. The interactions between compound 7 and STAT3 (as shown in Fig. 4) include; (a) conventional hydrogen bonds: the ligand forms hydrogen bonds with the N atom of MET726 and the O atom of LEU724, suggesting the potential for favorable polar interactions. (b) Carbon–hydrogen bonds: the ligand forms carbon–hydrogen bonds with the CA atom of PRO725, the OG1 atom of THR714, the OH atom of TYR657, and the O atom of MET726, contributing to the overall binding affinity. (c) Hydrophobic interactions: The ligand participates in alkyl and π–alkyl interactions with nearby hydrophobic residues like VAL637, CYS712, PRO715, MET726, ILE659, and TYR657, suggesting favorable hydrophobic contacts. The combination of hydrogen bonding, carbon–hydrogen bonding, and hydrophobic interactions suggests that compound Q7 can engage in a variety of favorable interactions with the STAT3 binding site, potentially leading to high binding affinity and specificity.
2.4.3. Docking studies with β-lactamases (S. aureus and E. coli) proteins
β-Lactamases are enzymes produced by certain bacteria, such as Staphylococcus aureus and Escherichia coli, which confer resistance to β-lactam antibiotics. For S. aureus β-lactamase, compound Q3 exhibits the lowest HDOCK score (−247.43) and a relatively low ΔG value (−5.09 kcal mol−1), indicating its potential as an inhibitor. Similarly, for E. coli β-lactamase, compound Q3 shows the lowest HDOCK score (−204.45) and a favorable ΔG value (−5.26 kcal mol−1), suggesting its potential as an inhibitor. The interactions between compound Q3 and the β-Lactamase S. aureus receptor (as shown in Fig. 5) include; (a) conventional hydrogen bonds: the ligand forms a hydrogen bond with the O atom of TYR120, suggesting the potential for favorable polar interactions. (b) Carbon–hydrogen bonds: the ligand forms carbon–hydrogen bonds with the CB atom of SER207, the OE1 atom of GLN228, and the O atom of GLN228, contributing to the overall binding affinity. (c) π–Cation interaction: The ligand forms a π–cation interaction with the NH1 atom of ARG235, indicating an electrostatic attraction between the positively charged arginine side chain and the ligand's aromatic system. (d) π–Lone pair interaction: The ligand forms a π–lone pair interaction with the OH atom of TYR96, suggesting a weak electrostatic interaction. (e) Hydrophobic interactions: The ligand participates in π–π stacked and π–π T-shaped interactions with nearby aromatic residues like TYR96 and TYR120, suggesting favorable hydrophobic and π-stacking interactions. The combination of hydrogen bonding, electrostatic interactions (π–cation and π–lone pair), and hydrophobic π-stacking interactions suggests that compound Q3 can engage in a diverse range of favorable interactions with the β-lactamase S. aureus binding site, potentially contributing to its high binding affinity and specificity.
The best compound for the β-lactamase E. coli receptor appears to be compound Q4, with a docking score of −175.17 and a binding free energy (ΔG) of −5.45. The interactions between compound 4 and the receptor (as shown in Fig. 6) include; (a) conventional hydrogen bonds: the ligand forms multiple hydrogen bonds with the NH1, NH2, and O atoms of ARG275 and the O atom of GLY238, suggesting the potential for favorable polar interactions. (b) Carbon–hydrogen bonds: the ligand forms carbon–hydrogen bonds with the OE2 atom of GLU104 and the OG atom of SER70, contributing to the overall binding affinity. (c) π–Anion interaction: the ligand forms a π–anion interaction with the OE2 atom of GLU104, indicating an electrostatic attraction between the negatively charged glutamic acid side chain and the ligand's aromatic system. (d) π–Sulfur interaction: the ligand forms π–sulfur interactions with the SD atom of MET272, suggesting a potential electrostatic or polarization effect involving the sulfur atom. (e) Hydrophobic interactions: the ligand participates in π–pi stacked and π–alkyl interactions with nearby residues like TYR105 and ALA237, suggesting favorable hydrophobic and π-stacking interactions. The combination of hydrogen bonding, electrostatic interactions (π–anion and π–sulfur), and hydrophobic π-stacking interactions suggests that compound Q4 can engage in a diverse range of favorable interactions with the β-lactamase E. coli binding site, potentially contributing to its high binding affinity and specificity.
3. Conclusion
Concisely, seven new Cd(ii) and Ag(i) compounds have been described herein, including their structures, biological properties, and methods of synthesis. These compounds are generated via interactions with a polydentate N ligand, namely 2,4,6-tris-(2-pyridyl)-1,3,5-triazine (TPT), the predominant or main chelating agent. The TPT compound was expected to produce a range of complexes, such as mononuclear, dinuclear, and polynuclear complexes, as well as coordination polymers. A study has been carried out to examine the luminescent and electrochemical properties of complexes in a solution. The emission peaks of the compounds are attributed to ligand-centered transitions. The examination of cyclic voltammetry revealed the existence of quasi-reversible processes linked to the redox pair of Ag(i)/Ag(ii). Synthesised complexes Q1–Q7 showed improved efficacy against Candida and a more favourable therapeutic profile than the clinically used references, according to the most important finding from the evaluation of in vitro antibacterial activity and toxicity. Antibacterial and therapeutic medicines with intriguing pharmacological properties may be found in the molecules that are formed when metal ions and TPT complex. These compounds merit additional investigation. In docking studies, the best compounds for each receptor exhibit a combination of hydrogen bonding, electrostatic interactions (π–cation, π–anion, π–lone pair, π–sulfur), and hydrophobic interactions (π-stacking, π–alkyl, alkyl), which can contribute to their favorable binding affinities and specificities.
Data availability
The data are in the ESI file.† The details of the crystal of compound Q6 in Cambridge database is as follows: data citation: Azza A. Hassoon, Stacey Smith, Roger Harrison, CCDC 1509097: Experimental Crystal Structure Determination, DOI: https://doi.org/10.5517/ccdc.csd.cc1mnbk5. Refcode: EFUKEZ.
Author contributions
Azza A. Hassoon: conceptualization, methodology, validation, formal analysis, data management, investigation, visualization, writing – original draft, reviewing and editing. Stacey J. Smith: single crystal X-ray analysis. Roger G. Harrison: Investigation, writing – review & editing, funding acquisition.
Conflicts of interest
The authors declare that they have no known competing financial interests or personal relationships that could have appeared to influence the work reported in this paper. All the authors have reviewed and approved the manuscript of this research work.
Supplementary Material
Electronic supplementary information (ESI) available: Including all experimental details and further spectroscopic information. CCDC 1509097. For ESI and crystallographic data in CIF or other electronic format see DOI: https://doi.org/10.1039/d4ra05305b
References
- Tumer M. Kokasal H. Serin S. Digrak M. Transit. Met. Chem. 1999;24:13–17. [Google Scholar]
- Islam M. S. Farooque M. A. Bodruddoza M. A. K. Mosaddik M. A. Alam M. S. Bio. Sci. 2002;2:797–799. [Google Scholar]
- Zakaria C. M. Farroque M. A. Islam M. R. Biswas M. H. Orient. J. Chem. 2000;16:85–90. [Google Scholar]
- Abdel-Rahman L. H. Abu-Dief A. M. El-Khatib R. M. Abdel-Fatah S. M. Bioorg. Chem. 2016;69:140–152. doi: 10.1016/j.bioorg.2016.10.009. [DOI] [PubMed] [Google Scholar]
- Anđelković K. R Milenković M. Pevec A. Turel I. Z Matić I. Vujčić M. Sladić D. Radanović D. Brađan G. Belošević S. Čobeljić B. J. Inorg. Biochem. 2017;174:137–149. doi: 10.1016/j.jinorgbio.2017.06.011. [DOI] [PubMed] [Google Scholar]
- Jazestani M. Chiniforoshan H. Tabrizi L. McArdle P. J. Biomol. Struct. Dyn. 2017;35:2055–2065. doi: 10.1080/07391102.2016.1201006. [DOI] [PubMed] [Google Scholar]
- Hopa C. Yildirim H. Kara H. Kurtaran R. Alkan M. Spectrochim. Acta, Part A. 2014;121:282–287. doi: 10.1016/j.saa.2013.10.028. [DOI] [PubMed] [Google Scholar]
- Yousef T. A. Ahmed S. F. El-Gammal O. A. Abu El-Reash G. M. Spectrochim. Acta, Part A. 2015;146:228–239. doi: 10.1016/j.saa.2015.01.128. [DOI] [PubMed] [Google Scholar]
- Perez J. M. Cerrillo V. Matesanz A. I. Millan J. M. Navarro P. Alonso C. Souza P. ChemBioChem. 2001;2:119–123. doi: 10.1002/1439-7633(20010202)2:2<119::AID-CBIC119>3.0.CO;2-5. [DOI] [PubMed] [Google Scholar]
- Zec M. Srdic-Rajic T. Krivokuca A. Jankovic R. Todorovic T. Andelkovic K. Radulovic S. Med. Chem. 2014;10:759–771. doi: 10.2174/1573406410666140327122009. [DOI] [PubMed] [Google Scholar]
- Slenters T. V. Sagué J. L. Brunetto P. S. Zuber S. Fleury A. Mirolo L. Robin A. Y. Meuwly M. Gordon O. Landmann R. Daniels A. U. Fromm K. M. Materials. 2010;3:3407–3429. [Google Scholar]
- Wang X.-P. Hu T.-P. Sun D. CrystEngComm. 2015;17:3393–3417. [Google Scholar]
- Njogu E. M. Omondi B. Nyamori V. O. J. Coord. Chem. 2015;68:3389–3431. [Google Scholar]
- Balic T. Perdih F. Mršo T. Balic I. Polyhedron. 2020;190:114774. [Google Scholar]
- Atif M. Bhatti H. N. Haque R. A. Iqbal M. A. Khadeer M. B. A. Majid A. M. S. A. Appl. Biochem. Biotechnol. 2020;191:1171–1189. doi: 10.1007/s12010-019-03186-9. [DOI] [PubMed] [Google Scholar]
- Şahin N. Şahin-Bölükbsi S. Tahir M. N. Arıcı C. Çevik E. Gürbüz N. Özdemir İ. Cummings B. S. J. Mol. Struct. 2019;1179:92–99. [Google Scholar]
- Chiang L.-M. Yeh C.-W. Chan Z.-K. Wang K.-M. Chou Y.-C. Chen J.-D. Wang J.-C. Lai J. Y. Cryst. Growth Des. 2008;8:470–477. [Google Scholar]
- Sandeli A. E.-K. Khiri-Meribout N. Benzerka S. Gürbüz N. Dündar M. Karcı H. Bensouici G. Mokrani E. L. Özdemir İ. Koç A. Özdemir N. Debache A. Özdemir İ. Inorg. Chim. Acta. 2021;525:120486. [Google Scholar]
- Wen Q.-S. Zhou C.-L. Qin D.-Q. Acta Crystallogr., Sect. E: Struct. Rep. Online. 2010;66:m1030. doi: 10.1107/S1600536810029739. [DOI] [PMC free article] [PubMed] [Google Scholar]
- Chen S. Huang Y. Fang X. Li H. Zhang Z. Horb T. S. A. Weng Z. Dalton Trans. 2015;44:19682–19686. doi: 10.1039/c5dt02078f. [DOI] [PubMed] [Google Scholar]
- Osawa M. Hoshino M. Chem. Commun. 2008:6384–6386. doi: 10.1039/b813844c. [DOI] [PubMed] [Google Scholar]
- Young A. G. Hanton L. R. Coord. Chem. Rev. 2008;252:1346–1386. [Google Scholar]
- Nayeri S. Jamali S. Jamjah A. Shakirova J. R. Tunik S. P. Gurzhiy V. Samouei H. Shahsavari H. R. Inorg. Chem. 2020;59:5702–5712. doi: 10.1021/acs.inorgchem.0c00482. [DOI] [PubMed] [Google Scholar]
- Prince P. D. Steed J. W. Supramol. Chem. 1998;10:155–158. [Google Scholar]
- Jones P. G. Gries T. Grutzmacher H. Roesky H. W. Schimkowiak J. Sheldrick G. M. Angew. Chem., Int. Ed. 1984;23:376. [Google Scholar]
- Khlobystov A. N. Blake A. J. Champnessk N. R. Lemenovskii D. A. Majouga A. G. Zyk N. V. Schröder M. Coord. Chem. Rev. 2001;222:155–192. [Google Scholar]
- Zheng S.-L. Tong M.-L. Chen X.-M. Coord. Chem. Rev. 2003;246:185–202. [Google Scholar]
- Najafpour M. M. Hołynska M. Amini M. Kazemi S. H. Lis T. Bagherzadeh M. Polyhedron. 2010;29:2837–2843. [Google Scholar]
- Maekawa M. Oda S. Sugimoto K. Okubo T. Kuroda-Sowa T. Results Chem. 2022;4:100550. [Google Scholar]
- Visinescu D. Shova S. Popescu D.-L. Alexandru M.-G. Crystals. 2022;12:1618. [Google Scholar]
- Zhang L. Lu X. –Q. Zhang Q. Chen C. –L. Kang B. –S. Transit. Met. Chem. 2005;30:76–81. [Google Scholar]
- Lin J.-D. Lin M. Z. Jia C. C. Li Z. H. Du S. W. Inorg. Chem. Commun. 2009;12:487–489. [Google Scholar]
- Zhou X. P. Zhang X. Lin S.-H. Li D. Cryst. Growth Des. 2007;7:485–487. [Google Scholar]
- Xu H. W. Li J. X. Pin L. Chen Z. N. Wu J. G. Transition Met. Chem. 2007;32:839. [Google Scholar]
- Yan C. Chen L. Feng R. Jiang F. Hong M. CrystEngComm. 2009;11:2529–2535. [Google Scholar]
- Therrien B. J. Organomet. Chem. 2011;696:637–651. [Google Scholar]
- Tan S. J. Yan Y. K. Lee P. P. F. Lim K. H. Future Med. Chem. 2010;2:1591–1608. doi: 10.4155/fmc.10.234. [DOI] [PubMed] [Google Scholar]
- Fromm K. M. Appl. Organomet. Chem. 2013;27:683–687. [Google Scholar]
- Banti C. N. Hadjikakou S. K. Metallomics. 2013;5:569–596. doi: 10.1039/c3mt00046j. [DOI] [PubMed] [Google Scholar]
- Medici S. Peana M. Crisponi G. Nurchi V. M. Lachowicz J. I. Remelli M. Zoroddu M. A. Coord. Chem. Rev. 2016;327:349–359. [Google Scholar]
- Rusu A. Hancu G. Munteanu A. C. Uivarosi V. J. Organomet. Chem. 2017;839:19–30. [Google Scholar]
- Liang X. Luan S. Yin Z. He M. He C. Yin L. Zou Y. Yuan Z. Li L. Song X. Lv C. Zhang W. Eur. J. Med. Chem. 2018;157:62–80. doi: 10.1016/j.ejmech.2018.07.057. [DOI] [PubMed] [Google Scholar]
- Hecel A. Kolkowska P. Krzywoszynska K. Szebesczyk A. Rowinska-Zyrek M. Kozlowski H. Curr. Med. Chem. 2019;26:624–647. doi: 10.2174/0929867324666170920125943. [DOI] [PubMed] [Google Scholar]
- Üstün E. Özdemir N. Sahin N. J. Coord. Chem. 2021;74:3109–3126. [Google Scholar]
- Üstün E. Sahin N. Çelik C. Tutar U. Özdemir N. Gürbüz N. Özdemir I. Dalton Trans. 2021;50:15400–15412. doi: 10.1039/d1dt02003j. [DOI] [PubMed] [Google Scholar]
- Nomiya K. Tsuda K. Sudoh T. Oda M. J. Inorg. Biochem. 1997;68:39–44. doi: 10.1016/s0162-0134(97)00006-8. [DOI] [PubMed] [Google Scholar]
- Nomiya K. Noguchi R. Oda M. Inorg. Chim. Acta. 2000;298:24–32. [Google Scholar]
- Nawaz S. Isab A. A. Merz K. Vasylyeva V. Metzler-Nolte N. Saleem M. Ahmad S. Polyhedron. 2011;30:1502–1506. [Google Scholar]
- Isab A. A. Nawaz S. Saleem M. Altaf M. Monim-ul-Mehboob M. Ahmad S. Stoeckli Evans H. Polyhedron. 2010;29:1251–1256. [Google Scholar]
- Çevik-Yıldız E. Sahin N. Sahin-Bölükbasi S. J. Mol. Struct. 2020;1199:126987. [Google Scholar]
- Sahin-Bölükbasi S. Cantürk-Kiliçkaya P. Kiliçkaya O. Drug Dev. Res. 2021;82:907–926. [Google Scholar]
- Akkoç M. Khan S. Yüce H. Türkmen N. B. Yasar S. Yasar S. Özdemir I. Heliyon. 2022;8:e10133. doi: 10.1016/j.heliyon.2022.e10133. [DOI] [PMC free article] [PubMed] [Google Scholar]
- Malik M. A. Dar O. A. Gull P. Wani M. Y. Hashmi A. A. Med. Chem. Commun. 2018;9:409. doi: 10.1039/c7md00526a. [DOI] [PMC free article] [PubMed] [Google Scholar]
- Boohaker R. J. Lee M. W. Vishnubhotla P. Perez J. L. M. Khaled A. R. Curr. Med. Chem. 2012;19:3794–3804. doi: 10.2174/092986712801661004. [DOI] [PMC free article] [PubMed] [Google Scholar]
- Mader J. S. Hoskin D. W. Expert Opin. Invest. Drugs. 2006;15(8):933–946. doi: 10.1517/13543784.15.8.933. [DOI] [PubMed] [Google Scholar]
- Geary W. J. Coord. Chem. Rev. 1971;7:81–122. [Google Scholar]
- Singh Gill D. Rana D. Z. Naturforsch. 2009;64a:269–272. [Google Scholar]
- Elsayed S. A. Elnabky I. M. Aboelnga M. M. El-Hendawy A. M. RSC Adv. 2024;14:19512. doi: 10.1039/d4ra02738h. [DOI] [PMC free article] [PubMed] [Google Scholar]
- Biswas F. B. Roy T. G. Rabi S. Islam M. K. Eur. Sci. J. 2016;12:1857–7881. [Google Scholar]
- Gupta S. K. D. Rabi S. Ghosh D. Yasmin F. Dey B. K. DEY S. Roy T. G. J. Chem. Sci. 2021;7:133. [Google Scholar]
- Hassoon A. A. Al-Raddadi N. S. Nawar N. Mostafa M. M. Open J. Inorg. Chem. 2016;6:23–65. [Google Scholar]
- Hassoon A. A. Harrison R. G. Nawar N. Smith S. J. Mostafa M. M. J. Mol. Struct. 2020;1203:127240. [Google Scholar]
- Nakamoto K., Infrared and Raman Spectra of Inorganic and Coordination Compounds, Part B: Applications in Coordination, Organometallic, and Bioinorganic Chemistry, 6th edn, John Wiley & Sons, INC. (2009) [Google Scholar]
- Ferraro J. R., Low Frequency Vibrations of Inorganic and Coordination Compounds, Plenum Press, New York, 1966 [Google Scholar]
- Oladipo S. D. Mocktar C. Omondi B. Arabian J. Chem. 2020;13:6379–6394. [Google Scholar]
- Fortin D. Drouin M. Turcotte M. Harvey P. D. J. Am. Chem. Soc. 1997;119:531. [Google Scholar]
- Tăbăcaru A. Pettinari C. Busilă M. Dinică R. M. Polymers. 2019;11:1686. doi: 10.3390/polym11101686. [DOI] [PMC free article] [PubMed] [Google Scholar]
- Koessler K. Scherer H. Butschke B. Inorg. Chem. 2020;59:9496–9510. doi: 10.1021/acs.inorgchem.9b03622. [DOI] [PubMed] [Google Scholar]
- Niazi M. Shahsavari H. R. Haghighi M. G. Halvagar M. R. Hatami S. Notash B. RSC Adv. 2016;6:76463–76472. [Google Scholar]
- Ardizzoia G. A. La Monica G. Maspero A. Moret M. Masciocchi N. Inorg. Chem. 1997;36:2321–2328. doi: 10.1021/ic960908j. [DOI] [PubMed] [Google Scholar]
- Lever A. B. P., Inorganic Electronic Spectroscopy, Elsevier, Amsterdam, 1984 [Google Scholar]
- Glykos D. Tsipis A. C. Plakatouras J. C. Malandrinos G. Inorganics. 2024;12:131. [Google Scholar]
- Wu Z. Cui S. Zhao Z. He B. Ling Li X. New J. Chem. 2022;46:8881. [Google Scholar]
- Machura B. Nawrot I. Kruszynski R. J. Lumin. 2014;146:64–75. [Google Scholar]
- R De Silva C. Wang J. D Carducci M. Rajapakshe A. Zheng Z. Inorg. Chim. Acta. 2004;357:630–634. [Google Scholar]
- Ahmed Z. Iftikhar K. Inorg. Chem. Commun. 2010;13:1253–1258. [Google Scholar]
- Hasan N. Iftikhar K. J. Lumin. 2020;223:117135. [Google Scholar]
- Andrejević T. P. Milivojevic D. Glišić B. Đ. Kljun J. Stevanović N. Lj. Vojnovic S. Medic S. Nikodinovic-Runic J. Turel I. Djuran M. I. Dalton Trans. 2020;49:6084–6096. doi: 10.1039/d0dt00518e. [DOI] [PubMed] [Google Scholar]
- Wu J.-Y. Pan Y.-L. Zhang X.-J. Sun T. Tian Y.-P. Yang J.-X. Chen Z.-N. Inorg. Chim. Acta. 2007;360:2083–2091. [Google Scholar]
- Połczyński P. Jurczakowski R. Grochala W. J. Phys. Chem. C. 2013;117:20689–20696. doi: 10.1039/c3cc43072c. [DOI] [PubMed] [Google Scholar]
- Fakayode O. J. Mohlala R. L. Ratshiedana R. May B. M. Ebenso E. E. Feleni U. Nkambule T. T. I. ChemistryOpen. 2024;13:e202300212. doi: 10.1002/open.202300212. [DOI] [PMC free article] [PubMed] [Google Scholar]
- Birke R. L. Kim M.-H. Strassfeld M. Anal. Chem. 1981;53(6):852–856. [Google Scholar]
Associated Data
This section collects any data citations, data availability statements, or supplementary materials included in this article.
Supplementary Materials
Data Availability Statement
The data are in the ESI file.† The details of the crystal of compound Q6 in Cambridge database is as follows: data citation: Azza A. Hassoon, Stacey Smith, Roger Harrison, CCDC 1509097: Experimental Crystal Structure Determination, DOI: https://doi.org/10.5517/ccdc.csd.cc1mnbk5. Refcode: EFUKEZ.


