Abstract
This study aimed to assess the impact of surgeons’ annual volume and insulin-like growth factor-like family member 2 (IGFL2) expression on gastric cancer prognosis. Clinicopathological data from 475 patients who underwent D2 lymph node dissection were analyzed. IGFL2 expression was evaluated using immunohistochemistry. Patients were divided into training (70%) and validation (30%) groups. Univariate and multivariate Cox regression identified risk factors for overall survival (OS) and disease-free survival (DFS), leading to a clinical prediction model. Model performance was evaluated using C-index. High IGFL2 expression and low surgical volume independently predicted poorer OS and DFS (hazard ratio = 2.13, 2.17, all P < .01). Surgeons performing >26 cases annually had higher OS and DFS (hazard ratio = 1.65, 1.58, all P < .01). Nomograms integrating surgical volume, IGFL2 expression, grade, TNM staging, and carcinoembryonic antigen showed superior predictive accuracy for OS and DFS compared to TNM alone, with robust C-indices and area under the curve values. Surgeons’ annual volume and IGFL2 expression independently predict gastric cancer prognosis, emphasizing the need for specialized training and further research on IGFL2’s molecular mechanisms to enhance patient outcomes.
Keywords: clinical prediction model, gastric cancer, IGFL2, surgeons’ annual volume
1. Introduction
Gastric cancer, a severe malignancy with a high mortality rate, affects over 1 million individuals worldwide annually, leading to approximately 783,000 fatalities.[1] The incidence rates are significantly higher in Eastern Asia and Eastern Europe than in North America, Northern Europe, and Africa. Recent studies have reported an increasing prevalence of gastric cancer among younger adults in certain regions. The multifaceted etiology of the disease encompasses elements such as helicobacter pylori infection, dietary factors, genetic predispositions, and environmental influences, underscoring the need for comprehensive research and effective preventive strategies.
Surgical treatment is pivotal for managing gastric cancer, primarily targeting complete tumor removal to enhance survival rates.[2] However, this approach faces challenges such as the intricate nature of the surgeries, the risk of postoperative complications, and the necessity for highly skilled surgical teams. Quality control in gastric cancer surgery is critical because it directly influences patient outcomes and prognoses. High-quality surgical interventions characterized by meticulous techniques and thorough management of potential complications can markedly improve the survival rate and quality of life of patients with gastric cancer.[3]
The annual surgical volume of a surgeon or hospital is a crucial factor in the quality control of gastric cancer treatment, with studies yielding varied outcomes. Although higher volumes are often correlated with an improved patient prognosis, this correlation is not consistently evident across all studies. Comprehensive research suggests that higher surgical volumes are generally associated with favorable patient outcomes such as enhanced survival rates, more effective lymph node dissections, decreased mortality rates, and shortened hospital stays.[4–6] However, some studies have proposed that the sheer number of surgeries may not be the sole determinant of surgical success, highlighting that the surgeon’s expertise and overall surgical care quality may play a more critical role in determining the long-term survival of patients with gastric cancer.[7–9]
Recent advancements in the treatment of gastric cancer have centered on molecular and targeted therapies, including trastuzumab for HER2-positive tumors and immunotherapies aimed at the PD-1/PD-L1 pathways.[10,11] However, obstacles such as tumor heterogeneity, drug resistance, and the challenge of identifying effective biomarkers have impeded this progress. These challenges highlight the urgent need to identify new molecular targets to develop tailored and more effective treatment strategies and enhance patient outcomes in gastric cancer care.
IGFL2, a member of the insulin-like growth factor family, is associated with cell growth.[12] Studies using The Cancer Genome Atlas (TCGA) database have shown that IGFL2 is overexpressed in various tumor tissues, often correlating with poor prognosis. Its relationship with immune cells, immune-related genes, and low methylation levels indicate its role in oncogenesis.[13] Additionally, mutations in IGFL2 are linked to adverse outcomes, underscoring its potential as a biomarker for tumor immunotherapy and emphasizing the importance of further investigations in gastric cancer research. Previous studies in our center have found that IGFL2 is an important oncogene in gastric cancer (unpublished data).
In this study, we aimed to assess the impact of the annual volume of gastric cancer surgeries performed by surgeons, the novel molecular marker IGFL2, and various clinicopathological factors on overall survival (OS) and disease-free survival (DFS), particularly during the initial phase of laparoscopic surgery at our center. The era prior to 2010, marked by the advent of laparoscopic techniques, featured a predominance of open surgeries with relatively low volumes. Consequently, we focused our analysis on patient data from gastric cancer surgeries performed between 2008 and 2010. This study aimed to determine the effects of high annual surgical volumes and the presence of IGFL2 on patient prognosis with the goal of enhancing the assessment of surgical quality and identifying potential new drug targets to improve outcomes in gastric cancer treatment.
2. Materials and methods
2.1. Case selection
In this study, we used formalin-fixed paraffin-embedded (FFPE) samples from 475 patients with newly diagnosed and biopsy-confirmed gastric cancer (GC). Patients who underwent D2 lymphadenectomy between June 2008 and April 2010 were recruited from the Yantai Yuhuangding Hospital in Shandong, China. The patients were randomly distributed into the training and validation cohorts in a 7:3 ratio using the random-number method. The inclusion criteria were as follows: hematoxylin and eosin-stained slides displaying invasive tumor sections, comprehensive follow-up and clinicopathological data, no prior cancer treatments, at least 15 examined lymph nodes, and informed consent. Exclusion criteria included the absence of an initial FFPE tumor and normal samples or previous anticancer therapy. All samples were reevaluated by 2 independent pathologists, and TNM staging was updated according to the 8th edition of the American Joint Committee on Cancer staging manual. This study was approved by the review board of Yantai Yuhuangding Hospital (2018207).
2.2. Determination of optimal cutoff value for annual surgical volume
In this study, we used the X-tile software (https://medicine.yale.edu/lab/rimm/research/software/) to determine the optimal cutoff for a surgeon’s annual surgical volume. X-tile is an online tool widely used in biomedical research that scans all possible cutoff points, combining them with patient survival data to select the point that produces the most statistically significant difference (based on the log-rank test), thereby maximizing the difference in outcomes between different groups.
2.3. IGFL2 expression in stomach adenocarcinomas (STAD)
We primarily used the Xiantao Academic Online Tool for the following analyses. RNA sequencing data were obtained from TCGA platform. The data were aligned and mapped using the (STAR) algorithm, followed by normalization using transcripts per million and a subsequent log2 transformation. The data were integrated with the corresponding clinical information. We analyzed IGFL2 expression in various cancer types, focusing on gastric cancer, to determine its correlation with specific clinical pathologies of this disease.
2.4. Kaplan–Meier (KM) plotter database
The KM plotter database (https://kmplot.com/analysis/) was used to assess the prognostic value of IGFL2 expression in STAD. Patients were categorized into groups based on high or low IGFL2 expression levels to investigate outcomes such as survival (post-progression survival), first progression (FP), and OS.
2.5. Immunohistochemistry
FFPE specimens were processed for immunohistochemistry (IHC) as previously described. Sections (4 µm thick) were dewaxed in xylene and rehydrated using a graded ethanol series. Endogenous peroxidase activity was quenched with a 1% hydrogen peroxide/methanol solution for 10 minutes, followed by antigen retrieval in a citrate buffer (10 mM, pH 6.0) using microwave treatment for 30 minutes. Blocking was performed using 10% normal rabbit serum for 30 minutes. The sections were then incubated overnight at 4 °C with the anti-IGFL2 antibody (1:200 dilution, NBP3-09570, Novus, USA), followed by a 30-minute incubation with a horseradish peroxidase-labeled polymer system (EnVision™, DakoCytomation, Denmark). Color development was facilitated by 0.05% DAB, and the sections were counterstained with modified Harris hematoxylin.
2.6. Evaluation of IHC staining
Two expert pathologists who were blinded to the patients’ clinical details and outcomes independently evaluated the IHC-stained sections. They examined 10 high-magnification fields in the tumor area and achieved concordance in approximately 90% of the cases. Discrepancies were resolved by consulting a third expert whose agreement with one of the initial reviewers determined the prevailing assessment. In cases of disagreement, all 3 pathologists collaborated to reach a consensus. IGFL2 expression was quantified using a semi-quantitative H-score derived from a four-level intensity scale (0 = no staining, 0.5 = weak, 1 = moderate, 1.5 = strong) and the percentage of stained cells (0–100%). Based on the median H-score, patients were categorized into high or low IGFL2 expression groups.
2.7. Nomogram development
Nomograms were created based on the training cohort data. Survival rates for different factors were determined using KM estimates and evaluated using the log-rank test. Factors with P-values below .05 underwent time-dependent multivariable Cox regression to identify significant prognostic indicators using SPSS 22.0. The final nomograms were constructed in R 4.3.2, using the “survival” and’ rms’ packages, with backward step-wise selection influenced by the likelihood ratio test and Akaike information criterion for optimizing the model.
2.8. Nomogram validation and calibration
To assess the accuracy of the nomograms in predicting survival, the concordance index (C-index) was calculated within the validation cohort, with values ranging from 0.5 (no prediction capability) to 1.0 (perfect prediction). Calibration for the 1-year, 3-year, and 5-year OS and DFS involved aligning the predicted outcomes with the actual occurrences to adjust for discrepancies.
2.9. Clinical application
The practical utility of the nomograms was evaluated through a decision curve analysis (DCA), which determined their net benefit at various probability thresholds to gauge their effectiveness in informing clinical decisions.
2.10. Statistical analysis
For comparative analyses between 2 groups, continuous variables were assessed using the t test, while categorical variables were analyzed with the χ² test. OS and DFS were determined from the date of surgery to the event of regional recurrence or distant metastasis (for DFS), or to death or the last clinical follow-up (for OS). The KM method, in conjunction with the log-rank test, was used to calculate DFS and OS rates. Variables identified as significant in univariate analyses were further evaluated using a <multivariate Cox proportional hazards regression analysis. Statistical analyses were performed using R (version 4.3.2) and SPSS software (version 22.0). All tests were bidirectional, and a P-value < .05 was deemed statistically significant.
3. Results
3.1. The overexpression of IGFL2 in human gastric cancer
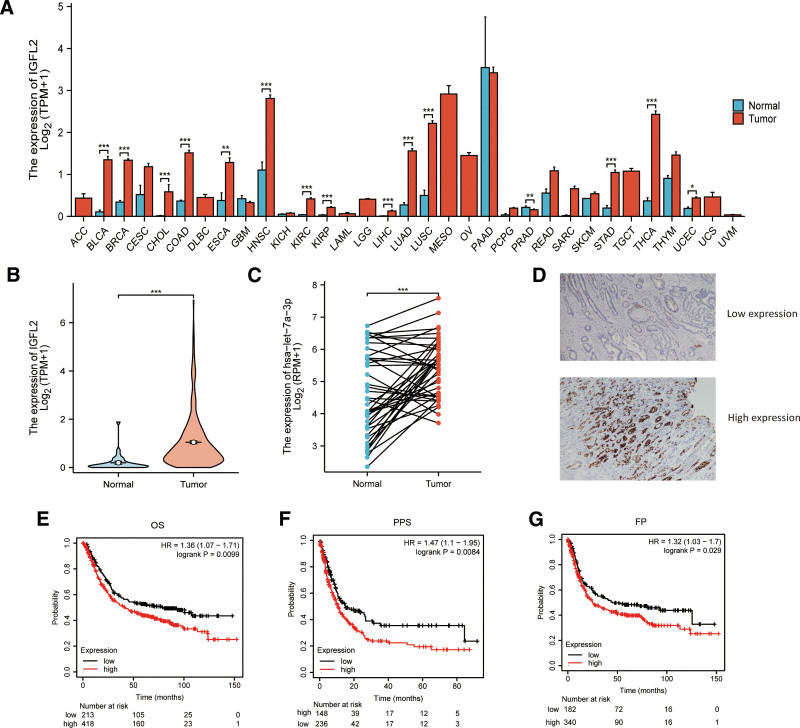
A pan-cancer analysis of 33 cancer types from the TCGA database indicated that IGFL2 mRNA levels were significantly higher in gastric cancer tissues than in normal tissues (P < .001; Fig. 1A). IGFL2 expression was elevated in 375 gastric cancer tissues compared to 32 normal tissues (P < .01, Fig. 1B), with a similarly significant increase observed in tumor samples from 27 paired tumor-normal tissues (P < .01, Fig. 1C). Immunohistochemical analysis conducted at the Yantai Yuhuangding Hospital revealed that IGFL2 expression was decreased in well-differentiated specimens and elevated in poorly differentiated specimens (Fig. 1D). Additionally, the analysis of KM plotter database showed that high IGFL2 expression in STAD was associated with adverse outcomes in first progression (FP), OS, and post-progression survival (Fig. 1E–G).
Figure 1.
IGFL2 expression and prognosis (A) IGFL2 expression across 33 cancer types, sourced from the TCGA database. (B) Specific IGFL2 expression in stomach adenocarcinoma (STAD) and normal tissues from TCGA. (C) Comparison of IGFL2 expression in 27 paired tumor and normal tissues from TCGA. (D) Representative images of high and low IGFL2 expression in tumor tissues, analyzed via immunohistochemistry (IHC) at Yantai Yuhuangding Hospital. (E–G) Correlation of IGFL2 with overall survival (OS), disease progression (FP), and post-progression survival (PPS), represented in Kaplan–Meier plots.
Based on the X-tile results, the optimal cutoff for a surgeon’s annual surgical volume was 26. Comparison of the clinicopathological profiles of the training and validation cohorts revealed no significant differences in key clinicopathological parameters between the 2 sets (Table 1). The association between IGFL2 expression and primary clinicopathological variables was examined using one-way ANOVA and multivariate logistic regression analyses. One-way ANOVA indicated that grade classifications T stage, N stage, M stage, and overall stage were associated with IGFL2 expression (Table 2). A multivariate logistic regression analysis revealed that Grade classifications, T stage, and N stage were significantly associated with IGFL2 expression (Table 3).
Table 1.
Clinicopathological characteristics of gastric cancer patients in the training and validation cohorts.
| Variable names | Train number (%) | Validation number (%) | t or χ² | P-value |
|---|---|---|---|---|
| Number | 332 | 143 | ||
| Age | 65.151 ± 10.32 | 64.31 ± 10.62 | 0.81 | .4186 |
| Gender | 0.06 | .81 | ||
| Female | 120 (36.14) | 50 (34.97) | ||
| Male | 212 (63.86) | 93 (65.03) | ||
| Location | 1.58 | .66 | ||
| Lower | 123 (37.05) | 57 (39.86) | ||
| Middle | 119 (35.84) | 43 (30.07) | ||
| Others | 13 (3.92) | 7 (4.90) | ||
| Upper | 77 (23.19) | 36 (25.17) | ||
| Histological type | 0.55 | .97 | ||
| Diffuse type | 69 (20.78) | 29 (20.28) | ||
| Intestinal type | 154 (46.39) | 68 (47.55) | ||
| Mixed type | 109 (32.83) | 46 (32.17) | ||
| Grade | 0.03 | .98 | ||
| G1 | 106 (31.93) | 45 (31.47) | ||
| G2 | 132 (39.76) | 58 (40.56) | ||
| G3 | 94 (28.31) | 40 (27.97) | ||
| T | 3.18 | .36 | ||
| T1 | 20 (6.02) | 12 (8.39) | ||
| T2 | 66 (19.88) | 23 (16.08) | ||
| T3 | 154 (46.39) | 75 (52.45) | ||
| T4 | 92 (27.71) | 33 (23.08) | ||
| N | 0.54 | .91 | ||
| N0 | 101 (30.42) | 41 (28.67) | ||
| N1 | 91 (27.41) | 37 (25.87) | ||
| N2 | 70 (21.08) | 34 (23.78) | ||
| N3 | 70 (21.08) | 31 (21.68) | ||
| M | 0.02 | .88 | ||
| M0 | 310 (93.37) | 133 (93.01) | ||
| M1 | 22 (6.63) | 10 (6.99) | ||
| Stage | 0.88 | .83 | ||
| I | 45 (13.55) | 21 (14.68) | ||
| II | 109 (32.83) | 42 (29.37) | ||
| III | 144 (43.37) | 67 (46.85) | ||
| IV | 34 (10.24) | 13 (9.09) | ||
| Event | 0.2 | .65 | ||
| Alive | 200 (60.24) | 83 (58.04) | ||
| Dead | 132 (39.76) | 60 (41.96) | ||
| IGFL2 | 0.2 | .65 | ||
| High | 163 (49.10) | 67 (46.85) | ||
| Low | 169 (50.90) | 76 (53.15) | ||
| Annual surgical volume | 0.14 | .71 | ||
| High | 210 (63.25) | 93 (65.03) | ||
| Low | 122 (36.75) | 50 (34.97) | ||
| Tumor size | 0.01 | .94 | ||
| <4 cm | 145 (43.67) | 63 (44.06) | ||
| ≥4 cm | 187 (56.33) | 80 (55.94) | ||
| CEA | 1.09 | .3 | ||
| Normal | 211 (63.55) | 98 (68.53) | ||
| High | 121 (36.45) | 45 (31.47) | ||
| CA199 | 0.01 | .92 | ||
| Normal | 219 (65.96) | 95 (66.43) | ||
| High | 113 (34.04) | 48 (33.57) | ||
| Surgical approach | 0.1 | .76 | ||
| Open surgery | 218 (65.66) | 96 (67.13) | ||
| Laparoscopy-assisted surgery | 114 (34.34) | 47 (32.87) |
Table 2.
Univariate analysis of variance on the expression level of IGFL2.
| Clinical pathological data | Number | IGFL2 expression | χ² | P-value | |
|---|---|---|---|---|---|
| n = 332 | High (%) | Low (%) | |||
| Gender | |||||
| Female | 120 (36.14) | 62 (38.04) | 58 (34.32) | 0.5 | .48 |
| Male | 212 (63.86) | 101 (61.96) | 111 (65.68) | ||
| Age | |||||
| >60 years | 112 (33.73) | 53 (15.96) | 59 (17.77) | 0.87 | .35 |
| ≤60 years | 220 (62.27) | 116 (34.94) | 104 (31.33) | ||
| Tumor location | 1.95 | .584 | |||
| Upper | 77 (23.19) | 41 (25.15) | 36 (21.30) | ||
| Middle | 119 (35.84) | 61 (37.42) | 58 (34.32) | ||
| Lower | 123 (37.05) | 56 (34.36) | 67 (39.64) | ||
| Others | 13 (3.92) | 5 (3.07) | 8 (4.73) | ||
| Tumor size | 3.40 | .065 | |||
| <4 cm | 211 (63.55) | 99 (60.74) | 112 (66.27) | ||
| ≥4 cm | 121 (36.45) | 64 (39.26) | 57 (33.73) | ||
| Grade | 14.27 | <.01 | |||
| G1 | 106 (31.93) | 49 (30.06) | 57 (33.73) | ||
| G2 + G3 | 226 (68.07) | 99 (29.82) | 127 (38.25) | ||
| T | 57.36 | <.01 | |||
| T1 + T2 | 86 (25.90) | 74 (22.23) | 12 (3.61) | ||
| T3 + T4 | 246 (74.10) | 95 (28.61) | 151 (45.48) | ||
| N | 29.05 | <.01 | |||
| N0 | 101 (30.42) | 74 (22.23) | 27 (8.13) | ||
| N+ | 231 (69.57) | 95 (28.61) | 136 (40.96) | ||
| M | 13.93 | .0002 | |||
| 0 | 298 (89.76) | 162 (48.80) | 136 (40.96) | ||
| 1 | 34 (10.24) | 7 (2.11) | 27 (8.13) | ||
| CA199 | 1.64 | .20 | |||
| Normal | 219 (65.96) | 102 (62.58) | 117 (69.23) | ||
| High | 113 (34.04) | 61 (37.42) | 52 (30.77) | ||
| CEA | |||||
| High | 187 (56.33) | 96 (58.90) | 91 (53.85) | 0.86 | .35 |
| Normal | 145 (43.67) | 67 (41.10) | 78 (46.15) | ||
| TNM stage | 83.9 | <.01 | |||
| I + II | 154 (46.39) | 120 (36.14) | 34 (10.24) | ||
| III + IV | 178 (53.61) | 49 (14.76) | 129 (38.86) | ||
| Histological type | 4.66 | .098 | |||
| Intestinal type | 154 (46.39) | 78 (47.85) | 76 (44.97) | ||
| Diffuse type | 69 (20.78) | 28 (17.18) | 41 (24.26) | ||
| Mixed type | 109 (32.83) | 57 (34.97) | 52 (30.77) | ||
Table 3.
Binary logistic regression analysis of IGFL2 expression.
| Clinical pathological data | N = 332 | IGFL2 expression | OR | 95% CI | P-value | |
|---|---|---|---|---|---|---|
| Grade | 1.97 | 1.14–3.43 | .016 | |||
| G1 | 106 (31.93) | 49 (30.06) | 57 (33.73) | |||
| G2 + G3 | 226 (68.07) | 99 (29.82) | 127 (38.25) | |||
| T stage | 8.32 | 4.20–16.46 | <.01 | |||
| T1 + T2 | 86 (25.90) | 74 (22.23) | 12 (3.61) | |||
| T3 + T4 | 246 (74.10) | 95 (28.61) | 151 (45.48) | |||
| N stage | 2.65 | 1.50–4.71 | .001 | |||
| N0 | 101 (30.42) | 74 (22.23) | 27 (8.13) | |||
| N+ | 231 (69.57) | 95 (28.61) | 136 (40.96) | |||
| M stage | 1.94 | 0.78–4.84 | .157 | |||
| 0 | 298 (89.76) | 162 (48.80) | 136 (40.96) | |||
| 1 | 34 (10.24) | 7 (2.11) | 27 (8.13) |
3.2. Prognostic factors in patients with gastric cancer
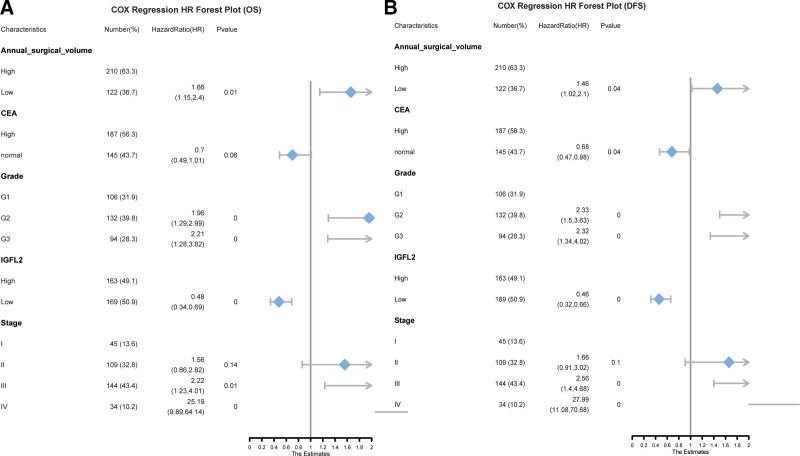
We assessed prognostic factors for OS and progression-free survival (PFS) independently. A univariate analysis identified grade, carcinoembryonic antigen (CEA), T stage, N stage, M stage, tumor size, IGFL2, TNM stage, and annual surgical volume as potential prognostic indicators for OS. Factors with a P-value <.05 were subsequently included in a multivariable Cox regression analysis (Table 4, Figure S1A, Supplemental Digital Content, http://links.lww.com/MD/N666). This analysis revealed that TNM stage, tumor grade, IGFL2 expression, and annual surgical volume were independent prognostic factors (Table 5, Fig. 2A). For DFS, the findings were analogous; a univariate analysis identified similar prognostic factors (Table 6, Figure S1B, Supplemental Digital Content, http://links.lww.com/MD/N666). A multivariate Cox regression analysis determined that TNM stage, CEA levels, grade, IGFL2 expression, and annual surgical volume were independent prognostic factors (Table 7, Fig. 2B).
Table 4.
Univariate analysis for overall survival (OS) in the training cohort.
| Characteristics | Number (%) | Hazard ratio (HR) | 95% CI | P-value |
|---|---|---|---|---|
| Age | 65.15 ± 10.32 | 1.008 | 0.99–1.03 | .352 |
| Annual surgical volume | ||||
| High | 210 (63.25) | |||
| Low | 122 (36.75) | 1.65 | 1.16–2.35 | .005 |
| CA199 | ||||
| 0 | 219 (65.96) | |||
| 1 | 113 (34.04) | 0.99 | 0.70–1.42 | .97 |
| CEA | ||||
| High | 187 (56.32) | |||
| Normal | 145 (43.68) | 0.67 | 0.44–0.89 | .01 |
| Grade | ||||
| G1 | 106 (31.93) | |||
| G2 | 132 (39.76) | 2.01 | 1.34–3.00 | .001 |
| G3 | 94 (28.31) | 3.30 | 2.05–5.32 | 0 |
| Histological type | ||||
| Diffuse type | 69 (20.78) | |||
| Intestinal type | 154 (46.39) | 0.94 | 0.59–1.48 | .78 |
| Mixed type | 109 (32.83) | 1.39 | 0.86–2.24 | .18 |
| IGFL2 | ||||
| High | 163 (49.10) | |||
| Low | 169 (50.90) | 0.47 | 0.33–0.66 | 0 |
| Location | ||||
| Lower | 123 (37.05) | |||
| Middle | 119 (35.84) | 1.11 | 0.74–1.68 | .61 |
| Others | 13 (3.92) | 0.92 | 0.391–2.18 | .86 |
| Upper | 77 (23.19) | 1.11 | 0.70–1.77 | .66 |
| M | ||||
| M0 | 298 (89.76) | |||
| M1 | 34 (10.24) | 17.72 | 8.34–37.63 | 0 |
| N | ||||
| N0 | 101 (30.42) | |||
| N1 | 91 (27.41) | 1.43 | 0.91–2.27 | .12 |
| N2 | 70 (21.08) | 2.06 | 1.28–3.33 | .003 |
| N3 | 70 (21.08) | 2.36 | 1.42–3.93 | .001 |
| Sex | ||||
| Female | 120 (36.14) | |||
| Male | 212 (63.86) | 0.95 | 0.67–1.36 | .78 |
| Stage | ||||
| I | 45 (13.55) | |||
| II | 109 (32.83) | 1.33 | 0.74–2.37 | .34 |
| III | 144 (43.37) | 2.33 | 1.33–4.09 | .003 |
| IV | 34 (10.24) | 30.64 | 12.53–74.96 | 0 |
| Surgical approach | ||||
| 0 | 218 (65.66) | |||
| 1 | 114 (34.34) | 0.78 | 0.54–1.12 | .178 |
| T | ||||
| T1 | 20 (6.02) | |||
| T2 | 66 (19.88) | 1.39 | 0.60–3.25 | .446 |
| T3 | 154 (46.39) | 1.71 | 0.78–3.76 | .18 |
| T4 | 92 (27.71) | 2.38 | 1.06–5.33 | .035 |
| Tumor size | ||||
| 0 | 211 (63.55) | |||
| 1 | 121 (36.45) | 1.29 | 0.91–1.82 | .15 |
Table 5.
Multifactorial Cox regression analysis for overall survival (OS) in the training cohort.
| Characteristics | Number (%) | Hazard ratio (HR) | 95% CI | P-value |
|---|---|---|---|---|
| Annual surgical volume | ||||
| High | 210 (63.25) | |||
| Low | 122 (36.75) | 1.66 | 1.15–2.40 | .007 |
| CEA | ||||
| High | 187 (56.32) | |||
| Normal | 145 (43.68) | 0.70 | 0.49–1.01 | .06 |
| Grade | ||||
| G1 | 106 (31.93) | |||
| G2 | 132 (39.76) | 1.96 | 1.29–2.99 | .002 |
| G3 | 94 (28.31) | 2.22 | 1.28–3.82 | .004 |
| IGFL2 | ||||
| High | 163 (49.10) | |||
| Low | 169 (50.90) | 0.48 | 0.34–0.69 | 0 |
| Stage | ||||
| I | 45 (13.55) | |||
| II | 109 (32.83) | 1.56 | 0.86–2.82 | .14 |
| III | 144 (43.37) | 2.22 | 1.23–4.01 | .008 |
| IV | 34 (10.24) | 25.19 | 9.89–64.14 | 0 |
Figure 2.
COX regression HR forest plot for OS (A) and PFS (B).
Table 6.
Univariate analysis for disease-free survival (DFS) in the training cohort.
| Characteristics | Number (%) | Hazard ratio (HR) | 95% CI | P-value |
|---|---|---|---|---|
| Age | 65.15 ± 10.32 | 1.01 | 0.99–1.02 | .41 |
| Annual surgical volume | ||||
| High | 210 (63.25) | |||
| Low | 122 (36.75) | 1.58 | 1.11–2.25 | .01 |
| CA199 | ||||
| 0 | 219 (65.96) | |||
| 1 | 113 (34.04) | 0.97 | 0.68–1.39 | .88 |
| CEA | ||||
| High | 187 (56.32) | |||
| Normal | 145 (43.68) | 0.61 | 0.43–0.87 | .01 |
| Grade | ||||
| G1 | 106 (31.93) | |||
| G2 | 132 (39.76) | 2.13 | 1.42–3.20 | .00 |
| G3 | 94 (28.31) | 3.32 | 2.06–5.35 | .00 |
| Histological type | ||||
| Diffuse type | 69 (20.78) | |||
| Intestinal type | 154 (46.39) | 0.94 | 0.59–1.48 | .78 |
| Mixed type | 109 (32.83) | 1.36 | 0.84–2.19 | .21 |
| IGFL2 | ||||
| High | 163 (49.10) | |||
| Low | 169 (50.90) | 0.47 | 0.33–0.66 | .00 |
| Location | ||||
| Lower | 123 (37.05) | |||
| Middle | 119 (35.84) | 1.16 | 0.77–1.75 | .47 |
| Others | 13 (3.92) | 0.85 | 0.36–2.02 | .71 |
| Upper | 77 (23.19) | 1.21 | 0.76–1.92 | .42 |
| M | ||||
| M0 | 298 (89.76) | |||
| M1 | 34 (10.24) | 18.51 | 8.75–39.15 | .00 |
| N | ||||
| N0 | 101 (30.42) | |||
| N1 | 91 (27.41) | 1.37 | 0.86–2.16 | .19 |
| N2 | 70 (21.08) | 2.17 | 1.34–3.51 | .00 |
| N3 | 70 (21.08) | 2.42 | 1.45–4.03 | .00 |
| Sex | ||||
| Female | 120 (36.14) | |||
| Male | 212 (63.86) | 0.95 | 0.67–1.36 | .78 |
| Stage | ||||
| I | 45 (13.55) | |||
| II | 109 (32.83) | 1.30 | 0.73–2.31 | .37 |
| III | 144 (43.37) | 2.44 | 1.39–4.28 | .00 |
| IV | 34 (10.24) | 32.76 | 13.45–79.82 | .00 |
| Surgical approach | ||||
| 0 | 218 (65.66) | |||
| 1 | 114 (34.34) | 0.79 | 0.55–1.14 | .20 |
| T | ||||
| T1 | 20 (6.02) | |||
| T2 | 66 (19.88) | 1.33 | 0.57–3.09 | .51 |
| T3 | 154 (46.39) | 1.93 | 0.88–4.24 | .10 |
| T4 | 92 (27.71) | 2.32 | 1.03–5.19 | .04 |
| Tumor size | ||||
| 0 | 211 (63.55) | |||
| 1 | 121 (36.45) | 1.32 | 0.94–1.86 | .12 |
Table 7.
Multifactorial Cox regression analysis for disease-free survival (DFS) in the training cohort.
| Characteristics | Number (%) | Hazard ratio (HR) | 95% CI | P-value |
|---|---|---|---|---|
| Annual surgical volume | ||||
| High | 210 (63.25) | |||
| Low | 122 (36.75) | 1.463 | 1.02–2.10 | .039 |
| CEA | ||||
| High | 187 (56.32) | |||
| Normal | 145 (43.68) | 0.681 | 0.47–0.98 | .037 |
| Grade | ||||
| G1 | 106 (31.93) | |||
| G2 | 132 (39.76) | 2.332 | 1.50–3.63 | 0 |
| G3 | 94 (28.31) | 2.324 | 1.35–4.02 | .003 |
| IGFL2 | ||||
| High | 163 (49.10) | |||
| Low | 169 (50.90) | 0.459 | 0.32–0.66 | 0 |
| Stage | ||||
| I | 45 (13.55) | |||
| II | 109 (32.83) | 1.661 | 0.91–3.02 | .096 |
| III | 144 (43.37) | 2.555 | 1.40–4.68 | .002 |
| IV | 34 (10.24) | 27.987 | 11.08–70.68 | 0 |
Given that grade classification, CEA, and stage are well-established prognostic factors, our analysis focused on the prognostic influence of IGFL2 expression and annual surgical volume.
3.2. High expression of IGFL2 is associated with poor clinical outcomes
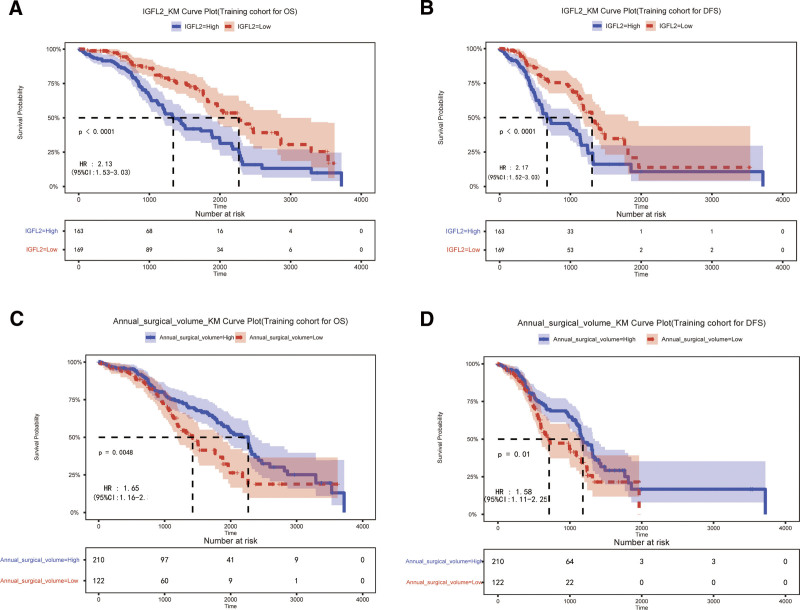
To assess the prognostic significance of IGFL2 expression in patients with GC, a KM survival analysis was conducted. This analysis revealed that patients with high IGFL2 expression exhibited lower 3-year OS and DFS compared to those with low IGFL2 expression (3-year OS: 38.04% vs 51.53%; hazard ratio (HR) = 2.13 [1.53–3.03]; 3-year DFS: 17.79% vs 25.44%; HR = 2.17 [1.52–3.03]; all P < .01; Fig. 3A and B).
Figure 3.
Association of IGFL2 expression (A and B) and annual surgical volume (C and D) with overall survival (OS) and disease-free survival (DFS).
3.3. Low annual surgical volume is associated with poor clinical outcomes
To evaluate the prognostic impact of the annual surgical volume in patients with GC, a KM survival analysis was performed. The test revealed that surgeons with an annual surgical volume >26 cases had patients with higher 3-year OS and DFS compared to surgeons with a volume <26 cases (3-year OS: 45.08% vs 43.33%; HR = 1.65 [1.16–1.35]; 3-year DFS: 25.23% vs 15.57%; HR = 1.58 [1.11–2.25]; all P < .01; Fig. 3C and D).
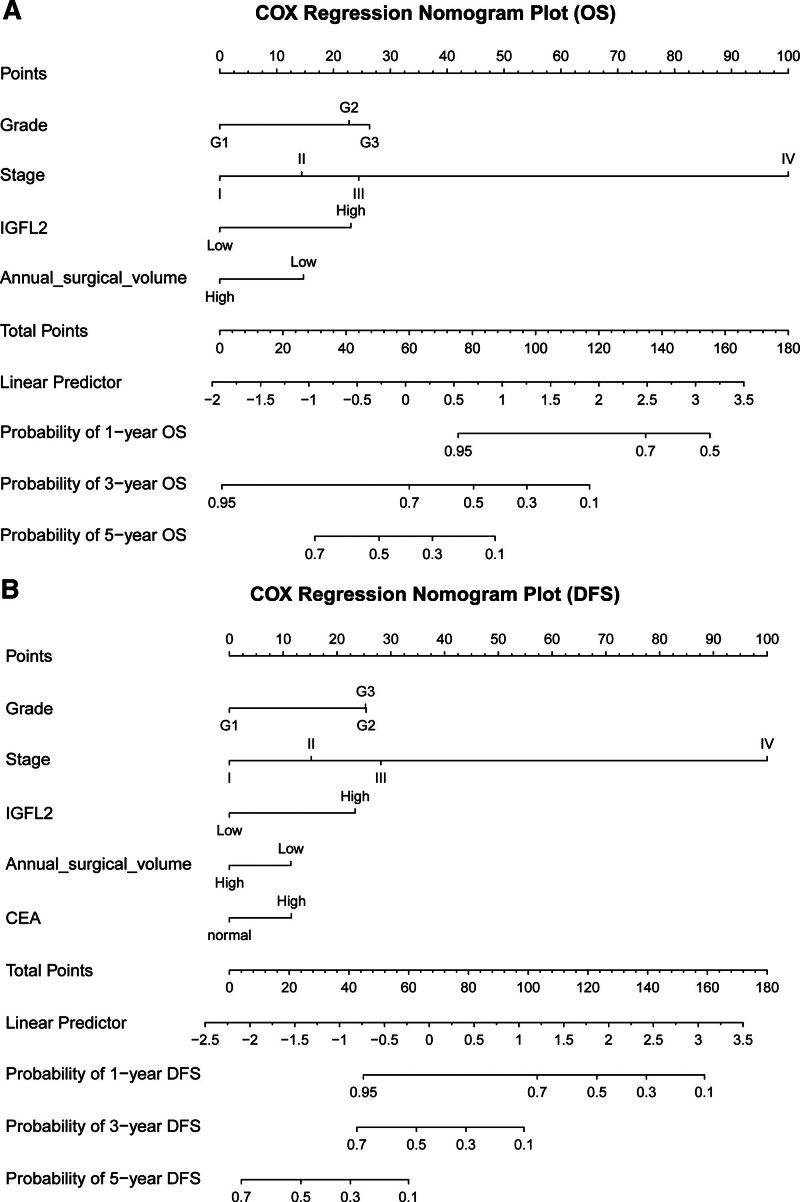
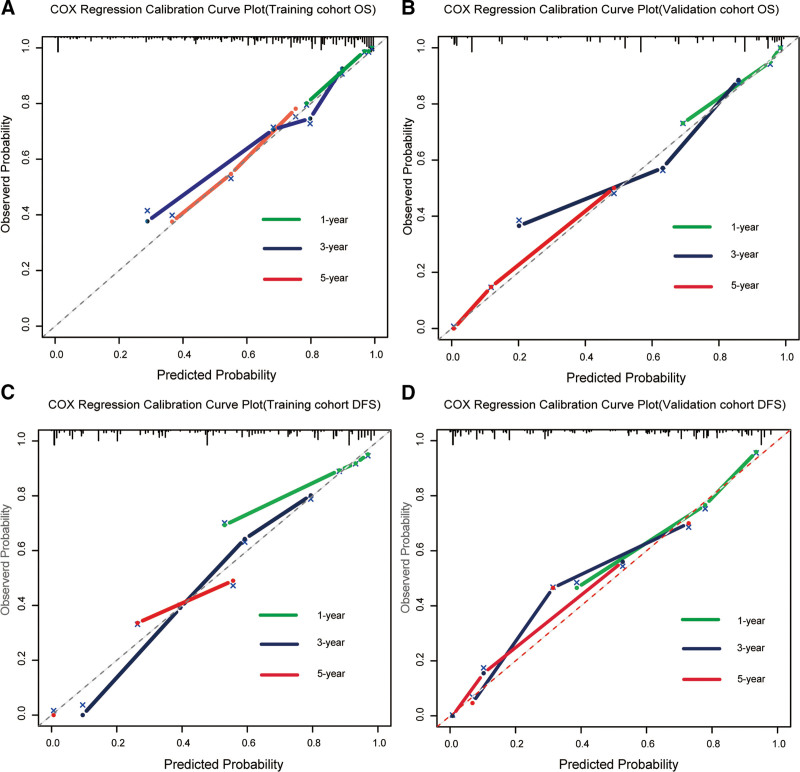
Nomograms were designed and validated to predict outcomes in patients with GC using key independent survival predictors. Using multivariate Cox regression, we created nomograms for calculating 1-year, 3-year, and 5-year OS and DFS, as illustrated in Fig. 4A and B. These nomograms scored each significant factor, summing them to project the OS and DFS at specified intervals. The training cohort exhibited concordance indices (C-indexes) of 0.732 (95% CI: 0.705–0.759) for OS and 0.742 (95% CI: 0.717–0.767) for DFS, with calibration plots closely aligned with the reference, suggesting model accuracy without the need for recalibration (Fig. 6). The validation cohort C-indexes were 0.749 (95% CI: 0.718–0.780) for OS and 0.753 (95% CI: 0.724–0.783) for DFS.
Figure 4.
Multivariable Cox regression nomogram for predicting 1-year, 3-year, and 5-year OS (A) and PFS (B) based on independent variables.
Figure 6.
Calibration plots for 1-year, 3-year, and 5-year OS and DFS using multivariable Cox regression in training (A and B) and validation groups (C and D).
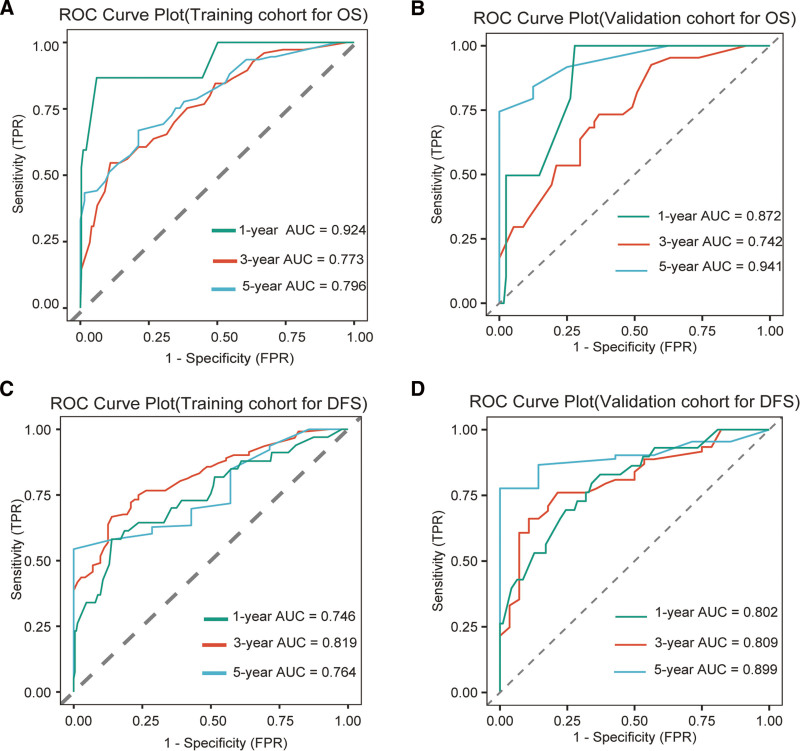
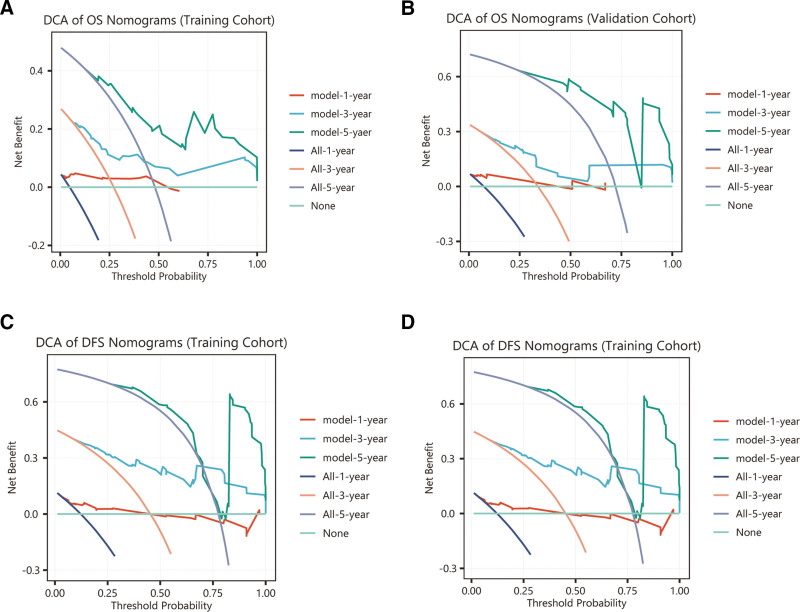
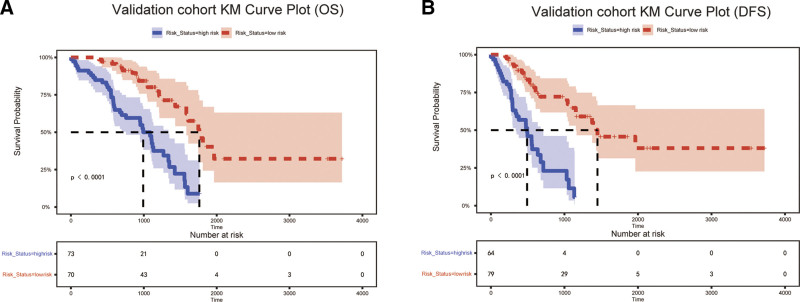
Receiver operating characteristic analysis confirmed the model’s robust with ness, area under the curve (AUC) values surpassing 0.7 in both groups, underscoring clinical applicability. Specifically, the AUCs for the 1-year, 3-year, and 5-year OS in the training cohort were 0.924, 0.773, and 0.796, respectively, and those in the validation cohort were 0.872, 0.742, and 0.941, respectively. For DFS, the training cohort AUCs were 0.746, 0.819, and 0.764, respectively, and for the validation cohort, they were 0.802, 0.809, and 0.899, respectively, indicating strong predictive performance (Fig. 5A–D). Calibration curves showed a good agreement between the predicted and observed survival rates for DFS and OS (Fig. 6). DCA across the 1-year, 3-year, and 5-year OS and PFS intervals demonstrated net benefits, affirming the model’s predictive accuracy (Fig. 7). KM plots from the risk model coefficients of the validation cohort showed that higher risk scores were correlated with poorer OS and DFS outcomes (all P < .01) (Fig. 8).
Figure 5.
Receiver operating characteristic (ROC) curves for 1-year, 3-year, and 5-year OS and PFS from multivariable Cox regression, evaluating training cohorts (A and B) versus validation cohorts (C and D).
Figure 7.
Decision curve analysis (DCA) for 1-year, 3-year, and 5-year OS and DFS from multivariable Cox regression across training cohorts (A and B) and validation cohorts (C and D).
Figure 8.
Kaplan–Meier survival plot for high and low-risk groups in the validation cohort about OS (A) and DFS (B).
Moreover, the predictive performance of the nomograms for both OS and DFS was better than that of the traditional TNM staging system in both the training and validation cohorts (Figure S2, Supplemental Digital Content, http://links.lww.com/MD/N667). The C-indices for TNM staging in predicting OS and DFS were 0.656 (95% CI: 0.628–0.683) and 0.662 (95% CI: 0.634–0.691) in the training cohort, respectively, and 0.700 (95% CI: 0.662–0.738) and 0.687 (95% CI: 0.651–0.723) in the validation cohort, respectively. These values were significantly lower than those obtained from our novel model, highlighting its enhanced predictive capability compared with the conventional TNM staging system.
4. Discussion
Stomach cancer is a significant health concern, particularly in East Asia. Early detection through screening is critical for its management.[14] For patients with advanced gastric cancer, surgery, particularly standard D2 lymph node dissection, is considered the most effective curative approach, and is believed to greatly improve survival rates.[15] Furthermore, the integration of surgery with chemotherapy,[16] targeted therapy,[10] or immunotherapy[11] has markedly improved the survival outcomes of advanced-stage cancer patients, demonstrating a substantial benefit over surgery alone. Therefore, enhancing surgical quality and discovering new therapeutic targets are vital for improving the long-term survival rates of patients with gastric cancer.
Japan’s surgical training system plays a crucial role in advancing surgical skills, leading to better patient outcomes in gastric cancer treatment.[17–19] Studies comparing the perioperative and long-term survival outcomes between Western patients undergoing gastrectomy before and after training in Japan have shown that post-training participants had higher rates of lymph node dissection, fewer complications, shorter hospital stays, and improved median survival.[20] These findings underscore the importance of comprehensive D2 lymph node dissection training for enhancing surgical proficiency, reducing postoperative complications, and increasing survival rates among patients with gastric cancer.
The relationship between hospital capacity and cancer survival rates has been rigorously examined in Japan. Research has found that the adjusted risk ratios for prevalent cancers, such as gastric and colon cancers, are significantly influenced by hospital capacity, with ratios being 0.76 for stomach cancer and 0.85 for colon cancer.[21] These data underscore the strong association between hospital capacity and the survival rates of patients with cancer. Additional studies have demonstrated that the mortality risks for stomach cancer at low-capacity facilities are 1.36 to 1.82 times greater than those at high-capacity hospitals,[22] suggesting that centralizing patients in specialized hospitals might improve survival outcomes.
In Western regions, such as Europe and the United States, the benchmark for high or low surgical volume is typically approximately 20 cases,[4] indicative of the rarer occurrence of the disease, whereas, in East Asia, it ranges from 20 to 50 cases.[5] In our study, we set the threshold to 26 cases, which aligned with the figures cited in previous studies. Despite the scarcity of data on the effect of individual surgeon volumes on patient survival, our research concentrated on how varying surgical volumes among surgeons affect survival in the Chinese context. The results indicated that both OS and DFS were considerably higher in patients managed by surgeons with higher case volumes, highlighting the importance of surgical expertise in enhancing patient outcomes.
The five-year survival rate in our cohort was notably lower than that reported in Japan, with several contributing factors identified: initially, the incidence of early gastric cancer in our study was approximately 10%, whereas advanced stages accounted for 70% to 80%, in contrast to Japanese statistics.[23] Moreover, unlike Japan’s stringent surgical accreditation system,[24,25] which standardizes surgical practices, China has lacked such standardization, with training often being mentor-based and variable in quality. However, recent advancements, such as live-streamed surgeries, have allowed Chinese surgeons to gain insights from global experts and improve their proficiency in advanced surgical techniques. Economic factors also played a role. A decade and a half ago, China’s lower development level meant that numerous patients were unable to afford the necessary follow-up treatments, adversely affecting survival rates.
In this study, IGFL2 expression was a prominent finding. Previous research on IGFL2 in pancreatic cancer, utilizing the TCGA database, linked high expression to a negative prognosis.[13] Unlike the previous studies, our investigation using clinical samples showed that high IGFL2 expression was correlated with TNM stage and grade classification. IGFL2 was also determined to be an independent risk factor for OS and DFS in our multifactorial Cox regression analysis, suggesting its potential as a novel marker for gastric cancer. Future studies using cellular and animal models are required to explore IGFL2’s specific role in gastric cancer development.
Our model, incorporating IGFL2, the surgeon’s annual surgical volume, TNM staging, CEA levels, and grade, among other factors, was stringently validated within the validation cohort, achieving receiver operating characteristic values >0.7. It outperformed the traditional TNM staging model across various metrics, including the C-index, calibration, and DCA curves. KM curves for the high-risk and low-risk groups, defined by risk coefficients, showed marked differences in survival within the validation cohort, highlighting the model’s robustness and predictive precision.
This study has some limitations, notably the time frame from 2008 to 2010, which aligns with the initial phase of laparoscopic surgery at our institution. In this early stage, the survival rates between laparoscopic and open surgeries showed no significant variance, possibly due to nascent adoption and fewer surgeries being performed. Furthermore, the scope of the study was constrained by its small sample size and single-center nature. To corroborate the observed differences in IGFL2 expression and its prognostic significance, it is imperative to broaden the research to include more centers and a larger sample size to enhance the robustness of the results.
In summary, our findings suggest that the annual surgical volume of gastric cancer surgeons and the expression levels of IGFL2 are closely associated with patient outcomes. To improve surgical outcomes and patient survival rates, it is crucial to develop a thorough surgical training and accreditation system for gastric cancer surgeons in China. Therefore, IGFL2 has emerged as a potential therapeutic target. Future efforts should focus on broadening the research base by including more sample centers and increasing the sample size to further investigate the differences in IGFL2 expression and delve into the underlying mechanisms and immune responses.
Author contributions
Conceptualization: Jinhui Wu, Miaomiao Li, Lixin Jiang.
Data curation: Zengwu Yao, Jinhui Wu, Miaomiao Li, Junping Han, Ruyue Chen, Lixin Jiang.
Formal analysis: Zengwu Yao, Jinhui Wu, Miaomiao Li, Junping Han, Ruyue Chen, Lixin Jiang.
Funding acquisition: Zengwu Yao, Jinhui Wu, Junping Han, Mi Jian, Jinchen Hu.
Investigation: Zengwu Yao, Jinhui Wu, Miaomiao Li, Junping Han, Zhensong Yang, Xixun Wang, Jinchen Hu, Lixin Jiang.
Methodology: Zengwu Yao, Jinhui Wu, Miaomiao Li, Junping Han, Zhensong Yang, Xixun Wang, Yifei Zhang, Jinchen Hu.
Project administration: Zengwu Yao, Xixun Wang.
Resources: Zengwu Yao, Jinhui Wu, Miaomiao Li, Ruyue Chen, Yifei Zhang, Lixin Jiang.
Software: Zengwu Yao, Jinhui Wu, Miaomiao Li, Junping Han, Ruyue Chen, Mi Jian, Yifei Zhang, Jinchen Hu, Lixin Jiang.
Supervision: Zengwu Yao, Jinhui Wu, Miaomiao Li, Junping Han, Ruyue Chen, Mi Jian, Yifei Zhang, Jinchen Hu, Lixin Jiang.
Validation: Zengwu Yao, Jinhui Wu, Miaomiao Li, Junping Han, Ruyue Chen, Mi Jian, Zhensong Yang, Xixun Wang, Jinchen Hu, Lixin Jiang.
Visualization: Zengwu Yao, Jinhui Wu, Miaomiao Li, Junping Han, Mi Jian, Zhensong Yang, Xixun Wang, Yifei Zhang, Jinchen Hu, Lixin Jiang.
Writing – original draft: Zengwu Yao, Jinhui Wu, Miaomiao Li, Junping Han, Yifei Zhang.
Writing – review & editing: Mi Jian, Xixun Wang, Jinchen Hu, Lixin Jiang.
Supplementary Material
Abbreviations:
- AUC
- area under the curve
- CEA
- carcinoembryonic antigen
- DCA
- decision curve analysis
- DFS
- disease-free survival
- FFPE
- formalin-fixed paraffin-embedded
- GC
- gastric cancer
- HR
- hazard ratio
- IGFL2
- insulin-like growth factor-like family member 2
- IHC
- immunohistochemistry
- KM
- Kaplan–Meier
- OS
- overall survival
- STAD
- stomach adenocarcinomas
- TCGA
- The Cancer Genome Atlas
This research is supported by the Shandong University Cooperation Project (3460019005), Shandong Province Medical and Health Technology Project (202304010040), and Yantai Science and Technology Plan (2023YD049).
The authors have no conflicts of interest to disclose.
The datasets generated during and/or analyzed during the current study are not publicly available, but are available from the corresponding author on reasonable request.
Supplemental Digital Content is available for this article.
How to cite this article: Yao Z, Wu J, Li M, Han J, Chen R, Jian M, Yang Z, Wang X, Zhang Y, Hu J, Jiang L. IGFL2 expression and surgical volume: Independent predictors of survival in gastric cancer. Medicine 2024;103:40(e39910).
ZY, JW, ML, JH, and RC contributed equally to this work.
Contributor Information
Zengwu Yao, Email: yzw1986yzw@126.com.
Jinhui Wu, Email: dezhouboy@163.com.
Miaomiao Li, Email: limiaomiao811017@aliyun.com.
Junping Han, Email: hanjp1223@163.com.
Ruyue Chen, Email: ruyuechen985@163.com.
Mi Jian, Email: jianmi1990@126.com.
Zhensong Yang, Email: yzs19990101@163.com.
Xixun Wang, Email: w70063@sina.com.
Yifei Zhang, Email: zyfaf@sina.com.
Jinchen Hu, Email: hujinchen2000@163.com.
References
- [1].Chandra R, Balachandar N, Wang S, Reznik S, Zeh H, Porembka M. The changing face of gastric cancer: epidemiologic trends and advances in novel therapies. Cancer Gene Ther. 2021;28:390–9. [DOI] [PubMed] [Google Scholar]
- [2].Solsky I, In H. Surgical treatment for gastric cancer. Gastrointest Endosc Clin N Am. 2021;31:581–605. [DOI] [PubMed] [Google Scholar]
- [3].Tan Z. Recent advances in the surgical treatment of advanced gastric cancer: a review. Med Sci Monit. 2019;25:3537–41. [DOI] [PMC free article] [PubMed] [Google Scholar]
- [4].Claassen YHM, van Amelsfoort RM, Hartgrink HH, et al. Effect of hospital volume with respect to performing gastric cancer resection on recurrence and survival: results from the CRITICS Trial. Ann Surg. 2019;270:1096–102. [DOI] [PubMed] [Google Scholar]
- [5].Ji J, Shi L, Ying X, Lu X, Shan F. Associations of annual hospital and surgeon volume with patient outcomes after gastrectomy: a systematic review and meta-analysis. Ann Surg Oncol. 2022;29:8276–97. [DOI] [PubMed] [Google Scholar]
- [6].Reis ME, Ulusahin M, Cekic AB, Usta MA, Guner A. Does surgeon specialization add value to surgeon volume in gastric cancer surgery? Eur J Surg Oncol. 2023;49:107091. [DOI] [PubMed] [Google Scholar]
- [7].Enzinger PC, Benedetti JK, Meyerhardt JA, et al. Impact of hospital volume on recurrence and survival after surgery for gastric cancer. Ann Surg. 2007;245:426–34. [DOI] [PMC free article] [PubMed] [Google Scholar]
- [8].Kim EY, Song KY, Lee J. Does hospital volume really affect the surgical and oncological outcomes of gastric cancer in Korea? J Gastric Cancer. 2017;17:246–54. [DOI] [PMC free article] [PubMed] [Google Scholar]
- [9].Asplund J, Mattsson F, Plecka-Östlund M, Markar SR, Lagergren J. Annual surgeon and hospital volume of gastrectomy and gastric adenocarcinoma survival in a population-based cohort study. Acta Oncol. 2022;61:425–32. [DOI] [PubMed] [Google Scholar]
- [10].Janjigian YY, Kawazoe A, Bai Y, et al. Pembrolizumab plus trastuzumab and chemotherapy for HER2-positive gastric or gastro-oesophageal junction adenocarcinoma: interim analyses from the phase 3 KEYNOTE-811 randomised placebo-controlled trial. Lancet. 2023;402:2197–208. [DOI] [PubMed] [Google Scholar]
- [11].Högner A, Moehler M. Immunotherapy in gastric cancer. Curr Oncol. 2022;29:1559–74. [DOI] [PMC free article] [PubMed] [Google Scholar]
- [12].Emtage P, Vatta P, Arterburn M, et al. IGFL: a secreted family with conserved cysteine residues and similarities to the IGF superfamily. Genomics. 2006;88:513–20. [DOI] [PubMed] [Google Scholar]
- [13].Wang Y, Yuan H, Yue G, et al. Pan-cancer analysis reveals IGFL2 as a potential target for cancer prognosis and immunotherapy. Sci Rep. 2023;13:6034. [DOI] [PMC free article] [PubMed] [Google Scholar]
- [14].Mabe K, Inoue K, Kamada T, Kato K, Kato M, Haruma K. Endoscopic screening for gastric cancer in Japan: current status and future perspectives. Dig Endosc. 2022;34:412–9. [DOI] [PubMed] [Google Scholar]
- [15].Ke B, Liang H. Current status of lymph node dissection in gastric cancer. Chin J Cancer Res. 2021;33:193–202. [DOI] [PMC free article] [PubMed] [Google Scholar]
- [16].Sakuramoto S, Sasako M, Yamaguchi T, et al. Adjuvant chemotherapy for gastric cancer with S-1, an oral fluoropyrimidine. N Engl J Med. 2007;357:1810–20. [DOI] [PubMed] [Google Scholar]
- [17].Goto K, Watanabe J, Nagasaki T, et al. Impact of the endoscopic surgical skill qualification system on conversion to laparotomy after low anterior resection for rectal cancer in Japan (a secondary analysis of the EnSSURE study). Surg Endosc. 2024;38:2454–64. [DOI] [PMC free article] [PubMed] [Google Scholar]
- [18].Akagi T, Endo H, Inomata M, et al. Clinical impact of Endoscopic Surgical Skill Qualification System (ESSQS) by Japan Society for Endoscopic Surgery (JSES) for laparoscopic distal gastrectomy and low anterior resection based on the National Clinical Database (NCD) registry. Ann Gastroenterol Surg. 2020;4:721–34. [DOI] [PMC free article] [PubMed] [Google Scholar]
- [19].Ichikawa N, Homma S, Hida K, et al. Impact of endoscopic surgical skill qualification on laparoscopic resections for rectal cancer in Japan: The EnSSURE Study. Ann Surg Open. 2022;3:e160. [DOI] [PMC free article] [PubMed] [Google Scholar]
- [20].Brind’Amour A, Gagné JP, Hogue JC, Poirier E. Impact of the introduction of formal D2 lymphadenectomy for gastric cancer in a Western setting. Can J Surg. 2021;64:E119–26. [DOI] [PMC free article] [PubMed] [Google Scholar]
- [21].Sato Y, Kaneko R, Yano Y, et al. Volume-outcome relationship in cancer survival rates: analysis of a regional population-based cancer registry in Japan. Healthcare (Basel). 2022;11:16. [DOI] [PMC free article] [PubMed] [Google Scholar]
- [22].Okawa S, Tabuchi T, Morishima T, Koyama S, Taniyama Y, Miyashiro I. Hospital volume and postoperative 5-year survival for five different cancer sites: a population-based study in Japan. Cancer Sci. 2020;111:985–93. [DOI] [PMC free article] [PubMed] [Google Scholar]
- [23].Kakinuma D, Arai H, Yasuda T, et al. Treatment of gastric cancer in Japan. J Nippon Med Sch. 2021;88:156–62. [DOI] [PubMed] [Google Scholar]
- [24].Mori T, Kimura T, Kitajima M. Skill accreditation system for laparoscopic gastroenterologic surgeons in Japan. Minim Invasive Ther Allied Technol. 2010;19:18–23. [DOI] [PubMed] [Google Scholar]
- [25].Tanigawa N, Lee SW, Kimura T, et al. The endoscopic surgical skill qualification system for gastric surgery in Japan. Asian J Endosc Surg. 2011;4:112–5. [DOI] [PubMed] [Google Scholar]
Associated Data
This section collects any data citations, data availability statements, or supplementary materials included in this article.


