Abstract
Introduction
Immunoglobulins (Ig) reactive with α-melanocyte-stimulating hormone (α-MSH), an anorexigenic neuropeptide, are present in humans and were previously associated with eating disorders. In this longitudinal study involving patients with anorexia nervosa (AN), we determined whether α-MSH in serum is bound to IgG and analyzed long-term dynamics of both α-MSH peptide and α-MSH-reactive Ig in relation to changes in BMI and gut microbiota composition.
Methods
The study included 64 adolescents with a restrictive form of AN, whose serum samples were collected at hospital admission, discharge, and during a 1-year follow-up visit and 41 healthy controls, all females.
Results
We found that in both study groups, approximately 40% of serum α-MSH was reversibly bound to IgG and that levels of α-MSH-reactive IgG but not of α-MSH peptide in patients with AN were low at hospital admission but recovered 1 year later. Total IgG levels were also low at admission. Moreover, BMI-standard deviation score correlated positively with α-MSH IgG in both groups studied but negatively with α-MSH peptide only in controls. Significant correlations between the abundance of specific bacterial taxa in the gut microbiota and α-MSH peptide and IgG levels were found in both study groups, but they were more frequent in controls.
Conclusion
We conclude that IgG in the blood plays a role as an α-MSH-binding protein, whose characteristics are associated with BMI in both patients with AN and controls. Furthermore, the study suggests that low production of α-MSH-reactive IgG during the starvation phase in patients with AN may be related to altered gut microbiota composition.
Keywords: Regulatory peptides, α-Melanocyte-stimulating hormone, Gut microbiota-brain axis, Autoantibodies, Eating disorders
Introduction
Regulation of motivated behavior and emotion involves neuronal and neuroendocrine signaling, where neuropeptides play an important role as modulators of neurotransmitter release and target cell activity [1]. With regard to the regulation of feeding behavior, α-melanocyte-stimulating hormone (α-MSH), a 13-amino-acid neuropeptide is known for its potent anorexigenic effect via activation of the melanocortin type 4 receptor (MC4R) [2]. α-MSH’s role in appetite regulation in the central nervous system was recently reviewed in this journal [3]. α-MSH is produced from its precursor proopiomelanocortin (POMC) expressed in the brain mainly in the hypothalamic arcuate nucleus and regulated by peripheral adiposity and metabolic factors such as leptin [4]. Hypothalamic POMC expression and α-MSH production is downregulated in conditions of insufficient food intake and body weight loss as an integral part of the homeostatic system involved in the long-term regulation of energy metabolism [5]. POMC is also expressed in the pituitary, skin, and gut, i.e., peripheral tissues, which may underlie picomolar concentrations of α-MSH found in the blood. Contribution of centrally produced α-MSH to its blood levels is also possible: for example, psychological stimulus in rats increases α-MSH in plasma [6]. Moreover, plasma levels of α-MSH are transiently elevated after a meal, suggesting a role of systemic α-MSH in the short-term regulation of appetite, but the source of such an increase was not established [7, 8]. Importantly, expression of the MC4R in peripheral tissues, for example, in the gut and autonomic nervous system, supports a role of the systemic α-MSH in the regulation of both appetite and energy metabolism [9–12].
A typical feature of most if not all peptide hormones is their binding to plasma proteins in systemic circulation. Such proteins protect the peptides from degradation by plasma peptidases but with relatively low binding affinity do not prevent peptide binding to specific high-affinity receptors [13]. It also implies that for an accurate measurement, peptides should be extracted from their binding proteins. For this purpose, commercial peptide assay kits recommend peptide extraction using the C18 column after plasma acidification, which favors the dissociation of peptides from binding proteins. Although the nature of peptide-binding proteins, with rare exceptions, was not determined, an a priori condition for a protein to play a role of peptide carrier is the reversibility of peptide binding [14]. Considering the natural occurrence of neuropeptide-reactive immunoglobulins (Ig) in the plasma of humans and rodents, IgG, as the most abundant, may serve as a neuropeptide carrier [15, 16]. Indeed, plasmatic IgG was shown to bind with micromolar affinity to α-MSH and to modulate its effect on the MC4R [17]. Nevertheless, a possibility that α-MSH may circulate in the blood bound to IgG was not directly verified.
Although α-MSH-reactive Ig is present in healthy humans, it can also be relevant to the pathophysiology of eating disorders (ED) characterized by multiple alterations of immunity including humoral responses [18, 19]. As such, plasma levels and properties of α-MSH-reactive IgG were associated with ED, first by showing their binding to the POMC neurons in the arcuate nucleus and then by correlations of their plasma levels with the ED Inventory scale (EDI-2) [20, 21]. Increased levels of autoantibodies reactive with hypothalamic tissue was another finding in patients with anorexia nervosa (AN) [22]. Moreover, IgG from patients with AN enhanced, but those from obese subjects decreased α-MSH-mediated cellular internalization of MC4R, i.e., revealing IgG modulatory effect on the α-MSH signaling involved in the regulation of appetite and body weight [17]. It remains however unknown whether α-MSH-reactive IgG may be associated with body mass index (BMI) changes, e.g., after refeeding and weight restoration in patients with AN.
The antigenic origin of IgG reacting with α-MSH may reside in microbial proteins displaying molecular mimicry to α-MSH produced by gut microbiota. One such antigen – the caseinolytic protease B (ClpB) – has been identified in Escherichia coli; as such, immunization of mice with ClpB stimulated the production of α-MSH-cross-reactive antibodies [23]. The involvement of gut microbiota in the regulation of physiology and behavior relevant to various chronic pathological conditions, including neuropsychiatric disorders, is increasingly recognized [24]. Intriguingly, a link between the melanocortin system gene expression and gut microbiota composition was reported in both humans and mice [25, 26]. Analysis of the gut microbiota composition in AN was also a topic of several original studies and systematic and mechanistic reviews [27–30]. While there is a consensus on the presence of dysbiosis in AN, the mechanisms linking gut microbiota composition to the pathogenesis of ED remain to be elucidated. As introduced above, α-MSH-reactive IgG enhancing α-MSH-mediated anorexigenic signaling may contribute to the pathophysiology of AN, thereby linking gut microbiota with the altered regulation of feeding behavior and emotion [31]. Of note, a recent study in patients with AN reported a negative association between the Shannon diversity index and serum levels of α-MSH-reactive IgG [32]. However, further research is needed to better understand the role of gut microbiota in the pathophysiology of AN, considering the absence of efficient pharmacological treatment [33].
In the present study, we aimed to determine whether α-MSH is bound to IgG in the systemic circulation and whether the α-MSH peptide and α-MSH-reactive IgG could be associated with BMI changes in patients with AN during a longitudinal study including hospital admission, discharge, and 1-year follow-up visit and compared to healthy controls (HCs). We also analyzed correlations between α-MSH-reactive Ig and gut microbiota composition available from a recent study performed on the same subjects [34].
Materials and Methods
Study Subjects, Blood Sampling, and Gut Microbiota Composition
A more detailed description of study subjects is available in a recent publication [34]. In brief, sixty-four female adolescents (aged between 12 and 20, mean 16 years) diagnosed with typical or atypical (1 patient) AN according to the DSM-5 were recruited at the Department for Child and Adolescent Psychiatry of the Rheinisch-Westfälische Technische Hochschule (RWTH) Aachen University Hospital and enrolled between December 2016 and January 2020. Forty-one age-matched female HCs with normal body weight (>20th and <80th age-adjusted percentile of BMI-standard deviation score [SDS]) were enrolled using newspaper advertisements. Written informed consent was obtained from the study participants and their legal guardians. The study, which was conducted under the Declaration of Helsinki, was approved by the Ethics Committee of the RWTH Aachen University Hospital (Approval No. EK 148-16). Clinical data included height and body weight after an overnight fast at admission and discharge, as well as weight and height before disease onset, weight loss prior to admission, and illness duration. For all time points, BMI as well as age- and sex-specific BMI percentiles and BMI-SDS was calculated based on German reference data from the KiGGS study [35]. Serum samples were collected from patients with AN at hospital admission (T0), discharge (T1), and during a 1-year follow-up visit (T2), as well as in HCs in corresponding periods. In this study, T1 and T2 correspond to the T7 and T8 periods, respectively, of the published study on microbiota composition in these subjects [34]. For this purpose, the fasting blood of the patients and HCs was collected between 7:00 and 10:00 a.m. Blood samples were centrifuged and the supernatant was immediately frozen at −80°C. The fecal samples were collected from both patients with AN and controls, and 16S rRNA gene sequencing and analyses were performed as previously described in detail [34].
α-MSH Peptide Assay
α-MSH concentrations were assayed in native serum as well as in the IgG-bound and IgG-free fractions of the same serum sample. In all 3 cases, α-MSH enzymatic immunoassay (EIA) kit (# EK-043-01) was used according to the manufacturer’s instructions (Phoenix Pharmaceuticals, Inc., Burlingame, CA, USA). In brief, serum samples were acidified and peptides extracted using a C-18 column and then diluted in the “assay buffer” provided in the kit. For the detection of IgG-bound and free α-MSH, IgG was extracted from serum samples using Protein-A Dynabeads (Thermo Fisher, Scientific, Waltham, MA, USA), and the effluents were collected for IgG-free α-MSH fraction assay. Then, IgG was eluted from the beads using the elution buffer (50 mm glycine pH 2.8) and used for IgG-bound α-MSH assay. For both IgG-bound and IgG-free α-MSH EIA, IgG-containing eluates and IgG-free effluents were acidified and peptides were extracted using C-18 columns as described above for the native serum. All assays were performed in duplicates. The schematic illustration of the assay is shown in online supplementary Figure 1 (for all online suppl. material, see https://doi.org/10.1159/000539316).
Serum Levels of α-MSH-Reactive IgG and IgM
Plasma levels of α-MSH-reactive IgG and IgM were measured using enzyme-linked immunosorbent assay (ELISA) according to a published protocol [36]. Briefly, α-MSH peptide (Bachem, Bubendorf, Switzerland) was coated onto 96-well Maxisorp plates (Nunc, Rochester, NY, USA) using 100 µL and a concentration of 2 µg/mL in 0.5 m NaCO3 and 0.5 m NaHCO3 buffer, pH 9.6 for 48 h at 4°C. The plates were washed (3x) in phosphate-buffered saline (PBS) with 0.05% Tween 200, pH 7.4, and then incubated for 3h at 37°C with 100 μL of human plasma diluted at 1:400 in PBS, pH 7.4, or with 3 m NaCl, 1.5 m Glycine, pH 8.9, for the assay of IgG-free or total levels, respectively. The plates were washed (3x) and incubated with 100 μL of alkaline phosphatase-conjugated antibodies in PBS (1:2,000, Sigma, St. Louis, MO, USA). Following washing (3x), 100 μL of p-nitrophenyl phosphate solution (Sigma, St. Louis, MO, USA) was added as a substrate. After 30 min of incubation at room temperature, the reaction was stopped by adding 3N NaOH. The optical density (OD) was determined at 405 nm using a microplate reader Infinite F200PRO. Blank OD values resulting from the reading of plates without the addition of plasma samples were subtracted from the sample OD values. Each determination was done in duplicate. The variation between duplicate values was lower than 5%.
Affinity Kinetics of α-MSH-Reactive IgG
Total IgG was extracted from serum using MelonGel® Purification Kit (LifeTechnologies, Carlsbad, CA, USA). Briefly, 500 µL of serum (diluted 1:4 vol. in purification buffer) was incubated in the mini-spin columns containing 500 µL of MelonGel® purification support for 5 min at room temperature. To collect purified IgG, columns were centrifuged for 30 s at 5,000 rpm and collected samples were lyophilized (Bioblock Scientific, Illkirch, France) for 48 h, resuspended in HBS-EP + buffer (Cytiva, Marlborough, MA, USA). IgG concentrations were evaluated using NanoDrop 2000C (ThermoFisher Scientific, Waltham, MA, USA). Affinity kinetics of serum-extracted IgG for α-MSH were analyzed by biospecific interaction assay based on surface plasmon resonance phenomenon on a Biacore T200 instrument (Cytiva), according to a previously published protocol [37]. α-MSH peptide (Bachem) was diluted at 0.1 mg/mL in 10 mm sodium acetate buffer, pH 4.5 (Cytiva), and was covalently coupled on the CM5 sensor chip (Cytiva). A multi-cycle affinity kinetic analysis method was run with five serial dilutions of purified IgG: 336, 168, 84, 42, 21 nm in HBS-EP + buffer (0.01 m HEPES, pH 7.4, 0.15 m NaCl, 0.003 mm EDTA, and 0.05% surfactant P20, Cytiva); each cycle included 120 s of analyte injection and 600 s of dissociation with a 30 µL/min flow speed at 4°C. Between sample injections, the binding surface was regenerated with glycine-HCl 10 mm, pH 2.5, resulting in a return of baseline level of the sensorgram. Affinity kinetic data were analyzed using T200 Evaluation 4.1.1 program (Cytiva) and fitted with Langmuir’s 1:1 model after blank values subtraction.
Statistical Analysis
Data were analyzed and graphs were plotted using the GraphPad Prism 5.02 (GraphPad Software Inc., San Diego, CA, USA). Normality was analyzed using the Kolmogorov-Smirnov test. Multiple groups were compared with ANOVA or Kruskal-Wallis test, according to normality with post-hoc Tukey’s or Dunn’s tests, respectively. Individual groups were compared by Student’s t test or Mann-Whitney test, according to the normality. Correlation analysis was performed using the Spearman’s or Pearson’s tests, according to normality. The group differences were considered statistically significant at p ≤ 0.05 and the data are presented as mean ± SEM, unless specified. For the analysis of BMI-stratified data, α-MSH outliers exceeding 200 pg/mL were excluded.
Results
BMI Changes
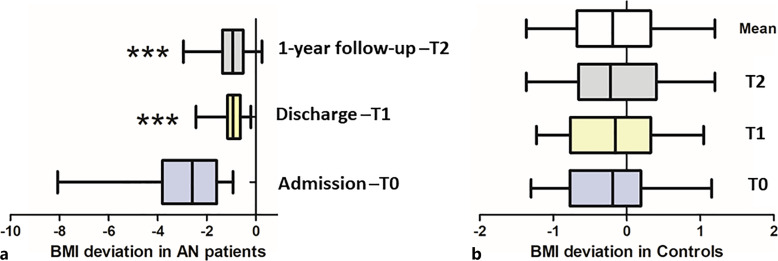
The group of patients with AN showed a significant increase in BMI at T1 and T2 compared to T0 but still lower than BMI-SDS values of HCs (Fig. 1a). The BMI-SDS of healthy subjects did not differ between the three time points (Fig. 1b) and their mean values were used as a reference for further comparison between the HC and AN groups. To analyze whether characteristics of α-MSH peptide and autoantibodies are associated with the efficiency of BMI recovery in patients with AN, they were divided into 3 subgroups according to BMI-SDS increase in T2 versus T0: (i) <2.5; (ii) 2.5–4.0; and (iii) >4.0.
Fig. 1.
BMI deviation from standard levels (BMI-SDS) in patients with AN (a) and HCs (b).
α-MSH Concentrations
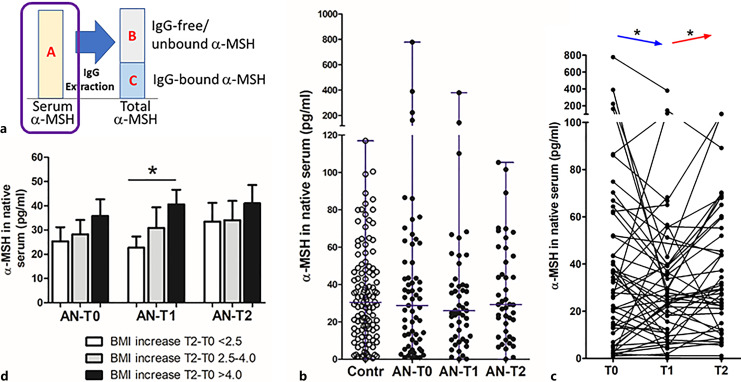
Concentrations of α-MSH were assayed in native serum as well as in IgG-free and IgG-bound fractions, in all cases after peptide extraction from binding proteins (online suppl. Fig. 1). In the native serum (Fig. 2a), α-MSH was detected in the picogram per ml range, was highly variable in both HCs and patients with AN, and displayed no significant differences among groups (Fig. 2b). Although the mean α-MSH levels in patients with AN did not significantly differ between 3 time points, the paired analysis revealed a decrease from T0 to T1 and an increase from T1 to T2 (Fig. 2c). After stratification of patients with AN according to BMI changes (T0 to T2), increased serum α-MSH concentrations at T1 were found in the subgroup with the highest BMI increase as compared with the subgroup with the lowest increase (Fig. 2d). Moreover, when estimated in relation to body weight, α-MSH concentration in native serum in patients with AN at T0 was higher compared to controls (1.3 ± 0.4 vs. 0.55 ± 0.04 pg/kg, respectively, Mann-Whitney test, p = 0.05).
Fig. 2.
Concentration of α-MSH in native serum. a Schematic illustration of α-MSH assay with the surrounded part presented in the figure. b Individual levels (with median) of α-MSH in healthy subjects (Contr) and patients with AN at 3 time points: T0:hospital admission, T1: at discharge, and T2: at 1-year follow-up visit. c Individual dynamics of α-MSH in patients with AN. d α-MSH levels according to BMI-SDS increase in T2 from T0 in patients with AN at 3 time points. Unpaired (d) and paired (c) t tests, *p < 0.05.
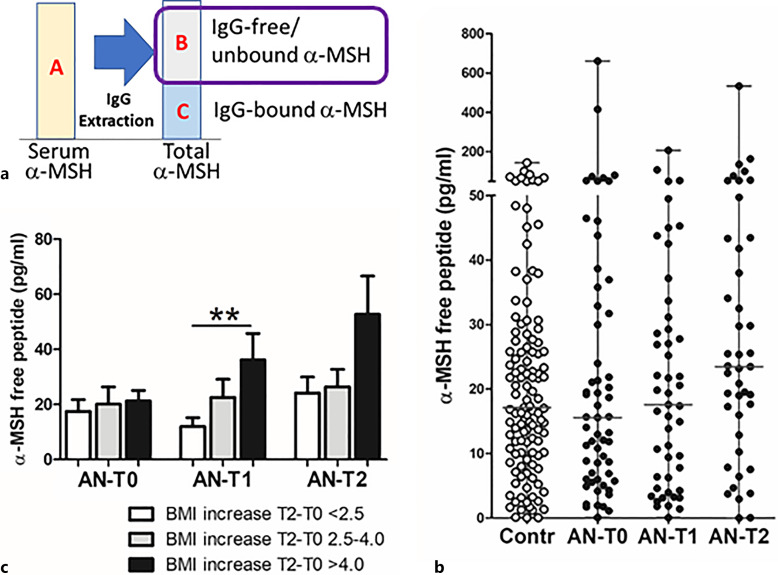
Mean concentrations of IgG-free α-MSH (Fig. 3a) did not significantly differ between patients with AN and controls, or between different time points in patients with AN (Fig. 3b). Paired analysis did not reveal significant changes of IgG-free α-MSH in patients with AN (online suppl. Table 1). Increased levels of IgG-free α-MSH were found at T1 in the subgroup with a higher BMI increase (Fig. 3c).
Fig. 3.
Concentration of IgG-free α-MSH. a Schematic illustration of α-MSH assay with the surrounded part presented in the figure. b Individual levels (with median) of IgG-free α-MSH in healthy subjects (Contr) and patients with AN at 3 time points: T0: hospital admission, T1: at discharge, and T2: at 1-year follow-up visit. c α-MSH levels according to BMI-SDS increase in T2 from T0 in patients with AN at 3 time points. Unpaired t test, **p < 0.01.
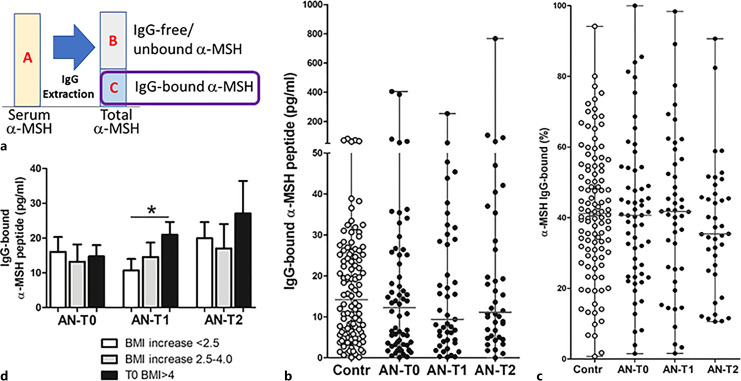
α-MSH was also readably detected at variable concentrations in the IgG effluents following IgG extraction from sera by the protein-A (Fig. 4a), without significant group differences between patients with AN and controls (Fig. 4b). The percentage of IgG-bound α-MSH was also highly variable, with mean levels around 40% in both patients with AN and controls without group differences (Fig. 4c). Increased levels of IgG-bound α-MSH were found at T1 in the subgroup with highest BMI increase (Fig. 4d). Paired analysis did not reveal significant changes of IgG-bound α-MSH in patients with AN (online suppl. Table 1). The levels of total α-MSH, i.e., the sum of the IgG-bound and -free peptide fractions, did not significantly differ among the groups and from the corresponding α-MSH concentrations measured in native serum (data not shown). Concentrations of α-MSH in native serum displayed strong positive correlations with both IgG-free and IgG-bound α-MSH as well as with total α-MSH, supporting the conclusion that both bound and free peptide fractions were the parts of α-MSH present in native serum (online suppl. Table 2).
Fig. 4.
Concentration of IgG-bound α-MSH. a Schematic illustration of α-MSH assay with the surrounded part presented in the figure. b Individual levels (with median) of IgG-bound α-MSH in healthy subjects (Contr) and patients with AN at 3 time points: T0: hospital admission, T1: at discharge, and T2: at 1-year follow-up visit. c Percentage (with median) of IgG-bound α-MSH. d α-MSH levels according to BMI increase in T2 from T0 in patients with AN at 3 time points. Unpaired t test, *p < 0.05.
α-MSH-Reactive IgM and IgG and Affinity Kinetics of IgG for α-MSH
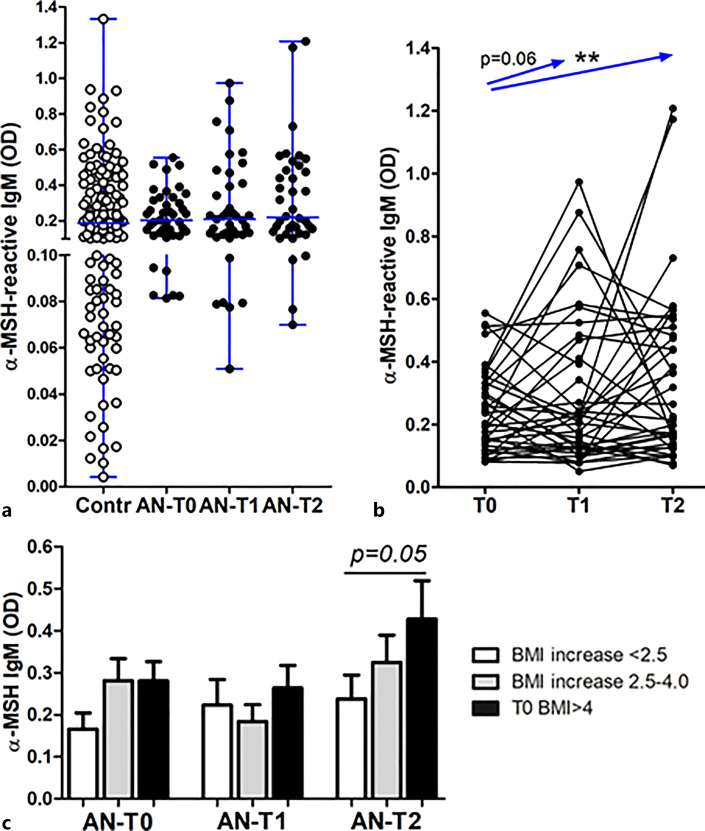
Mean serum levels of α-MSH-reactive IgM did not significantly differ between patients and controls and between different time points in patients with AN (Fig. 5a). However, the paired analysis showed a significant increase in T0 versus T2 and the same trend in T0 versus T1 (Fig. 5b). Increased levels of α-MSH-reactive IgM at T2 were associated with patients with AN with the highest BMI recovery (Fig. 5c).
Fig. 5.
a Individual serum levels (with median) of α-MSH-reactive IgM in healthy subjects (Contr) and patients with AN at 3 time points: T0: hospital admission, T1: at discharge, and T2: at 1-year follow-up visit. b Individual dynamics of α-MSH-reactive IgM in patients with AN. c α-MSH-reactive IgM levels according to BMI-SDS increase in T2 from T0 in patients with AN at 3 time points. Paired (b) and unpaired (c) t tests, **p < 0.01, unless specified.
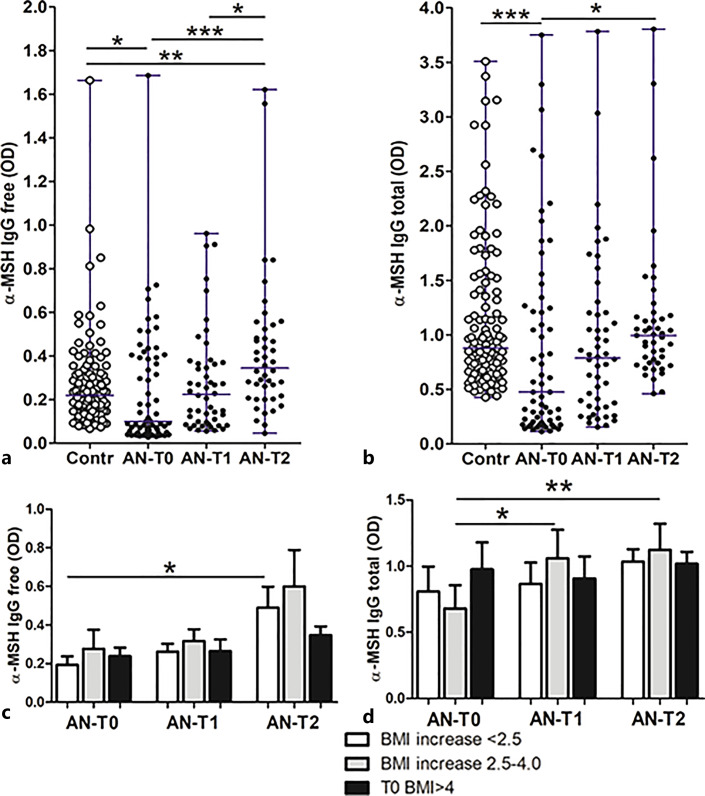
Serum levels of both α-MSH-reactive free and total IgG were significantly lower at T0 in patients with AN compared to controls, as well as to the T2 time point (Fig. 6a, b). The paired analysis also revealed a significant increase in T0 versus both T1 and T2 time points and also in T1 versus T2 (not shown). An increase of α-MSH-reactive free IgG at T2 was, however, associated with the lowest BMI changes (Fig. 6c), while an increase of α-MSH-reactive total IgG was noticed in the group with a medium increase of BMI (Fig. 6d). Total IgG concentrations were also measured during IgG extraction from serum. Patients with AN had strongly reduced total IgG levels at T0 as compared to both follow-up time points and to the controls (online suppl. Fig. 2).
Fig. 6.
Individual serum levels (with median) of α-MSH-reactive free (a) and total (b) IgG in healthy subjects (Contr) and patients with AN at 3 time points: T0: hospital admission, T1: at discharge, and T2: at 1-year follow-up visit. α-MSH-reactive free IgG (c) and total IgG (d) levels according to BMI increase in T2 from T0 in patients with AN at 3 time points. a, b Kruskal-Wallis tests, p < 0.0001; Dunn’s post-tests, *p < 0.05, **p < 0.01, and ***p < 0.001. c, d Unpaired t tests, *p < 0.05, **p < 0.01.
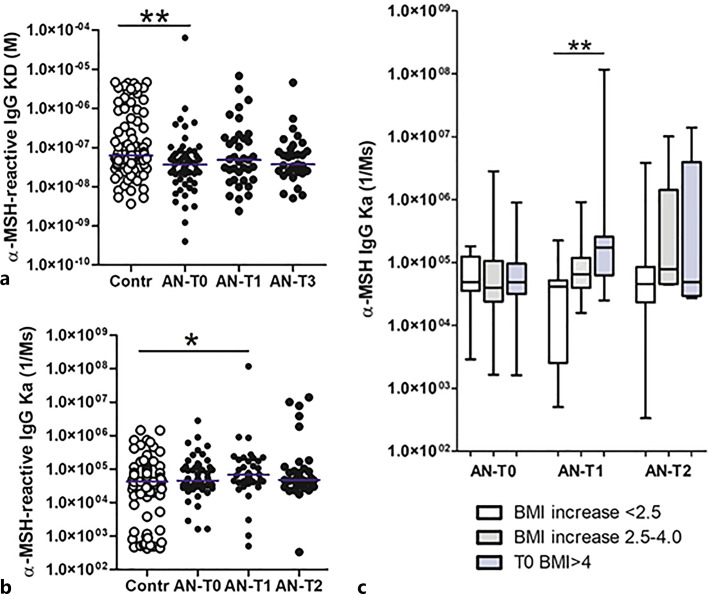
Affinity kinetics analysis of serum-extracted IgG revealed lower dissociation equilibrium constant (KD) values in patients with AN at T0, reflecting an affinity binding of IgG for α-MSH higher than in controls (Fig. 7a). Increased association constant values (Ka) in patients with AN were noticed at T1 (Fig. 7b), while the dissociation constants (Kd) did not significantly differ (online suppl. Fig. 2a). An increased association constant at T1 also predicted the best BMI recovery in patients with AN at T2 (Fig. 7c), while other parameters of the affinity kinetics were not significantly associated with BMI changes (online suppl. Fig. 3b, c). α-MSH concentrations in native serum displayed positive correlations with α-MSH-reactive total IgG, IgM, and the association rate Ka values in HCs and with α-MSH-reactive free IgG in patients with AN (online suppl. Table 3).
Fig. 7.
Individual values (with median) of the dissociation equilibrium constant reflecting affinity (a) and the association rate (b) of serum IgG for α-MSH in healthy subjects (Contr) and patients with AN at 3 time points: T0: hospital admission, T1: at discharge, and T2: at 1-year follow-up visit. c Association rates of serum IgG for α-MSH according to BMI increase in T2 from T0 in patients with AN at 3 time points. a Kruskal-Wallis tests, p < 0.001; Dunn’s post-test, **p < 0.01; Kruskal-Wallis test, p < 0.05; *Mann-Whitney test, p < 0.05. c Unpaired t tests, **p < 0.01.
Correlations of α-MSH and α-MSH-Reactive Ig with BMI and Disease Duration
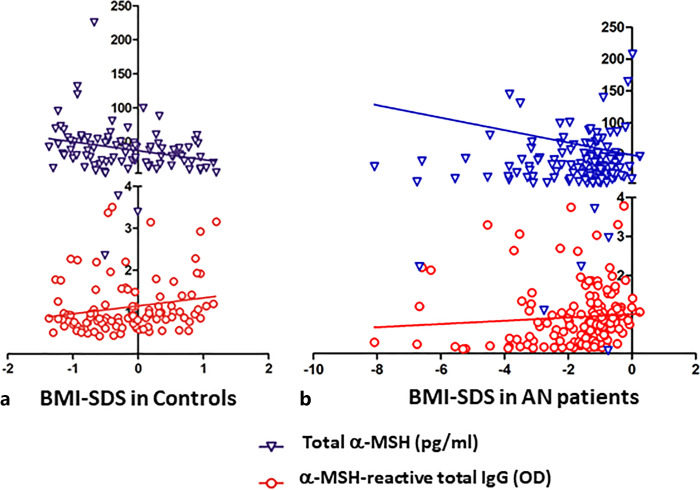
Significant negative correlations between BMI-SDS and α-MSH peptide, as assayed either in native serum or in IgG-free or IgG-bound fractions, were found in HCs but not in patients with AN (online suppl. Table 4; Fig. 8a). In contrast, positive correlations between BMI-SDS and α-MSH-reactive total IgG were found in both HCs and patients with AN (online suppl. Table 4; Fig. 8a, b) and in patients with AN BMI-SDS also correlated positively with α-MSH-reactive free IgG. Disease duration in patients with AN correlated negatively with α-MSH-reactive free IgG levels and the IgG association rate values (online suppl. Table 4). An increase of BMI-SDS in patients with AN in T0 versus T2 also correlated positively with a corresponding increase of α-MSH peptide concentrations in native serum (Spearman’s r = 0.3, p < 0.05) and with an increase of the IgG association rate values for α-MSH (Spearman’s r = 0.48, p < 0.01).
Fig. 8.
Correlations between BMI-SDS and serum levels of total α-MSH peptide and α-MSH-reactive total IgG in healthy subjects (a) and patients with AN all 3 time points combined (b). Spearman’s correlations for the levels of total α-MSH peptide, r = −0.31, p = 0.003 in controls and r = 0.04, p = 0.6 in patients with AN; for the levels of α-MSH-reactive total IgG, r = 0.25, p = 0.01 in controls and r = 0.028, p = 0.0007 in patients with AN.
Correlations of α-MSH and α-MSH-Reactive Ig with Gut Microbiota Composition
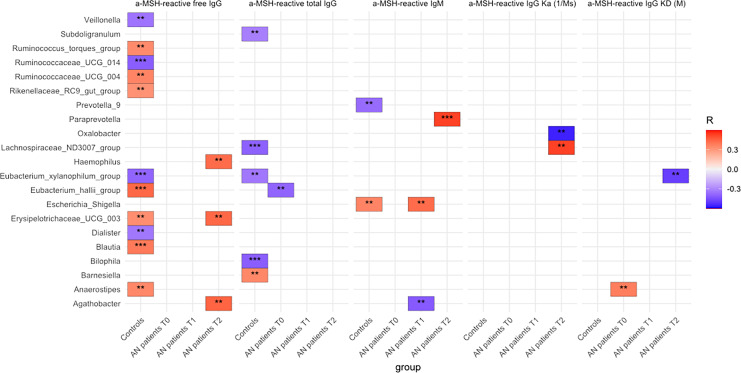
Several significant correlations between both α-MSH peptide and α-MSH-reactive Ig with the abundance of various bacterial taxa were found in HCs and patients with AN at all the 3 time points (online suppl. Tables 5–8). By analyzing the strongest correlations (p < 0.001) for α-MSH-reactive Ig levels and properties, it appears that only a few such correlations were present in patients with AN at T0 and T1. At the same time, they were more numerous in HCs (Fig. 9). Nevertheless, a significant association with affinity kinetic parameters was found in patients with AN but not in controls (Fig. 9).
Fig. 9.
Correlations (Spearman’s r, p < 0.01** and p < 0.001***) between α-MSH-reactive Ig and specific taxa of fecal microbiota composition in patients with AN and controls. Positive correlations are highlighted in red and negative in blue.
Discussion
In the present study, we analyzed longitudinal dynamics of serum α-MSH peptide and α-MSH-reactive Ig in a cohort of adolescent patients with AN and age- and sex-matched controls. The findings substantiate the involvement of α-MSH-reactive Ig in α-MSH signaling, highlighting their relevance to the anorexigenic effects of α-MSH in modulating energy balance under both physiological conditions and within the context of ED.
First of all, as a fundamental contribution to the neuroendocrinology field, we identified IgG as a physiological carrier protein for α-MSH, accounting for an average of 40% of serum α-MSH immunoreactivity detected by the commercial EIA kit used in our study. Indeed, IgG extracted from serum by the protein-A chromatography retained α-MSH peptide, which was then detected following IgG elution and separation by sample acidification. While all the study subjects displayed IgG-bound α-MSH, the percentage of such binding was variable and ranged from 1 to 80% of the total α-MSH peptide, a phenomenon that may underlie individual differences in α-MSH signaling. We did not find significant differences between the levels of the total α-MSH peptide, i.e., a sum of IgG bound and IgG free/unbound as compared to the α-MSH levels in native serum, suggesting that in general, IgG does not prevent the peptide detection in native serum. We cannot exclude, however, that some α-MSH is separated from IgG during the peptide extraction step and the actual physiological carrier capacity of IgG is higher than one measured after IgG elution (i.e., it could be higher than the average of 40%). The role of IgG as an α-MSH carrier protein implies that IgG levels and binding capacities should be relevant to α-MSH signaling.
By measuring α-MSH peptide in the native serum as well as in the IgG-bound and -free fractions, we found that in such preparations its concentration was highly variable in both patients with AN and HCs. Although most of the peptide was detected between 10 and 40 pg/mL, some subjects displayed lower or higher levels, with 1 AN patient reaching 800 pg/mL at T0. Such a high variability does not support the utility of α-MSH as a reliable biomarker of energy metabolism status, and we did not find significant differences in its mean level between the groups of patients with AN and controls. This finding may nevertheless be of pathophysiological significance, since starvation and body weight loss should downregulate POMC expression, with a corresponding decrease in α-MSH production.
Thus, although serum α-MSH levels appear to be highly individual, its decrease should be expected in acute AN, unless the homeostatic mechanism regulating energy balance is altered. Several earlier studies have analyzed circulating α-MSH levels in patients with AN. Two studies reported lower α-MSH levels in patients with AN versus controls [7, 32], another two found no differences [38, 39], and one indicated an increase by measuring POMC levels [22]. By analyzing longitudinal α-MSH dynamics in AN adolescents, we found that serum α-MSH levels change with time in the same patient, and that there was a decrease of α-MSH levels from hospital admission to discharge, but an increase after 1 year. Such changes may reflect both homeostatic and pathophysiological mechanisms affecting α-MSH production and signaling. We suggest that a decrease of α-MSH at T1 can be related to the treatment effect to reduce individually elevated levels of the peptide at T0, while an increase at T2 may reflect mainly the homeostatic process associated with BMI recovery, which is already visible in those patients at T1 who displayed higher levels of α-MSH compared to those patients who will relapse. Increased POMC levels in the cerebrospinal fluid were also associated with long-term body weight gain in patients with AN [40]. Thus, by showing individual dynamics of α-MSH peptide associated with the disease duration and BMI changes, the present results do not contradict the previous data in patients with AN.
Of particular interest is the finding of significant negative correlations between α-MSH and BMI-SDS in HCs. Since this small variation of BMI reflects physiological deviations from the mean BMI values in healthy female adolescents, it suggests that higher levels of α-MSH in the circulation of healthy subjects may promote lower BMI, i.e., further supports that peripheral α-MSH exerts a physiological anorexigenic effect. These results corroborate a previous study that showed a negative correlation of serum α-MSH with BMI-SDS in children who successfully lost weight after a lifestyle intervention against obesity [8]. Thus, although the functional implication of peripheral α-MSH in regulating appetite and body weight is still debated, our study supports such a role. Furthermore, a decrease of α-MSH from T0 to T1 revealed by the paired analysis in patients with AN points to the possible relevance of such elevation in anorexigenic signaling in acute AN.
A previous study established that plasmatic IgG modulates α-MSH signaling on MC4R, resulting in different rates of receptor internalization, which was reduced by IgG from obese individuals, but increased by IgG from patients with AN [17]. The present study extends these data by revealing a carrier role of IgG for α-MSH. Furthermore, significant positive correlations between α-MSH-reactive total IgG levels and BMI-SDS were found in both HCs and patients with AN, supporting a physiological role of such IgG in reducing α-MSH-mediated anorexigenic effects. It is important to emphasize that in HCs only α-MSH-reactive IgG, measured as a total fraction by using a dissociative buffer, displays such correlations, suggesting that an increase of binding properties of IgG should be favorable for reducing anorexigenic effects of α-MSH.
One of the main findings of our study was low levels of α-MSH-reactive IgG in patients with AN at admission. Low total serum IgG concentrations found in patients at this time point are most likely the main cause of such decrease. However, a deficient stimulation of the immune system by α-MSH-like antigens may also be a contributing factor, since the levels of α-MSH-reactive IgG were still lower at hospital discharge than at 1-year follow-up visit, while no such differences were observed for the total IgG concentrations. Low level of total IgG in patients at admission is puzzling and cannot be fully explained by malnutrition. One possibility is a missing IgG triggering role of specific bacterial taxa in gut microbiota. Indeed, some studies using germ-free mice revealed such a role, e.g., for E. coli [41, 42].
A decrease in the IgG-producing subset of B cells, associated with body weight loss, was previously reported in adolescent patients with AN, likely reflecting the same phenomenon of low IgG production found in our study [43]. Since no expected decrease of serum α-MSH levels was observed at T0 in patients with AN, we may speculate that a deficit in α-MSH-reactive IgG levels might be causative. This, in turn, might be further influenced by insufficient stimulation by gut microbiota-derived bacterial antigens homologous to α-MSH, as discussed below. Of interest, decreased levels of α-MSH-reactive IgA, but not IgG, in patients with AN were reported by Roubalova and colleagues [32]. The follow-up analysis in patients with AN showed an increase of α-MSH-reactive IgG levels at both T1 and T2, which was associated generally with BMI-SDS improvement. However, by stratifying by BMI changes, we found that an increase of the total IgG, but not free IgG, was associated with a better BMI outcome. An earlier study also showed that higher levels of free α-MSH-reactive IgG were associated with elevated EDI-2 scores [21].
The analysis of affinity kinetics of IgG surprisingly revealed that the affinity for α-MSH in patients with AN at T0 was higher than in HCs, while this difference was not then found at the T1 and T2 time points. While the functional significance of this finding is presently unclear, it witnesses an altered α-MSH-like antigenic stimulation in the acute stage of AN, probably linked with the low serum levels of α-MSH-reactive IgG. It is possible that such an increase of affinity, which is in reality an avidity of multiple IgG, can be related to the impoverishment of multiple antigens favoring single antigenic stimulation, which can be the α-MSH peptide itself. On the one hand, from the functional point of view, we can speculate that an increase of IgG affinity for α-MSH by cross-reactivity with ClpB may neutralize satietogenic effects of this protein, representing a higher risk of developing a mixed type of AN with binge eating/purging episodes [31]. On the other hand, an increase of the α-MSH IgG association rate at T1 and T2 was connected with a better BMI recovery, confirming the data of positive correlations between BMI-SDS and α-MSH-reactive total IgG levels.
In the present study, we also tested our hypothesis that levels and properties of α-MSH-reactive IgG may be linked to gut microbiota composition. This hypothesis is mainly based on the earlier identification of the enterobacterial ClpB protein as an antigen mimetic of α-MSH [23]. Other studies suggested that dysregulated immune responses in patients with AN can be induced by intestinal antigens [44]. The Enterobacteriaceae family is a common constituent of healthy gut microbiota, which includes generally commensal species that may become pathogenic in various contexts, such as overgrowth. However, this family is typically a minority in the healthy gut and other microorganisms may influence the production of Ig cross-reacting with α-MSH. Indeed, in this study, we found that levels of α-MSH-reactive IgG correlate with the abundance of several bacterial species. Such correlations should however be interpreted with caution because they do not signify causality. Further analysis involving proteomics is needed to identify and validate the bacterial proteins as potential antigen mimetics of α-MSH. Moreover, while positive correlations suggest a direct antigenic effect of bacteria, the interpretation of negative correlations is problematic, if not random, and could also reflect antagonistic relations between bacterial species. Below we focus on the most significant positive correlations with gut microbiota as shown in Figure 9.
As the first expected bacterial target, we found positive correlations between α-MSH-reactive IgM and the Escherichia-Shigella group, which were present in HCs and also appeared at T1 in patients with AN. The absence of a correlation at T0 is most likely related to the lower abundance of Enterobacteriaceae detected in patients with AN for this time period [45]. However, an increase in the abundance of this bacterial family between discharge and 1-year follow-up was associated with insufficient weight recovery [34]. Other cross-sectional studies showed either an increase or no significant difference in Enterobacteriaceae abundance in AN [28, 32, 46]. α-MSH-reactive IgM at T2 also positively correlated with Paraprevotella. An increase of α-MSH-reactive IgM from T0 to T2 was associated with BMI improvement and may lay the ground for the class switch of IgM to IgG underlying the recovery of α-MSH-reactive IgG at T2. An earlier study also showed that higher levels of α-MSH-reactive IgM were associated with a better psychological profile as reflected by lower EDI scores [21]. Other significant changes in the microbiota composition of patients with AN found at admission in our study included an increased abundance of Lachnospiraceae and a decrease in Romboutsia [45]. Here, we found that both taxa correlated with α-MSH biomarkers; however, since both positive and negative correlations were found, it is presently difficult to functionally interpret this finding. Significant positive correlations of α-MSH-reactive IgG with Blautia were found in controls, and interestingly, this genus was previously reported to be reduced in patients with AN [30, 47]. Roseburia is also a typically reduced taxa in AN found by other investigators [30, 46, 48]. Weak correlations of Roseburia with levels of both α-MSH peptide and IgG were found in patients with AN. Thus, the present study suggests that besides the species belonging to Enterobacteriaceae, there are other bacterial taxa associated with levels and affinities of α-MSH-reactive IgG and of α-MSH peptide concentration. Nevertheless, although significant, relatively weak correlations with gut microbiota composition may also be random findings and should be taken with caution.
In conclusion, this study identified IgG as a physiological α-MSH carrier protein and demonstrated the dynamics of the α-MSH peptide and α-MSH-reactive Ig in adolescents with AN, revealing their associations with BMI changes and with gut microbiota composition. In particular, the finding of low levels of α-MSH-reactive IgG, but not α-MSH peptide, found in starving patients with AN, may signify altered homeostatic regulation of energy metabolism with an insufficient immune control of α-MSH signaling, i.e., favoring its anorexigenic effect. Moreover, increased levels of α-MSH-reactive total IgG were associated with better BMI recovery in patients with AN and with higher BMI-SDS in both patients with AN and healthy adolescents. In contrast, increased levels of α-MSH-reactive free IgG were mainly associated with the AN phenotype. To highlight the potential clinical relevance of our results, we speculate that stimulation of α-MSH cross-reactive IgG production, which should increase the pool of its total fraction, may appear as an etiological therapeutic strategy in AN. Such a strategy, which is greatly promoted by refeeding, may additionally include supplementation of commensal and probiotic bacteria able to induce the physiological immune response and contribute to the normalization of α-MSH signaling. For this purpose, identifying and validating specific probiotic strains is warranted in both preclinical and clinical studies.
Acknowledgments
We thank Targedys SA, France, for providing the Biacore T200 instrument.
Statement of Ethics
Written informed consent was obtained from the study participants and their legal guardians. The study, which was conducted under the Declaration of Helsinki, was approved by the Ethics Committee of the RWTH Aachen University Hospital (Approval No. EK 148-16).
Conflict of Interest Statement
The authors declare no conflict of interest concerning this study.
Funding Sources
This study was supported by the ERANET Neuron MiGBAN consortium (01EW1906A-01 EW1906B), “Microbiome Gut-Brain Axis in Anorexia Nervosa,” funded by the European Union (EU), the German Ministry for Education and Research (BMBF), and the French Agence Nationale de la Recherche (ANR). S.O.F. research was also supported by the PTM2 program, in Inserm, France.
Author Contributions
Conceptualization and writing – original draft preparation: S.O.F.; methodology and data curation: J.S., J. B., and S.O.F.; investigation: J.S., E.L., B.T., S.T., and N.A.A.; writing – review and editing: J.S., J.B., N.C., and N.A.A; and project administration and funding acquisition: B.H.-D., J.S., J.B., and S.O.F. All authors have read and agreed to the published version of the manuscript.
Funding Statement
This study was supported by the ERANET Neuron MiGBAN consortium (01EW1906A-01 EW1906B), “Microbiome Gut-Brain Axis in Anorexia Nervosa,” funded by the European Union (EU), the German Ministry for Education and Research (BMBF), and the French Agence Nationale de la Recherche (ANR). S.O.F. research was also supported by the PTM2 program, in Inserm, France.
Data Availability Statement
Data available on request due to privacy/ethical restrictions. Further inquiries can be directed to the corresponding author.
Supplementary Material.
Supplementary Material.
Supplementary Material.
Supplementary Material.
References
- 1. Hökfelt T, Barde S, Xu ZQD, Kuteeva E, Rüegg J, Le Maitre E, et al. Neuropeptide and small transmitter coexistence: fundamental studies and relevance to mental illness. Front Neural Circuits. 2018;12:106. [DOI] [PMC free article] [PubMed] [Google Scholar]
- 2. Fan W, Boston BA, Kesterson RA, Hruby VJ, Cone RD. Role of melanocortinergic neurons in feeding and the agouti obesity syndrome. Nature. 1997;385(6612):165–8. [DOI] [PubMed] [Google Scholar]
- 3. Wu Q, Chen J, Hua T, Cai J. Alpha-melanocyte-stimulating hormone-mediated appetite regulation in the central nervous system. Neuroendocrinology. 2023;113(9):885–904. [DOI] [PubMed] [Google Scholar]
- 4. Cone RD. Anatomy and regulation of the central melanocortin system. Nat Neurosci. 2005;8(5):571–8. [DOI] [PubMed] [Google Scholar]
- 5. Hillebrand JJ, de Wied D, Adan RA. Neuropeptides, food intake and body weight regulation: a hypothalamic focus. Peptides. 2002;23(12):2283–306. [DOI] [PubMed] [Google Scholar]
- 6. de Rotte AA, van Egmond MA, van Wimersma Greidanus TB. Alpha-MSH levels in cerebrospinal fluid and blood of rats during behavioral manipulations. Physiol Behav. 1982;28(5):765–8. [DOI] [PubMed] [Google Scholar]
- 7. Galusca B, Prévost G, Germain N, Dubuc I, Ling Y, Anouar Y, et al. Neuropeptide Y and α-MSH circadian levels in two populations with low body weight: anorexia nervosa and constitutional thinness. PLoS One. 2015;10(3):e0122040. [DOI] [PMC free article] [PubMed] [Google Scholar]
- 8. Roth CL, Enriori PJ, Gebhardt U, Hinney A, Muller HL, Hebebrand J, et al. Changes of peripheral alpha-melanocyte-stimulating hormone in childhood obesity. Metabolism. 2010;59(2):186–94. [DOI] [PubMed] [Google Scholar]
- 9. Berglund ED, Liu T, Kong X, Sohn J-W, Vong L, Deng Z, et al. Melanocortin 4 receptors in autonomic neurons regulate thermogenesis and glycemia. Nat Neurosci. 2014;17(7):911–3. [DOI] [PMC free article] [PubMed] [Google Scholar]
- 10. Panaro BL, Tough IR, Engelstoft MS, Matthews RT, Digby GJ, Møller CL, et al. The melanocortin-4 receptor is expressed in enteroendocrine L cells and regulates the release of peptide YY and glucagon-like peptide 1 in vivo. Cell Metab. 2014;20(6):1018–29. [DOI] [PMC free article] [PubMed] [Google Scholar]
- 11. Wan S, Browning KN, Coleman FH, Sutton G, Zheng H, Butler A, et al. Presynaptic melanocortin-4 receptors on vagal afferent fibers modulate the excitability of rat nucleus tractus solitarius neurons. J Neurosci. 2008;28(19):4957–66. [DOI] [PMC free article] [PubMed] [Google Scholar]
- 12. Gautron L, Lee C, Funahashi H, Friedman J, Lee S, Elmquist J. Melanocortin-4 receptor expression in a vago-vagal circuitry involved in postprandial functions. J Comp Neurol. 2010;518(1):6–24. [DOI] [PMC free article] [PubMed] [Google Scholar]
- 13. Værøy H, Lahaye E, Dubessy C, Benard M, Nicol M, Cherifi Y, et al. Immunoglobulin G is a natural oxytocin carrier which modulates oxytocin receptor signaling: relevance to aggressive behavior in humans. Discov Ment Health. 2023;3(1):21. [DOI] [PMC free article] [PubMed] [Google Scholar]
- 14. Zhao XJ, Hoheisel G, Schauer J, Bornstein SR. Corticotropin-releasing hormone-binding protein and its possible role in neuroendocrinological research. Horm Metab Res. 1997;29(8):373–8. [DOI] [PubMed] [Google Scholar]
- 15. Fetissov SO, Hamze Sinno M, Coëffier M, Bole-Feysot C, Ducrotté P, Hökfelt T, et al. Autoantibodies against appetite-regulating peptide hormones and neuropeptides: putative modulation by gut microflora. Nutrition. 2008;24(4):348–59. [DOI] [PMC free article] [PubMed] [Google Scholar]
- 16. García ASE, Martínez-Rodríguez TY, Parra-Rojas I, Valdés-Miramontes EH, García-Ortíz L, Reyes-Castillo Z. Ghrelin-reactive autoantibodies as potential modulators of dysfunctional eating patterns in women: an exploratory study. Exp Clin Endocrinol Diabetes. 2022;130(12):806–13. [DOI] [PubMed] [Google Scholar]
- 17. Lucas N, Legrand R, Bôle-Feysot C, Breton J, Coëffier M, Akkermann K, et al. Immunoglobulin G modulation of the melanocortin 4 receptor signaling in obesity and eating disorders. Transl Psychiatry. 2019;9(1):87. [DOI] [PMC free article] [PubMed] [Google Scholar]
- 18. Sirufo MM, Magnanimi LM, Ginaldi L, De Martinis M. Anorexia nervosa, immunity and autoimmunity. Autoimmun Rev. 2022;21(4):103040. [DOI] [PubMed] [Google Scholar]
- 19. Samodova D, Hoel A, Hansen TH, Clausen L, Telléus GK, Marti HP, et al. Plasma proteome profiling reveals metabolic and immunologic differences between Anorexia Nervosa subtypes. Metabolism. 2024;152:155760. [DOI] [PubMed] [Google Scholar]
- 20. Fetissov SO, Hallman J, Oreland L, af Klinteberg B, Grenbäck E, Hulting AL, et al. Autoantibodies against alpha -MSH, ACTH, and LHRH in anorexia and bulimia nervosa patients. Proc Natl Acad Sci USA. 2002;99(26):17155–60. [DOI] [PMC free article] [PubMed] [Google Scholar]
- 21. Fetissov SO, Harro J, Jaanisk M, Järv A, Podar I, Allik J, et al. Autoantibodies against neuropeptides are associated with psychological traits in eating disorders. Proc Natl Acad Sci USA. 2005;102(41):14865–70. [DOI] [PMC free article] [PubMed] [Google Scholar]
- 22. Escelsior A, Cogorno L, Sukkar SG, Amerio A, Donini LM, Bellomo M, et al. Anti-hypothalamus autoantibodies in anorexia nervosa: a possible new mechanism in neuro-physiological derangement? Eat Weight Disord. 2022;27(7):2481–96. [DOI] [PMC free article] [PubMed] [Google Scholar]
- 23. Tennoune N, Chan P, Breton J, Legrand R, Chabane YN, Akkermann K, et al. Bacterial ClpB heat-shock protein, an antigen-mimetic of the anorexigenic peptide α-MSH, at the origin of eating disorders. Transl Psychiatry. 2014;4(10):e458. [DOI] [PMC free article] [PubMed] [Google Scholar]
- 24. Nagpal J, Cryan JF. Microbiota-brain interactions: moving toward mechanisms in model organisms. Neuron. 2021;109(24):3930–53. [DOI] [PubMed] [Google Scholar]
- 25. Wang J, Thingholm LB, Skiecevičienė J, Rausch P, Kummen M, Hov JR, et al. Genome-wide association analysis identifies variation in vitamin D receptor and other host factors influencing the gut microbiota. Nat Genet. 2016;48(11):1396–406. [DOI] [PMC free article] [PubMed] [Google Scholar]
- 26. Doms S, Fokt H, Rühlemann MC, Chung CJ, Kuenstner A, Ibrahim SM, et al. Key features of the genetic architecture and evolution of host-microbe interactions revealed by high-resolution genetic mapping of the mucosa-associated gut microbiome in hybrid mice. Elife. 2022;11:e75419. [DOI] [PMC free article] [PubMed] [Google Scholar]
- 27. Dhopatkar N, Keeler JL, Mutwalli H, Whelan K, Treasure J, Himmerich H. Gastrointestinal symptoms, gut microbiome, probiotics and prebiotics in anorexia nervosa: a review of mechanistic rationale and clinical evidence. Psychoneuroendocrinology. 2023;147:105959. [DOI] [PubMed] [Google Scholar]
- 28. Fouladi F, Bulik-Sullivan EC, Glenny EM, Thornton LM, Reed KK, Thomas S, et al. Reproducible changes in the anorexia nervosa gut microbiota following inpatient therapy remain distinct from non-eating disorder controls. Gut Microbes. 2022;14(1):2143217. [DOI] [PMC free article] [PubMed] [Google Scholar]
- 29. Garcia N, Gutierrez E. Anorexia nervosa and microbiota: systematic review and critical appraisal. Eat Weight Disord. 2023;28(1):1. [DOI] [PMC free article] [PubMed] [Google Scholar]
- 30. Fan Y, Støving RK, Berreira Ibraim S, Hyötyläinen T, Thirion F, Arora T, et al. The gut microbiota contributes to the pathogenesis of anorexia nervosa in humans and mice. Nat Microbiol. 2023;8(5):787–802. [DOI] [PMC free article] [PubMed] [Google Scholar]
- 31. Fetissov SO, Hökfelt T. On the origin of eating disorders: altered signaling between gut microbiota, adaptive immunity and the brain melanocortin system regulating feeding behavior. Curr Opin Pharmacol. 2019;48:82–91. [DOI] [PubMed] [Google Scholar]
- 32. Roubalova R, Prochazkova P, Dvorak J, Hill M, Papezova H, Kreisinger J, et al. Altered serum immunological and biochemical parameters and microbiota composition in patients with AN during realimentation. Front Nutr. 2021;8:680870. [DOI] [PMC free article] [PubMed] [Google Scholar]
- 33. Himmerich H, Lewis YD, Conti C, Mutwalli H, Karwautz A, Sjögren JM, et al. World Federation of Societies of Biological Psychiatry (WFSBP) guidelines update 2023 on the pharmacological treatment of eating disorders. World J Biol Psychiatry. 2023;24(8):643–706. [DOI] [PubMed] [Google Scholar]
- 34. Andreani NA, Sharma A, Dahmen B, Specht HE, Mannig N, Ruan V, et al. Longitudinal analysis of the gut microbiome in adolescent patients with anorexia nervosa: microbiome-related factors associated with clinical outcome. Gut Microbes. 2024;16(1):2304158. [DOI] [PMC free article] [PubMed] [Google Scholar]
- 35. Neuhauser H, Schienkiewitz A, Rosario AS, Dortschy R, Kurth B-M. Referenzperzentile für anthropometrische Maßzahlen und Blutdruck aus der Studie zur Gesundheit von Kindern und Jugendlichen in Deutschland (KiGGS); 2013. [Google Scholar]
- 36. Fetissov SO. Neuropeptide autoantibodies assay. Methods Mol Biol. 2011;789:295–302. [DOI] [PubMed] [Google Scholar]
- 37. Fetissov S, Legrand R, Takagi K, Fetissov S. Immunoglobulin G preparation from plasma samples and analysis of its affinity kinetic binding to peptide hormones. Protocol Exchange. 2014. [Google Scholar]
- 38. Breton J, Legrand R, Akkermann K, Järv A, Harro J, Déchelotte P, et al. Elevated plasma concentrations of bacterial ClpB protein in patients with eating disorders. Int J Eat Disord. 2016;49(8):805–8. [DOI] [PubMed] [Google Scholar]
- 39. Moriya J, Takimoto Y, Yoshiuchi K, Shimosawa T, Akabayashi A. Plasma agouti-related protein levels in women with anorexia nervosa. Psychoneuroendocrinology. 2006;31(9):1057–61. [DOI] [PubMed] [Google Scholar]
- 40. Kaye WH, Berrettini WH, Gwirtsman HE, Chretien M, Gold PW, George DT, et al. Reduced cerebrospinal fluid levels of immunoreactive pro-opiomelanocortin related peptides (including beta-endorphin) in anorexia nervosa. Life Sci. 1987;41(18):2147–55. [DOI] [PubMed] [Google Scholar]
- 41. Zeng MY, Cisalpino D, Varadarajan S, Hellman J, Warren HS, Cascalho M, et al. Gut microbiota-induced immunoglobulin G controls systemic infection by symbiotic bacteria and pathogens. Immunity. 2016;44(3):647–58. [DOI] [PMC free article] [PubMed] [Google Scholar]
- 42. Li H, Limenitakis JP, Greiff V, Yilmaz B, Schären O, Urbaniak C, et al. Mucosal or systemic microbiota exposures shape the B cell repertoire. Nature. 2020;584(7820):274–8. [DOI] [PubMed] [Google Scholar]
- 43. Freff J, Schwarte K, Bröker L, Bühlmeier J, Kraft I, Öztürk D, et al. Alterations in B cell subsets correlate with body composition parameters in female adolescents with anorexia nervosa. Sci Rep. 2021;11(1):1125. [DOI] [PMC free article] [PubMed] [Google Scholar]
- 44. Gabriel T, Massoubre C, Hanachi M, Doré J, Lambert C, Germain N, et al. Association of gut-specific non-inflammatory T lymphocytes with chronic anorexia nervosa and constitutional thinness. Eur Eat Disord Rev. 2023;31(1):76–86. [DOI] [PubMed] [Google Scholar]
- 45. Schulz N, Belheouane M, Dahmen B, Ruan VA, Specht HE, Dempfle A, et al. Gut microbiota alteration in adolescent anorexia nervosa does not normalize with short-term weight restoration. Int J Eat Disord. 2021;54(6):969–80. [DOI] [PubMed] [Google Scholar]
- 46. Borgo F, Riva A, Benetti A, Casiraghi MC, Bertelli S, Garbossa S, et al. Microbiota in anorexia nervosa: the triangle between bacterial species, metabolites and psychological tests. PLoS One. 2017;12(6):e0179739. [DOI] [PMC free article] [PubMed] [Google Scholar]
- 47. Prochazkova P, Roubalova R, Dvorak J, Kreisinger J, Hill M, Tlaskalova-Hogenova H, et al. The intestinal microbiota and metabolites in patients with anorexia nervosa. Gut Microbes. 2021;13(1):1902771–25. [DOI] [PMC free article] [PubMed] [Google Scholar]
- 48. Mack I, Cuntz U, Grämer C, Niedermaier S, Pohl C, Schwiertz A, et al. Weight gain in anorexia nervosa does not ameliorate the faecal microbiota, branched chain fatty acid profiles, and gastrointestinal complaints. Sci Rep. 2016;6:26752. [DOI] [PMC free article] [PubMed] [Google Scholar]
Associated Data
This section collects any data citations, data availability statements, or supplementary materials included in this article.
Supplementary Materials
Data Availability Statement
Data available on request due to privacy/ethical restrictions. Further inquiries can be directed to the corresponding author.


