

Abstract
Purpose:
Surveillance, Epidemiology, and End Results (SEER) cancer registries provides information about survival duration and cause of death for cancer patients. Baseline demographic and tumor characteristics such as age, sex, race, year of diagnosis, and tumor stage can inform the expected survival time of patients, but their associations with survival may not be constant over the post-diagnosis period.
Methods:
Using SEER data, we examined if there were time-varying associations of patient and tumor characteristics on survival, and we assessed how these relationships differed across 14 cancer sites. Standard Cox proportional hazards models were extended to allow for time-varying associations and incorporated into a competing-risks framework, separately modeling cancer-specific and other-cause deaths. For each cancer site and for each of the five factors, we estimated the relative hazard ratio and absolute hazard over time in the presence of competing risks.
Results:
Our comprehensive consideration of patient and tumor characteristics when estimating time-varying hazards showed that the associations of age, tumor stage at diagnosis, and race/ethnicity with risk of death (cancer-specific and other-cause) change over time for many cancers; characteristics of sex and year of diagnosis exhibit some time-varying patterns as well. Stage at diagnosis had the largest associations with survival.
Conclusion:
These findings suggest that proportional hazards assumptions are often violated when examining patient characteristics on cancer survival post-diagnosis. We discuss several interesting results where the relative hazards are time-varying and suggest possible interpretations. Based on the time-varying associations of several important covariates on survival after cancer diagnosis using a pan-cancer approach, the likelihood of the proportional hazards assumption being met or corresponding interpretation should be considered in survival analyses, as flawed inference may have implications for cancer care and policy.
Keywords: hazard model, survival analysis, cancer survivors, cancer, risk factors
Background and Overview
Cancer is a heterogeneous and often devastating disease, and understanding the associations between patient and tumor characteristics and cancer survival can help to highlight health disparities as well as to help cancer physicians provide the best care for patients. The expected survival time for individuals is influenced by a variety of factors. For many cancer sites, these include tumor characteristics such as tumor stage; social determinants of health such as census-tract-level socioeconomic status; and demographics such as age, sex, race/ethnicity, and year of diagnosis (YOD) (for example in [1,2,3] and many others).
Many cancer survival analyses assume that the association between patient and tumor characteristics and survival is constant over the post-diagnosis period (the proportional hazards assumption). However, previous work has suggested that many of these associations are in fact not constant over time, possibly due to the changing population as individuals die from cancer or other causes, or because characteristics of the patient or tumor directly influence survival outcomes.[4,5,6,7,8,9,10,11] Previous studies that investigated the proportional hazards assumption and determined that it is not always satisfied for specific cancers were predominantly limited to individual studies for a single cancer site, thus having smaller sample sizes and shorter follow-up times. One objective of this work was to confirm this finding on a larger scale leveraging data with more participants, more cancer sites, and a larger and consistent set of variables. We examined if there were time-varying associations of baseline patient characteristics with survival (both for cancer death and other-cause death) and assessed how these relationships may differ for given cancers. Given the popularity of these models, it is worthwhile to investigate potential violations of the proportional hazards assumption for different variables across many cancer sites.
Thus, taking a pan-cancer approach, we investigated associations with survival over time for bladder, breast, colon, rectal, head and neck, kidney, liver, lung, melanoma, ovary, pancreas, prostate, thyroid, and uterine cancers. These cancers were chosen as the most common solid organ cancers.[12] Moreover, while researchers often look at the proportional hazards assumption given shorter time frames where they may expect the assumption to be approximately satisfied, it is important to look at longer time frames, particularly as cancer survivors are living longer after being given improved treatment options. In our study we consider survival up to 14 years using data from 2004–2017.
Our work aims to identify patterns in time-varying associations in cancer survival and to generate hypotheses for future research. The possible presence of non-proportional hazards is important to recognize to better understand risks to patients and, in turn, appropriate responses by clinicians. By including a wide range of cancer sites, we can examine if the time-varying patterns are consistent. Unusual patterns that emerge across many sites may lead to new hypotheses. Conversely, if one or two sites have time-varying patterns that are deviate greatly from others, this might motivate researchers to explain these features in future studies. With this in mind, we adopt a pan-cancer approach to explore whether the statistical phenomenon of non-proportional hazards occurs in cancer survival, which covariates demonstrate time-varying hazard ratios, and pinpoint consistencies in these time-varying associations across cancers that could provide meaningful interpretations.
Methods
Understanding the hazard in cancer survival
The hazard is a central concept in the analysis of time-to-event data.[13] It is defined as the instantaneous failure rate of the event of interest at a given time t, and thus is the probability of the event in the next unit of time amongst those who are still alive at that time. The hazard ratio at time t compares the hazard of two groups with different baseline covariate values. For instance, if two groups differ solely in tumor stage values (e.g., distant vs localized) while all other covariate values remain constant, the hazard ratio of stage is simply their ratio of hazards rates.
Hazard models are commonly used because they are statistically interpretable; relative hazard ratios demonstrate how much more likely an individual is to die from cancer at a given time compared to an individual in the reference group. Cox proportional hazards models are frequently used, particularly in cancer studies. In a Cox proportional hazards model, the hazard ratio is assumed to be constant over time (i.e., the hazards are proportional) and can be denoted using a function of the single coefficient of the covariate exp(). However, if hazard ratios actually change over time, then the Cox proportional hazards model estimates would be inaccurate since the proportional hazards assumption would not hold. To account for the possibility of non-proportional hazards, time-varying hazard ratios may be estimated via time-dependent model coefficients (denoted using the quantity )).
The interpretation of a time-varying hazard ratio for a variable is that the variable is more strongly associated with the probability of the event happening in the subsequent time unit for time periods when the hazard ratio is large, compared to time periods when the hazard ratio is small. In estimating these time-varying coefficients, we are determining whether baseline covariates are of uniform importance across the post-diagnosis period or if the associations between the characteristic and survival vary across time are, for example, important only in the first year or two after diagnosis and treatment. While we analyze associations between covariates and survival using hazard ratios, it will be important to distinguish these statistical findings from causal ‘effects’. We caution against interpreting the time-varying associations as such and will later consider non-causal interpretations of hazard ratios, which can arise from changes in the patient population following diagnosis due to deaths.[14]
Data
Surveillance, Epidemiology, and End Results (SEER), a National Cancer Institute program, gathers information about all new cancer diagnoses in regions covering approximately one-third of the US population and has information on more than 15 million people in total. We obtained data on patients with primary tumors diagnosed between 2004–2017 from the SEER 18 database.[15] This timeframe was selected to both maximize the number of surveillance regions included and to access the SEER Combined Summary Stage variable, which is similar to the American Joint Committee on Cancer’s (AJCC) TNM staging system. The data were restricted to patients ages 25 years and older with primary tumors who survived at least one month beyond diagnosis (so that participants in our population were alive at time zero). In our analysis, survival was calculated from the time of cancer diagnosis, so individuals whose cancer was diagnosed at the time of death (who would have a survival time of zero months) were excluded.
Tumor site was classified by ICD-10 codes, using the primary site variable from SEER, as shown in the supplement. Data were retrieved from the SEER database by using the SEER*Stat software version 8.4. Table 1 shows the number of diagnoses for each cancer site overall and by metastatic disease during this period and the number of deaths from cancer and other causes. Mortality data in SEER were collected from the National Center for Health Statistics, including information from death certificates and vital health reporting systems.[16] The definition of death due to cancer was based on the SEER cause-specific death classification.[17,18] The majority of the censoring in the SEER database was administrative censoring.
Table 1.
Number of patients at risk at time zero for each cancer site and number of deaths in the data period. Patient groups are stratified into metastatic vs. non-metastatic (i.e. whether distant sites or nodes are involved) and cancer deaths vs. other-cause (non-cancer) deaths or by patient characteristics
| Cancer | Breast | Prostate | Ovary | Uterine | Lung | Colon | Rectal | Head Neck | Bladder | Melanoma | Thyroid | Pancreas | Kidney | Liver |
|---|---|---|---|---|---|---|---|---|---|---|---|---|---|---|
| Metastatic | 44100 | 39661 | 42165 | 12389 | 308553 | 68329 | 25820 | 22961 | 9540 | 10230 | 5873 | 10562 | 25094 | 14343 |
| Non- metastatic | 785994 | 716553 | 29887 | 154532 | 305173 | 278131 | 123488 | 114125 | 109689 | 254439 | 145011 | 9530 | 160267 | 73754 |
| Total | 830094 | 756214 | 72052 | 166921 | 613726 | 346460 | 149308 | 137086 | 119229 | 264669 | 150884 | 20092 | 185361 | 88097 |
| # of deaths from cancer | 97683 | 54180 | 33862 | 26340 | 399709 | 103069 | 44246 | 43026 | 40848 | 24411 | 4654 | 17090 | 39089 | 55659 |
| # of deaths from other causes | 85128 | 116434 | 4745 | 15581 | 76793 | 62990 | 19322 | 22440 | 27291 | 34865 | 8642 | 1373 | 27282 | 9935 |
| Demographics | ||||||||||||||
| Age (proportion) | ||||||||||||||
| <50 | 0.21 | 0.03 | 0.19 | 0.13 | 0.04 | 0.09 | 0.15 | 0.11 | 0.03 | 0.21 | 0.45 | 0.06 | 0.14 | 0.07 |
| 50–59 | 0.24 | 0.20 | 0.24 | 0.28 | 0.15 | 0.18 | 0.26 | 0.28 | 0.11 | 0.20 | 0.24 | 0.14 | 0.22 | 0.28 |
| 60–69 | 0.26 | 0.40 | 0.25 | 0.32 | 0.30 | 0.49 | 0.26 | 0.31 | 0.24 | 0.23 | 0.18 | 0.23 | 0.29 | 0.33 |
| 70+ | 0.30 | 0.37 | 0.32 | 0.26 | 0.51 | 0.24 | 0.34 | 0.30 | 0.62 | 0.35 | 0.13 | 0.57 | 0.34 | 0.32 |
| Race (proportion) | ||||||||||||||
| Asian | 0.08 | 0.05 | 0.08 | 0.08 | 0.06 | 0.07 | 0.09 | 0.04 | 0.04 | 0.01 | 0.10 | 0.07 | 0.05 | 0.15 |
| Black | 0.11 | 0.15 | 0.08 | 0.10 | 0.11 | 0.12 | 0.11 | 0.11 | 0.07 | 0.00 | 0.07 | 0.11 | 0.11 | 0.12 |
| Hispanic | 0.11 | 0.09 | 0.12 | 0.12 | 0.05 | 0.10 | 0.12 | 0.07 | 0.06 | 0.03 | 0.15 | 0.11 | 0.13 | 0.18 |
| White | 0.70 | 0.69 | 0.71 | 0.70 | 0.77 | 0.70 | 0.67 | 0.77 | 0.82 | 0.92 | 0.66 | 0.70 | 0.69 | 0.53 |
| Other/Unknown | 0.01 | 0.02 | 0.01 | 0.01 | 0.01 | 0.01 | 0.02 | 0.01 | 0.01 | 0.04 | 0.01 | 0.01 | 0.01 | 0.01 |
| Sex (proportion) | ||||||||||||||
| Female | 1.00 | 1.00 | 1.00 | 0.48 | 0.50 | 0.43 | 0.25 | 0.25 | 0.41 | 0.75 | 0.51 | 0.37 | 0.28 | |
| Male | 1.00 | 0.52 | 0.50 | 0.57 | 0.75 | 0.75 | 0.59 | 0.25 | 0.49 | 0.63 | 0.72 |
Supplemental Table 1 shows the frequency distribution of each of the covariates, age (<50, 50–59, 60–69, 70+ years), race (non-Hispanic Black, non-Hispanic White, Hispanic, non-Hispanic Asian, other), sex, YOD (2004–2008, 2009–2012, 2013–2017), and stage (localized, regional: lymph nodes only, regional: by direct extension only, regional: both direct extension and lymph nodes, distant metastases), for each of the 14 cancer sites. SEER provided sex based on medical records. In our data pull, we disallowed missingness in age, year of diagnosis, and cause of death in the sample, and sex did not appear to have any missingness. For stage and race, a category of missing or unknown was also included for computational completeness (counts shown in supplemental table 1) but results for these categories are not presented in the figures because they are not interpretable.
Statistical analysis
Follow-up time was defined as time from cancer diagnosis to death from cancer, death from other causes, or to censoring. When competing risks occur from death due to one of multiple potential causes , Cox regression models handle each cause of death using cause-specific hazards and treat all other causes of death as censored[19,20]. The cause-specific hazard for cause of death of type j in our Cox model was specified as
for a vector of covariates of interest . Here, represents the baseline hazard function for cause of death . We allowed for time-varying associations by replacing with in this model.
Several statistical and computational challenges were addressed using this model to analyze the large sample size. Time-varying associations were estimated with splines; details of the spline formulation and estimation process are given in the supplement. We visualized the hazard ratio over time to assess whether the proportional hazards assumption held. For each cancer site and for each of the five factors (stage, age, race, sex, and YOD) we graphed the relative hazard () for each level of the factor, relative to the reference group. The curves were truncated once the number of patients at risk in a particular covariate level was less than 30 to avoid interpreting hazard ratios for small samples. We estimated 95% confidence intervals for the time-varying hazard ratios calculated using the inverse of the second derivative of the penalized log-likelihood.[21]
We separately estimated hazard ratios for cancer death and other-cause death. Here other-cause deaths can be viewed as a type of control group. For example, one may not expect to see big changes in the associations of YOD with other-cause deaths unless there has been a change in diagnosis patterns or similar considerations. Further, for cancer specific death, we estimated the associations stratified by cancer metastases to see if any patterns differed between metastatic and non-metastatic patients. Metastatic status was defined using the SEER Summary Staging Manual where distant sites or nodes were involved.[22]
A further set of graphs show the absolute hazard for each cancer site for each of the five factors. The absolute hazard is the probability of death within the next month, amongst those who are still alive. For these graphs, we varied one factor at a time and held the other factors at reference values: localized cancer, aged 60–69, White race, male sex, and diagnosed in the period 2004–2008. These plots are interpretable as they show the actual instantaneous probability of death and thus provide further insight into the magnitude and time-varying nature of the hazard ratios.
For lung cancer and head and neck cancer, additional site-specific factors were included in supplemental analyses. For lung cancer, information on histology, i.e., small cell/non-small cell, was incorporated. For head and neck cancer, the specific subsite (larynx and hypopharynx, oropharynx, oral cavity) was used.
Results
Due to the number of variables considered, all plots are in Supplemental Figure 1a–e (relative hazards) and Supplemental Figure 2a–e (absolute hazards). To illustrate results, Figures 1–4 show a subset of the results. These show characteristics stage (Figures 1 and 2) and age (Figures 3 and 4) by cancer death (Figures 1 and 3) and other-cause death (Figures 2 and 4). The reference groups for the relative hazards were localized cancer stage, age 60–69, male sex, Non-Hispanic White race/ethnicity, and 2004–2008 for year of diagnosis. Further, we provide an interactive Rshiny web application where users can specify which characteristics and figures they are interested in at https://emilyroberts.shinyapps.io/pancancer/.
Figure 1.
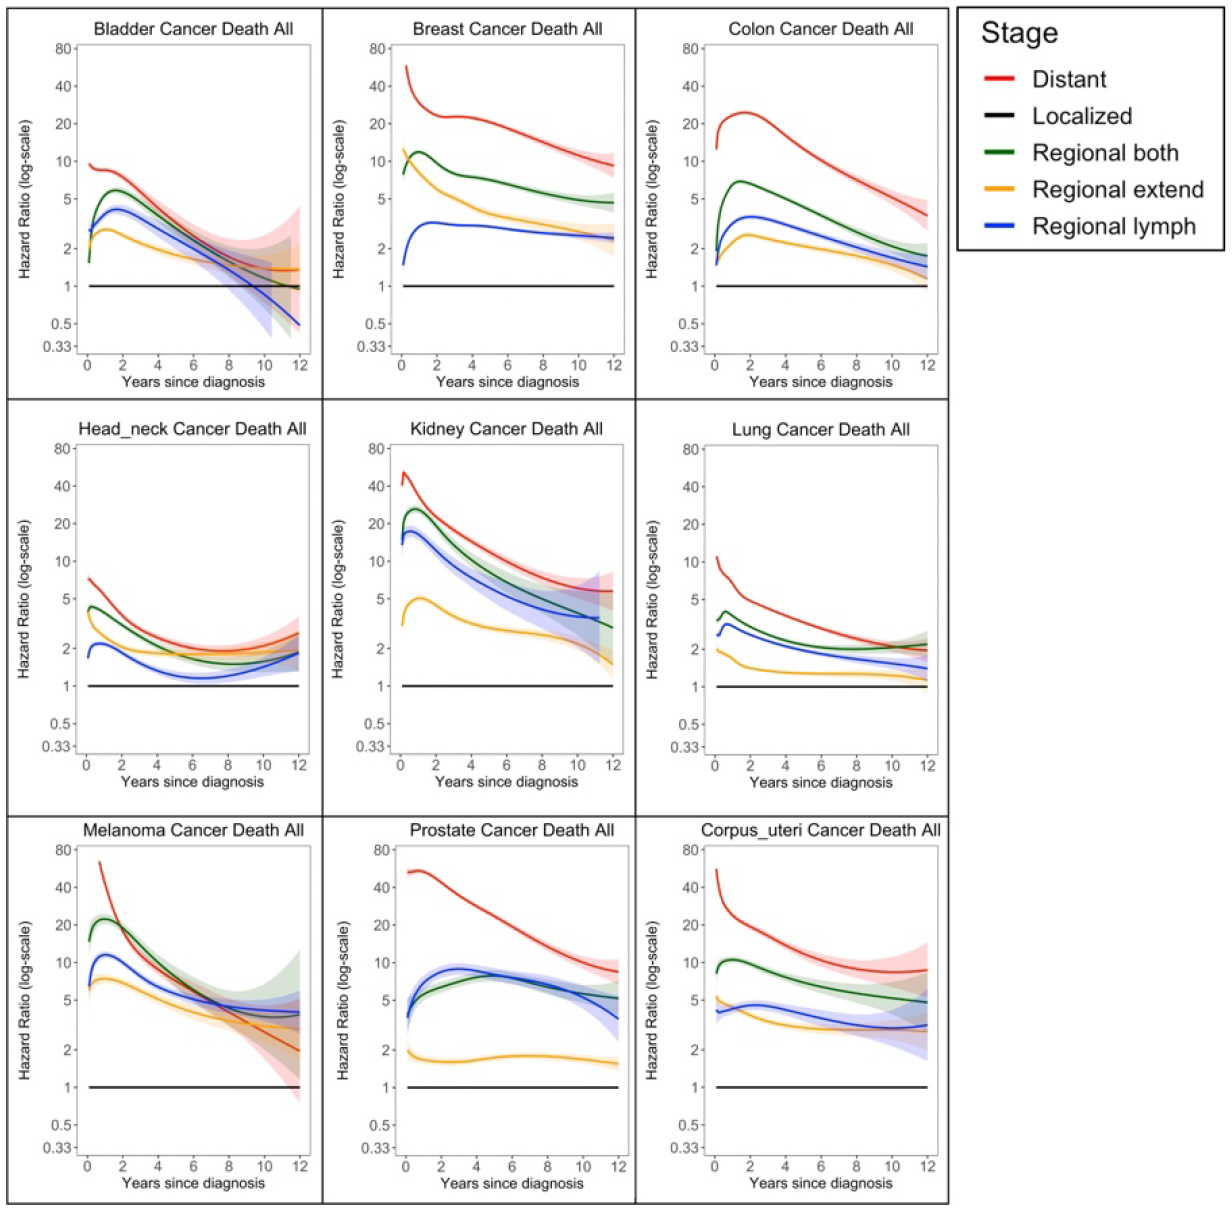
Time varying associations of stage and cancer death. Black line is the reference group. Ribbons are 95% confidence intervals.
Figure 4.

Time varying associations of age with other-cause death. Black line is the reference group. Ribbons are 95% confidence intervals.
Figure 2.

Time varying associations of stage with other-cause death. Black line is the reference group. Ribbons are 95% confidence intervals.
Figure 3.

Time varying associations of age with cancer death. Black line is the reference group. Ribbons are 95% confidence intervals.
Cancer Stage at Diagnosis
As seen in Figures 1 and 2 and Supplemental Figure 1a, cancer stage at diagnosis was frequently associated with large differences in the hazard ratios, though the magnitude of the associations varied across cancers. Breast, kidney, melanoma, prostate, thyroid, and uterine all had significantly larger initial associations with stage at diagnosis than the other cancers, followed by the association for colon cancer. Across nearly all cancers, the distant group had the highest hazard at time zero or shortly after, and the magnitude of this association was large; all but pancreas and ovary tended to show a decrease in this hazard after the first year or two. For most cancers (breast, colon, bladder, rectal, liver, kidney, melanoma, head and neck, lung, prostate) the hazard ratio of distant metastases compared to local disease attenuated substantially over the post-diagnosis period, indicating future survival depended less on stage at diagnosis once patients had already survived for several years. The hazard ratios for regional disease also attenuated over time. For cancers such as ovary and bladder, the estimated coefficients of the different regional classifications overlapped. In others, the associations were distinct, though inconsistent across cancers; for example, the hazard for regional by direct extension was lower than the hazard for regional lymph nodes for prostate, ovary, lung, colon, bladder, melanoma, kidney, and liver, but was higher for breast, head and neck, and thyroid cancer. Pancreatic cancer tended to not follow these trends as distinctly for cancer deaths.
In the results for other-cause deaths for many sites, the hazard ratios for other-cause deaths did depend on the stage of disease; this pattern was especially noticeable for patients with metastatic disease who had a much higher hazard of death from other causes compared to patients with localized disease. This pattern was especially true in the first two years after diagnosis, and the association persisted for cancers such as prostate and thyroid. These patterns were also clearly seen in the plots for the absolute hazards, as shown in Supplemental Figure 2.
Age
Shown in Figures 3 and 4 and Supplemental Figure 1b, for all cancers considered, the cancer death hazards tended to increase with increasing age in a monotonic pattern. There tended to be differences in the magnitude of the hazard ratio across cancers. For cancers such as bladder, breast, kidney, head and neck, ovary, prostate, colon, and rectal, we saw a time-varying association with a large spread in hazard ratios immediately after diagnosis, but this spread dropped within the first one to two years post-diagnosis, and then either stayed approximately constant or showed larger hazard ratios at longer times. Generally, the hazard ratios for age were smaller for more typically aggressive cancers, such as lung and pancreas. For patients with non-metastatic cancer, these differences by age (specifically the oldest versus the reference group) persisted over time. For patients with metastatic cancers, differences by age were less apparent except immediately around time zero. For non-metastatic patients, the age associations seemed to be preserved over time. There was some consistency across cancer sites and evidence of proportional hazards for other-cause deaths across ages.
The absolute hazard plots in supplemental figure 2 showed similar information. The hazard for metastatic cancer deaths tended to start very high at first then rapidly decline. For other-cause death, there was a clear monotonic pattern with older patients having a higher hazard of death. There were general similarities in the magnitude of absolute hazard of other-cause death over time across many cancer sites. We observed an increase in the hazard of dying for the other-cause death groups as time passed; this was most stark in the oldest age group. For some sites (lung, colon, rectal, ovary, kidney, and liver) there was a larger absolute hazard of other-cause death immediately after diagnosis, which steeply dropped off in the first one to two years.
Sex
For many cancers, men generally had a higher hazard for cancer death, though the magnitude of the hazard ratio estimate for sex was smaller compared to stage and age. There was more heterogeneity in terms of the patterns across cancers; noticeably, head and neck and liver did not demonstrate clear differential sex associations (Supplemental Figure 1c). For all cancer deaths, colon, thyroid, melanoma, kidney, and rectal cancers tended to have the largest associations with sex. In many cases, such as colon, rectal, melanoma, and thyroid, this relationship was not clear until one to two years post-diagnosis. For lung, the association with sex seemed to become null over time.
Race/ethnicity
Race and ethnicity are shown in Supplemental Figure 1d. The association with race/ethnicity was not uniform across cancer sites and over time, and the magnitude of the hazard ratios tended to be larger than sex but less than the associations for stage and age. Broadly speaking, the hazard ratios for Non-Hispanic (NH) Black patients to NH White patients were typically above one for most sites, Hispanic patients typically had a similar hazard ratio to NH White patients, and NH Asian individuals had a hazard ratio less than one compared to Whites. The hazard ratios were generally in the range of 0.5 to 2.0 relative to the NH White group. The metastatic and non-metastatic groups tended to show differential patterns. In general, NH Black patients tended to start with higher hazards than NH White patients (except for liver, lung, ovary, kidney, pancreas), although this difference was time-varying for several cancer types (breast, rectal, melanoma). This difference was generally less pronounced in the metastatic group, though we did see racial/ethnic differences at least at the beginning of the study period for lung, colon, rectal, prostate, and breast, with a large amount of uncertainty in the coefficient estimates. In many cases, NH Asian individuals tended to have a lower hazard than NH White individuals. We found similar results for other causes of death between Black and White individuals. While Hispanic individuals often had a lower hazard than Whites in the other cancer death group, the association with being in the ‘Other’ race group was inconsistent across cancers.
Differences in the absolute hazard plots were clear for most cancer sites for other-cause death. Some metastatic cancer sites showed more clear racial differences at the start of the follow-up, such as for breast, colon, rectal, and uterine.
Year of Diagnosis
In Supplemental Figure 1e, melanoma showed the most apparent time trends across YOD for cancer deaths where survival was better for more recent diagnoses. Some similar patterns were seen for cancer deaths for lung cancer, though none of these hazards were particularly time-varying for any given subgroup. We found some associations with YOD for other-cause death for prostate and uterine cancers, where survival was better for more recent diagnoses.
Metastasis status
We looked across all panels in Supplemental Figure 1 at overall patterns of hazard ratios of death due to cancer with metastatic (distant stage) and non-metastatic patients (1) combined and (2) stratified to examine differences. Broadly speaking (i.e., for most cancers and most variables), patient characteristics such as age, sex, YOD, and race tended to be less associated with time to cancer death for the metastatic group as compared to the non-metastatic group.
Discussion
For many patient and tumor characteristics, the associations with cancer-specific death were not constant over time following a cancer diagnosis, therefore violating the assumption that relative hazards are proportional over time. Due to the large sample considered in our analyses, we were able to detect many time-varying hazard ratios and therefore both subtle and large changes in the associations over the post-diagnosis period. We note in some cases that large uncertainty intervals for certain subgroups (such as for pancreatic cancer) lessen the ability to make strong conclusions about whether time-varying associations do exist. Still, findings from this pan-cancer approach to assessing time-varying associations suggest the use of caution when employing proportional hazards models for cancer survival, particularly for cancers with median survival times of five years or more.
The pan-cancer approach revealed many consistent patterns across many cancer sites. As expected across all sites, the hazard ratios for stage associated with death from cancer was substantial, with the largest association being for metastatic compared to localized disease. Intermediate associations were observed for regional disease compared to localized disease. These hazard ratios attenuated considerably over time. It is generally accepted that as the duration post-diagnosis increases, the significance of the disease stage at time of diagnosis decreases with respect to the likelihood of an alive individual dying of cancer in the next year.
More surprisingly, the hazard of dying from other causes was also associated with the stage of cancer. The hazard of dying from other causes of death tended to be higher amongst patients who had metastases; this pattern was particularly seen in the first two years after diagnosis. At later times, the hazard of dying from other causes was not associated with stage for most, though not all, cancers. We hypothesize this pattern is due either to misclassification of cause of death or unmeasured confounding, known as the “health screening” effect.[23] For thyroid, this phenomenon is referred to as “opportunistic detection” because of availability of scans and imaging; patients diagnosed through screening, often at an earlier stage, tend to have healthier behaviors and therefore better other-cause survival. This observation could also be due to confounding factors with cancer-specific and other-cause mortality, such as the presence of comorbidities.
The absolute hazard plots also revealed expected, but subtle, findings. For every site except prostate, the absolute hazard of dying from cancer for metastatic patients was greatest in the first year after diagnosis and decreased from that time onwards. For prostate cancer, the peak hazard was approximately one year after diagnosis. For regional disease, the peak of the absolute hazard was generally one to three years after diagnosis for many cancer sites, suggesting cancer deaths may not immediately occur for those who do not have distant metastases at baseline. Prostate cancer in particular had a specific absolute hazard shape for the individuals with regional lymph nodes and both regional stage cancer. The hazard increased over the first few years, but unlike the other cancer sites, the hazard did not decrease again in the following years. Further, the regional by direct extension and localized subgroups actually had an increasing absolute hazard over time. This finding may reflect the generally slower growing rate of prostate cancer compared to most other cancers.[24,25]
The results for age were very interesting: the hazard of dying from cancer showed a clear association with age after adjustment for the other variables. There was a monotonic trend with younger patients having the smallest hazard and older patients having the highest hazard for nearly every cancer site. The hazard ratios were clearly non-constant over time. A substantial difference in the hazards was evident in the initial year following diagnosis for nearly all cancers, with the differences being much smaller at two years, and persisting for later times after. We note this association with age occurred for both metastatic patients and for non-metastatic patients. A possible explanation for the large difference in the first year is a tendency for older patients to be ineligible for the more aggressive, but likely more successful therapies, perhaps because of other comorbidities or general frailty, or being less likely to be able or willing to complete their therapies.[26]
The association of age and death from other causes showed, as expected, a very clear relationship, with large hazard ratios that were similar across cancer sites. This provides confidence that our approach is finding real patterns, and the proportional hazards assumption would be approximately satisfied for these variables for other-cause death. The absolute hazard plots do reveal some differences between sites. The youngest age group did have a higher hazard of death from other causes for head and neck cancer and for lung cancer. We speculate this association is due to the fact that these cancers are smoking related, and patients diagnosed at younger ages may have higher smoking-related co-morbidities.[27,28] Pancreas and liver cancer patients had different patterns of associations with age compared to other cancers, although these sites have smaller sample sizes, so there is more uncertainty in their estimates. The absolute hazard plots also revealed that for most sites, the hazard of death from other causes increased steeply with follow-up time for the oldest age group. However, for some sites (lung, colon, rectal, ovary, bladder, kidney) there was a clear spike in the probability of dying from other causes in the first few months after diagnosis, but this spike was not present for prostate, breast, uterine and melanoma. We hypothesize this difference is due to the difficulties in attribution of cause of death for different sites. These sites may represent patients that are least likely to die from their cancer in general; this may be due to screening, patients presenting at an earlier stage while still curable, or recent improvements in the treatment of these cancers with fewer side effects on overall health.[29]
The hazard ratios for death from cancer for sex were generally small in magnitude, with the exception of melanoma and thyroid cancer for which females had lower hazards than males. For most cancer sites, the hazard of cancer death was slightly lower for female patients, with the exception of head and neck cancer. For bladder, colon, and kidney cancer, and possibly head and neck and rectal cancer, there was a tendency for the hazard to be elevated in the first year after diagnosis for females. However, these associations were small and relatively inconsistent across the cancer sites. The differences may be in part due to sociological factors affecting adherence to treatments or post-treatment monitoring, though the associations are not currently well-understood.[30,31,32] For death from other causes, the hazard tended to be slightly lower for females for most sites, as expected.[33] The exceptions to this pattern were head and neck and pancreas, where there were almost no gender differences among other-cause deaths, and thyroid, where the gender differences were much larger.
The hazard ratios associated with different racial/ethnic groups were noticeably close to one compared to the estimated coefficients of other variables. For most sites, the hazard of cancer death was higher for NH Black patients than for NH White patients and lower for NH Asian patients than for NH White patients. There were some exceptions to this pattern, notably for lung and kidney cancer, where the racial differences were much smaller. Other research has investigated smoking status, cancer screening, and other disparities among NH Asian individuals, noting in some cases differences within racial subgroups of NH Asian subjects.[34,35,36] The patterns for the hazard changes over time were more consistent across sites for the other-cause deaths. Differences in mortality by race/ethnicity are not due to race and ethnicity causally but are likely explainable by other factors such as access to care and comorbidities.[37] In particular, there may be differences by race/ethnicity in the stage at which individuals are diagnosed and in the lack of optimal cancer treatment provided to different individuals.[38] From existing research, cancers with standard screening recommendations (lung, colorectal, prostate, breast, cervix) tend to show disparities across stage, with Black patients and those residing in areas characterized by lower SES and less population density having the highest proportion of late-stage/metastatic cancer.[39]
For years of diagnosis, the hazard ratios were generally close to one, although for many sites there was evidence of mild improvement in survival for patients diagnosed in later years. Given the data period (2004–2017), it is not surprising that the proportional hazards assumption would be at least approximately satisfied for many of the sites. For deaths due to cancer, the sites that showed no real improvement were colon, rectal, bladder and uterine, and the sites that showed the clearest improvement were lung, melanoma, and kidney. For death from other causes, some of the sites also showed improvement over time: prostate, uterine, and thyroid. It is possible these changes may be related to updates in mortality attribution, an increase in more cancer-specific mortality due to more aggressive subtypes being diagnosed, changes in treatments, or overdiagnosis of low-risk patients.[40,41,42] The comparison between the hazard for death due to cancer and the hazards for other-cause death revealed that three sites that showed no change in the hazard of death due to other causes did show improvement in the hazard of death due to cancer (melanoma, lung, and kidney). We may expect improvements in future data for lung and melanoma due to advances in treatment; several of these sites with new immunotherapies have shown to be useful and have been in practice for the longest.[43] Some sites have some unusual patterns that are not currently understood. Prostate cancer appeared to have an improved hazard for more recent diagnoses in the short term, but not at longer times post-diagnosis which may be related to the changing guidelines for PSA screening.[44]
There are other relevant covariates that we were not able to or elected not to include in this analysis. Treatment was not used because of potential confounding; a potential selection bias favoring the treatment of healthier patients is difficult to fully adjust for in observational data.[45] We would have liked to include comorbidities and smoking status, for example to provided further insight into the pattern of associations with age, but they were not broadly available for this period of SEER. Work is ongoing to include other datasets with these variables than can help explain these findings. Statistically, it is conceivable that the pattern of the time-varying coefficients would change if other variables were included. Many cancer sites also have other variables that are known to be prognostic, such as Estrogen and Progesterone Receptor status in women with breast cancer, however this information was not available for a large sample size that we were targeting. Further, our goal was to do an analysis that was very similar across many cancer sites to evaluate the time-varying nature of the hazard ratio across many cancers. Our limited experience with adjusting for other prognostic factors in these analyses is that it has minimal impact of the magnitude and shape of the time-varying hazard ratios. This is illustrated in the supplementary materials where we show the results for head and neck and lung cancer where we adjust for subsite (larynx, oral cavity, oropharynx, hypopharynx) and histology (small cell, non-small cell) respectively. The patterns of the hazards ratios for stage, age, race, YOD and sex are almost indistinguishable from those when the additional factors are not adjusted for. These findings and other similar analyses (not shown here) suggest that the time-varying patterns are a genuine feature for these variables for each cancer, and not an artifactual consequence of what other factors happened to be included in the models.
Potentially there are data quality issues including misdiagnosis, missing stage information, or misattribution for cause of death. Death certificates are filled out in heterogeneous ways, and attribution to a single cause of death can be difficult. Following the research in [16], we used a consistent definition of cause of death as provided by the SEER program. We might expect the attribution of cause of death to be more error prone for longer times after diagnosis. We may be observing the impact of this phenomena in the hazard ratio plots for age at longer follow up times. For most cancers, the hazard of dying of cancer is still noticeably higher for older patients even 10 years after diagnosis. A possible explanation for this is that some of these later cancer deaths would be more appropriately attributed to other causes rather than cancer. Taken together, while the hazards ratios are often non-proportional over the study period, it is not necessarily clear if some associations appear due to differences in diagnosis and treatment, changes in the population over follow-up, or censoring patterns that change over time. Particularly several years after diagnosis, the survivors may not be representative of the population of people with a recent cancer diagnosis. These distinctions are critical yet difficult to disentangle with these data. We again emphasize that the purpose of the paper is not to give causal interpretations, but rather to describe the relative strength of the associations of many non-modifiable risk factors over time across many cancer sites. Future work to understand the causal nature of these relationships, validate or refute any hypotheses presented here, and determine how the conclusions may affect healthcare policy is needed. For example, our work may motivate updates to prognostic models that have been developed using proportional hazards assumptions.
Conclusions
This pan-cancer assessment of cancer survival estimated time-varying associations between many patient and tumor characteristics and cancer survival. Overall, the proportional hazards assumption was not met for most patient and tumor characteristics and cancer sites, and thus the proportional hazards assumption should be scrutinized and justified, especially for associations with stage and age. Prognostic models derived from proportional hazards assumptions should be updated to account for time-varying associations. Our work generated multiple hypotheses to explain common patterns in time-varying associations across cancer sites that can be considered further in future work.
Supplementary Material
Footnotes
Conflict of Interest: The authors have no conflicts of interest to report.
Data Availability
The datasets generated and analyzed during the current study are available through SEER (https://seer.cancer.gov/).
References
- 1.Brouwer AF, Engle JM, Jeon J, Meza R (2022). Sociodemographic survival disparities for lung cancer in the United States, 2000–2016. JNCI: Journal of the National Cancer Institute. [DOI] [PMC free article] [PubMed] [Google Scholar]
- 2.Li L, Yang Z, Hou Y, Chen Z (2020). Moving beyond the Cox proportional hazards model in survival data analysis: a cervical cancer study. BMJ open, 10(7), e033965. [DOI] [PMC free article] [PubMed] [Google Scholar]
- 3.Shu TD, Schumacher FR, Conroy B, Ponsky L, Mahran A, Bukavina L, Calway A, & Markt SC (2023). Disparities in cause-specific mortality by race and sex among bladder cancer patients from the SEER database. Cancer Causes & Control, 34(6), 521–531. [DOI] [PubMed] [Google Scholar]
- 4.Brouwer AF, He K, Chinn SB, Mondul AM, Chapman CH, Ryser MD, Banerjee M, Eisenberg MC, Meza R, Taylor JM (2020). Time‐varying survival effects for squamous cell carcinomas at oropharyngeal and nonoropharyngeal head and neck sites in the United States, 1973‐2015. Cancer, 126(23), 5137–5146. [DOI] [PMC free article] [PubMed] [Google Scholar]
- 5.Gray RJ (1992). Flexible methods for analyzing survival data using splines, with applications to breast cancer prognosis. Journal of the American Statistical Association, 87(420), 942–951. [Google Scholar]
- 6.Quantin C, Abrahamowicz M, Moreau T, Bartlett G, MacKenzie T, Adnane-Tazi M, Lalonde L, Faivre J (1999). Variation over time of the effects of prognostic factors in a population-based study of colon cancer: comparison of statistical models. American Journal of Epidemiology. 150, 1188–1200. [DOI] [PubMed] [Google Scholar]
- 7.Baulies S, Belin L, Mallon P, Senechal C, Pierga JY, Cottu P, Sablin MP, Sastre X, Asselain B, Rouzier R, Reyal F (2015). Time-varying effect and long-term survival analysis in breast cancer patients treated with neoadjuvant chemotherapy. British Journal of Cancer, 113(1), 30–36. [DOI] [PMC free article] [PubMed] [Google Scholar]
- 8.Bellera CA, MacGrogan G, Debled M, de Lara CT, Brouste V, Mathoulin-Pélissier S (2010) Variables with time-varying effects and the Cox model: some statistical concepts illustrated with a prognostic factor study in breast cancer. BMC Med Res Methodol, 10(1), 1–12. [DOI] [PMC free article] [PubMed] [Google Scholar]
- 9.Yang Z, Hou Y, Lyu J, Liu D, & Chen Z (2020). Dynamic prediction and prognostic analysis of patients with cervical cancer: a landmarking analysis approach. Annals of epidemiology, 44, 45–51. [DOI] [PubMed] [Google Scholar]
- 10.Chang C, Chiang AJ Wang H, Chen Wei-An, Chen J (2015). Evaluation of the time-varying effect of prognostic factors on survival in ovarian cancer. Annals of Surgical Oncology, 22(12), 3976–3980. [DOI] [PubMed] [Google Scholar]
- 11.Andreassen BK, Grimsrud TK, & Haug ES (2018). Bladder cancer survival: women better off in the long run. European Journal of Cancer, 95, 52–58. [DOI] [PubMed] [Google Scholar]
- 12.Siegel RL, Miller KD, Wagle NS, & Jemal A (2023). Cancer statistics, 2023. CA: a cancer journal for clinicians, 73(1), 17–48. [DOI] [PubMed] [Google Scholar]
- 13.Cox DR (1972). Regression Models and Life-Tables. Journal of the Royal Statistical Society. Series B (Methodological), 34(2), 187–220. [Google Scholar]
- 14.Hernán MA (2010). The hazards of hazard ratios. Epidemiology (Cambridge, Mass.), 21(1), 13. [DOI] [PMC free article] [PubMed] [Google Scholar]
- 15.Surveillance, Epidemiology, and End Results (SEER) Program (www.seer.cancer.gov) SEER*Stat Database: Incidence - SEER Research Data, 18 Registries, Nov 2019 Sub (2000–2017) - Linked To County Attributes - Time Dependent (1990–2017) Income/Rurality, 1969–2018 Counties, National Cancer Institute, DCCPS, Surveillance Research Program, released April 2020, based on the November 2019 submission.
- 16.Howlader N, Rise LA, Mariotto AB, Reichman ME, Ruhl J, Cronin KA (2010). Improved estimates of cancer-specific survival rates from population-based data. JNCI: Journal of the National Cancer Institute, 102(20), 1584–1598. [DOI] [PMC free article] [PubMed] [Google Scholar]
- 17.Howlader N, Mariotto AB, Woloshin S, & Schwartz LM (2014). Providing clinicians and patients with actual prognosis: cancer in the context of competing causes of death. Journal of the National Cancer Institute Monographs, 2014(49), 255–264. [DOI] [PMC free article] [PubMed] [Google Scholar]
- 18.SEER. Cause-specific death classification - Seer Recodes. SEER. Retrieved April 21, 2022, from https://seer.cancer.gov/causespecific/ [Google Scholar]
- 19.Satagopan JM, Ben-Porat L, Berwick M, Robson M, Kutler D, & Auerbach AD (2004). A note on competing risks in survival data analysis. British journal of cancer, 91(7), 1229–1235. [DOI] [PMC free article] [PubMed] [Google Scholar]
- 20.Haller B, Schmidt G, & Ulm K (2013). Applying competing risks regression models: an overview. Lifetime data analysis, 19, 33–58. [DOI] [PubMed] [Google Scholar]
- 21.Luo L, He K, Wu W, Taylor JMG (2023). Using Information Criteria to Select Smoothing Parameters when Analyzing Survival Data with Time-Varying Coefficient Hazard Models. Statistical Methods in Medical Research, 32(9), 1664–1679. [DOI] [PMC free article] [PubMed] [Google Scholar]
- 22.SEER. SEER Summary Staging Manual 2000. SEER. Retrieved April 21, 2022, from https://seer.cancer.gov/tools/ssm/ssm2000/ [Google Scholar]
- 23.Cho H, Mariotto AB, Mann BS, Klabunde CN, Feuer EJ (2013). Assessing non–cancer-related health status of US cancer patients: other-cause survival and comorbidity prevalence. American Journal of Epidemiology, 178(3), 339–349. [DOI] [PMC free article] [PubMed] [Google Scholar]
- 24.Penney KL, Stampfer MJ, Jahn JL, Sinnott JA, Flavin R, Rider JR, Finn S, Giovannucci E, Sesso HD, Loda M, Mucci LA, & Fiorentino M (2013). Gleason grade progression is uncommon. Cancer research, 73(16), 5163–5168. [DOI] [PMC free article] [PubMed] [Google Scholar]
- 25.Johansson JE, Andrén O, Andersson SO, Dickman PW, Holmberg L, Magnuson A, & Adami HO (2004). Natural history of early, localized prostate cancer. Jama, 291(22), 2713–2719. [DOI] [PubMed] [Google Scholar]
- 26.Puts MT, Tapscott B, Fitch M, Howell D, Monette J, Wan-Chow-Wah D, Krzyzanowska M, Leighl NB, Springall E Alibhai SM (2015). A systematic review of factors influencing older adults’ decision to accept or decline cancer treatment. Cancer treatment reviews, 41(2), 197–215. [DOI] [PubMed] [Google Scholar]
- 27.Lariscy JT (2019). Smoking-attributable mortality by cause of death in the United States: An indirect approach. SSM-population health, 7, 100349. [DOI] [PMC free article] [PubMed] [Google Scholar]
- 28.Kaul S, Veeranki SP, Rodriguez AM, & Kuo YF (2016). Cigarette smoking, comorbidity, and general health among survivors of adolescent and young adult cancer. Cancer, 122(18), 2895–2905. [DOI] [PubMed] [Google Scholar]
- 29.Zaorsky NG, Churilla TM, Egleston BL, Fisher SG, Ridge JA, Horwitz EM, Meyer JE (2017). Causes of death among cancer patients. Annals of Oncology, 28(2), 400–407. [DOI] [PMC free article] [PubMed] [Google Scholar]
- 30.Chou PL, Fang SY, Sun JL, Rau KM, Lee BO (2018). Gender difference in cancer patients’ adherence to analgesics and related outcomes of pain management. Cancer nursing, 41(6), E11–E18. [DOI] [PubMed] [Google Scholar]
- 31.Lee M, Khan MM (2016). Gender differences in cost-related medication non-adherence among cancer survivors. Journal of Cancer Survivorship, 10, 384–393. [DOI] [PubMed] [Google Scholar]
- 32.He Y, Su Y, Zeng J, Chong W, Hu X, Zhang Y, Peng X (2022). Cancer‐specific survival after diagnosis in men versus women: A pan‐cancer analysis. MedComm, 3(3), e145. [DOI] [PMC free article] [PubMed] [Google Scholar]
- 33.Waldron I, Johnston S (1976). Why do women live longer than men?. Journal of human stress, 2(2), 19–30. [DOI] [PubMed] [Google Scholar]
- 34.Haiman CA, Stram DO, Wilkens LR, Pike MC, Kolonel LN, Henderson BE, Le Marchand L (2006). Ethnic and racial differences in the smoking-related risk of lung cancer. New England Journal of Medicine, 354(4), 333–342. [DOI] [PubMed] [Google Scholar]
- 35.Lee RJ, Madan RA, Kim J, Posadas EM, Yu EY (2021). Disparities in cancer care and the Asian American population. The oncologist, 26(6), 453–460. [DOI] [PMC free article] [PubMed] [Google Scholar]
- 36.Raz DJ, Gomez SL, Chang ET, Kim JY, Keegan TH, Pham J, Kukreja J, Hiatt RA Jablons DM (2008). Epidemiology of non-small cell lung cancer in Asian Americans: incidence patterns among six subgroups by nativity. Journal of Thoracic Oncology, 3(12), 1391–1397. [DOI] [PMC free article] [PubMed] [Google Scholar]
- 37.Dess RT, Hartman HE, Mahal BA, Soni PD, Jackson WC, Cooperberg MR, Amling CL, Aronson WJ, Kane CJ, Terris MK Zumsteg ZS, Butler S, Osborne JR, Morgan TM, Mehra R, Salami SS, Kishan AU, Wang C, Schaeffer EM, Roach M, Pisansky TM, Shipley WU, Freedland SJ, Sander HM, Salabi S, Feng FY, Dignam JJ, Nguyen PL, Schipper MJ, Spratt DE (2019). Association of black race with prostate cancer–specific and other-cause mortality. JAMA oncology, 5(7), 975–983. [DOI] [PMC free article] [PubMed] [Google Scholar]
- 38.Esnaola NF, Ford ME (2012). Racial differences and disparities in cancer care and outcomes: where’s the rub?. Surgical Oncology Clinics, 21(3), 417–437. [DOI] [PMC free article] [PubMed] [Google Scholar]
- 39.Islami F, Guerra CE, Minihan A, Yabroff KR, Fedewa SA, Sloan K, Wiedt TL, Thomson B, Siegel RL, Nargis N Winn RA, Lacasse L, Makaroff L, Daniels EC, Patel AV, Cance WG, Jemal A (2021). American Cancer Society’s report on the status of cancer disparities in the United States, 2021. CA: A Cancer Journal for Clinicians. [DOI] [PubMed] [Google Scholar]
- 40.Clarke NW, Armstrong AJ, Thiery-Vuillemin A, Oya M, Shore N, Loredo E, Procopio G, de Menezes J, Girotto G, Arslan C and Mehra N, Parnis F, Brown E, Schlurmann F, Joung JY, Sugimoto M, Virizuela J, Emmenegger U, Navratil J, Buchschacher GL, Poehlein C, Harrington EA, Desai C, Kang, Saad F (2022). Abiraterone and olaparib for metastatic castration-resistant prostate cancer. NEJM Evidence, 1(9), EVIDoa2200043. [DOI] [PubMed] [Google Scholar]
- 41.Daskivich TJ, Chamie K, Kwan L, Labo J, Palvolgyi R, Dash A, Greenfield S Litwin MS (2011). Overtreatment of men with low‐risk prostate cancer and significant comorbidity. Cancer, 117(10), 2058–2066. [DOI] [PubMed] [Google Scholar]
- 42.Brawley OW (2012). Prostate cancer epidemiology in the United States. World journal of urology, 30, 195–200. [DOI] [PubMed] [Google Scholar]
- 43.Cha HR, Lee JH, Ponnazhagan S (2020). Revisiting Immunotherapy: A Focus on Prostate Cancer Advances and Limitations of Immunotherapy in Prostate Cancer. Cancer research, 80(8), 1615–1623. [DOI] [PMC free article] [PubMed] [Google Scholar]
- 44.Etzioni R, Gulati R, Tsodikov A, Wever EM, Penson DF, Heijnsdijk EA, Katcher J, Draisma G, Feuer EJ, De Koning HJ, Mariotto AB (2012). The prostate cancer conundrum revisited: treatment changes and prostate cancer mortality declines. Cancer, 118(23), 5955–5963. [DOI] [PMC free article] [PubMed] [Google Scholar]
- 45.Giordano SH, Kuo YF, Duan Z, Hortobagyi GN, Freeman J, Goodwin JS (2008). Limits of observational data in determining outcomes from cancer therapy. Cancer: Interdisciplinary International Journal of the American Cancer Society, 112(11), 2456–2466. [DOI] [PMC free article] [PubMed] [Google Scholar]
- 46.Wu W, Taylor JM, Brouwer AF, Luo L, Kang J, Jiang H, He K (2022). Scalable proximal methods for cause-specific hazard modeling with time-varying coefficients. Lifetime Data Analysis, 28(2), 194–218. [DOI] [PMC free article] [PubMed] [Google Scholar]
Associated Data
This section collects any data citations, data availability statements, or supplementary materials included in this article.
Supplementary Materials
Data Availability Statement
The datasets generated and analyzed during the current study are available through SEER (https://seer.cancer.gov/).