Abstract
Rotavirus and other pathogenic microorganisms are known to cause scours, respiratory infection, and increased mortality, spread from pig to pig via contaminated equipment, insuffcient washing, and improper disinfection processes in farrowing rooms on commercial sow farms. Pig producers have adopted cleaning procedures and biosecurity policies as an attempt to ensure farrowing rooms are free of infectious organisms before the next group of sows is introduced. Adenosine triphosphate (ATP) bioluminescence has been used in other industries to provide real-time feedback on surface cleanliness through the detection of ATP from organic sources. That technology may provide producers a way of objectively characterizing a farrowing room’s suitability for a new group of sows to be moved into the farrowing room. Three ATP luminometers (Charm Sciences novaLUM II-X, 3M Clean Trace, and Neogen AccuPoint) were used to estimate relationships between ATP bioluminescence relative light units (RLU) and coliform plate counts (CPC). Five farrowing crate locations and the room entryway floor were swabbed to determine locations within a farrowing crate that can accurately estimate room cleanliness. Coliform plate counts were strongly correlated with Charm novaLUM II-X RLU (r = 0.70, P < 0.01). The Clean-Trace CPCs and RLU (r = 0.48, P < 0.01) were moderately correlated. There was a weak correlation between CPCs and AccuPoint RLU (r = 0.32, P < 0.01). The greatest area of surface contamination was the entryway floor and the sow feeder. Because CPCs and luminometer RLU were correlated, statistical process control charts were developed to provide cleanliness thresholds based on RLU values. Based on an adjusted 3σ from the mean RLU critical limit, 7.7% of crates for the Charm novaLUM II-X, 10.6% of crates for the 3M Clean Trace, and 0% of crates for the Neogen AccuPoint would have failed the critical limit for the sow feeder cleanliness thresholds. Using a similar approach, 11.4% of crates for the Charm novaLUM II-X, 10.5% of crates for the 3M Clean Trace, and 15.2% of crates for the Neogen AccuPoint would have failed the critical limit for the crate sorting bar cleanliness thresholds. These data suggest that ATP bioluminescence may be a reliable method to monitor cleaning effectiveness in farrowing rooms on commercial sow farms. Bioluminescence is a monitoring tool that should be used in conjunction with periodic microbial validation to monitor procedures for cleaning and disinfection.
Keywords: adenosine triphosphate, bioluminescence, biosecurity, cleanliness, farrowing room, luminometer
Farrowing room cleanliness is one of the most important objectives in avoiding disease transmission by reducing the risk of exposure to diseases in the newborn litter. Adenosine triphosphate bioluminescence is a technology used to assess the cleanliness of surfaces. Various sites in the farrowing room were sampled to determine the effectiveness of the technology to provide real-time feedback on the cleanliness of farrowing rooms. An ATP luminometer may be used along with a visual inspection in the farrowing crate to determine the general cleanliness of farrowing rooms.
INTRODUCTION
Over 6 million sows in the United States produce over 130 million market pigs each year (USDA-NASS, 2023). Most of those pigs are raised in farrowing rooms before being moved to commercial farms in a broad geographical area to be raised for food production. Therefore, poor farrowing room washing and improper disinfection processes can facilitate disease transmission from the sow farm to wean-to-finish facilities causing tremendous financial losses for the industry.
Rotavirus and other pathogenic microorganisms known to cause scours, respiratory infection, increased mortality, and reduced productivity can spread from pig to pig via contaminated equipment, insufficient washing, and improper disinfection processes within farrowing rooms (Chandler‐Bostock and Mellits, 2015). Weaned pig producers have adopted cleaning procedures and strict biosecurity policies to ensure farrowing rooms are washed, dried, and disinfected after sows are weaned and before the next group of sows isintroduced to the environment. Commercial farms make extensive efforts to clean and sanitize farrowing rooms between groups. However, confirmation of cleanliness is through visual inspection and therefore subject to variability from inspector to inspector making it a poor method of ensuring environmental cleanliness (Hancox et al., 2013).
Viral and bacterial transmission can occur through residual fecal matter that remains after a farrowing room is pressure washed. Fecal matter contains adenosine triphosphate (ATP). Adenosine triphosphate is a source of cellular energy that is present among all living organisms. This includes bacteria and other microbial organisms remaining after pressure washing farrowing rooms. Residual ATP can be detected and quantified using bioluminescence technology. The technology uses the same chemical process a firefly uses to illuminate (Jarrad, 2019). The ATP bioluminescence creates an illumination signal by exposing a swab to a luciferase–luciferin complex when ATP is present. The more ATP that is present, the greater the chemical reaction and the more intense the signal. This light production is quantified in a unitless measure known as a relative light unit (RLU). The objective was to assess the ability of ATP bioluminescence for use as a tool to evaluate farrowing room cleanliness between groups of sows to reduce disease transmission risk. Recently, Letsch et al. (2024) used ATP bioluminescence to develop statistical process control (SPC) limits to establish cleanliness thresholds for livestock trailers. The intention was that ATP bioluminescence would reduce disease transmission risk within a sow farm and to other wean-to-finish facilities when pigs are moved to other locations. The hypothesis for this experiment was that ATP bioluminescence would provide the same rapid, easy-to-use control limits in farrowing rooms as in livestock trailers to provide real-time feedback on the cleanliness of farrowing rooms between groups of sows.
MATERIALS AND METHODS
No animals were used during this experiment. Institutional Animal Care and Use Committee (IACUC) approval was not necessary for this experiment.
Experimental Design
Sampling occurred between April and May 2024 at a 5,600-sow commercial farm in western Illinois. The sow farm recently completed a porcine reproductive and respiratory virus and Mycoplasma elimination program but was experiencing frequent Rotavirus outbreaks during the sampling period. The designated sow farm weaned approximately 200 litters of pigs each week and each litter averaged 12.5 weaned pigs per sow. Each farrowing room consisted of 4 rows of 14 crates each for a total of 56 crates per room. Approximately 4 farrowing rooms were washed every week.
Cleaning procedures followed the farm standard operating procedure for farrowing room cleaning at the farm. Farrowing rooms were scraped to remove manure from the alleyways and farrowing crates. After most of the manure was scrapped into the pit, farrowing rooms were power washed with a commercial pressure washer (model 1474P, Hotsy Equipment Company, Princeton, IL) by farm personnel with fresh hot water at 3,000 pounds per square inch to remove any residual material that remained. The farrowing room was then visually inspected while still wet. Then, the room was disinfected using an Accelerated Hydrogen Peroxide (Intervention, Virox Technologies Inc., ON Canada) at a dilution of 1:64 after it was visually determined clean by farm personnel.
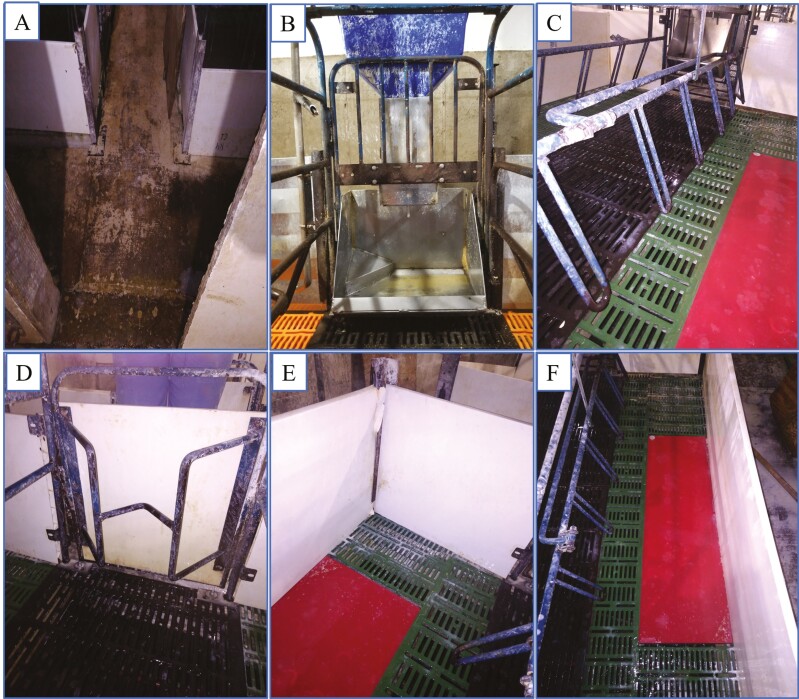
Locations sampled were the entryway floor and 5 areas within the crate including the sow feeder, sorting bars, back wall, corners, and piglet floor mat (Fig. 1). These 6 locations were chosen as they were suspected to be difficult to clean and because they could be accessed from outside of the crate without the need to step into the crate and potentially introduce contamination.
Figure 1.
Locations sampled for ATP residue using 3 ATP luminometers, coliform plate counts, and molecular testing to detect the presence of Rotavirus A/B/C. Farrowing room locations include (A) entryway floor, (B) sow feeder, (C) farrowing crate sorting bars, (D) farrowing crate back wall, (E) farrowing crate corner, and (F) piglet floor mat.
A total of 21 farrowing rooms were sampled at the sow farm (105 crates total). Five crates within each room and the entryway floor were swabbed using 3 ATP luminometers to determine variability in ATP bioluminescence RLUs within a crate and across luminometers (Fig. 1). There was a total of 26 ATP swabs per machine for each room. The feeder was removed and not available for swabbing for one crate during the sampling period resulting in 545 total ATP swabs per luminometer for the study (Table 1). Additionally, 14 farrowing rooms of the 21 sampled for ATP bioluminescence were randomly selected and swabbed in the same locations for coliform plate counts (CPC) to determine total colony-forming units (CFU) and real-time reverse transcriptase polymerase chain reaction (RT-rtPCR) to detect levels of residual rotavirus ribonucleic acid (RNA). There was a total of 364 environmental swabs collected during the project. However, only 329 were included in the statistical analyses due to large variability in cleanliness outcomes that resulted in CPC values that exceeded the quantifiable threshold for the procedure.
Table 1.
Number of observations of ATP bioluminescence, environmental coliform plate count (CPC) bacterial swabs, and molecular PCR swabs for Rotavirus by farrowing room location
|
Farrowing room location |
ATP Luminometer | CPC bacterial swabs | Rotavirus PCR swabs | ||
|---|---|---|---|---|---|
| Charm novaLum II-X | 3M Clean Trace | Neogen AccuPoint | |||
| Entryway floor | 21 | 21 | 21 | 11 | 14 |
| Sow feeder | 104 | 104 | 104 | 56 | 70 |
| Farrowing crate sorting bar | 105 | 105 | 105 | 54 | 70 |
| Farrowing crate back wall | 105 | 105 | 105 | 64 | 70 |
| Farrowing crate corner | 105 | 105 | 105 | 59 | 70 |
| Piglet floor mat | 105 | 105 | 105 | 61 | 70 |
| Total | 545 | 545 | 545 | 305 | 364 |
Three different ATP bioluminescence luminometers were used and each required a unique swab. The luminometers were used to determine variability within a crate and their ability to determine real-time cleanliness. Swabs were collected from 3 rooms in week 1, 4 rooms in week 2, 5 rooms in week 3, 4 rooms in week 4, and 5 rooms in week 5 for a total of 21 rooms and 105 crates sampled during the study. Twelve of the 21 rooms were sampled early in the week (Sunday, Monday, or Tuesday) and 9 of the 21 rooms were sampled late in the week (Thursday, Friday, or Saturday). No rooms were sampled on Wednesday because the farm does not wean piglets on Wednesdays.
A total of 14 rooms were randomly selected for environmental testing to determine total bacterial counts and for RT-rtPCR to determine the presence of Rotavirus. A total of 364 environmental swabs were collected from the same locations as the ATP bioluminescence swabs. The ATP bioluminescence swabs were diluted the day after collection and quantified 22 h after dilution for CPC at the Carthage Veterinary Diagnostics Laboratory. Molecular swabs were collected, frozen, and stored at −80 °C until the conclusion of the trial when they were tested by RT-rtPCR.
Measurement of ATP bioluminescence
Three individual luminometers and testing kits were used to measure ATP residues on surfaces approximately 20 min after disinfection. The first luminometer was Charm Sciences novaLUM II-X (Charm Sciences, Inc., Lawrence, MA). The second luminometer was a 3M Clean-Trace luminometer (Neogen Corporation, Lansing, MI). The third luminometer was a Neogen AccuPoint luminometer (Neogen Corporation, Lansing, MI). The novaLUM II-X sampler consisted of a clear plastic tube with a tableted luciferin–luciferase reagent and a sterile swab. The 3M Clean-Trace and AccuPoint samplers each consisted of a clear plastic tube filled with liquid stable luciferin–luciferase reagent and a sterile swab. A 10 cm × 10 cm square was drawn with vertical and horizontal back-and-forth motions to fill the square for each sample for the 3 luminometers. Each square was adjacent or directly next to one another for all 3 luminometers. The novaLUM II-X sampler had the top screwed on securely and was shaken 3 times before being inserted into the luminometer chamber to measure the RLU reading. The Clean Trace sample was swirled for 5 s and then inserted into the clear unibody in the luminometer chamber to measure the RLU reading. A similar process occurred for the AccuPoint sampling procedure. The AccuPoint sample was swirled for 2 s and then inserted into the luminometer chamber to measure the RLU reading. The luminometers were calibrated with a positive and negative control between rooms to verify instrument accuracy.
Coliform plate counts
Coliform plate counts were estimated on farrowing crate surfaces using a method adapted from Letsch et al. (2024). Briefly, a 10 × 10 cm gauze was soaked in 10 ml of Dey Engly (D/E) neutralizing broth (Fisher Scientific, Waltham, MA) before being pressed on both sides of the sampled surface. The results were reported as the number of CFU per 100 cm2 (CFU/100cm2). All samples were held at 4 °C for 12 h before being serially diluted from 100 to 10−2. Serial dilutions were made in 96 well plates by taking 20 µL of the previous dilution into 180 µL of D/E broth. A pilot study was completed prior to the start of this trial to estimate expected CPC loads for each sample location. Samples suspected to have greater CPC results based on the initial pilot study were selected for additional dilutions from 10−3 to 10−8 to minimize or eliminate the number of incomplete titrations. Exactly 100 µl of each dilution was spread onto standard MacConkey agar plates (Fisher Scientific). The plates were incubated for 22 h at 37 °C and the number of colonies per plate was counted. Total coliform counts per surface area were estimated by multiplying the colony-forming counts per milliliter by approximately 10.687 to get the total estimated bacterial count in the collected sample or the total number of bacteria trapped in the 10 × 10 cm gauze. Coliform counts were quantified at the Carthage Veterinary Diagnostics Laboratory.
Testing for Rotavirus A/B/C RNA
Viral RNA was extracted from environmental swabs using the MagMAX Core extraction kit on a Kingfisher-96 magnetic particle processor consistent with manufacturer instructions using the simple workflow (Applied Biosystems, Foster City, CA). Xeno internal positive control was added to the lysis solution prior to extraction. RT-rtPCR was performed using commercially available VetMAX Rotavirus A/B/C multiplex reagents (Applied Biosystems). Signal amplification was monitored using a 7500 Fast thermocycler (Applied Biosystems). Two negative extraction controls and 2 positive amplification controls were included per run. Thresholds were established for all targets by taking 10% of the average maximum fluorescence in the positive amplification controls. The baseline was established starting at cycle 3 and ending at cycle 15. Cycle thresholds (Cts) greater than > 36 were considered negative for all 3 viruses.
Statistical Analysis
Comparisons of RLU among luminometers, CFU per 100 cm2, or Ct units to farrowing room location were performed using a linear mixed model with log transformations of continuous outcomes before analysis using R statistics software (v 4.3.0). Responses were modeled with the lme4 package (v1.1-33) with the wash sequence included as a random effect. A small value (0.1) was applied before log transformation to remove any zero values. A Tukey–Kramer test was applied to all pairwise contrasts between estimated marginal means to control family-wise error rate. Estimated marginal means were calculated using the emmeans package (v1.8.5). Receiver operating characteristic (ROC) curves and area under the curve (AUC) were compared with the pROC package (v1.18.4).
Statistical process control critical limits for cleanliness were calculated by log-transforming raw RLU data into log-based 10 RLU data. X-bar charts were developed to monitor the mean of successive samples of constant size (n). There was a large variation (i.e., high standard deviation) of RLU data within each of the 6 locations. Because the standard deviation was greater than anticipated, the inner quartile range (IQR) of the log-transformed data were calculated. As a means to objectively reduce the standard deviation within a location, only log-transformed RLU data falling within the IQR was used to recalculate an adjusted standard deviation for each luminometer at each location. Log RLU was independently averaged using all observations within a particular location for each luminometer. Critical limits for cleanliness were calculated using the location mean log-transformed RLU data multiplied by 3 times the adjusted standard deviation. The antilog of the log-transformed RLU cleanliness threshold was calculated to provide a real-time decision outcome for cleaning teams on the farm.
Correlations were considered weak (in absolute value) at r ≤ 0.35, correlations were considered moderate at 0.36 ≤ r ≤ 0.67, and strong correlations were those r ≥ 0.68 (Taylor, 1990).
RESULTS
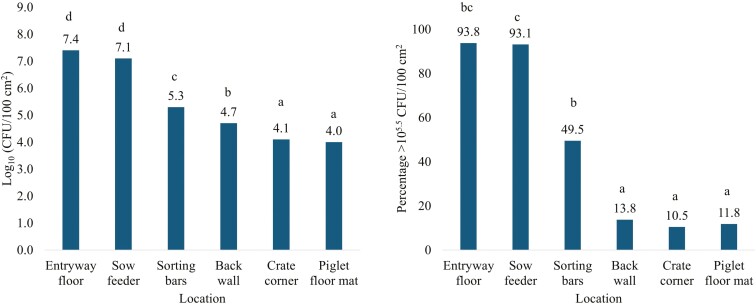
Coliform plate counts for the 12 rooms that were sampled early in the week (Sunday, Monday, or Tuesday) were not different (P = 0.73; data not displayed provided in tabular form) from the 9 rooms sampled late in the week (Thursday, Friday, or Saturday). Bacterial loads were quantified separately at each of the 6 locations in the farrowing room (Fig. 2). There were differences (P < 0.01) of CFU by farrowing room location. The bacterial load on the entry floor was not different (P = 0.96) than the sow feeder but was at least 2.07 Log10 greater (P < 0.001) compared to the sorting bars, back wall, corner, and piglet floor mat. The sow feeder was at least 1.78 Log10 greater (P < 0.001) compared to the sorting bars, back wall, corner, and piglet floor mat (Fig. 2). The sorting bars were at least 0.60 Log10 greater (P ≤ 0.03) compared to the back wall, corner, and piglet floor mat. The back wall was at least 0.62 Log10 greater (P ≤ 0.01) than the corner and piglet floor mat. The corner and piglet floor mats did not differ (P = 1.00). The percentage samples collected with CFU greater than 105.5 CFU/100cm2 was greatest for the entryway floor (93.8%) followed by the sow feeder (93.1%), sorting bars (49.5%), back wall (13.8%), piglet floor mat (11.8%), and corner (10.5%, Fig. 2). The entryway floor was not different (P ≥ 0.15) compared to the sow feeder and sorting bars, but the number of swabs greater than 105.5 CFU/100cm2 for the sow feeder was 2.63% greater (P < 0.001) compared to the sort bars. The back wall, corner, and piglet floor mat were not different (P ≥ 0.99).
Figure 2.
(A) Bacterial counts by farrowing room location in CFU per 100 cm2 (area of 10 cm × 10 cm gauze). (B) Percentage of bacterial counts above 105.5 CFU per 100 cm2 by farrowing room location. Farrowing room locations include the entryway floor, sow feeder, farrowing crate sorting bars, farrowing crate back wall, farrowing crate corner, and the piglet floor mat. Means that do not share a superscript differ (P ≤ 0.05).
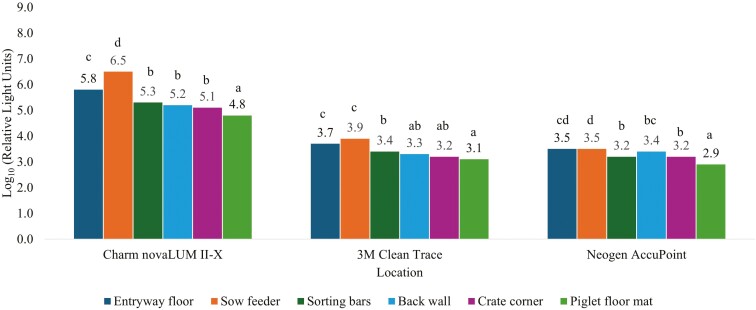
The ranking pattern in RLU measured with the 3 luminometers was similar to the CPC data (Fig. 3). The area with the greatest RLU for the Charm novaLUM II-X was the sow feeder (Log10 6.5 RLU) which was 0.74 Log10 greater (P < 0.01) than the entry way floor (Log10 5.8 RLU, Fig. 3), 1.24 Log10 greater (P < 0.01) than the sorting bars (Log10 RLU 5.3), 1.30 Log10 greater (P < 0.01) than the back wall (Log10 RLU 5.2), 1.42 Log10 greater (P < 0.01) than the corner (Log10 RLU 5.1), and 1.69 Log10 greater (P < 0.01) than the piglet floor mat (Log10 RLU 4.8). The RLU measured at the entryway floor were 0.50 Log10 greater (P < 0.01) than the sorting bars, 0.56 Log10 greater (P < 0.001) than the back wall, 0.68 Log10 greater (P < 0.001) than the corner, and 0.95 Log10 greater (P < 0.001) than the piglet floor mat. The sorting bars, back wall, and corner were at least 0.27 Log10 greater (P < 0.01) than the piglet floor mat, but not different from each other (P ≥ 0.19).
Figure 3.
Surface contamination levels across 6 locations as measured by relative light units (RLU) with 3 independent ATP luminometers. Farrowing room locations include entryway floor, sow feeder, farrowing crate sorting bars, farrowing crate back wall, farrowing crate corner, and the piglet floor mat. ATP luminometers were novaLUM II-X (Charm Sciences, Lawrence, MA), 3M Clean Trace (Neogen Corporation, Lansing, MI), or Neogen AccuPoint (Neogen Corporation, Lansing, MI). Means within a luminometer that do not share a superscript differ (P ≤ 0.05).
The 3M Clean Trace luminometer reported at least 0.35 Log10 greater (P ≤ 0.04) RLU readings in both the entryway floor and sow feeder compared to the sorting bars (Log10 3.4 RLU), at least 0.45 Log10 greater (P < 0.01) than the back wall (Log10 RLU 3.3), at least 0.53 Log10 greater (P < 0.001) than the corner (Log10 3.2 RLU), and at least 0.59 Log10 greater (P < 0.001) than the piglet floor mat (Log10 3.1 RLU). The sorting bars were 0.45 Log10 greater (P < 0.001) than the piglet floor mat. The sorting bars were not different (P ≥ 0.10) compared to the back wall and corner and the piglet floor mat was not different (P ≥ 0.32) compared to the corner and back wall.
Relative light unit readings for the AccuPoint luminometer were at least 0.27 Log10 greater (P ≤ 0.03) in both the entryway floor and sow feeder compared to the sorting bars (Log10 3.2 RLU), at least 0.28 Log10 greater (P ≤ 0.03) than the corner (Log10 3.2 RLU), and at least 0.59 Log10 greater (P < 0.001) than the piglet floor mat (Log10 2.9 RLU). The entryway floor was not different (P = 0.59) compared to the back wall but was 0.27 Log10 greater (P ≤ 0.03) than the sorting bars, 0.28 Log10 greater (P ≤ 0.03) than the corner, and 0.59 Log10 greater (P < 0.001) than the piglet floor mat. The sorting bars, back wall, and corner were not different (P ≥ 0.12) from each other but were at least 0.31 Log10 greater (P < 0.001) than the piglet floor mat.
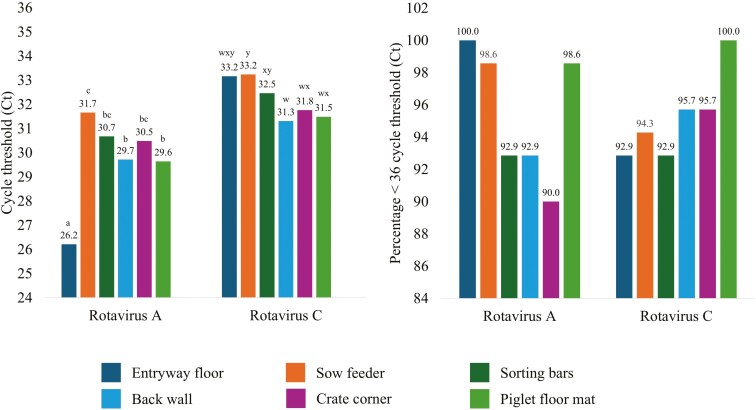
Rotavirus A was reduced (P < 0.001; Fig. 4) by at least 0.83 Log10 Ct for the entryway floor compared to all other locations. The piglet floor mat and back wall were reduced (P ≤ 0.01) by at least 0.94 Log10 Ct compared to the sow feeder but were not different (P = 1.00) from each other. Corner, sorting bars, and sow feeder were not different (P ≥ 0.28) from each other. Rotavirus C was reduced (P ≤ 0.03) by at least 0.94 Log10 Ct for the back wall compared to sorting bars and the sow feeder but did not differ (P ≥ 0.07) from the piglet floor mat, corner, or entryway floor. The piglet floor mat and corner were at least 0.96 Log10 Ct reduced (P < 0.01) compared to the sow feeder. The entryway floor was not different (P ≥ 0.07) from all other locations. All locations in the farrowing rooms averaged less than 36 Log10 Ct for both rotavirus A and C. There was no positive detection of rotavirus B for any location (data not displayed). There were no differences (P ≥ 0.41) in the percentage of samples positive for either rotavirus A or C. At least 90% of samples from all farrowing room locations were positive for rotavirus A and C.
Figure 4.
(A) Cycle thresholds for rotavirus A and rotavirus C by farrowing room location. (B) Percentage of cycle thresholds below 36 for rotavirus A and rotavirus C by farrowing room location. Farrowing room locations include entryway floor, sow feeder, farrowing crate sorting bars, farrowing crate back wall, farrowing crate corner, and the piglet floor mat. Means across farrowing room locations, but within Rotavirus A or C that do not share a superscript differ (P ≤ 0.05).
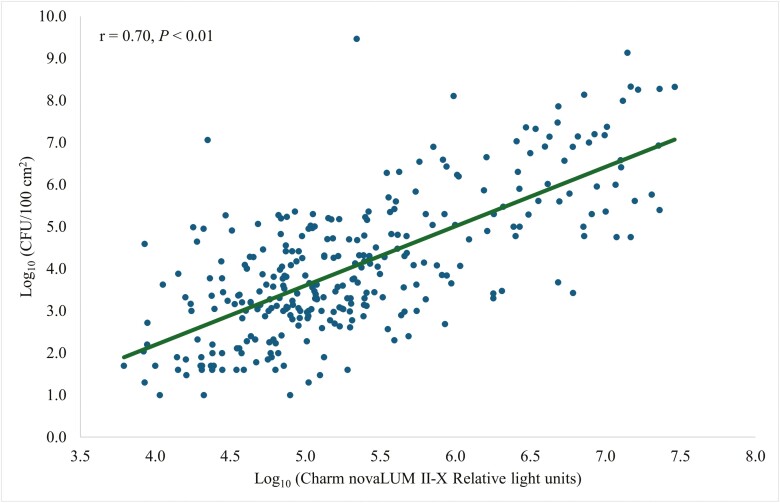
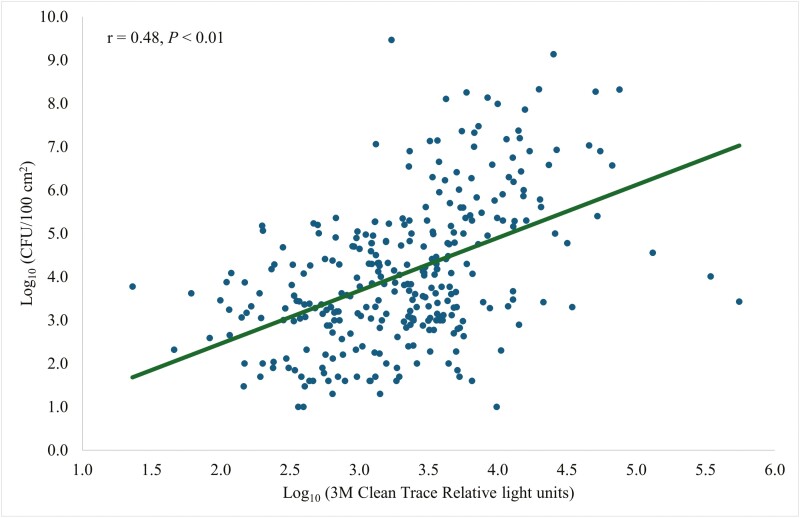
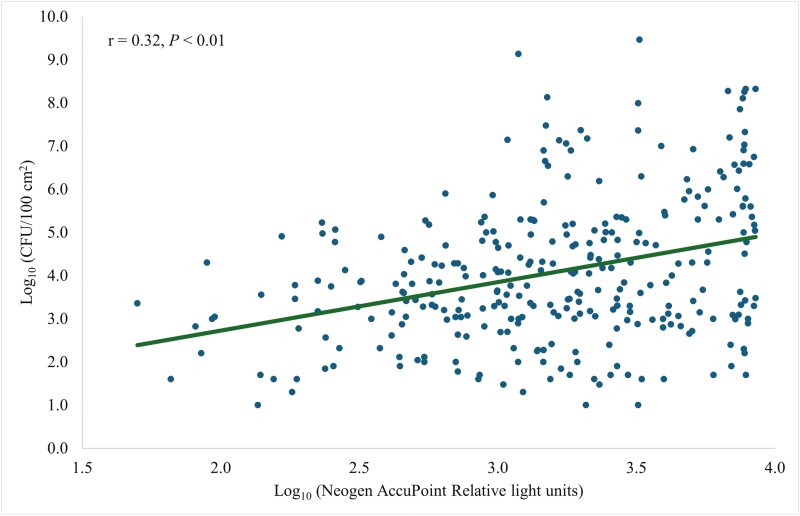
Coliform plate counts were strongly correlated (r = 0.70, P < 0.01; Fig. 5) with Charm novaLUM II-X RLU. The Clean-Trace CPCs and RLU were moderately correlated (r = 0.48, P < 0.01; Fig. 6). There was a weak correlation (r = 0.32, P < 0.01; Fig. 7) between CPCs and AccuPoint RLU.
Figure 5.
Prediction of CFU per 100 cm2 of surface area using a Charm Sciences novaLUM II-X ATP bioluminescence luminometer.
Figure 6.
Prediction of CFU per 100 cm2 of surface area using a 3M Clean Trace ATP bioluminescence luminometer.
Figure 7.
Prediction of CFU per 100 cm2 of surface area using a Neogen AccuPoint ATP bioluminescence luminometer.
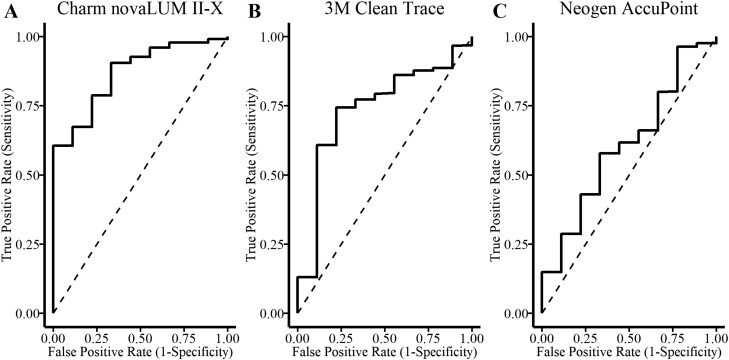
Receiver operating characteristic curves were developed for each assay using CPCs as the gold standard diagnosis of cleanliness. A threshold level of 250 CPC/100 cm2 was selected as a pass–fail threshold based on work described by many studies within food processing facilities (Cunningham et al., 2011; Ching et al., 2021). It was determined microbial contamination greater than 2.5 CFU/cm2 was not suitable for use in human food preparation. It was assumed the standard of cleanliness used in food processing facilities to be strict enough to prevent disease in nursing pigs. Therefore, samples with CPC greater than 250 CPC/100 cm2 were considered positive. The AUC was computed by the trapezoidal rule and compared among the 3 instruments (Fig. 8). The AUC for the Charm novaLUM II-X (0.87) was greater compared to the Clean-Trace luminometer (0.74, P = 0.04) and AccuPoint luminometer (0.61, P = 0.001) but the Clean-Trace and AccuPoint luminometers were not different (P = 0.21).
Figure 8.
Comparison of performance among (A) Charm novaLUM II-X, (B) 3M Clean-Trace, and (C) Neogen AccuPoint luminometers by comparing the area under the ROC curve for each instrument. Aerobic plate counts as the gold standard of cleanliness for comparison with 250 CFU per cm2 as the threshold.
DISCUSSION
Adenosine triphosphate comes from a variety of sources that include both living and dead cells, therefore not all ATP that contributed to greater RLU readings originated from living cells. The amount of ATP is dependent on the organism present and the growth phase of that organism. Colony-forming unit assays only measure living cells. Adenosine triphosphate can stem from many sources making it an inexact proxy for CFU, still, a correlation was observed in this study. Testing for ATP can confirm a surface is clean, and testing for CFU can verify the sanitizer is working. Viruses do not directly utilize ATP; however, both ATP and PCR Cts are indirect measurements of fecal contamination that potentially have infectious material present.
Coliform plate counts for the 12 rooms that were sampled early in the week (Sunday, Monday, or Tuesday) were not different than the 9 rooms sampled late in the week (Thursday, Friday, or Saturday). Sunday was considered early and Saturday late in the week because Sunday is considered day 1 of the production week. Therefore, variability in farrowing room cleanliness is likely not attributed to different wash teams but rather due to the complexity of the equipment and the environmental conditions inherent to a farm.
The use of ATP has successfully been used to assess equipment cleanliness in food processing facilities to eliminate potential sources for the transmission of foodborne pathogens (Azizkhan, 2014). Healthcare facilities also routinely use ATP bioluminescence (Aycicke et al., 2006; Boyce et al., 2009) as a way to prevent the spread of microorganisms that contaminate surfaces and medical devices leading to morbidity and mortality among patients. Near-sanitized levels are required to prevent infection, but in farrowing rooms, the tolerance for surface contamination is much greater. Because of the successful adoption of this technology in other industries, there may be applications on commercial sow farms to improve farrowing room hygiene and reduce the risk of disease transmission. Recently livestock trailers were evaluated similarly to the current study (Letsch et al., 2024). The trailers appeared to be clean and had relatively little variation among locations after being washed and disinfected. Receiver operating characteristic curves with a threshold level of 250 CFU/100 cm2 were used as a pass–fail threshold based on prior studies (Cunningham et al., 2011; Ching et al., 2021). The AUC is a combined measure of sensitivity and specificity and in this study was used to determine how well the luminometers predicted CPC. The greater the sensitivity means less false negative results. The greater the specificity means less false positive results. The 3 luminometers were compared and the AUC for Charm was 0.87, Clean-Trace was 0.74, and AccuPoint was 0.61. The AUC for the livestock trailers were 0.64 and 0.51 for the Clean-Trace and AccuPoint respectively (Letsch et al., 2024). The AUC for the farrowing rooms had greater specificity, sensitivity, and overall predictability of CPC compared to the livestock trailers.
The areas of greatest concern for farrowing room cleanliness were the entryway floor and the sow feeder as indicated by both ATP bioluminescence and CPC. Yi et al. (2020) also sampled the sow feeder, center floor of the sow crate, and corner floor of the sow crate after cleaning and disinfection and agreed the sow feeder is an area of concern and is routinely less clean after washing and disinfection. It is important the sow feeder is thoroughly free of contamination, cleaned and sanitized, and drained after washing to avoid subsequent contamination. Any remaining or subsequent microorganisms may lead to compromised farrowing and lactation performance.
There are many potential explanations for why there were different levels of contamination across different sampling points after the wash process. During power washing, it is possible residual material gets into the sow feeder and is not thoroughly rinsed. The sow feeder is designed in a way that makes it difficult for water to be completely removed without scooping or siphoning out the water to avoid bacteria harboring in the residual water. The entryway floor has personnel walking in and out of the room from the hallway into the entryway floor potentially spreading infectious material. It is likely that this section does not get entirely cleaned or stay clean due to high foot traffic. The entryway floor may not be the best indicator of room cleanliness for these reasons. The crate sorting bars were the next greatest area of concern. It is important from a piglet health standpoint that these are free of contamination as residual material supports microbial growth (Willis et al., 2007). Wash teams should be trained to focus on hard-to-reach areas such as sow feeders and farrowing crate sorting bars. Wash teams should also utilize foot baths at the entryway door and avoid stepping from alleyways into crates. Piglets are in direct contact with residual feces in the crate and not being thoroughly clean can increase the chances of infection and dissemination of infection when pigs are moved out of the sow farms. Not only does infection compromise growth performance and weaned piglet percentage at the sow farm level, but once those pigs are weaned and sent to a facility to grow, the chance of spreading infection to other facilities across a wide geographic area increases greatly.
ATP luminometers may fit into biosecurity programs and be used to target contaminated areas because the variability of RLU in Charm novaLUM II-X was able to explain 49% of the variability in CPC (Fig. 5). Variability of RLU in Clean-Trace was able to explain 23% of the variability in CPC (Fig. 6). Variability of RLU in AccuPoint was able to explain 10% of the variability in CPC (Fig. 7). Livestock trailers were cleaner and there was less variation in cleanliness (Letsch et al., 2024) compared with the farrowing rooms which lead to greater predictability and may make ATP bioluminescence more applicable for farrowing rooms than for trailer washes. Although the main objective was to use ATP testing as a way to rapidly detect the cleanliness of the farrowing room, and not to replace CPC testing. The performance among the luminometers was compared to predict CPCs.
The ranking among locations for rotavirus detection did not follow the ranking for CPC or RLU, but all locations were below Ct < 36 and considered positive. In some locations, 100% of the areas sample had detectible levels of Rota A or C. In livestock trailers (Letsch et al., 2024) residual PED, deltacoronavirus, and TGE were completely eliminated after being washed and disinfected. The farrowing room washing procedure failed to reduce A and C rotavirus contamination in at least 90% of crates sampled for all locations. Nursing and weanling pigs are most affected by rotavirus which causes diarrhea and ultimately results in increased mortality and morbidity (Will et al., 1994). The dirtiest location based on RT-rtPCR was the entryway door enforcing that this area does not get entirely cleaned or stay clean due to high foot traffic. Farm personnel should not be stepping from alleyways into crates to minimize viral transfer. Additionally, the piglet floor mat and back wall had a higher viral RNA compared to the sow feeder post-wash and disinfection meaning piglets may be at higher risk as these are high piglet contact areas.
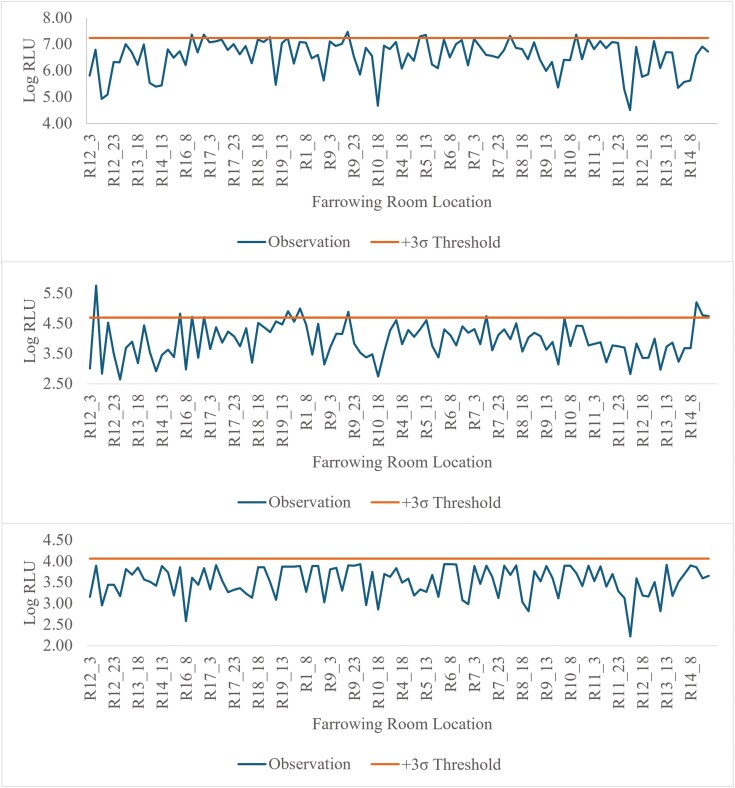
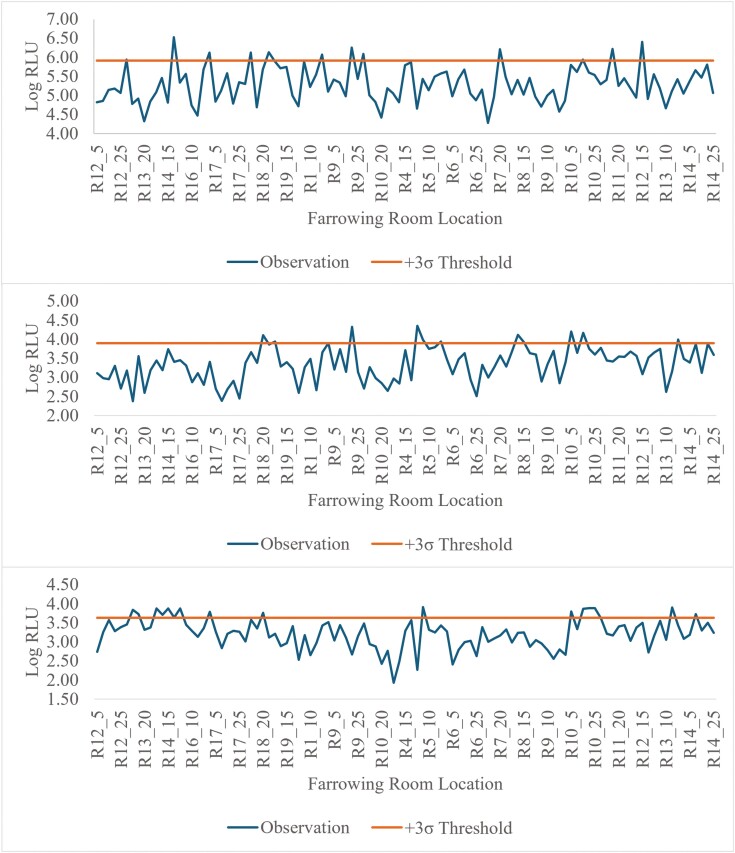
These data support the use of monitoring both the sow feeder and piglet sorting bars for residual infectious material that may cause sickness in the sows and piglets. Although all luminometers quantify ATP in RLU there are multiple ATP assays and each luminometer varies in sensitivities. There are specific quantification methodologies unique to each luminometer that can lead to differences in RLU values not related to the presence of ATP. Therefore, detection thresholds must be calculated for each monitoring location prior to implementation. Using a 3σ threshold for failure on the sow feeder, 7.7% (8 of 104) for the Charm novaLUM II-X, 10.6% (11/104) for the 3M Clean-Trace, and 0% (0/104) for the Neogen AccuPoint would have failed the cleanliness threshold (Fig. 9). Only 3 crates were identified as failed by both the Charm novaLUM II-X and 3M Clean-Trace. The AccuPoint having 0 crates fail makes it so no crates failed all 3 luminometers. Using a 3σ threshold for failure on the sorting bars, 11.4% (12 of 105) for the Charm novaLUM II-X, 10.5% (11/105) for the 3M Clean-Trace, and 15.2% (16/105) for the Neogen AccuPoint would have failed the cleanliness threshold (Fig. 10). A similar number of crates failed the cleanliness threshold using a Charm novaLUM II-X and 3M Clean-Trace luminometer, however, only 2 crates would have failed both luminometers and only 1 crate would have failed all 3 luminometers. Using these data to generate SPC charts provides real-time feedback to personnel washing the farrowing rooms on the effectiveness of the wash and thereby reduces the risk of disease transmission when the next group of sows is loaded. It is possible that false positives or negatives may occur. However, the cost spent on labor, water, and disinfectant for another wash may be less expensive than an infectious disease outbreak. ATP bioluminescence provides a tool that aids in risk management. It appears that certain luminometers may be more effective at detecting cleanliness at certain locations opposed to others and that critical limits may be adjusted to increase or decrease the threshold from the mean depending on the risk tolerance the producer is willing to allow.
Figure 9.
Illustrative example of a SPC chart depicting log RLU from the sow feeder using a Charm novaLUM II-X (top), 3M Clean-Trace (middle), or Neogen AccuPoint (bottom) ATP luminometer. A cleanliness threshold was established as +3σ of observations above the mean observations for each luminometer. The calculated cleanliness threshold for each unit was 7.24 log (17,251,154 RLU) for the Charm novaLUM II-X, 4.68 log (48,359 RLU) for the 3M Clean-Trace, and 4.06 log (11,485 RLU) for the Neogen AccuPoint.
Figure 10.
Illustrative example of a SPC chart depicting log RLU from the crate sorting bars using a Charm novaLUM II-X (top), 3M Clean-Trace (middle), or Neogen AccuPoint (bottom) ATP luminometer. A cleanliness threshold was established as +3σ of observations above the mean observations for each luminometer. The calculated cleanliness threshold for each unit was 5.91 log (813,679 RLU) for the Charm novaLUM II-X, 3.90 log (7,958 RLU) for the 3M Clean-Trace, and 3.63 log (4,277 RLU) for the Neogen AccuPoint
CONCLUSION
Using ATP bioluminescence for rapid feedback on the surface cleanliness of farrowing crates is promising. Generating SPC charts allows wash personnel to have immediate feedback on the effectiveness of the wash and thereby reduces the risk of disease transmission before the next group of sows are loaded into the farrowing room. However, the adoption of ATP bioluminescence will require the determination of critical limits based on the luminometer of choice and baseline surface cleanliness. Critical limits should be monitored for changes in cleaning procedure, effectiveness, and calibration of equipment. Overall, bioluminescence is a monitoring tool that should be used in conjunction with microbial methods to monitor procedures for cleaning and disinfection.
Acknowledgments
Funding for this work was provided through the Swine Health Information Center’s wean-to-harvest biosecurity research program (grant #24-001) using funds from the Foundation for Food and Agriculture Research and the Pork Checkoff. Supplies including the use of the luminometers, and ATP swabs used during the trial were provided by Charm Sciences, Inc (Lawrence, MA) and Neogen Corporation (Lansing, MI). Dustin Boler holds the position of Editor-in-Chief for Translational Animal Science and did not peer-review or make any editorial decisions for this manuscript.
Contributor Information
Danielle C Johnson, Carthage Veterinary Service Ltd., Carthage, IL 62321, USA.
Leonardo A Leal, Carthage Veterinary Service Ltd., Carthage, IL 62321, USA.
Jeremy G Perez, Carthage Veterinary Service Ltd., Carthage, IL 62321, USA.
Diana Segundo, Carthage Veterinary Service Ltd., Carthage, IL 62321, USA.
Michael W Welch, Carthage Veterinary Service Ltd., Carthage, IL 62321, USA.
Eric Parr, Carthage Veterinary Service Ltd., Carthage, IL 62321, USA.
Matthew Meyer, Neogen Corporation, Lansing, MI 48912, USA.
Grant A Hedblom, Neogen Corporation, Lansing, MI 48912, USA.
Gabriela Lopez-Velasco, Neogen Corporation, Lansing, MI 48912, USA.
Mackenzie Mayo-Gibbons, Charm Sciences, Inc., Lawrence, MA 01843, USA.
April Molitor, Charm Sciences, Inc., Lawrence, MA 01843, USA.
Dyneah M Classen, Carthage Veterinary Service Ltd., Carthage, IL 62321, USA.
Molly Dillard, Carthage Veterinary Service Ltd., Carthage, IL 62321, USA.
Dustin D Boler, Carthage Veterinary Service Ltd., Carthage, IL 62321, USA.
Conflict of interest statement
None declared.
LITERATURE CITED
- Aycicek, H., Oguz U., and Karci K... 2006. Comparison of results of ATP bioluminescence and traditional hygiene swabbing methods for the determination of surface cleanliness at a hospital kitchen. Int. J. Hyg. Environ. Health 209:203–206. doi: 10.1016/j.ijheh.2005.09.007 [DOI] [PubMed] [Google Scholar]
- Azizkhan, Z. 2014. Comparison between ATP bioluminescence technique and traditional microbiological method to detect contamination within food facilities in Saudi Arabia (Jeddah). Public Health Front. 3:11–18. doi: 10.5963/PHF0301003 [DOI] [Google Scholar]
- Boyce, J. M., Havill N. L., Dumigan D. G., Golebiewski M., Balogun O., and Rizvani R... 2009. Monitoring the effectiveness of hospital cleaning practices by use of an adenosine triphosphate bioluminescence assay. Infect. Control Hosp. Epidemiol. 30:678–684. doi: 10.1086/598243 [DOI] [PubMed] [Google Scholar]
- Chandler‐Bostock, R., and Mellits K. H... 2015. Efficacy of disinfectants against porcine rotavirus in the presence and absence of organic matter. Lett. Appl. Microbiol. 61:538–543. doi: 10.1111/lam.12502 [DOI] [PubMed] [Google Scholar]
- Ching, C. L., Kamaruddin A., and Rajangan C. S... 2021. Assessing the performance of a real-time total adenylate (ATP+ADP+AMP) detection assay for surface hygiene monitoring in food manufacturing plants and commercial kitchens. J. Food Prot. 84:973–983. doi: 10.4315/JFP-20-294 [DOI] [PubMed] [Google Scholar]
- Cunningham, A. E., Rajagopal R., Lauer J., and Allwood P... 2011. Assessment of hygienic quality of surfaces in retail food service establishments based on microbial counts and real-time detection of ATP. J. Food Prot. 74:686–690. doi: 10.4315/0362-028X.JFP-10-395 [DOI] [PubMed] [Google Scholar]
- Hancox, L. R., Le Bon M., Dodd C. E. R., and Mellits K. H... 2013. Inclusion of detergent in a cleaning regime and effect on microbial load in livestock housing. Vet. Record. 173:167–167. doi: 10.1136/vr.101392 [DOI] [PMC free article] [PubMed] [Google Scholar]
- Jarrad, A. M. 2019. Firefly bioluminescence-based detection of ATP. Aust. J. Chem. 72:644–645. doi: 10.1071/ch19127 [DOI] [Google Scholar]
- Letsch, F. G., Welch M. W., Meyer M., Hedblom G. A., Parr E., Classen D. M., Dillard M., and Boler D. D... 2024. Evaluation of ATP bioluminescence for rapid determination of cleanliness of livestock trailers after a commercial wash. Transl. Anim. Sci. 8:txae052. doi: 10.1093/tas/txae052 [DOI] [PMC free article] [PubMed] [Google Scholar]
- Taylor, R. 1990. Interpretation of the correlation coefficient: a basic review. J. Diagn. Med. Sonogr. 6:35–39. doi: 10.1177/875647939000600106 [DOI] [Google Scholar]
- USDA-NASS. 2023. Quarterly hogs and pigs report. NASS - Quick Stats. USDA National Agricultural Statistics Service. [accessed May 28, 2024]. https://usda.library.cornell.edu/concern/publications/rj430453j?locale=en [Google Scholar]
- Will, L. A., Paul P. S., Proescholdt T. A., Aktar S. N., Flaming K. P., Janke B. H., and Wu L. L... 1994. Evaluation of rotavirus infection and diarrhea in Iowa commercial pigs based on an epidemiologic study of a population represented by diagnostic laboratory cases. J. Vet. Diagn. Invest. 6:416–422. doi: 10.1177/104063879400600403 [DOI] [PubMed] [Google Scholar]
- Willis, C., Morley R., Westbury J., Greenwood M., and Pallett A... 2007. Evaluation of ATP bioluminescence swabbing as a monitoring and training tool for effective hospital cleaning. Br. J. Infect. Control. 8:17–21. doi: 10.1177/1469044607083604 [DOI] [Google Scholar]
- Yi, S. -W., Aho A., Kim E., Oh S. I., Roh J. H., Jung Y. -H., Choe C., Yoo J. G., and Do Y. J... 2020. Evaluation of adenosine triphosphate testing for on-farm cleanliness monitoring compared to microbiological testing in an empty pig farrowing unit. J. Anim. Sci. Technol. 62:682–691. doi: 10.5187/jast.2020.62.5.682 [DOI] [PMC free article] [PubMed] [Google Scholar]


