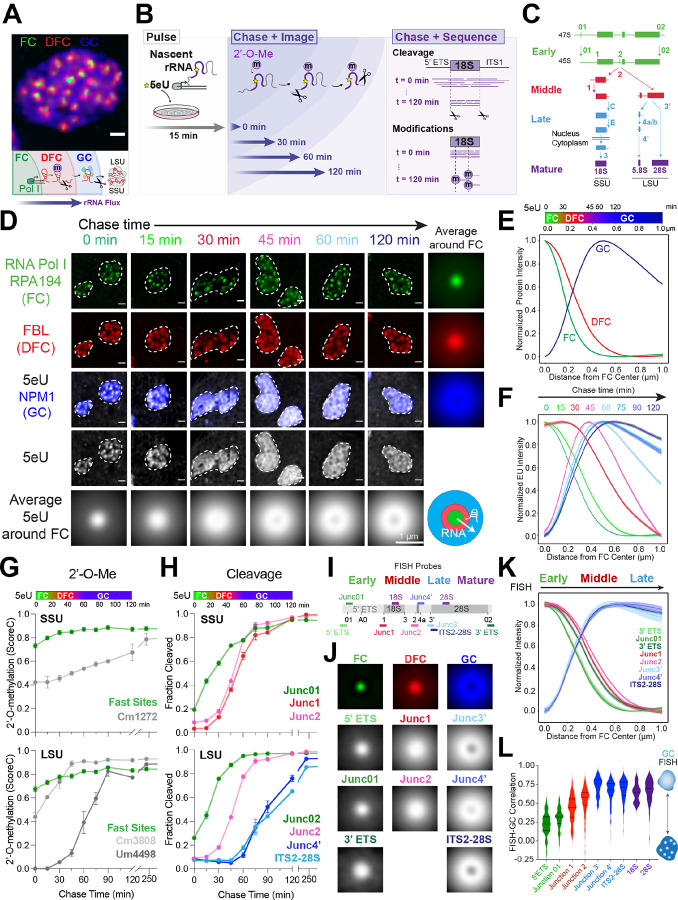
Figure 1: Sequencing and imaging of nascent ribosomal RNA flux provides a spatiotemporal map of processing in the nucleolus.
(A) The three phases of the nucleolus in MCF10A cells: the fibrillar center (FC, green), dense fibrillar component (DFC, red), and granular component (GC, blue). Schematic of pre-rRNA processing and outflux as it is assembled into small and large ribosomal subunits (SSU and LSU).
(B) The 5eU-seq and 5eU-imaging approach. Cells were pulsed with 5eU to label nascent RNA for 15 min, followed by chase with excess uridine over various time points for imaging to measure rRNA flux or sequencing to measure rRNA cleavage and 2’-O-methylation (2’-O-Me).
(C) Schematic of cleavage steps occurring during pre-rRNA processing (only one of the two cleavage pathways is drawn for simplicity). Cleavage junctions and intermediates are categorized into early (green), middle (red), late (blue), and mature (purple) based on 5eU-seq data in H.
(D) 5eU-imaging in MCF10A cells shows radial outflux of 5eU-labeled pre-rRNA from the FC center over different chase times. Individual nucleoli are outlined by dashed lines. Averaged 5eU images around FCs are shown.
(E) Min-max normalized intensities (y axis) of FC, DFC, GC nucleolar phases by distance from FC center (μm, x axis), quantified from images in D; number of nucleoli (n) = 4274. A color bar indicating the localization of FC, DFC, GC phases is shown.
(F) Min-max normalized intensities of 5eU (y axis) by distance from FC center (μm, x axis) over different chase timepoints, quantified from images in d; number of nucleoli (n) = 717, 459, 499, 603, 470, 451, 550, 525 for sequential time points.
(G) 18S and 28S pre-rRNA 2’-O-methylation (2’-O-Me) levels (ScoreC) detected by 5eU-seq over time. The top color bar relates chase time with distance, generated based on measured 5eU peak location over time (Supplementary Figure 2A).
(H) Fraction of pre-rRNA cleaved at early, middle, and late sites over time measured by 5eU-seq.
(I) Schematic of RNA FISH probe localization along rDNA.
(J) Average fluorescence images around FCs of all FISH probes and the three nucleolar phases. See Supplementary Figure 2D for example images.
(K) Min-max normalized intensity of FISH probes over distance from FC center with probes for early, middle, late rRNA cleavage junctions.
(L) Quantified Pearson’s correlation between all FISH probes and GC. For k-l, the number of nucleoli (n) = 72 (5’ ETS), 95 (3’ ETS), 24 (Junc01), 111 (Junc1), 230 (Junc2), 38 (Junc3’), 105 (Junc4’), ITS2–28S (318), 18S (72), 28S (310). Violin plots are centered by median and quartiles are shown. All scale bars = 1 μm. All error bars are s.e.m. All FCs are labeled with RNA polymerase I (Pol I) subunit RPA194 IF, DFCs with fibrillarin (FBL) IF and GC with endogenously tagged mTagBFP2-NPM1 as validated in Supplementary Figure 2E–F.

