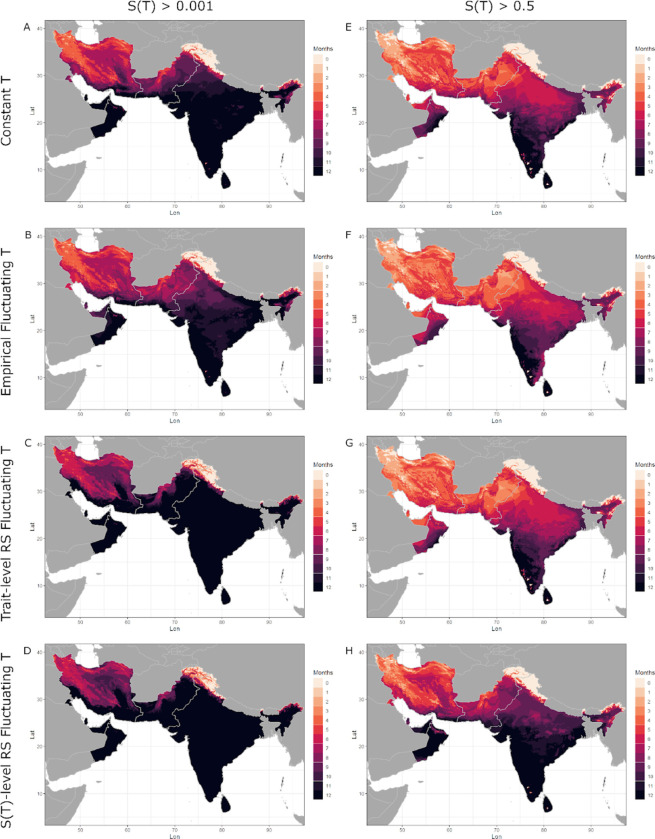
Figure 5: Months of thermal suitability, S(T), for transmission of malaria by Anopheles stephensi in its native range in Central and South Asia predicted by models parameterized using constant and fluctuating temperatures.
Left column: total months where is predicted to exceed 0.001 (i.e. when transmission is possible). Right column: total months where is predicted to exceed 0.5 (i.e. when transmission is relatively favored by temperature). Darker hues indicate more months. Top row: model 1 (constant T) uses trait TPCs fit to data across a range of constant temperatures; second row: model 2 (empirical fluctuating T) uses trait TPCs fit to data across a range of fluctuating temperatures; third row: model 4 (trait-level RS - all traits), uses trait TPCs generated by applying rate summation to TPCs fit to data from constant temperatures for all traits; bottom row: model 5 (-level RS), applies rate summation to the TPC for suitability generated from traits measured across a range of constant temperatures (i.e. the output of version 1). Fluctuating temperature models used a daily temperature range (DTR) = 12°C.

