



Summary
Obesity has been implicated in the rise of autoimmunity in women. We report that obesity induces a serum protein signature that is associated with T helper 1 (Th1), IL-17, and multiple sclerosis (MS) signaling pathways selectively in human females. Females, but not male mice subjected to diet-induced overweightness/obesity (DIO) exhibited upregulated Th1/IL-17 inflammation in the central nervous system during experimental autoimmune encephalomyelitis, a model of MS. This associated with worsened disability and a heightened expansion of myelin-specific Th1 cells in the peripheral lymphoid organs. Moreover, at steady state, DIO increased serum levels of interferon (IFN)-α and potentiated STAT1 expression and IFN-γ production by naïve CD4+ T cells uniquely in female mice. This T cell phenotype was driven by increased adiposity and was prevented by the removal of ovaries or knockdown of the type I IFN receptor in T cells. Our findings offer a mechanistic explanation for how obesity enhances autoimmunity.
Keywords: multiple sclerosis, experimental autoimmune encephalomyelitis, obesity, sex differences, interferon-α, T cells, T helper 1 differentiation, autoimmunity
Graphical Abstract

eTOC blurb
Mechanisms by which obesity and female sex synergize to facilitate CNS autoimmunity remain elusive. Cordeiro, Ahn, et al. reveal a female-specific effect of obesity in triggering a Th1 inflammatory signatures in humans and augmenting IFN-γ/STAT1 signaling in mouse CD4+ T cells through type I IFN signaling, thereby exacerbating CNS autoimmunity.
INTRODUCTION
Multiple sclerosis (MS) is an autoimmune disorder that targets the central nervous system (CNS) white matter1. This disease is thought to be initiated when autoreactive CD4+ T cells become activated, differentiate into pro-inflammatory Th1 and Th17 cells, and infiltrate the CNS to initiate inflammatory demyelination2. In support of this theory, CD4+ and CD8+ T cells secreting IFN-γ, IL-17A, and granulocyte–macrophage colony-stimulating factor (GM-CSF) are detected in acute MS lesions3, and therapies that inhibit leukocyte migration into the CNS prevent MS attacks4. Experimental autoimmune encephalomyelitis (EAE) is a Th1/Th17 cell-mediated autoimmune disease that is induced in rodents by immunization with myelin antigens in complete Freund’s adjuvant (CFA) that recapitulates many of the early pathogenic features of MS5,6. Although Th17 cells have been shown to have an advantage over Th1 cells in accessing the CNS compartment in EAE7, once on site, both Th1 and Th17 cells produce IFN-γ and GM-CSF, which license the CNS-infiltrating monocytes to produce pro-inflammatory signals that mediate oligodendrocyte death6,8.
While the immunopathogenesis of EAE is well understood, how autoreactive CD4+ T cells become activated in MS remains unknown. Clues to these mechanisms have been provided by studies of the genetic polymorphisms and environmental factors that confer MS risk9. Carriers of the major histocompatibility complex (MHC) class II MS risk allele HLA-DRB1*1501 have a ~3-fold higher risk of MS9. There is also a female preponderance of MS that manifests post-puberty, implicating female gonadal hormones in promoting autoimmunity10. Furthermore, the incidence of MS in females has increased over the past five decades, implicating changing environmental factors in disease risk11,12. One factor that has increased over this period that associates with MS is the development of obesity13. The association between obesity and MS is particularly strong in females who also carry the MS-related HLA risk genotype (odds ratio>15)14, suggesting an interaction of obesity and female sex in the promotion of Th autoimmunity in MS. The underlying mechanisms of this association remain unclear.
Here, we investigated the effect of obesity on serum proteomic signatures in men and women affected or not affected by MS and found a unique elevation of pro-inflammatory pathways including ‘Th1’, ‘IL-17’, and ‘MS’ signaling pathways in females, irrespective of MS diagnosis. We then induced DIO (diet-induced obesity) in male and female mice and discovered that this treatment increased the expansion and CNS accumulation of pro-inflammatory myelin-reactive Th1 cells especially in the females during EAE. Further studies in mice demonstrated that DIO enhanced serum IFN-α levels only in females at steady state, which associated with heightened expression of activation markers and potentiated STAT1 expression and IFN-γ production by naïve CD4+ T cells. Our findings offer a mechanistic explanation for the predominantly female-driven impact of obesity in enhancing autoimmunity.
RESULTS
Obesity alters pro-inflammatory proteomic signatures differently in men and women
To gain insights into how obesity alters inflammatory processes in men and women, we conducted a multiplexed proteomic analysis on the serum of females and males with relapsing-remitting MS (RRMS) and sex-matched controls not affected by MS who were obese (body mass index, BMI ≥ 30 kg/m2) or non-obese (BMI < 30 kg/m2) (Figures 1A–D, see Table S1 for participant characteristics). Two thresholds of significance were applied: one more stringent (false discovery rate [FDR] of 0.1), and one less stringent (p value of 0.05). Four hundred and fifty proteins were detected at a greater level in females with RRMS who were obese versus non-obese at P ≤ 0.05 (368 at FDR ≤ 0.1) (Figure 1A, Table S2). Comparatively less proteins (51 at P ≤ 0.05) were upregulated with obesity in males with RRMS (Figure 1B, Table S2). A similar sex-dependent pattern in protein changes were seen with obesity in those not affected by MS with females showing a greater number of proteins upregulated with obesity compared to males (245 proteins in females, 54 in males, p value ≤ 0.05) (Figure 1C, D, Table S2). Few proteins were downregulated with obesity in male or female MS or control participant groups (Figures 1A–D, Table S2).
Figure 1: Obesity uniquely elevates inflammatory pathways in female humans.

(A-D) Comparison of serum protein profiles of obese and non-obese male and female individuals with or without RRMS. Red and dark blue respectively denote proteins elevated or reduced by obesity at FDR of 0.1. Orange and light blue respectively denote proteins elevated or reduced by obesity at p value of ≤ 0.05. Analyses were adjusted for age and ethnicity.
(E) Venn diagram showing the number of proteins increased with obesity between each comparison (p value ≤ 0.05).
(F) Ingenuity Pathway Analysis (IPA) of signaling pathways altered in obesity. Shown are the Z-scores (X axis), 𢈒log10 p-values (size indicated by symbol size), and the number of proteins in each pathway (heat map legend) as determined using IPA.
(G) Heatmap depicting differentially abundant serum proteins that mapped to “IRF Activation”, “IL-17 signaling”, “Th1”, and “S100” signal pathways. See also Figure S1 and Table S2.
Next, the similarities and differences between the obesity-induced proteins were examined in relation to sex and disease status (Figure 1E). Surprisingly, the majority of proteins increased with obesity were distinct between men and women (Figure 1E, Table S2). Only one protein, the adipokine leptin, was increased in all four groups (Figure 1E, Table S2). By contrast, 146 proteins were commonly upregulated with obesity in control and RRMS female groups (Figure 1E, Table S2).
Ingenuity Pathway Analysis (IPA) of the differently abundant proteins was performed and this detected several inflammatory pathways that were increased solely in females with obesity (Figure 1F, Table S3). These included “S100”, “Cytokine storm”, “Th1”, “IL-17”, “IL-6”, “Dendritic Cell Maturation”, and “MS” signaling pathways. The “Activation of IRF” pathway was also upregulated with obesity in the females with RRMS (Figure 1F, Table S3). The heatmap in Figure 1G and data in Table S2 illustrate how sex, obesity, and disease status affected the cross-talk amongst proteins in some of the top upregulated pathways. When considering key proteins in these pathways, leptin and IL-6 (in the “IL-17” pathway) showed evidence of a dose-dependent upregulation with increasing BMI in both males and females (Figures S1A–B); whereas, IL-12p70 (in the “Th1” pathway) and the RNA sensor RIG-I (in the “IRF pathway”) were significantly elevated with increasing BMI only in females with RRMS (Figures S1C–D), indicating a potential sex-disease interaction in the effect of obesity on these proteins.
Because there was an incomplete overlap in the proteins that mapped to significant pathways in female MS and control groups (Table S2), and given the overrepresentation of individuals who self-identified as White in the MS cohort (Table S1), we conducted further analyses specifically focusing on participants who self-identified as “White”. We found that most of proteins upregulated with obesity in the whole cohort of MS or control participants were still significant at p-value of 0.05 (uncorrected) in the Whites-focused analyses (Table S2). Furthermore, IPA analysis identified the same pathways to be increased with obesity in White control and MS females (Table S3; Figure S1E). In sum, inflammatory signatures vary markedly between the sexes with obesity.
DIO enhances EAE severity more in female mice
In order to gain insights into the biological mechanisms underpinning the sex-dependent increase in Th1 and IL-17 pathways with obesity and to evaluate the impact of this biology on autoimmunity, we modeled a DIO state in adolescent (6-week-old) male and female C57BL/6J mice by high fat diet (HFD) feeding; controls were fed normal chow diet (NCD). Preliminary studies established that it took 4 weeks of HFD feeding for both male and female mice to show significant body weight increases over NCD-fed controls (Figure S2A). At this time, both males and females showed greater fat pad weights, but had not yet developed hyperglycemia or insulin resistance (Figures S2B–E). While male C57BL/6J mice were glucose-intolerant at 4 weeks of HFD feeding, females remained glucose-sensitive (Figures S2F–G). Given the requirement of 4 weeks of HFD feeding to achieve fat gains in females, this duration of diet treatment was used for subsequent studies.
Next, we investigated the effect of DIO on the development of CNS autoimmunity. Male and female mice were placed on HFD (DIO) or NCD (CTRL) for 4 weeks, and then EAE was induced by immunization with myelin oligodendrocyte glycoprotein peptide 35-55 (MOG35-55)/CFA and pertussis toxin (PTX) injections. We observed that DIO increased the severity of EAE in both sexes, but this effect was more prominent in the females (Figures 2A–B). Although DIO and control mice exhibited a similar timing of EAE onset (Figure 2C), peak and cumulative scores were greater than controls only in the female DIO group (Figures 2D–E). Histological analysis of the spinal cords at endpoint revealed greater demyelination in the DIO females (Figures 2F–J).
Figure 2: Diet-induced obesity increases EAE severity, especially in female mice.
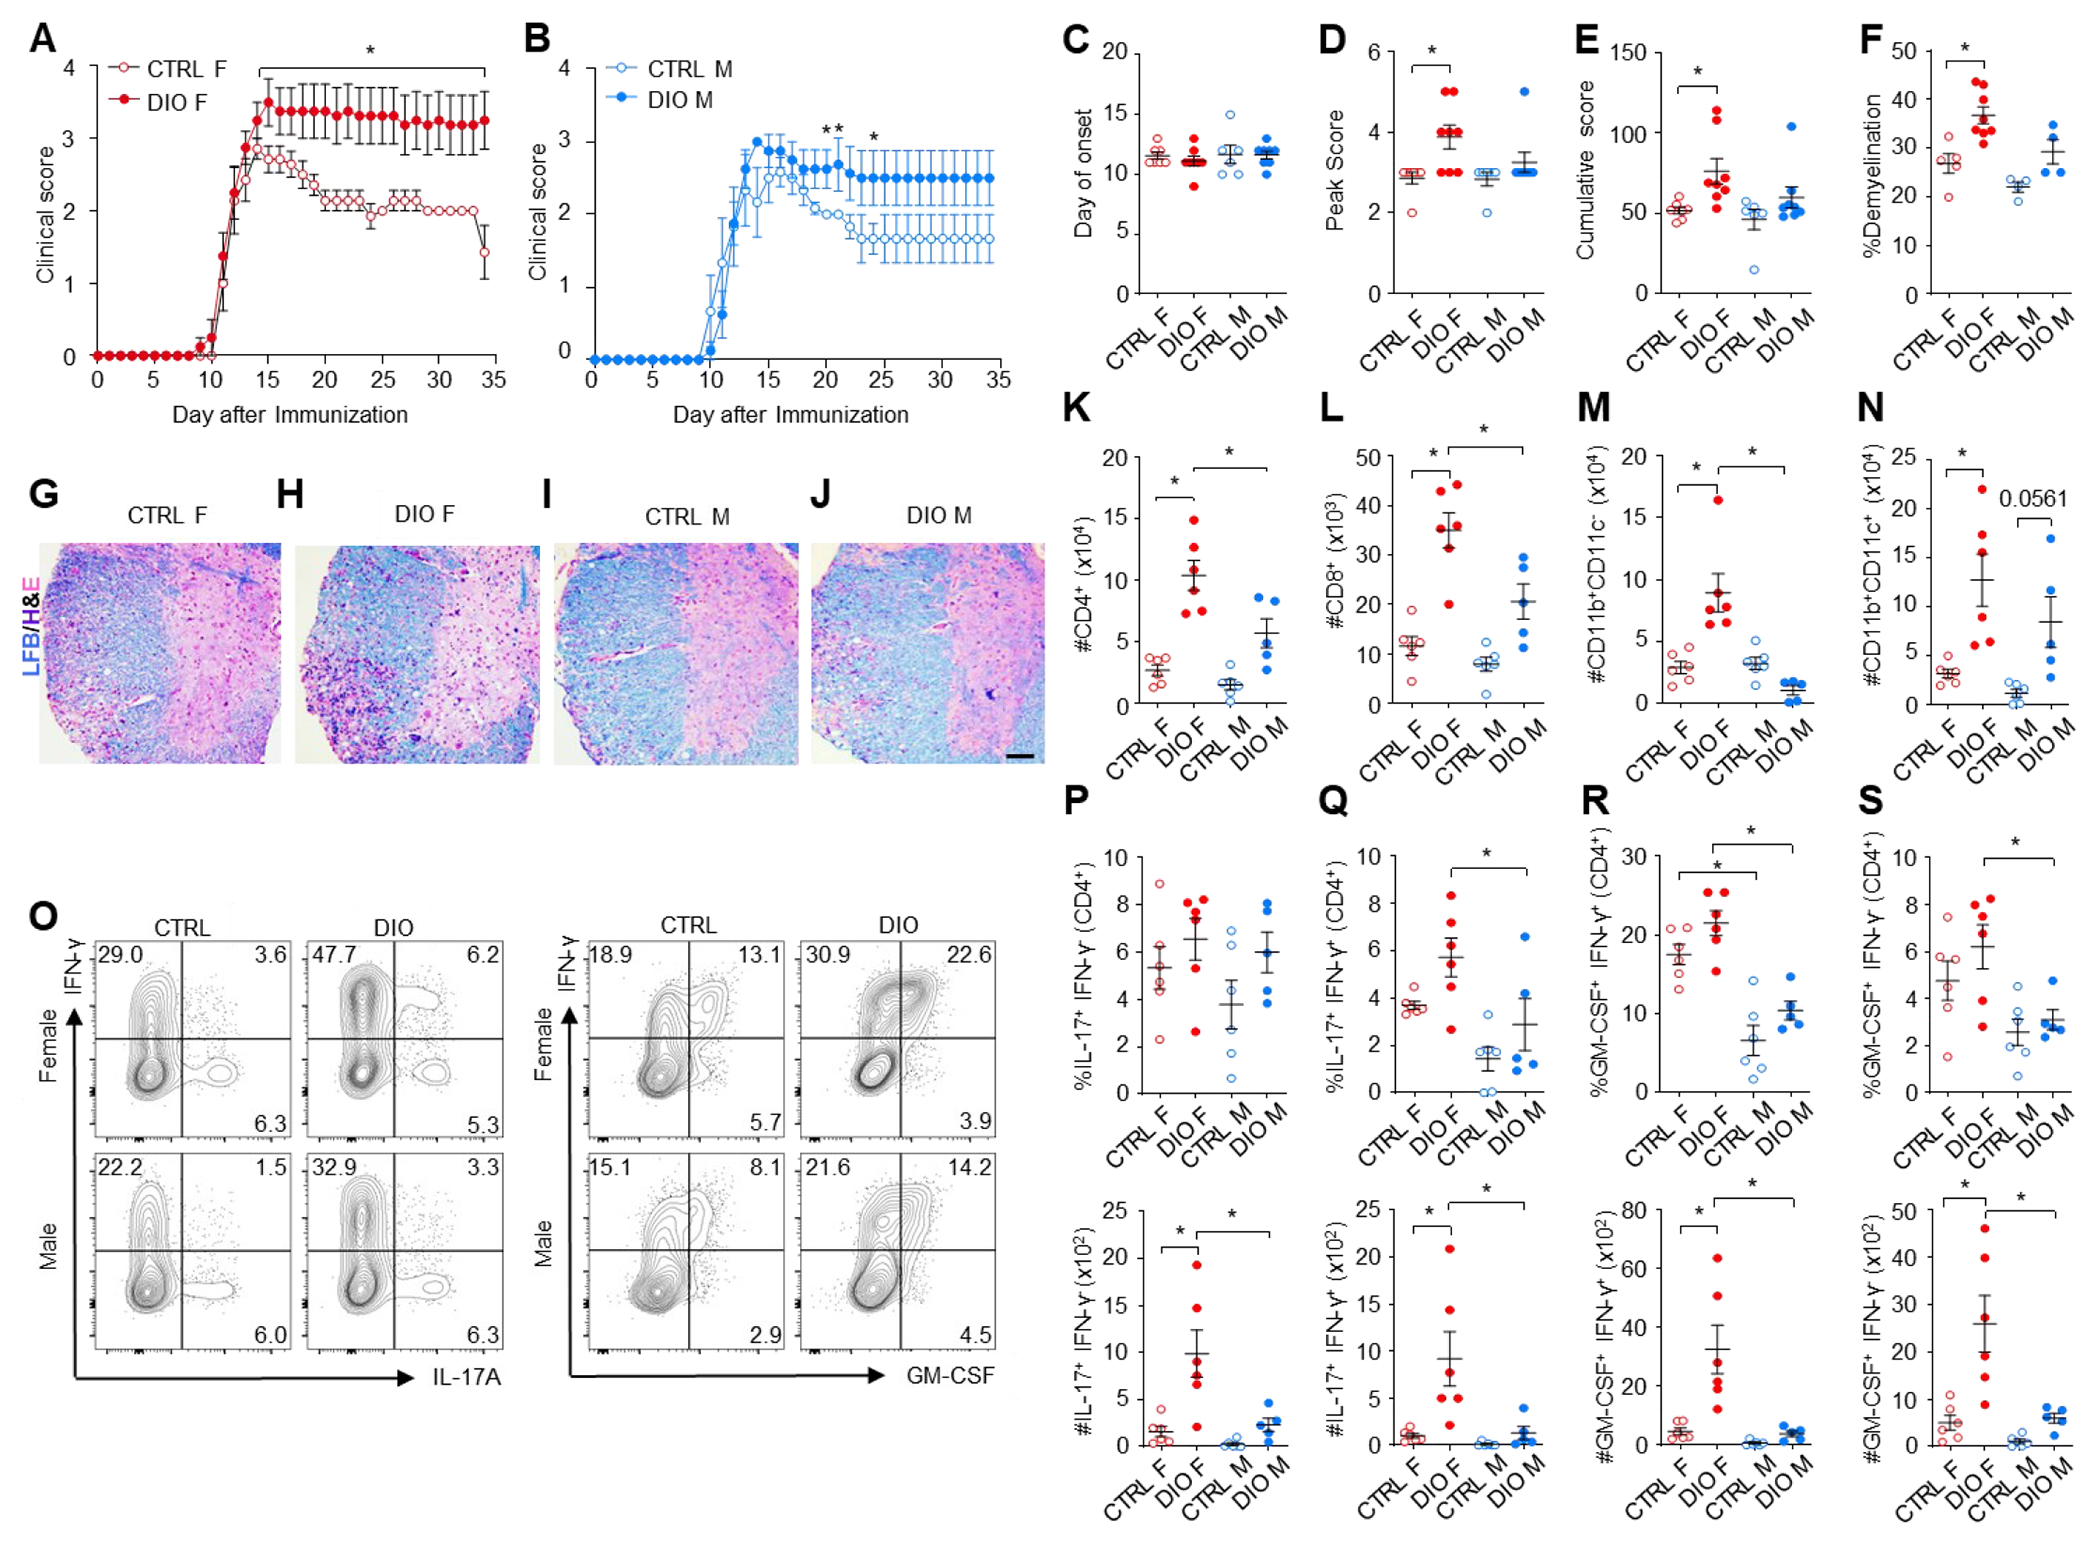
EAE was induced in control (CTRL) and DIO C57BL/6J mice with MOG35-55/CFA and PTX.
(A-B) Clinical scores of (A) female and (B) male mice.
(C) Day of symptom onset.
(D) Peak clinical score.
(E) Cumulative disease score.
(F) Percent demyelinated white matter in thoracic spinal cord.
(G-J) Representative images of H&E- and LFB-stained thoracic spinal cord sections. Scale bar=50 μm.
(K-N) Total numbers of CD4+ T cells (K), CD8+T cells (L), CD45hiCD11b+CD11c− cells (M), and CD45hiCD11b+CD11c+ cells (N) in the CNS at 2-4 days post-symptom onset.
(O) Representative intracellular cytokine staining in the live CD4+ gate after PMA/Ionomycin restimulation.
(P-S) Frequency (top) and number (bottom) of CD4+ T cells staining for the indicated cytokines.
Data are presented as mean ± S.E.M. Data points in C-F, K-N, P-S are individual mice from one experiment that is representative of three performed. *p ≤ 0.05 between groups as determined by two-tailed Mann-Whitney U test (A,B) or two-way ANOVA and Bonferroni post-hoc test (C-S).
We next characterized immune cell infiltration in the CNS at the onset of EAE symptoms using flow cytometry (Figure S2H). DIO female mice exhibited a significantly greater number of CD4+ T cells, CD8+ T cells, CD11b+CD11c− cells, CD11b+CD11c+ cells, and microglia, but not B cells or neutrophils compared to female controls (Figures 2K–N, Figures S2I–K). Intracellular cytokine staining revealed that DIO females exhibited a greater CNS accumulation of all pro-inflammatory CD4+ T cell subsets examined (Figures 2O–S) including the IFN-γ+ IL-17+ CD4+ T cells, which are enriched in MOG-specific T cells8 (Figures 2O, Q). These immune cells subsets were not increased in the males with DIO (Figure 2P–S). The expressions of IFN-γ and GM-CSF in CD4+ T cells were also greater in the females (Figures S2L–N). Thus, DIO enhanced the CNS accumulation of pro-inflammatory IFN-γ-producing CD4+ T cells uniquely in female mice during EAE.
MOG-specific Th1 cells expand more in female mice during DIO
Since increased T cell infiltration seemed to underlie the more severe EAE phenotype in females with DIO, we evaluated MOG35-55-specific Th responses in the peripheral lymphoid organs of control and DIO mice prior to development of EAE symptoms. We found that DIO increased the frequency of MOG35-55-specific CD4+ T cells in the spleens of male and female mice (Figures 3A–B); however, the number of MOG-specific CD4+ T cells was increased only in the females with DIO (Figure 3C). DIO also enhanced MOG35-55-elicited IFN-γ, IL-2, and IL-17 responses in both male and female mice; however, the extent of the increase in IFN-γ was greater in the females (Figures 3D–F). This finding of increased Th1 and IL-17 inflammation in females with DIO mirrors the serum inflammatory signatures detected in human females with obesity.
Figure 3: DIO increases Th1 responses predominantly in female mice during EAE.
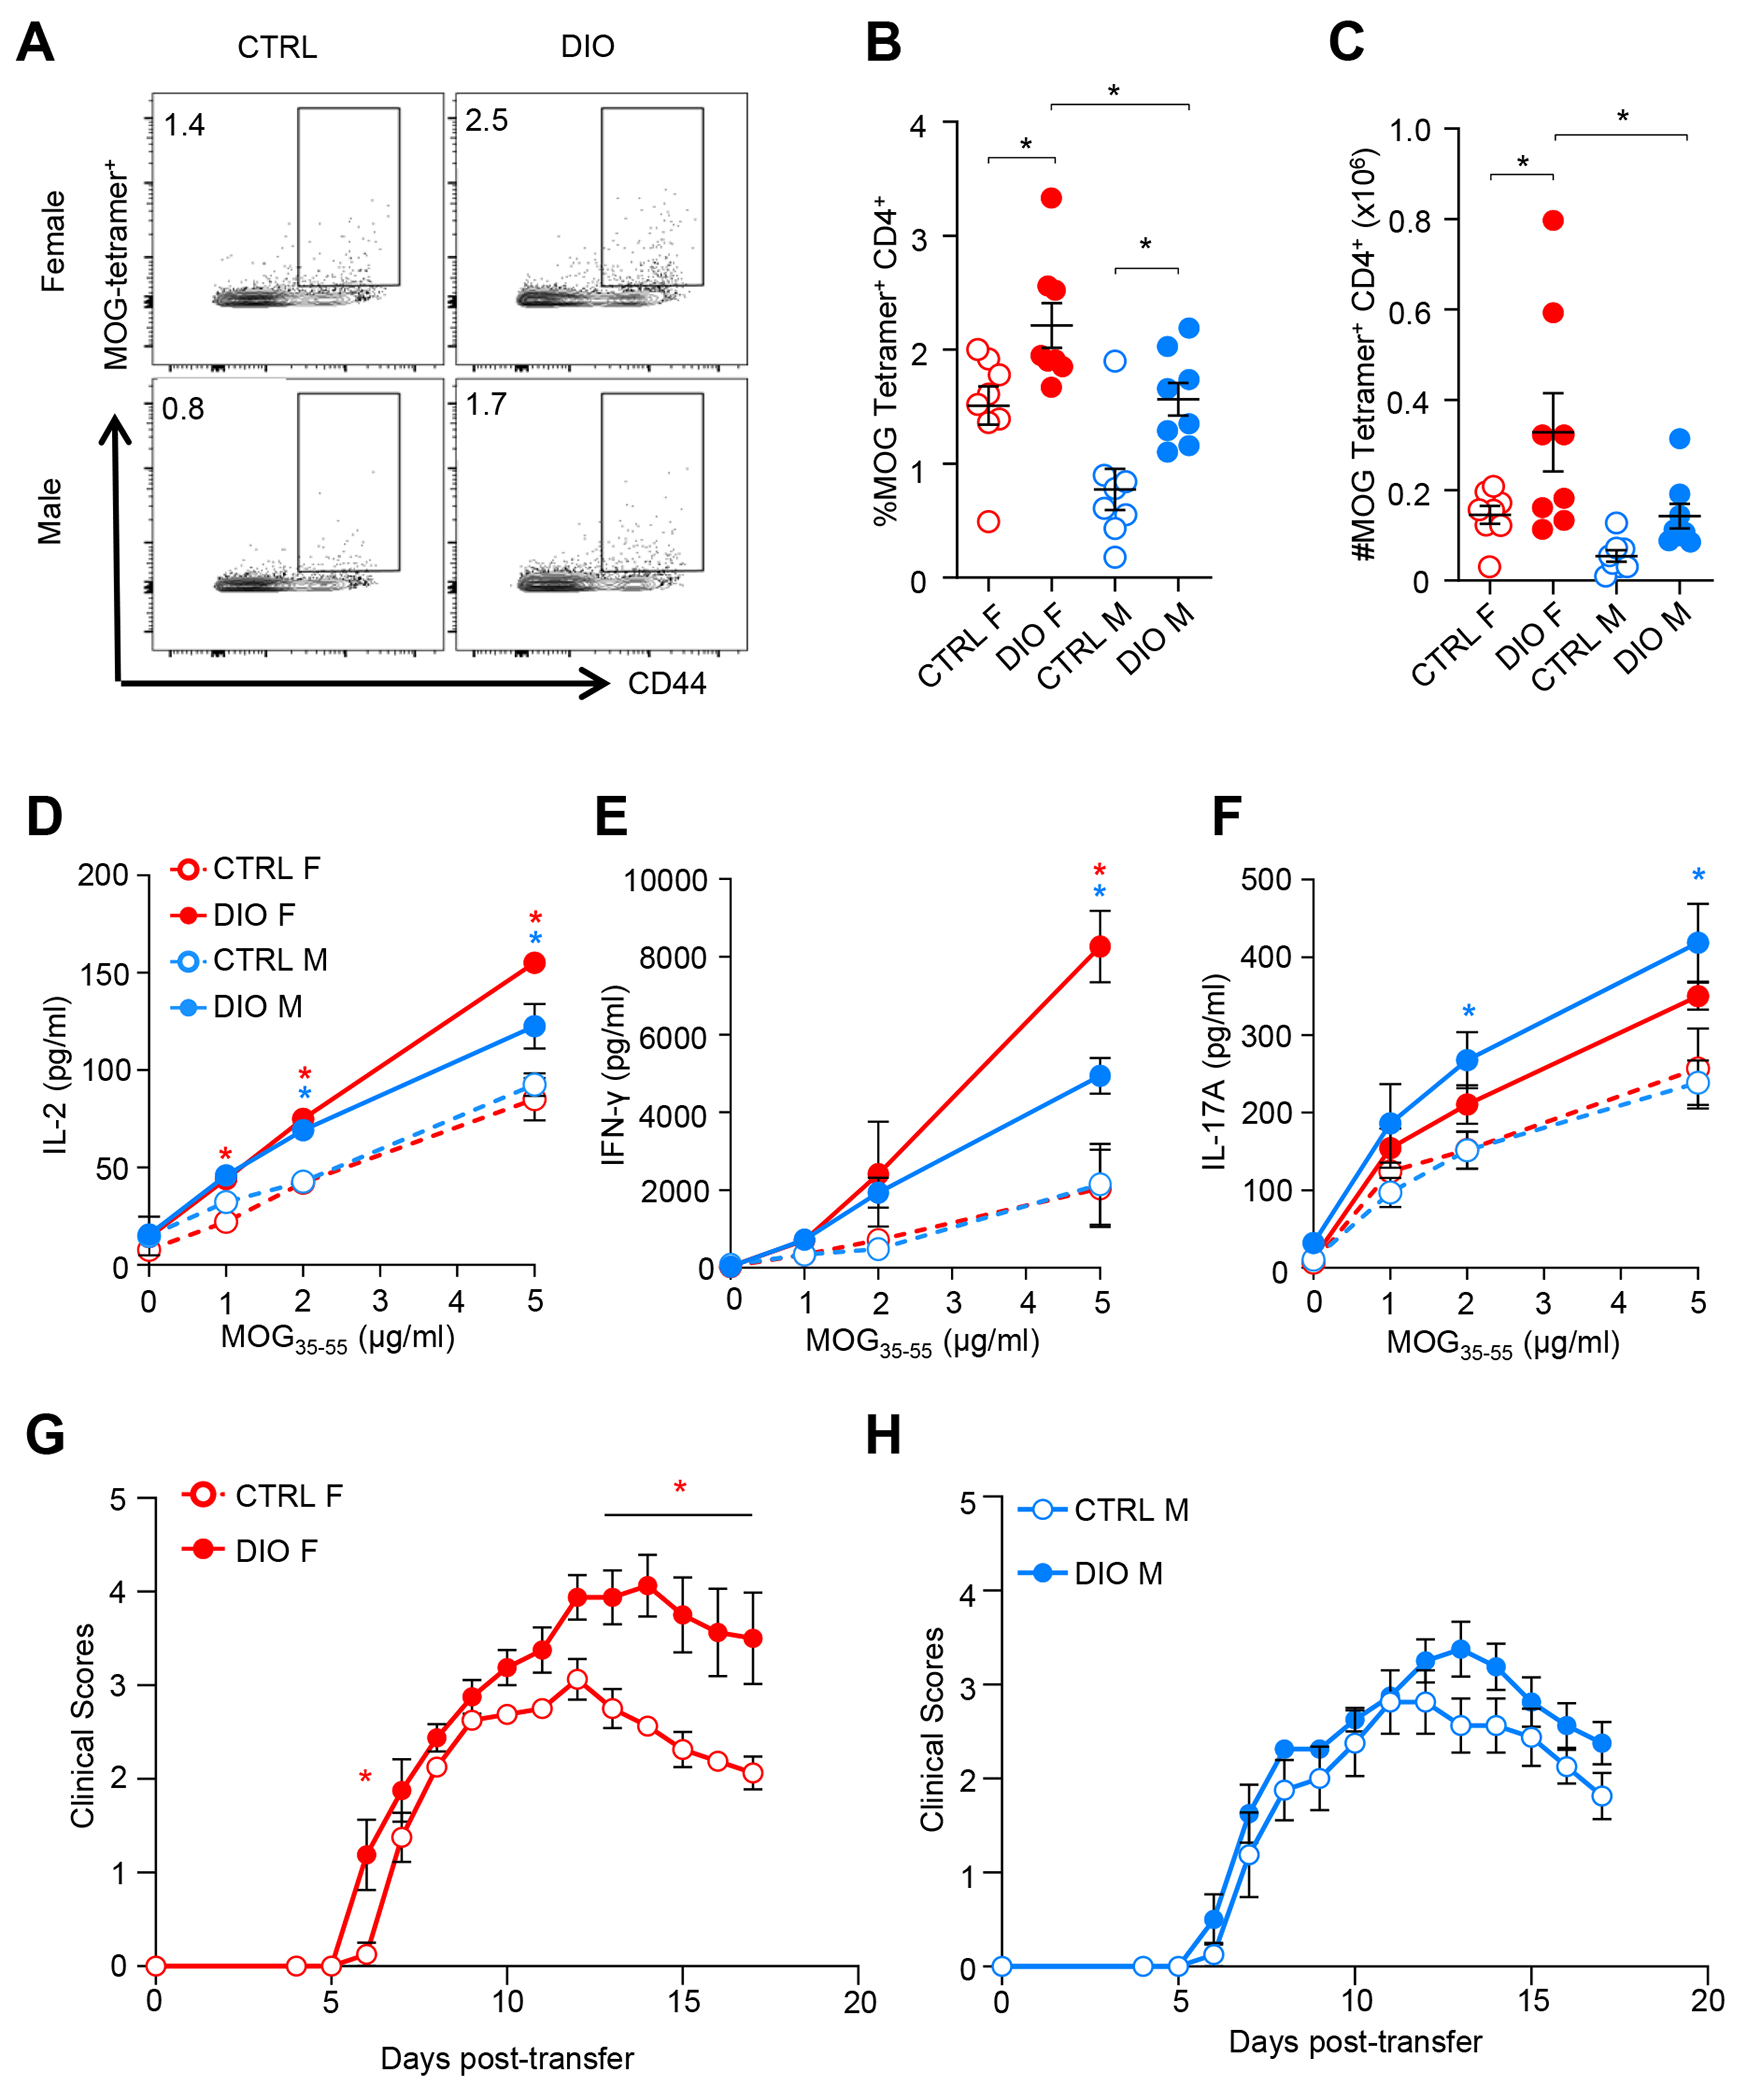
(A-C) Representative staining of splenic IAb-MOG-specific tetramer+CD44+ CD4+ T cells in male or female MOG35-55/CFA-injected CTRL or DIO C57BL/6J mice. Frequencies (B) and total numbers (C) of IAb-MOG-specific tetramer+ CD4+ T cells. Data points are individual mice.
(D-F) Spleen and draining lymph node cells from mice were pooled and cultured in the presence of MOG35-55. Supernatants were collected for ELISA measurement of IL-2 (D), IFN-γ (E) and IL-17A (F). Shown are mean ± S.E.M. of triplicate wells from one experiment of N=3 performed using pooled mice.
(G-H) Spleen and draining lymph node cells were collected, pooled, and cultured with MOG35-55 and IL-12p70 for 3 days and adoptively transferred into naive recipient male C57BL/6J mice. Mean ± S.E.M. daily clinical scores after transfer of cells from (G) female or (H) male mice. N=7-8 per group.
*p ≤ 0.05 significance determined using a two-way ANOVA and Bonferroni post-hoc test (B-F) or two-tailed Mann-Whitney U test (G,H). In D-H, blue and red asterisks indicate differences in between CTRL and DIO males and between CTRL and DIO females, respectively.
To address whether the effect of DIO on MOG35-55-specific T cells underpinned the more severe EAE phenotype in females, adoptive transfer EAE experiments were performed where diet was varied in the donor male or female MOG35-55/CFA-immunized mice. At day 9 post-immunization, donor cells from the draining lymph nodes and spleens were re-activated in vitro in presence of MOG35-55 and IL-12, and were transferred into naive male C57BL/6J recipients. MOG35-55-activated cells from the female DIO donors elicited more severe EAE compared to those from control females (Figure 3G). Significant differences in clinical scores were not observed after transfer of control and DIO male cells (Figure 3H). These results link the peripheral Th cell phenotype to the more severe EAE seen in female mice with DIO.
Increased Th1 response in female mice with DIO is linked to increased adiposity
Next, we investigated the biological cause of the female-preponderant increase in Th1 inflammation with DIO. Since the microbiome can modify Th1 immunity and EAE15,16, we examined the structure and composition of the fecal microbiome in male and female mice fed NCD or HFD at steady state using 16S rRNA sequencing. Four weeks of HFD-feeding reduced the number of observed unique amplicon sequence variants (ASVs) in male and female mice, but this did not translate into significant changes in the richness of the microbiome (Figure S3A–B). Principal component analysis of the weighted unique fraction metric revealed differences in beta diversity with HFD-feeding (specifically Firmicutes were increased and Bacteroidota were decreased with HFD), but mice clustered according to diet not sex (Figure S3C–E). Thus, sex differences in Th1 inflammation with DIO did not appear to be driven by sex-dependent changes in the microbiome.
We also conducted 4 wk HFD-feeding studies in SJL/J mice, which are resistant to weight gain when fed HFD17,18 (Figures S3H–J). Proteolipid protein (PLP) peptide 139-151-elicited T cell IFN-γ responses were not different between HFD- or NCD-fed SJL/J mice in spleen and draining lymph node cells following PLP139-151/CFA immunization (Figures S3K), suggesting that weight gain was required for the increased Th1 inflammation seen with DIO.
We also employed a post-natal overnutrition (PNO) model to induce weight gain in C57BL/6J mice. In this model, litter sizes are reduced to 3 pups/dam (PNO group). Pups from small litters consume more milk and experience greater body weight gains during post-natal development than pups from larger litters (controlled at 8 pups/dam) both before and after weaning on NCD (Figure S4A–C)19, however, only female PNO mice show greater fat mass (Figures S4D–E). In contrast to DIO, PNO did not alter the microbiome composition or structure (Figures S4F–J). Following MOG35-55/CFA immunization, PNO females exhibited greater MOG35-55-elicited T cell proliferation and IFN-γ production compared to controls; whereas IL-17 was not altered (Figures S4K–M). PNO females also developed a comparatively more severe course of EAE than controls (Figures S4N–O). These results suggest that the enhanced Th1 immunity with DIO was due to increased adiposity.
Increased Th1 inflammation induced in female mice with DIO is T cell-intrinsic and is promoted by ovarian hormones but not leptin
We were intrigued that DIO promoted myelin-specific Th1 cell immunity only in the females, despite males showing greater fat gains. Thus, we conducted studies to determine the cellular basis of the sex-dependent increase in Th1 inflammation with DIO. We first evaluated the CD4+ T cell compartment in NCD- and HFD-fed male and female mice. While the number of CD4+ T cells did not differ between DIO and control mice of either sex at steady state (Figure 4A), the percentages of CD4+ T cells that were FoxP3+CD25+, CD25+, or CD44hi and CD44 expression were elevated uniquely in the females with DIO (Figures 4B–E). We also evaluated the in vitro functionality of Treg isolated from the different groups and found that CD4+CD25hi Treg from DIO male or female mice did not exhibit a differential capacity to suppress the proliferation of sex-matched CD4+CD25− cells (Figures 4F–G). In addition, splenic CD11c+ dendritic cells isolated from control or DIO male or female mice exhibited an equivalent ability to prime MOG35-55-reactive CD4+ T cell receptor (TCR) transgenic cells in vitro (Figures 4H–I).
Figure 4: Increased Th1 responses in females with DIO are driven by T cell intrinsic differences.
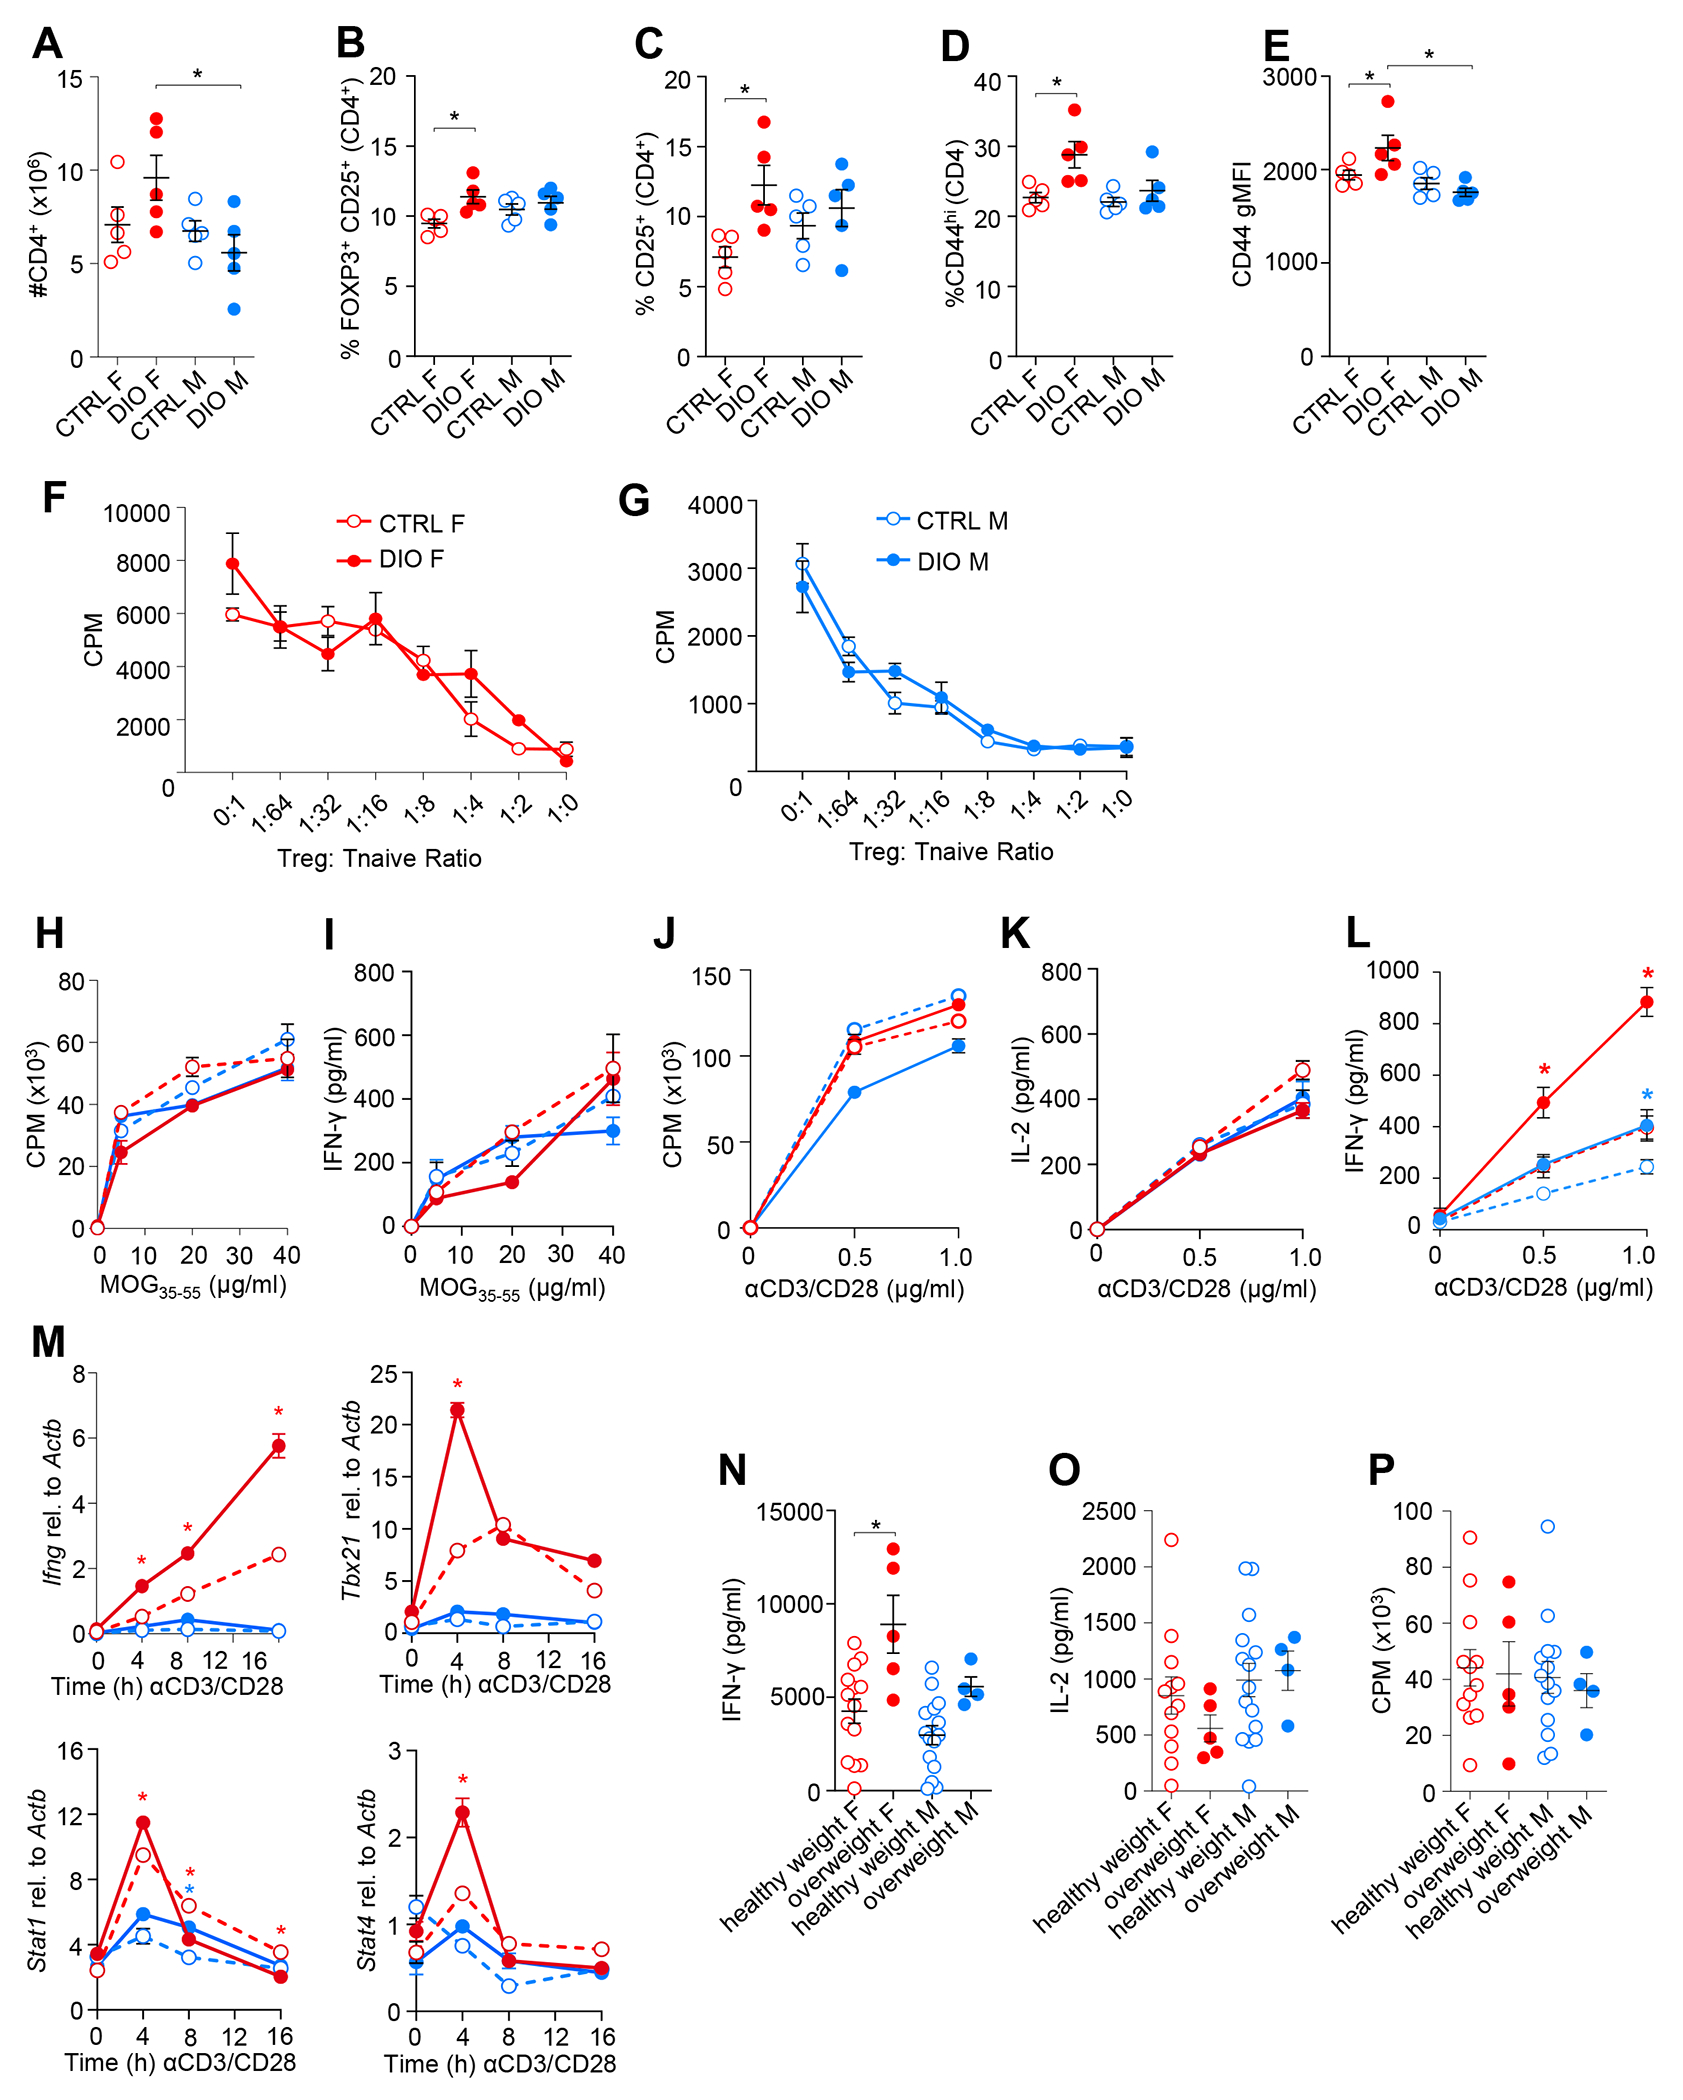
(A-M) Male and female C57BL/6J mice were treated to NCD (CTRL) or HFD (DIO) for 4 wk.
(A) Number of splenic CD4+ T cells.
(B-D) Frequency of splenic CD4+ T cells that were FoxP3+CD25+ (B), CD25+ (C) or CD44hi (D).
(E) Geometric mean fluorescent intensity (gMFI) of CD44 on CD4+ T cells.
(F-G) CD4+CD25hi (Treg) and CD4+CD44low-intCD25− (Tnaïve) cells from female (F) and male (G) mice were co-cultured at the indicated ratios with sex-matched Tnaive cells, irradiated splenocytes, and soluble anti-CD3. Proliferation of T cells was measured by [3H]-thymidine incorporation assay in counts per minute (CPM).
(H-I) Splenic CD11c+ DCs from CTRL and DIO mice were co-cultured with sex-matched MOG35-55-specific 2D2 CD4+ T cells with 0-40 μg/ml MOG35-55. (H) Proliferation in CPM was measured by [3H]-thymidine incorporation assay. (I) IFN-γ in supernatants.
(J-L) Naïve CD4+ T cells were sorted from NCD or DIO mice and were cultured with increasing amounts of anti-CD3/anti-CD28. (J) Proliferation was measured by [3H]-thymidine incorporation assay. IL-2 (K) and IFN-γ (L) in supernatants.
(M) Relative mRNA expressions of Ifng, Tbx21, Stat1 and Stat4 in naïve CD4+ T cells stimulated with anti-CD3/anti-CD28 after normalization to beta-actin.
(N-P) PBMCs were collected from human participants with healthy weight (20.0 to 24.9 kg/m2) or overweight (25.0-29.9 kg/m2) BMIs. Naïve CD45RA+ CD4+ T cells were stimulated in vitro with anti-CD3/anti-CD28-coated Dynabeads. IFN-γ (N) and IL-2 (O) were measured in supernatants by ELISA. Proliferation (CPM) (P) was measured by [H3]-thymidine incorporation assay. Data points are individual people.
Data in mice are representative of 2-5 independent experiments. Significant differences were determined by two-way ANOVA with Bonferroni post-hoc test (A-E, H-P) or by Mann-Whitney two-tailed T test (F,G). *p ≤ 0.05.
We next sorted naïve (CD44lo) CD4+ T cells from male and female DIO and control mice and evaluated the ability of these cells to proliferate and secrete cytokines in response to stimulation with anti-CD3 and anti-CD28. These studies revealed that naïve CD4+ T cells from DIO female mice proliferated equivalently and produced similar levels of IL-2 (Figures 4J–K), but produced markedly higher levels of IFN-γ compared to NCD female cells (Figure 4L). Though a small effect of DIO in increasing CD4+ T cell IFN-γ production was seen in the males, it was much less pronounced than in females (Figure 4L). Taken together with the in vivo studies, these findings suggest that DIO enhances Th1 inflammatory mechanisms in EAE by increasing: (1) T cell activation, (2) myelin-specific Th cell expansion, and (3) the potential of the CD4+ T cells to produce IFN-γ.
Th1 polarization of naive CD4+ T cells is associated with two waves of expression of the Th1 lineage-determining factor T-bet20. The first (≤ 48 h) is driven by autocrine IFN-γ/IFN-γ receptor (IFN-γR)/STAT1 signaling, and serves to induce T-bet and IL-12 receptor β2 expression20,21. The second is driven by IL-12 and is crucial for Th1 lineage stabilization20. To address whether early events in Th1 differentiation are enhanced by DIO, we measured the expressions of Ifng and other key genes involved in Th1-programming in male and female control and DIO naïve CD4+ T cells after anti-CD3/anti-CD28 stimulation. DIO potentiated the expressions of Ifng, Tbx21, Stat1, and Stat4 in female CD4+ T cells even at early time points of stimulation (Figure 4M), suggesting that the activity of the TCR/IFN-γR/STAT1 signaling loop may be enhanced in female naïve CD4+ T cells with DIO. Female CD4+ T cells also exhibited an overall greater expression of these Th1-related genes compared to male CD4+ T cells (Figure 4M).
To explore whether greater BMI is associated with potentiated T cell IFN-γ production in humans, a study was done where peripheral blood naïve (CD45RA+) CD4+ T cells were isolated from male and female donors having an overweight (25.0 to 29.9 kg/m2) or healthy weight (20.0 to 24.9 kg/m2) BMI. These cells were stimulated in vitro with anti-CD3/anti-CD28. Similar to our findings in mice, CD45RA+ CD4+ T cells from overweight females produced greater levels of IFN-γ than those from healthy weight females; there was no significant difference in IFN-γ production between healthy weight and overweight male T cells (Figure 4N). Furthermore, no effect of BMI or sex on the proliferation of CD4+ T cells or IL-2 production was observed (Figure 4O–P).
We also investigated whether the DIO-induced Th cell phenotype in female mice is reversible. For this experiment, C57BL/6J female mice were provided: i) NCD for 4 weeks and then placed on HFD for 4 weeks, ii) HFD for 4 weeks and then switched to NCD for 4 weeks (DIET mice), or iii) NCD throughout. Female DIET mice exhibited similar body and fat pad weights at endpoint as female mice maintained on NCD (Figures S4P–R). DIET mice also exhibited an immune profile that was more similar to control than DIO mice with a comparable percent CD44hi CD4+ T cells, CD44 expression, and splenic T cell production of IFN-γ in response to anti-CD3/anti-CD28 stimulation (Figure S4S–U). Thus, the T cell phenotype changes seen in the female mice with short-term DIO are reversible with weight loss.
The effect of female sex in potentiating the DIO effect on T cell IFN-γ production suggested that female gonadal hormones may be promoting this T cell phenotype. We therefore repeated in vitro Th cell stimulation assays with naïve CD4+ T cells from HFD or NCD female mice that had received a sham or pre-pubertal ovariectomy (OVX) surgery at 4 weeks of age. Consistent with past reports22, OVX mice exhibited greater weight gains than sham-operated controls when fed HFD (Figures 5A–C); despite this, the effect of DIO in increasing IFN-γ by activated naïve CD4+ T cells was severely blunted (Figure 5D). The proliferation of the naïve CD4+ T cells was unperturbed by either DIO or OVX treatment (Figure 5E). These findings suggest that ovarian hormones are permissive for the effect of DIO in increasing CD4+ T cell IFN-γ production.
Figure 5. Ovarian hormones accentuate Th1 cytokine production by female T cells with DIO.
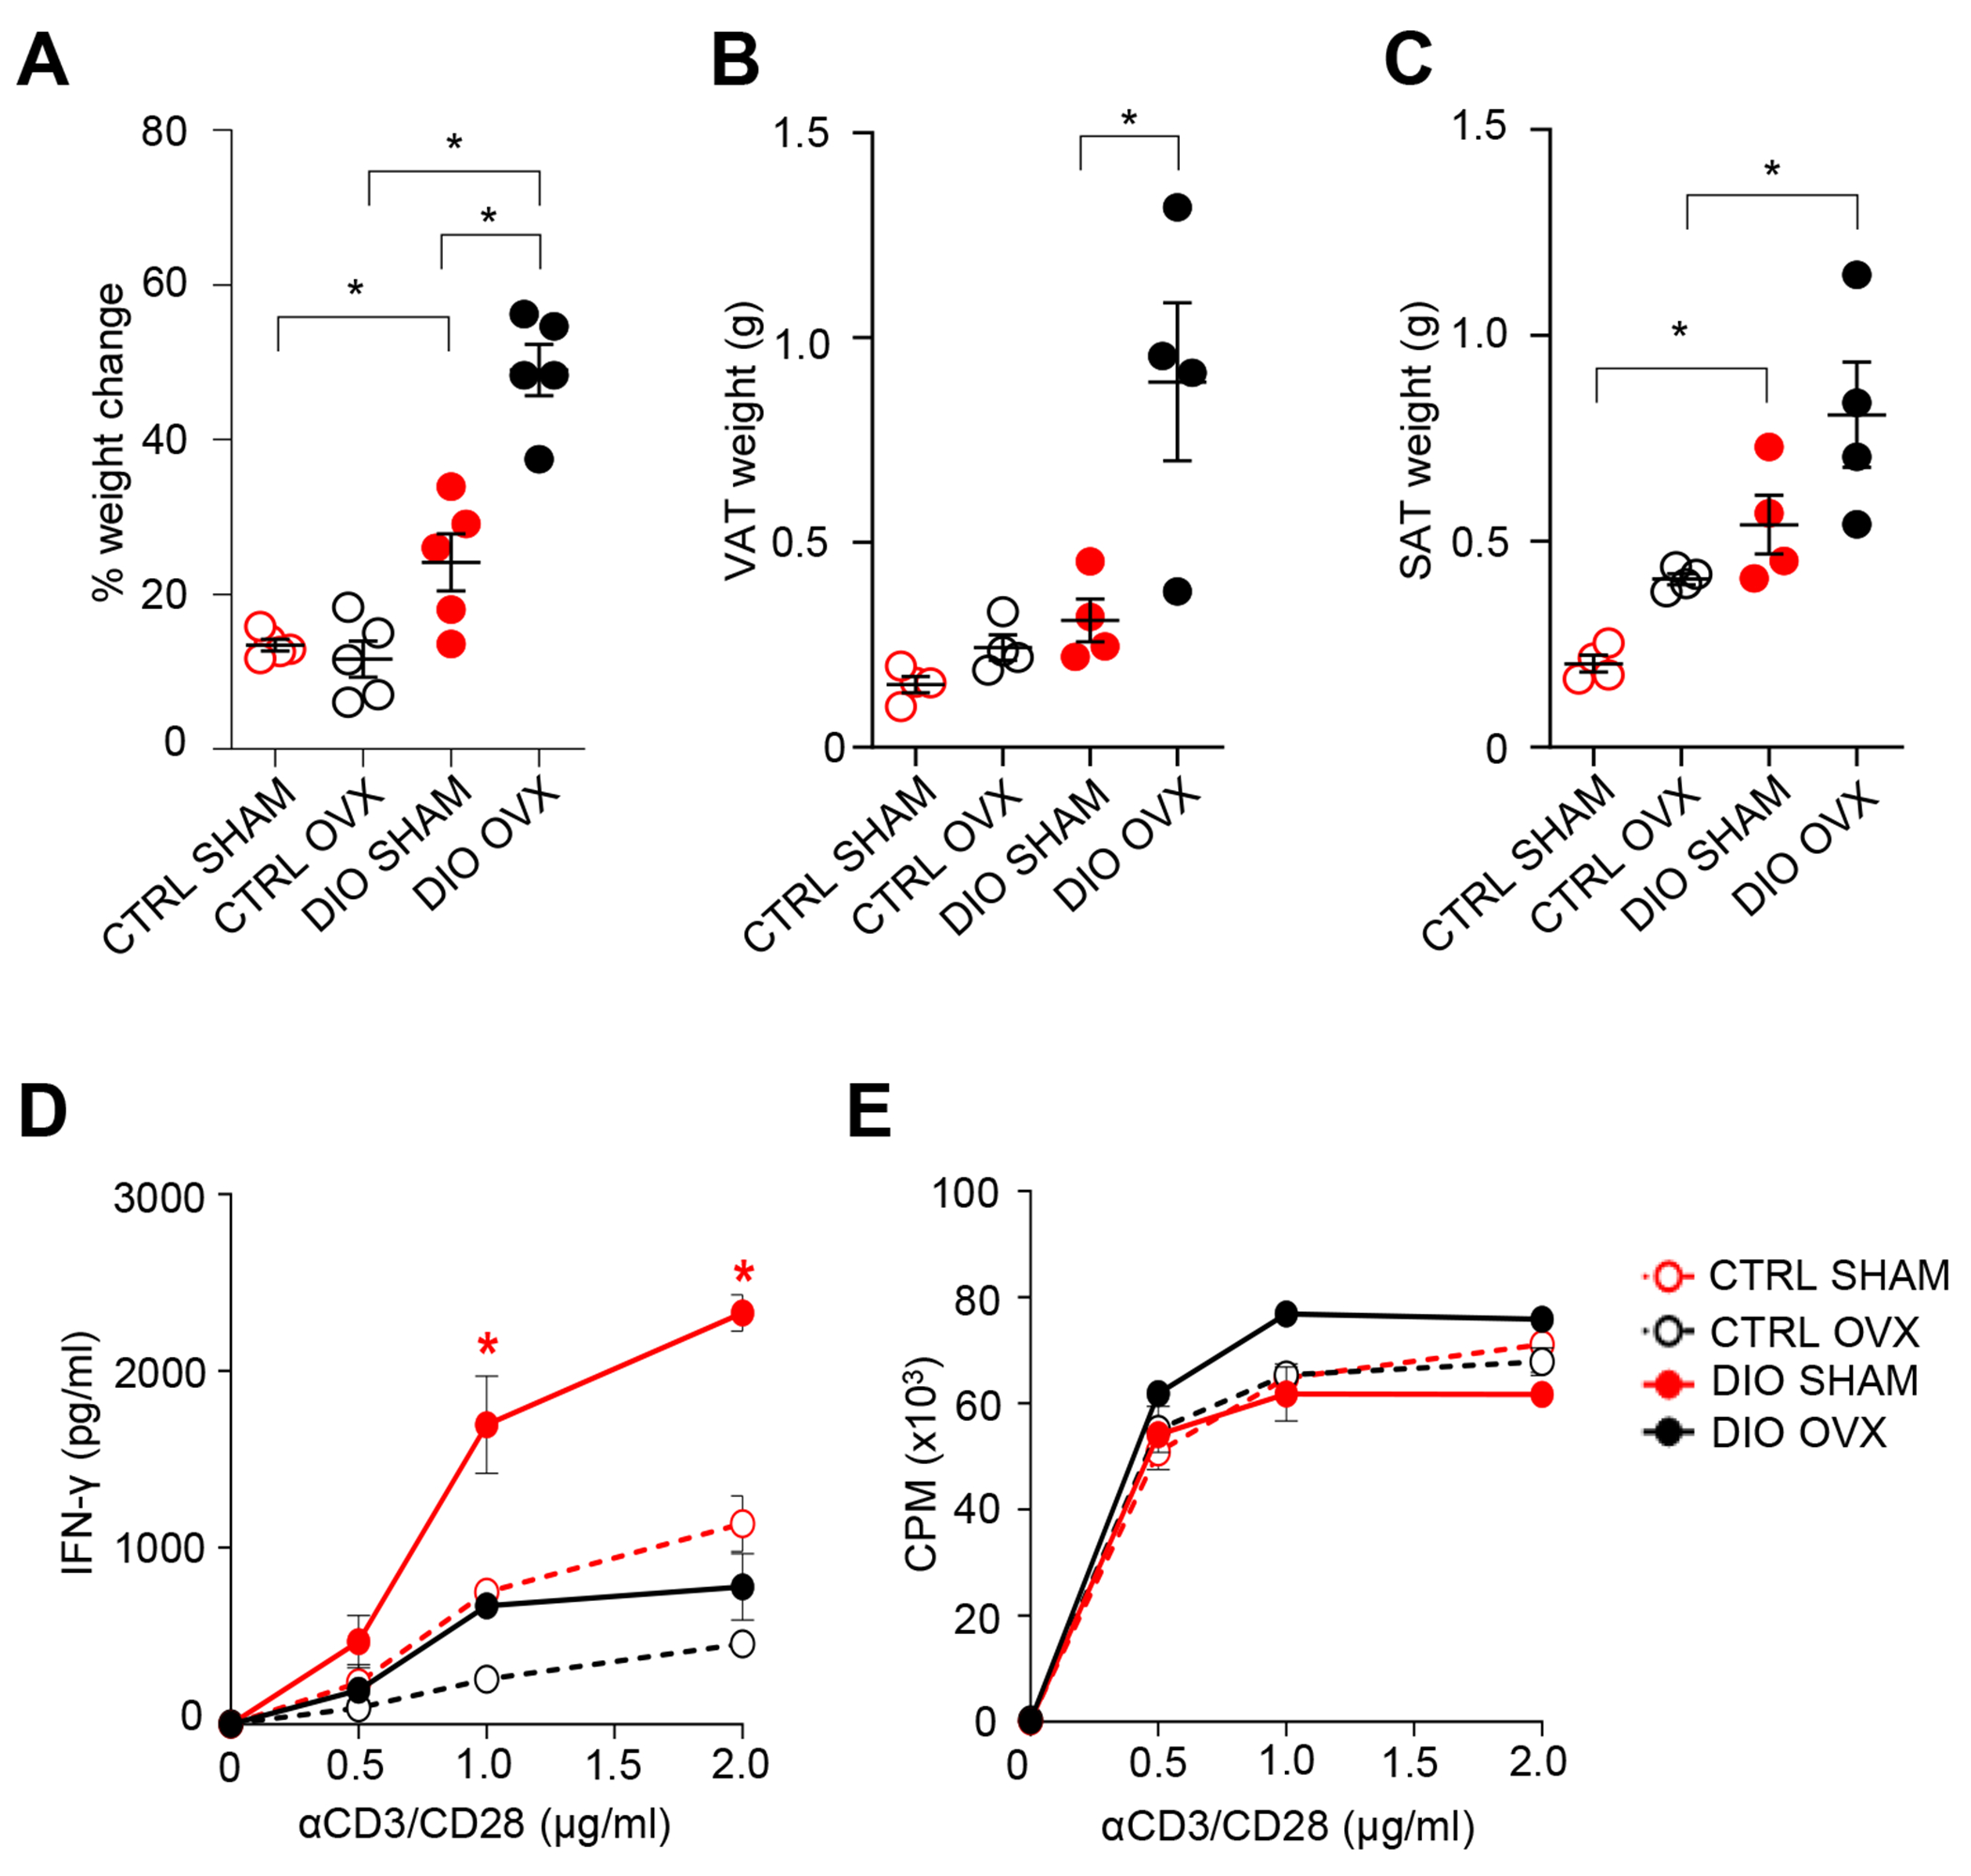
Four-week-old female C57BL/6J mice underwent pre-pubertal ovariectomy (OVX) or sham surgery (sham). At 6 weeks of age, mice were placed on HFD or NCD for 4 weeks prior to data collection at 10 weeks of age.
(A) % body weight change over 4 weeks of the diets.
(B-C) Endpoint visceral adipose tissue (VAT) (B) and subcutaneous adipose tissue (SAT) (C) weight.
(D-E) Naïve CD44lo-int CD4+ cells were isolated from mice (N=5/group) and were cultured in presence of anti-CD3/anti-CD28. Cytokines in supernatants (D) and proliferation (CPM) (E) by [3H]-thymidine incorporation assay.
Data points represent individual mice (A-C) or mean ± S.E.M of triplicate wells of pooled mice (D-E) in one experiment that was representative of 2 performed. Differences determined by two-way ANOVA and Bonferroni post-hoc test. *p ≤ 0.05.
It has been speculated that that the effect of obesity on MS is due to increased pro-inflammatory adipokine production23. We therefore profiled adipokines and cytokines in the serum of control and DIO male and female mice. Of the adipokines detected, IL-6 and leptin were significantly increased, and TNF tended to increase with DIO (Figures S5A–C). Adiponectin, which can be inflammatory in MS24, was reduced, whereas the levels of PAI-1 and resistin were not altered with DIO (Figures S5D–F).
Since past studies have reported an effect of leptin in promoting IFN-γ production by MS patient T cells25 and myelin-reactive T cells in EAE26, we investigated the involvement of leptin signaling in the heightened T cell IFN-γ production with DIO. To this end, we generated female mice that had leptin-receptor deficiency restricted to CD4+ T cells (LepR CD4+ T-KO) using a mixed bone marrow chimera (BMC) approach (Figure S5G–H). These mice and female controls were fed HFD or NCD starting at eight weeks post-BM transfer. LepR CD4+ T-KO mice gained a similar amount of weight on HFD as WT BMC mice (Figure S5I); however, CD4+ T cells from these mice did not exhibit diminished T cell IFN-γ production with DIO (Figure S5J). Comparable findings were observed in experiments that used LepR floxed mice where deletion in T cells was driven by the Lck-Cre distal transgene (Figures S5K–N). Thus, DIO did not appear to be enhancing T cell IFN-γ production through increased leptin signaling.
DIO enhances IFN-stimulated gene (ISG) expression and IFN-γR/STAT1 signaling in female CD4+ T cells
To gain insights into the molecular basis of the increased IFN-γ production by female CD4+ T cells with DIO, we compared the transcriptomic profiles of naïve CD4+ T cells that were isolated from control and DIO female mice. RNA was isolated from quiescent cells or at 16 h after in vitro stimulation with anti-CD3/anti-CD28. Quiescent naive CD4+ T cells exhibited an upregulation of 86 unique transcripts with DIO (fold cut-off>1.2, Table S4). Gene Ontology (GO) analysis revealed upregulation of small nuclear RNAs, genes related to T cell adhesion/migration (Vcam, Rhob, Adgre4, Itga3, Itgb5, Cxcr4), the misfolded protein response (Dnajb1, Hspa8, Hsph1), cytosolic RNA sensing (Ddx58), and lipid uptake and metabolism (Lrp1, Plin2, Abca1, Pltp, Cpt1a, Slc25a20).
A comparatively greater number of transcripts were upregulated in activated female CD4+ T cells with DIO (Table S4). Top upregulated pathways were related to ‘response to interferons’ (Figure 6A, Table S5). Comparison of upregulated genes against published lists of Th lineage genes27 confirmed the presence of a strong Th1 gene signature in DIO female CD4+ T cells (Figure 6B, Table S5); these Th1-associated genes included Stat1 which signals downstream of IFN-γR and Il7r and Il18r1 that are involved in terminal Th1 differentiation28–30 (Figure 6B). DIO CD4+ T cells also expressed higher levels of Il6ra and Il17a thereby explaining their proneness for IL-17A secretion (Figure 6B). Very few transcripts were downregulated in CD4+ T cells with DIO (Table S6).
Figure 6. DIO increases type I IFN levels and T cell expression of ISGs and STAT1 in females.
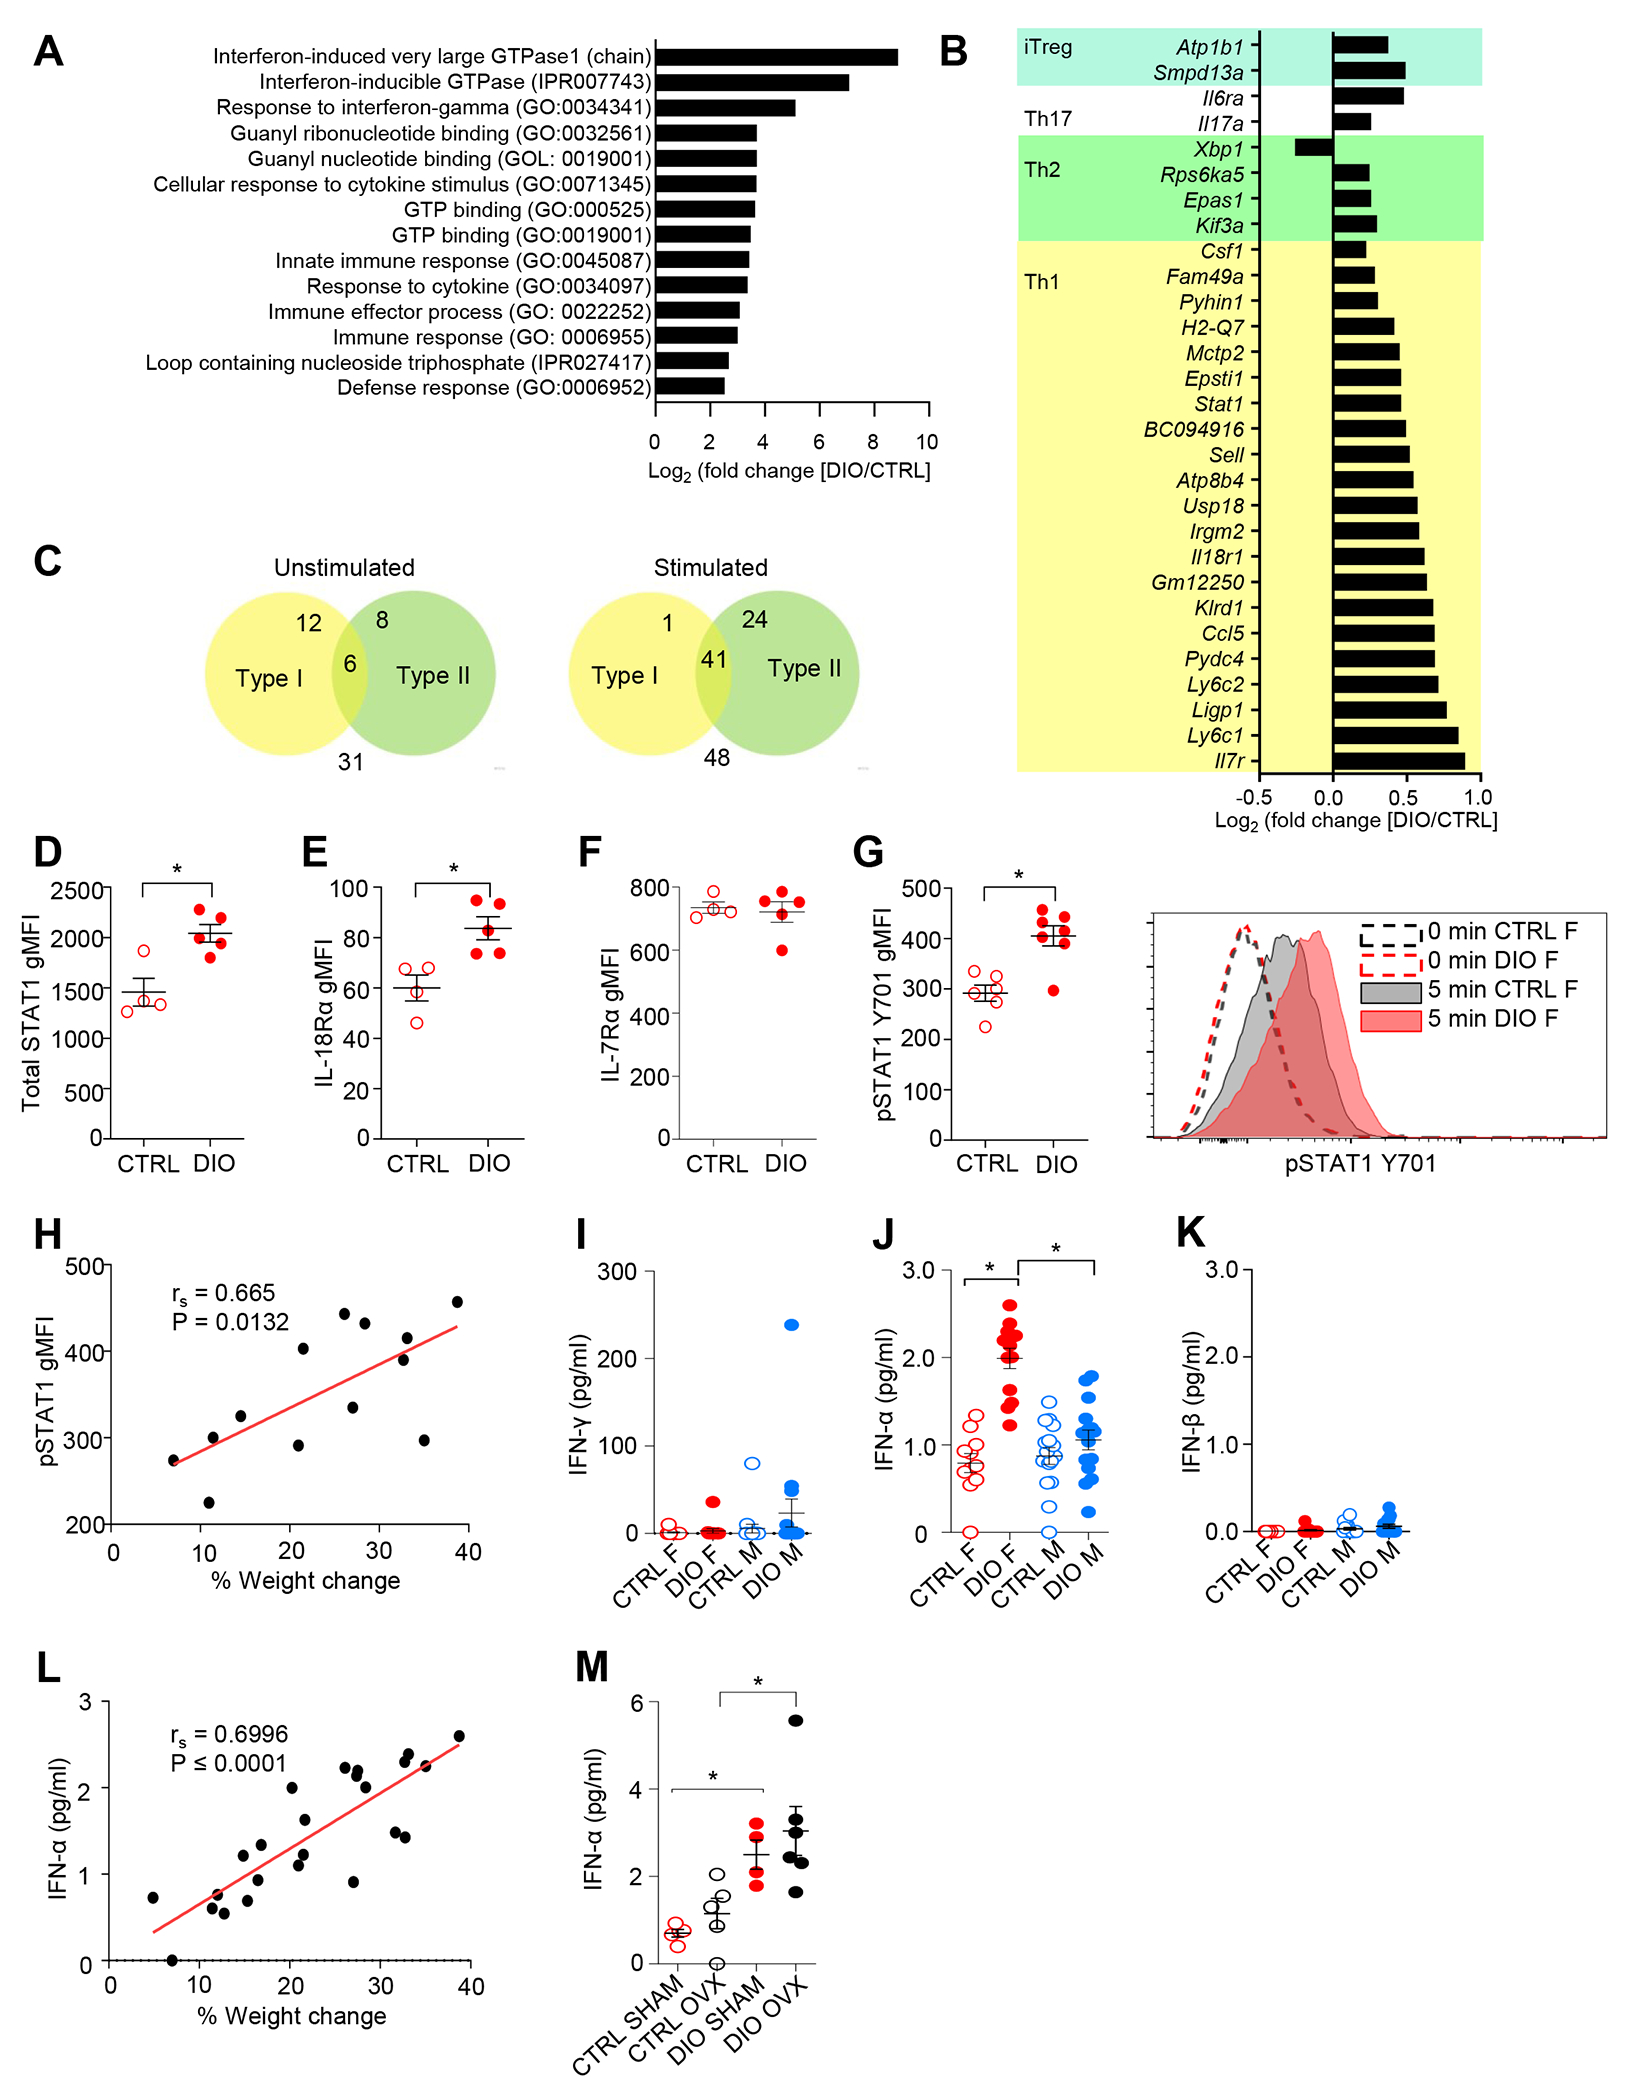
(A-C) Naïve (CD44low-int) CD4+ T cells were isolated from female CTRL or DIO C57BL/6J mice (N=5 mice/group). Cells were snap frozen or stimulated with anti-CD3/anti-CD28 for 16 hr. cDNA was used to probe microarrays.
(A) DAVID GO pathway analysis of top pathways upregulated with DIO (cut-off fold change > 1.5) in activated CD4+ T cells.
(B) Genes upregulated in activated CD4+ T cells with DIO that overlapped with lists of genes enriched in iTreg, Th17, Th2, and Th1-lineage cells27.
(C) Venn diagram showing the overlap of DIO-upregulated genes in unstimulated and stimulated CD4+ T cells with those inducible in murine CD4+ T cells in response to type I or type II IFN31.
(D-G) Spleen and lymph node cells from C57BL/6J mice fed either a HFD or NCD were stained and gated on naïve (CD44low-int) CD4+ T cells for total STAT1 (D), IL-18Rα (E), and IL-7Rα (F) or were stimulated in vitro with IFN-γ and gMFI and peak phosphorylated STAT1 (Y701) assessed in naïve (CD44low-int) CD4+ T cells (G).
(H) Correlation between STAT1 (Y701) gMFI in naïve T cells and % body weight change on diets.
(I-K) Serum IFN-γ (I), pan-IFN-α (J), IFN-β (K) levels from female and male CTRL and DIO mice.
(L) Serum IFN-α level in CTRL or DIO female mice, correlated with % weight change on the diets over 4 weeks.
(M) Serum IFN-α levels in female sham or OVX mice after NCD or HFD.
Data points in D-G, H-L are individual mice. Significance determined by one-way ANOVA with Tukey post-hoc test with FDR corrected (A,B), or 2-way ANOVA with Bonferroni post-hoc test (I, J, K, M), Mann-Whitney test (D-G) or Spearman’s test (H,L). *P ≤ 0.05.
The heightened IFN signature seen in the female DIO CD4+ T cells led us to compare the list of differentially expressed transcripts against the IMMGEN dataset of type I- and type II IFN- regulated genes in murine CD4+ T cells31. This analysis revealed that ~50% of upregulated transcripts with DIO were ISGs (Figure 6C, Tables S7–S8). In the quiescent naïve CD4+ T cells, a greater number of type I ISGs were detected, whereas, stimulated CD4+ T cells exhibited a stronger type II ISG signature.
Since Stat1, IL-18 receptor, and IL-7 receptor signaling are directly situated in the Th1 signaling pathway, we validated the surface expressions of IL-18Rα and IL-7Rα proteins on naïve CD4+ T cells from control and DIO female mice by flow cytometry. This analysis confirmed that female naïve CD4+ T cells from DIO mice expressed greater levels of intracellular STAT1 and extracellular IL-18Rα, but not IL-7Rα (Figures 6D–F). STAT1 and IL-18Rα were not increased in male naïve CD4+ T cells with DIO (Figure S6A–B), indicating that STAT1 is upregulated in a sex-specific manner with DIO.
To investigate the activity of the IFN-γR/STAT1 signaling loop in early Th1 differentiation, the phosphorylation of STAT1 (Y701) (pSTAT1) in naive CD4+ T cells of DIO and control female mice was measured after stimulation with IFN-γ (Figure 6G). Naïve female CD4+ T cells from DIO mice had greater peak pSTAT1 post-IFN-γ stimulation compared to controls (Figure 6G). We also detected a positive correlation between the % body weight change over 4 weeks with the diets and the peak gMFI of pSTAT1 in naive CD4+ T cells of individual female mice (Figure 6H).
DIO induces type I IFN which promotes T cell STAT1 and IFN-γ expression and drives more severe EAE in females
STAT1 is engaged downstream of type I and II IFN receptors. Since IFN-γ was not elevated in the serum of female mice with DIO (Figure 6I), we focused our attention on type I IFNs, which had not been captured by our multiplex cytokine assay. We found that IFN-α, but not IFN-β, was increased in the sera of female mice with DIO; this was not seen in the males (Figures 6J–K). The levels of IFN-α in the serum of individual DIO and control female mice also correlated with % body weight gain with the diets (Figure 6L). To address whether ovarian hormones promoted Th1 cytokine production through increases in IFN-α, we also measured IFN-α levels in the serum of OVX and sham-operated female mice fed HFD and NCD; however, sham and OVX females exhibited a similar rise in IFN-α levels with DIO (Figure 6M). Together, these findings suggested that increased IFN-α signaling may be driving the ISG signature in female CD4+ T cells with DIO and that ovarian hormones potentiated T cell IFN-γ production downstream of IFN-α production.
To specifically address the involvement of IFN-α signaling in the DIO-induced T cell phenotype in female mice, we generated mice that were deficient in type I receptor alpha chain (IFNAR1) selectively in T cells by crossing IFNAR1 floxed mice with mice that expressed Cre recombinase under the control of the distal Lck-Cre promoter (IFNAR T-KO): IFNAR T-KO mice were compared to littermate controls that were homozygous for the IFNAR floxed allele and negative for the Cre allele (flox) (Figure 7A, S6C–G). Both IFNAR T-KO and flox female mice gained an equivalent amount of body weight and fat mass with HFD (Figures 7B–D). Examination of CD4+ T cells in the peripheral immune compartment revealed the expected increase in the expressions of CD44, IL-18Rα, and STAT1 and IFN-γ secretion by female flox CD4+ T cells with DIO (Figures 7E–H). All these measures were attenuated in the DIO IFNAR T-KO mice, with STAT1 expression and IFN-γ secretion being even lower than seen in the flox CTRL group (Figures 7G–H). These findings suggest that type I IFN signaling mediates the effect of DIO on these T cell measures, but also maintains the basal expression of STAT1 and IFN-γ in CD4+ T cells.
Figure 7: Loss of IFN-α signaling in female CD4+ T cells negates the effect of DIO on Th1 effector cell responses and EAE.
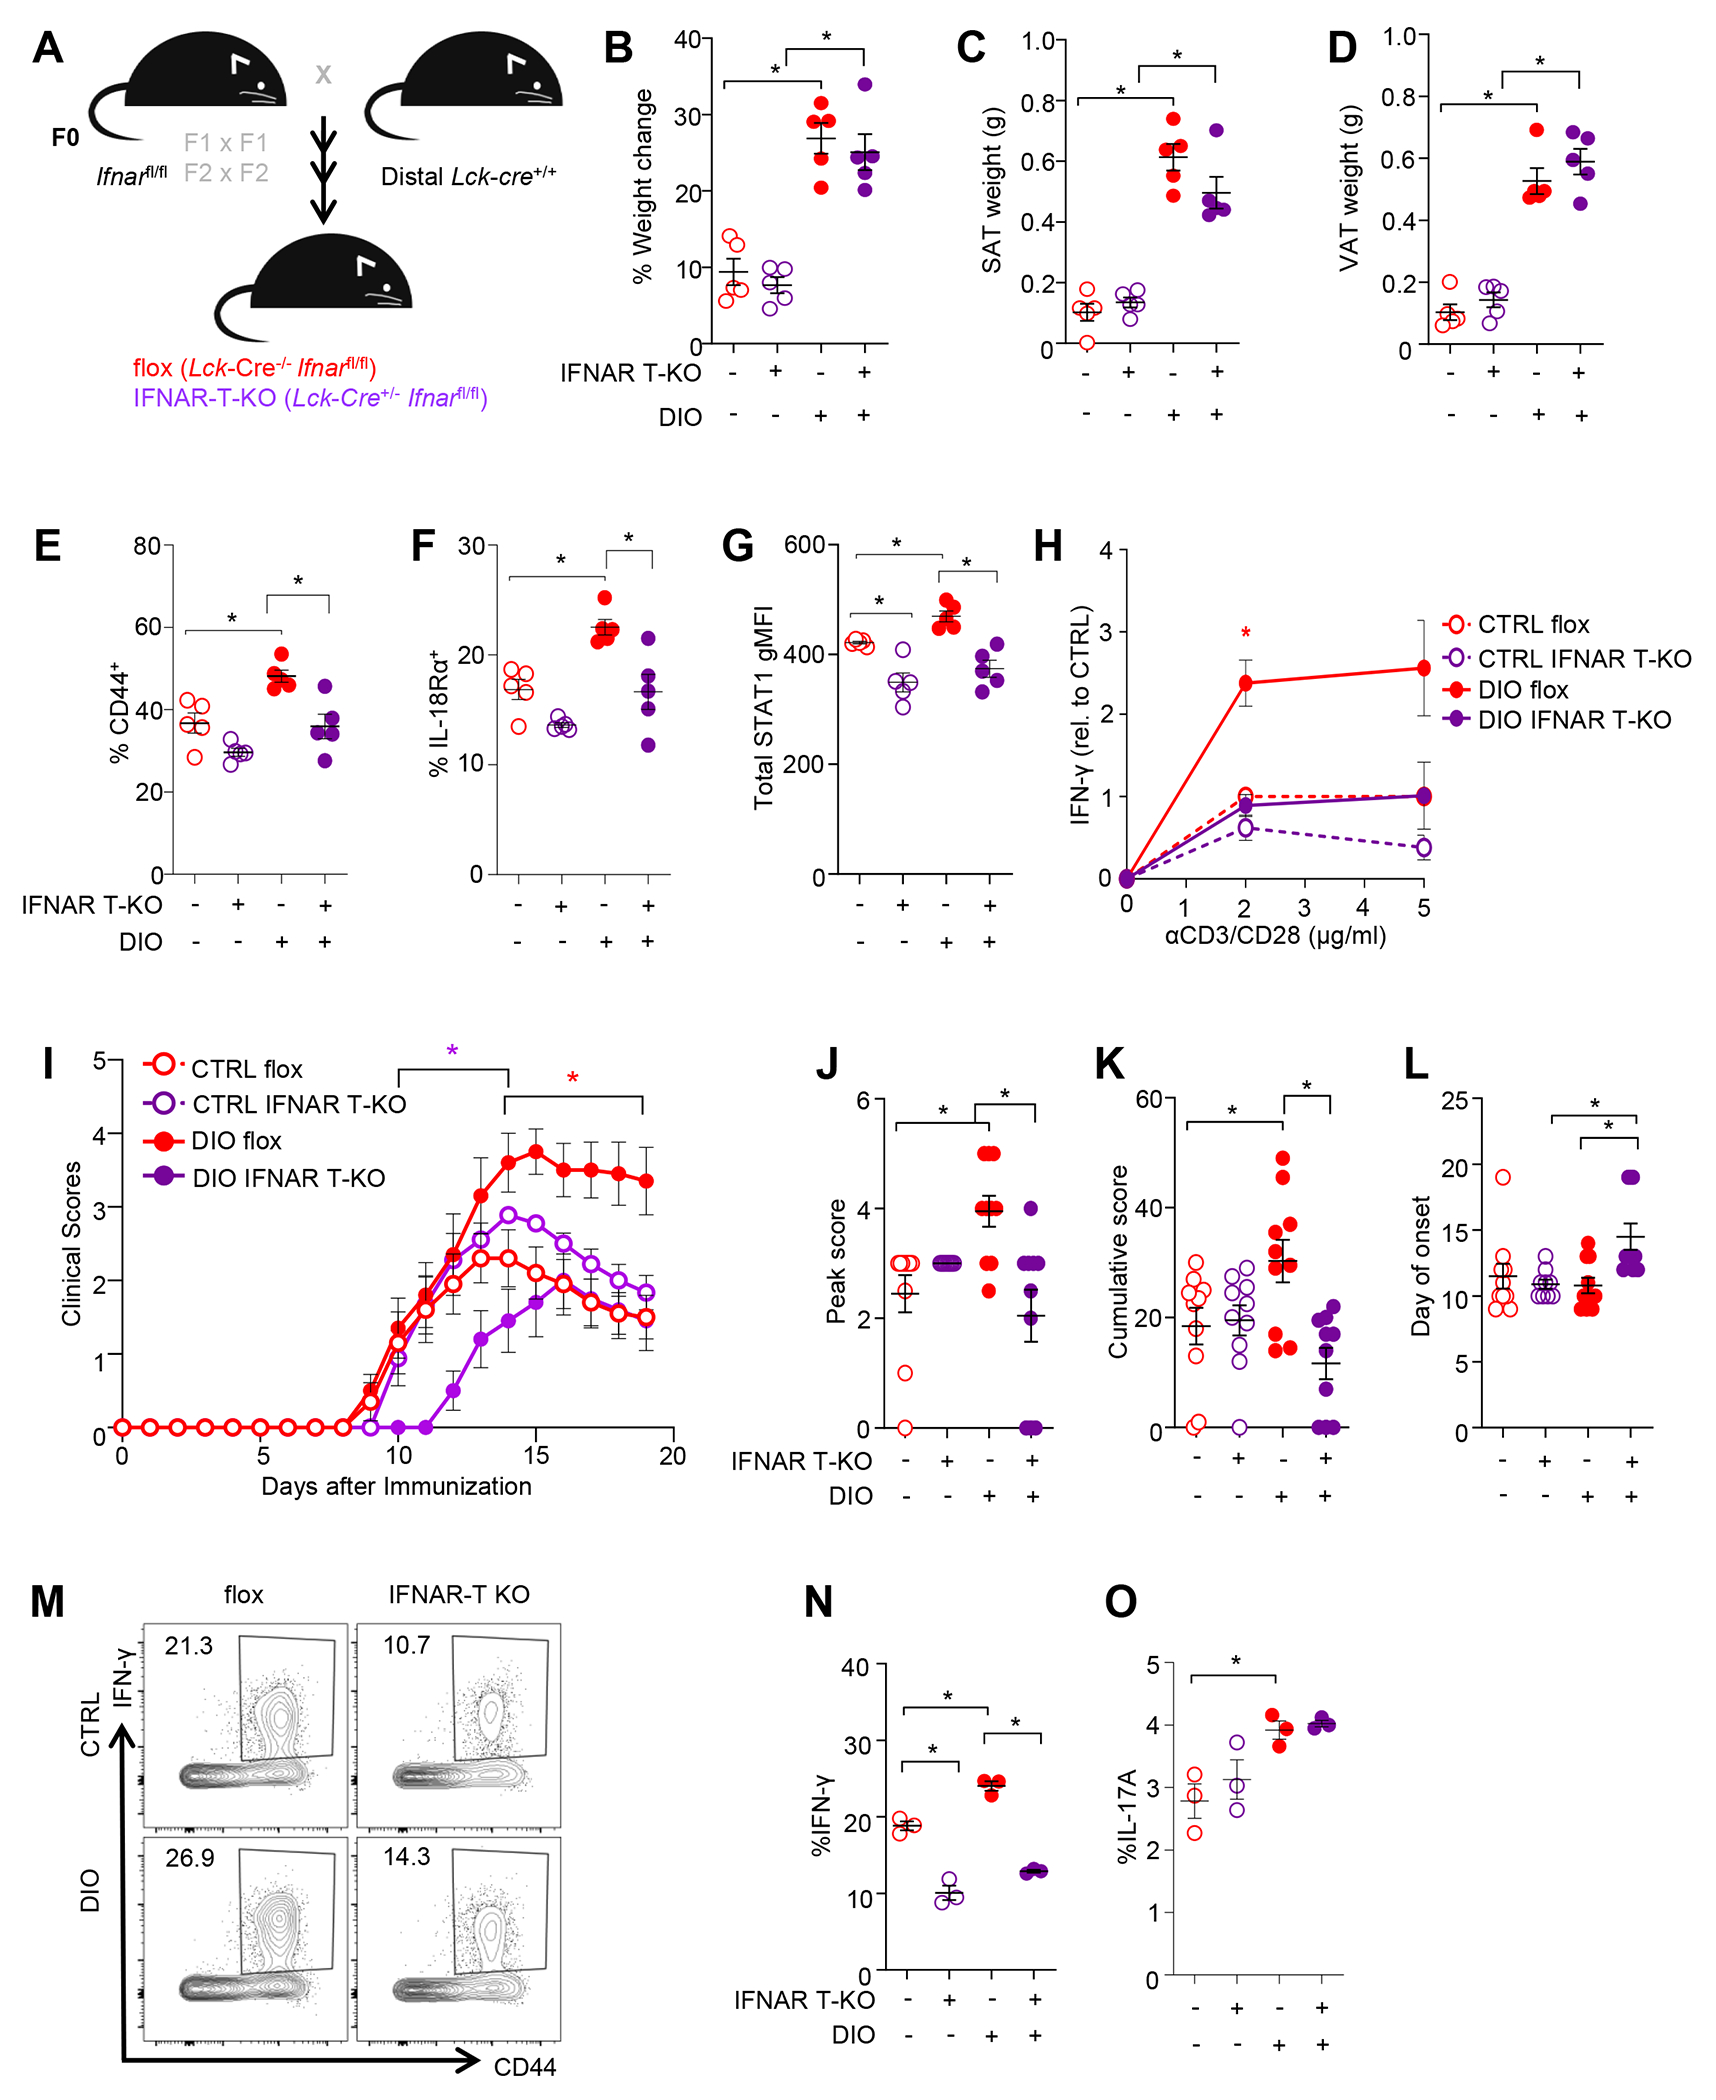
(A) Schematic showing generation of T cell-specific IFNAR1-deficient mice.
(B-D) % of body weight change over 4 weeks (B) and SAT (C) and VAT (D) weights at 10 weeks of age.
(E-G) Frequencies of CD44+ (E), IL-18Rα+ (F), and expression of STAT1 (gMFI) (G) in splenic naive CD4+ T cells from CTRL and DIO flox and IFNAR-T-KO mice.
(H) Levels of IFN-γ in culture supernatants at 48 hr after in vitro stimulation of naïve CD4+ T cells with anti-CD3/anti-CD28. Shown is mean ± S.E.M. of fold-change level (relative to flox CTRL) of 4 independent experiments.
(I-L) Results of EAE studies in CTRL and DIO Flox and IFNAR-T-KO mice. (I) EAE clinical scores, (J) Peak score, (K) Cumulative disease score from day 0 to day 19, and (L) Day of disease onset.
(M-O) Th cell responses in spleens of CTRL and DIO flox and IFNAR-T-KO mice at day 9 post-immunization
(M) Representative staining of IFN-γ and CD44 in spleen CD4+ T cells.
(N-O) Percentage of splenic CD4+ T cells expressing IFN-γ (N) or IL-17A (O) after PMA/Ionomycin stimulation.
Values are mean ± S.E.M. Data are representative of at least 3 independent experiments. Significance was determined through two-way ANOVA and Bonferroni post-hoc test *p ≤ 0.05. Data in B-G, J-L, N-O are individual mice. See also Figure S6.
We then investigated whether IFNAR T-KO mice would be protected from the effects of DIO in EAE. As anticipated, DIO enhanced the severity of EAE in female CTRL flox mice, but this effect was not seen in the female IFNAR T-KO mice (Figures 7I–K), which instead showed a delay in disease onset (Figures 7L). No significant effect of DIO or genotype on EAE was observed in the males (Figures S6H–K). In addition, upon evaluating myelin-specific Th cell responses during EAE, we observed that female IFNAR T-KO mice exhibited a reduced percentage of Th1 effector cells (IFN-γ+CD44hi CD4+ T cells) (Figures 7M–N) and decreased myelin-specific Th1 responses (Figure S6L) in the peripheral lymphoid organs as compared to flox CTRL mice. Interestingly, the percentages of IL-17+ CD4+ T cells, which increased with DIO, were not impacted by IFNAR-deficiency (Figure 7O), indicating that increased Th17 inflammation with DIO was driven by a separate mechanism. Together, these data suggest that the effect of DIO in increasing Th1 responses in female mice was mediated by type I IFNs.
DISCUSSION
The incidence of autoimmune diseases has increased over the past half century32. In regards to MS, disease risk has increased substantially in those who are obese, carry the MS-related MHC risk haplotype, and are female14,33, suggesting an interaction of these host factors in the promotion of Th autoimmunity. Our data revealing a female-predominant increase in Th1 inflammation in humans and increased type I and type II IFN signaling in murine T cells with overweightness/obesity provides a mechanistic explanation for how obesity may be enhancing autoimmunity in females.
Our finding that type I IFN promoted T cell IFN-γ production and responsiveness by increasing STAT1 expression coincides with a study in human fibroblasts34 and provides clarification around the role of type I IFN in Th1 cell differentiation. Early studies demonstrated that IFN-α promotes IFN-γ expression by human T cell blasts35 by increasing IL-18Rα36,37 or by inducing STAT4 phosphorylation38,39. Then, it was reported that the rise in serum IFN-γ levels seen in mice during lymphocytic choriomeningitis virus infection was dependent on type I IFN and STAT4, but independent of IL-1239, thereby framing IFN-α as a cytokine that has similar activities as IL-12 in promoting Th1 cytokine production through STAT4. This notion that IFN-α could promote Th1 differentiation was then dismissed when a series of in vitro studies demonstrated that IFN-α treatment could not induce sustained STAT4 phosphorylation or T-bet expression in naïve CD4+ T cells40–42. Our data rectify this controversy by showing that low-level type I IFN amplifies IFN-γ production by increasing STAT1 activity in T cells. Our findings also coincide with the proposal that sustained low-level type I IFN signaling primes immune cells to make them more poised to respond to infectious challenges43.
Our results also add to a growing body of literature describing heightened type I and II IFN signaling and production in females44. When compared to males, female monocytes exhibit greater ISG expression45,46 and female T cells produce greater levels of IFN-γ47,48. In addition, human female plasmacytoid DCs (pDCs) have a greater propensity than male pDCs to secrete type I IFN secretion in response to TLR7 stimulation49. These sex differences have been attributed to greater X chromosome gene dosage and estradiol levels in females49,50. Our finding that ovariectomy did not lower IFN-α levels in female mice suggested that the female preponderant effect of DIO in enhancing Th1 inflammation was regulated downstream of IFN-α, at the level of IFN signaling or IFN-γ expression. In this respect, past reports have demonstrated that estradiol enhances T cell IFN-γ expression directly through the binding of the estrogen receptor-α to the Ifng promoter50 or by enhancing STAT4 signaling51 in CD4+ T cells.
Our findings also coincide with past work describing a role for heightened type I/type II IFN/STAT1 signaling in autoimmunity. Higher IFN-α signaling is a cardinal feature of human systemic lupus erythematosus52, and overexpression of IFN-α in lupus-prone NZB/W mice has been shown to promote IgG2a and IgG3 autoantibody production and lupus nephritis via effects in CD4+ T cells53. In addition, female mice expressing a human STAT1 gain-of-function mutation exhibit splenomegaly, increased memory T cells, autoantibody development, and spontaneous type I diabetes54. It is also reported that ISG expression in immune cells precedes the onset of type I diabetes in human children55. Mice engineered to have increased IFN-γ levels develop a female-biased spontaneous autoimmune cholangitis that is dependent on IFNAR1 signaling56,57. Finally, untreated MS patients exhibit heightened IFN-α-induced STAT1 signaling in immune cells when compared to healthy controls58, and non-responders to IFN-β therapy have higher expression of STAT1 and type I IFN receptor in monocytes59.
In conclusion, this study identified a previously unknown interaction between obesity and female sex in enhancing IFN-α levels and Th1 immunity. Thus, BMI and sex should be considered in the design of clinical trials for the treatment of MS and other diseases.
Study Limitations
Although our studies unraveled how DIO was promoting Th1 immunity in female mice, several questions remain. We still have not pinpointed what tissue or cell is producing IFN-α during DIO. In this respect, past studies reported detecting greater ISG expression and pDC infiltration in the liver with prolonged (16-weeks) HFD-feeding in male mice. It has been speculated that the pDCs may be activated in this and other organs by the release of DNA from dying adipocytes60 or from increased netosis61. In addition, the mechanisms for how DIO is enhancing the expansion of MOG35-55-specific T cells during EAE is still not understood. We speculate that this in vivo phenotype could be connected with the known role of type I IFNs in promoting the survival of activated CD4+ T cells during clonal expansion in viral infection62. Furthermore, our adoptive T cell transfer studies did not distinguish whether the more severe EAE seen in mice transferred with female DIO T cells was due to the increased size of MOG-specific T cell pool or to the individual T cells being more pathogenic. Both could be causal since we observed that female DIO T cells had greater expression of a number of molecules (e.g., T-bet, STAT4, IFN-γ and GM-CSF) known to promote T cell encephalitogenicity63–65. Finally, since DIO and PNO studies were conducted in C57BL/6J mice, a strain that does not exhibit a sex difference in EAE development66, we could not study the extent to which the sex difference in type I/II IFN signaling contributed to the sex bias in autoimmunity.
A limitation of our human studies was that serum proteomic measures were conducted on one cohort of individuals at one center, the majority of whom, self-identified as White. It is possible that obesity-induced proteomic signatures would vary in individuals of other ethnicities who live in other geographical regions. In addition, our proteomic analysis identified some proteins that were upregulated with obesity in MS patients, but not in controls (e.g., DDX58, IL-12p70, IL-12Rbeta1). We speculate that increased expression of these proteins in MS could be due to MS-related risk factors including genetic polymorphisms that alter IFN or IL-12 signaling67. Notwithstanding, our finding that increased adiposity enhanced T cell IFN-γ secretion in both humans and mice coupled with similar findings in obese children in the USA, Italy, and Argentina68–70, suggests that the effect of obesity in enhancing Th1 inflammation is conserved between humans and mice.
STAR METHODS
RESOURCE AVAILABILITY
Lead contact
Further information about requests for reagents and resources should be directed to the lead contact Shannon E. Dunn, shannon.dunn@utoronto.ca.
Data and Code Availability
Raw and processed microarray data have been deposited in Geo (accession number GSE241044). OLINK data was deposited in Mendeley Data (https://doi.org/10.17632/44khystv6t.1).
This paper does not report original code.
Data S1 contains the raw data values that were used to create all graphs in the paper. Additional information about research reagents is available in the Key resource Table.
Key Resource Table
| REAGENT or RESOURCE | SOURCE | IDENTIFIER |
|---|---|---|
| Antibodies | ||
| CD16/CD32 (93) | Biolegend | Biolegend Cat# 101301, RRID:AB_312800 |
| APC-CD3 (145-2C11) | Biolegend | Biolegend: Cat# 100312, RRID:AB_312677 |
| FITC-CD3 (145-2C11) | Biolegend | Biolegend: Cat# 100306, RRID:AB_312671 |
| FITC-CD4 (GK1.5) | Biolegend | Biolegend: Cat# 100406, RRID:AB_312690 |
| PE-Cy7-CD4 (RM4-5) | Biolegend | Biolegend: Cat# 100528, RRID:AB_312729 |
| PE-Cy5-CD8 (53-6.7) | Biolegend | Biolegend Cat# 100710, RRID:AB_312749 |
| PE-CD11b (M1/70) | Biolegend | Biolegend Cat# 101208, RRID:AB_312791 |
| APC-CD11b (M1/70) | Biolegend | Biolegend Cat# 101212, RRID:AB_312795 |
| APC-CD11c (HL3) | BD | BD Cat# 550261, RRID:AB_398460 |
| BV421-CD19 (B4) | BD | BD Cat# 562441, RRID:AB_11154587 |
| PE-CD25 (PC61.5) | Biolegend | BioLegend Cat# 102007, RRID:AB_312856 |
| APC-CD25 (PC61.5) | Biolegend | BioLegend Cat# 102011, RRID:AB_312860 |
| FITC-CD44 (IM7) | Biolegend | BioLegend Cat# 103022, RRID:AB_493685 |
| PE-CD44 (IM7) | Biolegend | BioLegend Cat# 103024, RRID:AB_493687 |
| PE-Cy5-CD44 (IM7) | Biolegend | BioLegend Cat# 103009, RRID:AB_312960 |
| PE-Cy7-CD44 (IM7) | Biolegend | BioLegend Cat# 103029, RRID:AB_830786 |
| Alexa fluor700-CD44 (IM7) | BD | BD Biosciences Cat# 560567, RRID:AB_1727480 |
| PE-Cy7 CD45 (30-F11) | Biolegend | BioLegend Cat# 103114, RRID:AB_312979 |
| PE-CD45.1 (A20) | Biolegend | BD Biosciences Cat# 561872, RRID:AB_10897174 |
| PE-Cy7 CD45.1 (A20) | Biolegend | BioLegend Cat# 110730 (also 110729), RRID:AB_1134168 |
| FITC-CD45.2 (104) | Biolegend | BioLegend Cat# 109805, RRID:AB_313442 |
| PE-IFNAR1 (MAR1-5A3) | Thermofisher | Thermo Fisher Scientific Cat# 12-5945-82, RRID:AB_2572646 |
| PE-IFNGR1 (GIR-208) | Thermofisher | Thermo Fisher Scientific Cat# 12-1199-42, RRID:AB_11150056 |
| eFluor450-IL-18Ra (P3TUNYA) | Thermofisher | Thermo Fisher Scientific Cat# 48-5183-82, RRID:AB_2574069 |
| FITC-Ly6G (1A8) | Biolegend | BioLegend Cat# 127605 (also 127606), RRID:AB_1236488 |
| PE-Vβ11 TCR (RR3-15) | Thermofisher | Thermo Fisher Scientific Cat# 12-5827-82, RRID:AB_2762684 |
| SB600-NK1.1 (PK136) | Thermofisher | Thermo Fisher Scientific Cat# 63-5941-82, RRID:AB_2637451 |
| PE-FOXP3 (FJK-16s) | Thermofisher | Thermo Fisher Scientific Cat# 12-5773-82, RRID:AB_465936 |
| Alexa488-FOXP3 (MF-14) | Biolegend | BioLegend Cat# 126406, RRID:AB_1089113 |
| FITC-GM-CSF (MP1-22E9) | Biolegend | BioLegend Cat# 505404, RRID:AB_315380 |
| PE-IFN-γ (XMG1.2) | Biolegend | BioLegend Cat# 505807, RRID:AB_315401 |
| APC-IFN-γ (XMG1.2) | Biolegend | BioLegend Cat# 505810, RRID:AB_315404 |
| APC-IL-17A (eBio17B7) | Thermofisher | Thermo Fisher Scientific Cat# 17-7177-81, RRID:AB_763580 |
| PE-IL-17A (eBio17B7) | Thermofisher | Thermo Fisher Scientific Cat# 12-7177-81, RRID:AB_763582 |
| APC-MOG38-49 variant S45D tetramer | NIH Tetramer Core Facility | N/A |
| APC-human CLIP87-101 I-Ab tetramer | NIH Tetramer Core Facility | N/A |
| anti-Stat1 pY701-Alex Fluor 647 (4a) | BD | BD Biosciences Cat# 612597, RRID:AB_399880 |
| Anti-Total STAT1 Alex Fluor 647 (1/Stat1) | BD | BD Biosciences Cat# 558560, RRID:AB_647143 |
| IL-7Rα PE-Cy7 (A7R34) | Biolegend | Biolegend Cat# 135013, RRID:AB_1937265 |
| CD4-APC-eF780 (GK1.5) | Thermofisher | Thermo Fisher Scientific Cat# 47-0041-82, RRID:AB_11218896 |
| CD8-FITC (53-6.7) | Biolegend | BioLegend Cat# 100705 (also 100706), RRID:AB_312744 |
| Vβ11-PE (RR3-15) | Biolegend | BioLegend Cat# 139003, RRID:AB_10613472 |
| CD28 Monoclonal Antibody (CD28.2) | Thermofisher | Thermo Fisher Scientific Cat# 16-0289-81, RRID:AB_468926 |
| CD3 Monoclonal Antibody (OKT3) | Thermofisher | Thermo Fisher Scientific Cat# 16-0037-81, RRID:AB_468854 |
| Biotin-IFNAR (MAR1-5A3) | Biolegend | BioLegend Cat# 127306, RRID:AB_ 1134249 |
| Biological samples | ||
| Human serum (O-link analysis) | Arthritis and Clinical Immunology Research Program, Oklahoma Medical Research Foundation | IRB# 16-05 |
| Peripheral blood mononuclear cells | University Health Network Stanford University | REB 09-0577-AE IRB# 97959 |
| Diets, chemicals, peptides, and recombinant proteins | ||
| High-fat diet (60% kcal of fat) | Research Diets | Research Diets Cat#: D12492i |
| Normal Chow Diet | Inotiv | # 7912 |
| MOG35-55 peptide MEVGWYRSPFSRVVHLYRNGK | Genemed Synthesis | Genemed Synthesis Cat#: MOG3555-P2-5 |
| PLP139-151 peptide HSLGKWLGHPDKF | Genemed Synthesis | Genemed Synthesis Cat#: SP-86876-5 |
| heat-killed Mycobacterium tuberculosis H37Ra | Difco Laboratories | Difco Laboratories Cat#: DF3114-33-8 |
| Bordetella pertussis toxin | List Biologicals | List Biologicals Cat#: 181 |
| luxol fast blue | Sigma | Sigma Cat#:L0294 |
| collagenase IV | Sigma | Sigma Cat#:C5138-500MG |
| Collagenase D | Roche | Roche Cat#: 11088866001 |
| DNAse I | Sigma | Sigma Cat#:11284932001 |
| Percoll | Fisher Scientific | Fisher Scientific Cat#: 45-001-747 |
| FBS | Corning | Corning Cat#: 35-077-CV |
| EDTA | Bioshop | Bioshop Cat#:EDT111.500 |
| HBSS | Thermo FisherScientific | Thermo FisherScientific Cat#: 14025092 |
| Foxp3/Transcription Factor Staining Buffer Set | Thermo FisherScientific | Thermo FisherScientific Cat#: 00-5523-00 |
| Fixable Viability Dye eFluor 506 | Thermo FisherScientific | Thermo FisherScientific Cat#: 65-0866-18 |
| phorbol 12-myristate 13-acetate (PMA) | Thermo FisherScientific | Thermo FisherScientific Cat#: J63916MCR |
| Ionomycin, Calcium Salt | Thermo FisherScientific | Thermo FisherScientific Cat#: I24222 |
| OneComp eBeads Compensation Beads | Thermo FisherScientific | Thermo FisherScientific Cat#: 01-1111-42 |
| [3H]-thymidine | Perkin Elmer | Perkin Elmer Cat#: NET027A001MC |
| RNAlater | Thermo FisherScientific | Thermo FisherScientific Cat#: AM7024 |
| GolgiPlug | BD | BD Cat#: 555029 |
| GolgiStop | BD | BD Cat#: 554724 |
| L-glutamine | BioShop | Wisent Cat#: GLU999 |
| Penicillin/Streptomycin | BioShop | BioShop Cat#: PST999.100 |
| Sodium Pyruvate | Thermo FisherScientific | Thermo FisherScientific Cat#: 11360-070 |
| MEM NEAA | Thermo FisherScientific | Thermo FisherScientific Cat#: 11140-050 |
| RPMI 1640 | Corning | Corning Cat#:10-041-CV |
| Critical commercial assays | ||
| Olink Explore 1536 | Olink Proteomics | OLink Proteomics Cat#: 1536 |
| RNeasy Mini Kit | QIAGEN | QIAGEN Cat#: 74104 |
| EasySep™ Mouse CD4+ T Cell Isolation Kit | Stemcell | Stemcell Cat#: 19852 |
| EasySep™ Mouse Naïve CD4+ T Cell Isolation Kit | Stemcell | Stemcell Cat#: 19765 |
| MagniSort™ Mouse CD11c Positive Selection Kit | Thermofisher | Thermofisher Cat#: 8802-6861-74 |
| SuperScript III reverse transcriptase | Thermofisher | Thermofisher Cat#: 18080093 |
| Universal SYBR Green Master Mix | Thermofisher | Thermofisher Cat#: 4309155 |
| GeneChip Mouse Gene 2.0 ST array | Thermofisher (Affymetrix) | Thermofisher Cat#: 902500 |
| DNeasy PowerSoil Pro kit | QIAGEN | QIAGEN Cat#: 47014 |
| VeriKine-HS Mouse IFN-α All Subtype ELISA kit | PBL Assay Science | PBL Assay Science Cat #:42115 |
| VeriKine-HS Mouse IFN-β All Subtype ELISA kit | PBL Assay Science | PBL Assay Science Cat #: 42410-1 |
| Mouse Adipokine magnetic bead panel | Millipore | Millipore Cat#: MADKMAG-71K RRID:AB_2801416 |
| DAPI | Biolegend | Biolegend Cat#: 422801 |
| Soluble anti-CD3e | Invitrogen | Invitrogen Cat#: 145-2C11 |
| BD perm wash | BD | BD Cat#: 554723 |
| X-Vivo 15 Serum Free Medium with Gentamicin and Phenol Red | Lonza | Lonza Cat#: 04-418Q |
| Dynabeads™ Human T-Activator CD3/CD28 for T Cell Expansion and Activation | Gibco | Gibco Cat#: 11131D RRID:AB_2916088 |
| mouse recombinant IL-12p70 | Biolegend | Biolegend Cat#: 577004 |
| mouse recombinant IFNγ | Biolegend | Biolegend Cat#: 575304 |
| Human IL-17A ELISA Ready-set-go | Invitrogen | Invitrogen Cat# : 5017243 |
| Human IFN-γ ELISA Ready-set-go | Invitrogen | Invitrogen Cat# : 5017325 |
| Human IL-2 ELISA Ready-set-go | Invitrogen | Invitrogen Cat# : 14-7029-68 |
| Mouse IL-17A ELISA MAX | Biolegend | Biolegend Cat# : 79108 |
| Mouse IFN-γ ELISA OptEIA | BD | BD Cat# : 51-26121E |
| Mouse IL-2 ELISA | Invitrogen | Invitrogen Cat# : 14-7022-85 |
| Mouse Flow Cytomix assays | Biolegend | Biolegend Cat# : BMS822FF |
| Deposited data | ||
| Raw and processed microarray data | Geo | GSE241044 |
| Olink data | Mendeley Data | https://doi.org/10.17632/44khystv6t.1 |
| Experimental models: Organisms/strains | ||
| C57BL/6J (#664) | The Jackson Laboratory | The Jackson Laboratory Cat#: RRID:IMSR_JAX:000664 |
| SJL/J (#686) | The Jackson Laboratory | The Jackson Laboratory Cat#: RRID:IMSR_JAX:000686 |
| C57BL/6-Tg (Tcra2D2,Tcrb2D2)1Kuch/J (#6912) | The Jackson Laboratory | The Jackson Laboratory Cat#: RRID:IMSR_JAX:006912 |
| B6.129S2-Cd4tm1Mak/J (CD4 KO) (#2663) | The Jackson Laboratory | The Jackson Laboratory Cat#: RRID:IMSR_JAX:002663 |
| B6.BKS(D)-Leprdb/(#697) | The Jackson Laboratory | The Jackson Laboratory Cat#: RRID:IMSR_JAX:000697 |
| B6.Cg-Tg(Lck-icre) 3779Nik/J (#12837) | The Jackson Laboratory | The Jackson Laboratory Cat#: RRID:MGI:4442208 |
| B6.129P2-Leprtm1Rck/J (#8327) | The Jackson Laboratory | The Jackson Laboratory Cat#: RRID:IMSR_JAX:008327 |
| B6(Cg)-Ifnar1tm1.1Ees/J (#28256) | The Jackson Laboratory | The Jackson Laboratory Cat#: RRID:IMSR_JAX:028256 |
| Oligonucleotides | ||
| Ifng (FWD) 5’ – TGGCTCTGCAGGATTTTCATG-3’ | IDT | N/A |
| Ifng (REV) 5’-TCAAGTGGCATAGATGTGGAAGAA-3’ | IDT | N/A |
| Stat1 (FWD) 5’-GGAGGTGAACCTGACTTCCA-3’ | IDT | N/A |
| Stat1 (REV) 5’-TCTGGTGCTTCCTTTGGTCT-3’ | IDT | N/A |
| Stat4 (FWD) 5’-TCTGCTCAAAGATAAAATGCCTG-3’ | IDT | N/A |
| Stat4 (REV) 5’-TCCATTTTCAGATTGGTCCAC-3’ | IDT | N/A |
| Tbx21 (FWD) 5’-GCCAAAGGATTCCGGGAGAA-3’ | IDT | N/A |
| Tbx21 (REV) 5’-GGTAGAAACGGCTGGGAACA-3’ | IDT | N/A |
| Actb (FWD) 5’-GAACCCTAAGGCCAACCG-3’ | IDT | N/A |
| Actb (REV) 5’-CACGCACGATTTCCCTCT-3’. | IDT | N/A |
| Ifnar1 (FWD) 5’-AGAGGTAGTCTCCAGCTCCG-3’ | IDT | N/A |
| Ifnar1 (REV) 5’-CGCCTCGTCTTTTGTTCGAT-3’ | IDT | N/A |
| Leprb (FWD) 5’-ACAATTGTAAGAGAGGCTGCTGA-3’ | IDT | N/A |
| Leprb (REV) 5’-ACAATTGTAAGAGAGGCTGCTGA-3’ | IDT | N/A |
| Software and algorithms | ||
| GraphPad Prism v9.5.0 | GraphPad | RRID:SCR_002798 |
| R v4.2.3 | R | RRID:SCR_001905 |
| Ingenuity Pathway Analysis (IPA) | QIAGEN | RRID:SCR_008653 |
| FlowJo v10.8.1 | TreeStar | RRID:SCR_008520 |
| ImageJ | NIH | RRID:SCR_003070 |
| GeneSpring software v12.1 | Agilent | RRID:SCR_010972 |
| DAVID Functional Annotation tool v6.8 | NIH | RRID:SCR_001881 |
| Qiime2 analysis package v2023.2 | Qiime2 | RRID:SCR_021258 |
Materials Availability
This study did not generate new unique reagents.
EXPERIMENTAL MODEL AND SUBJECT DETAILS
Human subjects
For the OLINK analysis, 114 untreated RRMS patients and 45 healthy volunteers were consented to provide demographic information and serum between December 2012 to April 2021 (Table S1). Data pertaining to disease diagnosis, disease status, body mass index, and medication usage was extracted from medical records. Ethnicity, race, and sex were self-reported by the participants. RRMS patients were diagnosed using the 2010 or 2017 revised McDonald criteria71,72. RRMS patients who were not treatment-naive were off therapy for at least 1 month prior to the blood draw, with a median time off therapy of 4 months (range of 1-96 months). Written informed consent was obtained under an approved REB (IRB# 16-05) from individuals prior to participation in the study.
For experiments that examined the responses of human naïve CD4+ T cells to anti-CD3/anti-CD28, blood samples were drawn from individuals who self-identified as being healthy male and females (aged 20-30 years) after obtaining informed consent under an approved REB (REB 09-0577-AE) or IRB (IRB# 97959). All participants were free of medications with the exception of oral contraceptives, which were used by ~50% of the women. Other exclusion criteria included smoking and drug use, recent infection (≤ 4 weeks), recent history of acute or history of chronic disease, or obesity (BMI ≥ 30 kg/m2). Blood was collected from women during the self-reported follicular phase of the menstrual cycle. Blood draws were conducted in the morning hours.
Mouse model details and animal ethics
C57BL/6J (#664), SJL/J (#686), and B6.BKS(D)-Leprdb/J (#697) (db/db mice) were obtained directly from Jackson Laboratory (Bar Harbor, ME, USA) and used for experiments. Breeder pairs of C57BL/6-Tg (Tcra2D2,Tcrb2D2)1Kuch/J (2D2) (#6912), B6.129S2-Cd4tm1Mak/J (CD4 KO) (#2663), B6.Cg-Tg(Lck-icre) 3779Nik/J (distal Lck-cre) (#12837), and B6.129P2-Leprtm1Rck/J (#8327), and B6(Cg)-Ifnar1tm1.1Ees/J (#28256) were obtained from Jackson laboratory and were used to establish in-house colonies.
T cell-specific leptin receptor-deficient mice were generated by crossing mice that have a floxed first exon of the leptin receptor (#8327) with mice expressing Cre recombinase under the control of the distal Lck Cre promoter (#12837)73. T cell-specific type I IFN receptor 1 (IFNAR1) mice were generated by crossing these Lck-Cre mice with mice bearing a floxed exon 3 of the IFNAR1 gene (#28256). F1 generation mice from either of these crosses were bred together to generate mice that were homozygotes for the floxed allele and either negative or heterozygotes for the Lck-Cre distal allele. F2 mice generated from these F1 pairings were bred together to generate littermates having these same genotypes for experiments.
CD4+ T cell-specific leptin receptor-deficient mice were generated using a radiation bone marrow chimera (BMC) approach. For this procedure, BM cells were isolated from the tibias and femurs of 8-12 week old CD4 knockout, db/db, and C57BL/6J mice as described previously74. Briefly, femurs and tibias are removed and placed in 70% ethanol in a sterile petri dish for 2 minutes. This was followed by two washes (2 min each) in ice-cold sterile 1 x PBS. Bones were then cut at both ends using scissors and the bone marrow was then flushed out of the bones into a sterile petri dish using a 27-gauge needle syringe filled with 1 x PBS. Cells were dissociated through a 70 μm sieve, transferred to a 50 mL conical tube and then centrifuged (300 x g for 10 min). Red blood cells were lysed with by resuspending the cell pellet in 2 mL of Ammonium-Chloride-Potassium (ACK) lysis buffer (0.15 M NH4Cl, 10 mM KHCO3, 0.1 mM Na2EDTA). The lysis reaction was stopped after 1 min and 15 s by adding excess 1 x PBS to the tube. Cells were centrifuged again and the pellet was resuspended in 1 x PBS and cells were counted using a hemacytometer and kept on ice until transfer.
Recipient CD4 KO mice (aged 7-9 weeks old) were lethally-irradiated with two 5.5 Gy doses of γ-irradiation, separated by a 3 h interval in a ventilated 137Cs irradiator (MDS Nordion Gammacell 40). Irradiated CD4 KO recipient mice were injected i.v. via tail vein with 3-4×10⁶ mixed BM donor cells of 80% CD4 knockout and 20% WT or 80% CD4 knockout and 20% db/db. Recipient mice were treated with 0.25 mg/ml Enrofloxacin containing water (Baytril NR, Bayer) for first 12 days following irradiation to prevent infection. BMC mice were provided NCD or HFD for 4 weeks, starting at 8 weeks post-immune reconstitution. The reconstitution of CD4+ T cells was verified by evaluating the percentage of CD4+ T cells in heparinized peripheral blood, after red blood cell lysis, by flow cytometry using anti-CD4-FITC and CD3-APC antibodies.
All mice were maintained group-housed in a specific pathogen-free environment under 12 h: 12 h dark-light cycle. The temperature in the room where the animals were housed was monitored over a month period and was found to fluctuate between 19.6 and 20.3 °C. All experiments were conducted following the guidelines of the Canadian Council of Animal Care) under animal protocols (AUP 5937 and 153) that were approved by the University Health Network and St. Michael’s hospital animal care committees.
Dietary treatments
In all experiments, mice were weaned to NCD consisting of 17% kcal of fat (7912, Harlan). For HFD studies, mice were either continued on NCD or switched to high-fat diet (HFD) consisting of 60% kcal of fat (D12492i, Research Diets). These diets were continued for 4-8 weeks depending on the experiment. Mice were weighed weekly. For the diet-reversal studies, mice that received HFD were switched back to NCD at 10 weeks of age.
Post-natal overnutrition model
Timed pregnancies were set up in female and male C57BL/6J mice that were set up in harems of two females with one male. Mice were bred together for four days before males were removed. Dams were kept on a breeding chow (Teklad Global 19% Protein Extruded Rodent Diet) throughout the pregnancy and lactation periods. Litters born within 72 h of one another were individually sexed and then pooled together with same-sex pups in one large cage. Pups were then randomly redistributed back to lactating dams to create sex matched litters of N = 3 pups/dam or N = 8 pups/dam. Pups were weighed weekly and weaned onto normal chow diet at postnatal day 24. Mice were 8 weeks of age at the time experiments were initiated or performed.
Ovariectomies
Female C57BL/6J mice, received from Jackson Laboratories aged 3 weeks were acclimatized for one week in the animal facility. At 4 weeks of age, mice were provided a bilateral ovariectomy or sham surgery. For ovariectomies, mice were anaesthetized with isoflurane and the skin was disinfected on the animals’ back. A 1 cm incision was made in the skin on the animal’s back just below the apex in the spine using sterile surgical scissors. Then, a 0.75 cm incision was made in the body wall on either side of the spine using fine scissors. Sterile forceps were used to grasp and externalize the abdominal fat pad (to which the ovary is attached). Fine scissors were used to sever the ovary at the juncture with the fallopian tube, and the fat pad was returned to the body cavity. Incisions were closed with 4-0 absorbable suture and the skin incision was closed with staples. For sham surgeries, the procedures were the same except that the ovary was not severed. Animals recovered two weeks before starting HFD, and six weeks prior to conducting immune studies at 10 weeks of age.
METHOD DETAILS
Human Blood Collection and Processing
For OLINK analysis, serum samples were collected in BD Vacutainer Serum tubes. Blood was allowed to clot for 60 minutes and then centrifuged at 1300 x g for 10 minutes. Serum was then aliquoted into tubes for storage at −80 °C. For naïve CD4+ T cell studies, peripheral blood was collected in BD Vacutainer tubes with sodium heparin. Peripheral blood mononuclear cells (PBMCs) were isolated from heparinized blood using Ficoll-Paque density gradient centrifugation (GE Healthcare). Cells were washed in 1 x MACS buffer and were counted.
Proteomic Analysis on Human Serum
Proteins were measured from serum samples using Olink Explore 1536 from Olink Proteomics which combines the proximity extension assay (PEA)78 with next-generation sequencing (NGS) technology79. The complete library contains antibodies targeting 1472 proteins, of which 1463 are unique proteins. Patient samples were randomized and incubated overnight with antibodies conjugated to oligonucleotide PEA probes at 4°C. After antibody binding, oligonucleotide annealing, and extension steps, the pre-amplification mix was added to the samples at room temperature. PCR amplification was performed, and PCR amplicons were then pooled and subjected to another PCR amplification step after addition of individual sample index sequences. After pooling of the samples, bead purification and quality control of the generated libraries were performed. Sequencing was carried out using Illumina’s NovaSeq 6000 instrument. Quality control and normalization processes were then performed to translate barcode sequence counts into normalized protein expression (NPX) units. Assays on the samples were performed blinded from the clinical data. Significant differences in individual protein levels (NPX units) between obese and non-obese was determined using T tests (two groups were compared) and adjusted for multiple comparisons by the Bonferroni and Hochberg method (R v4.2.3). Statistical comparisons of individual proteins between three or more groups were determined using one-way ANOVA (GraphPad Prism v9.5.0). For bioinformatic analysis, differentially abundant serum proteins were mapped to biological pathways using Ingenuity Pathway Analysis (IPA) (QIAGEN Inc.)80.
Genotyping
Mice positive for the 2D2 transgene (#6912) were identified as having a majority (>75%) of CD4+ T cells that were double positive for Vβ11 and CD4 in peripheral blood. Staining of heparinized blood cells with CD4-FITC (GK1.5) and Vβ11-PE (RR3-15) antibodies (BD Biosciences) was performed as described previously75. In brief, a drop of blood was collected from the saphenous vein of mice into a FACS tube that contained 15 μl of 1 x PBS and 5 U/ml of heparin (Sigma). Cells were stained by adding 20 μl of FACS buffer (1 x PBS containing 2% fetal calf serum) containing the FITC-CD4 and Vβ11-PE antibodies directly to the tube containing blood. Tubes were incubated at room temperature in the dark for 30 min. Red blood cells were lysed via the addition of 2 mL of ACK lysis buffer to each tube. Once the cell suspension became transparent, 2 ml of FACS buffer was added to stop the cell lysis. Cells were centrifuged at 335 x g at 4 °C for 5 min, the supernatant was decanted and cells were resuspended in FACS buffer for analysis. Genotyping of other mice was performed by PCR amplification of genomic DNA obtained from tail or ear snips according to the genotyping protocols provided by the Jackson Laboratory.
Fat mass and metabolic measurements
The inguinal fat pad (subcutaneous fat) and the gonadal fat pad (visceral fat) were dissected from mice and weighed. For glucose tolerance tests, mice were fasted overnight for 16 hours prior and then injected i.p. with 1 g/ kg of body weight of D-Glucose (Sigma) in 1 x PBS. Blood was collected by tail vein at 0, 15, 30, 60, 90, and 120 min post-injection using the Contour Next EZ glucometer (Bayer). For insulin tolerance tests, mice were fasted for 6 hours and then injected i.p. with 0.5 U/kg of body weight with human insulin (Humalog, Eli Lilly). Blood glucose levels were measured at 0, 15, 30, 24, 60, 90, and 120 min using the Contour Next EZ glucometer.
Active EAE Induction and immunization to assess the myelin-specific recall T cell response
Mice were injected subcutaneously on the left and right sides of the chest with 50 μl of emulsion/side containing either 100 μg MOG35-55 or PLP139-151 (Genemed Synthesis) in complete Freund’s adjuvant (CFA) that contained pestle-ground 2 mg/ml heat-killed Mycobacterium tuberculosis H37Ra in incomplete Freund’s adjuvant (Difco Laboratories). For EAE induction in C57BL/6J mice, mice were provided 100-200 ng Bordetella pertussis toxin (PTX) (List Biologicals) i.p. on day 0 and day 2 post-injection. Each new lot of PTX was titrated in preliminary EAE studies prior for use in experiments. Mice were weighed and examined daily for development of clinical symptoms using a 5-point scale: 0= no clinical symptoms, 1= complete loss of tail tone, 2= hindlimb or foot weakness, 3= complete hindlimb paralysis in one or both limbs, 4= complete hindlimb paralysis and forelimb weakness and 5= death or moribund.
Percent demyelination in spinal cord white matter
At the endpoint of EAE, spinal cords were harvested from mice and were fixed in 10% formalin for 6 days and were embedded in a single paraffin block (~10-12 spinal cord cross-sections and 6 brain coronal sections/block)76. Sections were cut at 5 μm thickness and were stained with luxol fast blue (LFB) to visualize demyelinating lesions76. In brief, slides were de-paraffinized in xylene and then rehydrated by incubating in baths of 100% ethanol (2 x 5 min) and 95% ethanol (3 min). Slides were then transferred into a glass staining dish containing LFB solution (0.1% solvent blue 38 from Sigma and 0.25% glacial acetic acid in 95% ethanol). The staining dish was sealed with paraffin and sections were incubated overnight in a 56°C oven. The following morning, slides were transferred into a distilled water bath. Then the following cycle was performed until the grey matter was sufficiently de-blued: slides were dipped in 0.2% lithium chloride solution for 5 seconds, were incubated in three consecutive 70% ethanol baths (2 dips each), and then held in water and visualized using the microscope. Sections were then dehydrated by incubating in 95% ethanol (2 x 5 min) followed by 100% ethanol (2 x 5 min). Sections were cleared for 5 min in xylene and then cover-slipped using Permount.
Slides were then scanned and images of each spinal cord section were converted to TIFF images that were imported into ImageJ76. The percent area of white matter that was stained with myelin was calculated as previously described76. In brief, each image was opened and converted to a grey scale image and then thresholding was performed such that the overlay captured all of the dark (myelin-stained) regions. The polygon tool was used to outline the dorsal spinal cord white matter as well as the anterior-lateral-white matter region of each spinal cord section. The area fraction was measured using this ImageJ tool under the measurement menu. This value from the dorsal and ventral-lateral white matter areas was averaged to determine a percent staining value for each section and then this value was averaged across all sections for each mouse. The percent demyelination was estimated by subtracting the percent area staining from 100%.
Mononuclear cell isolation from the CNS, spleens, and lymph nodes
CNS mononuclear cell isolation was performed at 2-4 days after the onset of EAE as described previously77,78. In brief, mice were anaesthetized using isoflurane and were transcardially-perfused with 20 ml of 1 x PBS (Calcium, magnesium free, Gibco) containing 5 U/ml of heparin (Sigma). For each mouse, the spinal cord and cerebellum were harvested and were pooled together in a tube containing 1 x HBSS (Ca2+/Mg2+ free) and FBS. Tissues were then transferred into a sterile petri dish containing 1.5 mL of 1 x HBSS and were scissor-minced. An equal volume of 2 x collagenase IV (600 U/mL stock, Sigma) was added to the tissue mixture along with 15 μl of DNAase (1000 U/ml stock). Tissues were digested for 30 minutes at 37°C. The digested tissue was dissociated through a 70 μm sieve and then transferred to a conical tube and centrifuged for 10 min at 4°C (754 x g). The pellet was resuspended in 5 mL of 40% Percoll (GE Healthcare) and this was slowly layered onto 2.5 mL of 70% Percoll contained in a conical tube. The gradient was centrifuged at 800 x g for 30 min (no brake). The myelin debris was removed from the top of the layer and then mononuclear cells were collected from the 40%/70% interface using a pipette and transferred to a fresh tube. Cells were washed twice by topping up the tube with 1 x HBSS followed by centrifugation (10 min at 300 g at 4°C) and Percoll gradient (GE Healthcare)77,78. Cells were then resuspended in 200 μl of 1 x FACS buffer (1 x PBS supplemented with 2% FBS and 0.5M EDTA) or Complete T cell media (CM) that consisted of RPMI 1640, 10% FBS (Hyclone), 1 mM sodium pyruvate, 2 mM L-glutamine, 0.1 mM non-essential amino acids, 100 U/ml penicillin/streptomycin, and 0.5 μM 2-mercaptoethanol all from (Gibco) and were counted.
Spleens and axillary and inguinal lymph nodes were harvested from mice and were processed into a single cell suspension in sterile 1 x PBS by smashing through 70 micron sieves using the back end of a sterile syringe. Cells were centrifuged for 1 x 10 min at 300 x g. Red blood cells were lysed by resuspending the cell pellet (1 ml/spleen or lymph node) using ACK lysis buffer. The lysis reaction was stopped after 1 min and 15 s by adding excess 1 x PBS to the tube. Cells were centrifuged again and the pellet was resuspended in FACS buffer or CM and cells were counted using a hemacytometer.
Examining MOG35-55-specific-peripheral T cell responses and adoptive transfer EAE studies
At 9 days post-immunization with MOG35-55 (C57BL/6J) or PLP139-151 (SJL/J) and CFA, mononuclear cells were isolated from the spleen and axillary and inguinal lymph nodes and were re-suspended in CM as described above. Cells were cultured at 0.5 x 10⁶ cells/well in 200 μl CM that contained various concentrations of MOG35-55 or PLP139-151 for 48-72 h at 37 °C in a 5% CO2 incubator. Cytokines were measured in culture supernatants using mouse Ready-Set-Go (Invitrogen) or Legend MaxTM kits (Biolegend) ELISA kits at the time of peak cytokine production: IFN-γ (at 48 or 72h), IL-17A (72 h), or IL-2 (24 or 48 h). Absorbance was read at 450 nm using a VictorX3 plate reader (Perkin Elmer).
For adoptive transfer EAE studies, spleen and lymph nodes from control or DIO C57BL/6J females or males were processed in a similar manner except that cells were plated at 4.0 x 10⁶ cells/ml in CM in tissue culture-treated vented 75 cm2 flasks in the presence of 10 μg/ml MOG35-55 and 10 ng/ml mouse recombinant IL-12p70 (Biolegend). After 72 h, non-adherent cells were collected from flasks, were washed three times in 1 x PBS (centrifuging between, 300 x g at 4°C) and then placed on ice. Thirty million cells were injected i.p. into each recipient male C57BL/6J mice.
Flow cytometry
Centrifugations were conducted at 300 x g for 5 min following each wash to pellet cells. Cells (1 x 10⁶/stain) were washed twice in 1 x FACS buffer. Fc receptors were blocked by incubating cells with 0.5 μg purified CD16/CD32 (93) antibody (Biolegend) in 50 μl 1x PBS for 15 min at 4 °C. Cells were washed with 1 x PBS, and then 1 x 10⁶ cells were stained for 30 min at 4 °C with Fixable Viability Dye eFluor 506 (1:1000) (Thermo FisherScientific) and cell surface antibodies diluted in 100 μl FACS buffer for 30 min at 4°C. Antibodies include: APC-CD3 (145-2C11), FITC-CD3 (145-2C11), FITC-CD4 (GK1.5), PE-Cy7-CD4 (RM4-5), PE-Cy5-CD8 (53-6.7), PE-CD11b (M1/70), APC-CD11b (M1/70), APC-CD11c (HL3), BV421-CD19 (B4), PE-CD25 (PC61.5), APC-CD25 (PC61.5), FITC-CD44 (IM7), PE-CD44 (IM7), PE-Cy5-CD44 (IM7), PE-Cy7-CD44 (IM7), Alexa fluor700-CD44 (IM7), PE-Cy7 CD45 (30-F11), PE-CD45.1 (A20), PE-Cy7 CD45.1 (A20), FITC-CD45.2 (104), PE-IFNAR1 (MAR1-5A3), Biotin-IFNAR1 (MAR1-5A3), PE-IFNGR1 (GIR-208), eFluor450- IL-18Ra (P3TUNYA), FITC-Ly6G (1A8), PE-Vbeta11 TCR (RR3-15) and SB600-NK1.1 (PK136). Cell surface staining with Biotin-IFNAR1 was followed by a 20 minute incubation with Strepavidin-APC. Cells were washed twice with 1 x FACS buffer before proceeding to flow cytometry.
For intracellular cytokine staining, cells were stimulated with 10 ng/ml PMA and 750 nM Ionomycin in CM with GolgiPlug or GolgiStop for 3-6 hours at 37°C. Viability and cell surface antibody staining was performed as described above. Cells were fixed in 4% PFA (Electron Microscopy Sciences) for 10 min at RT and were washed twice in FACS buffer and then incubated in 1x Perm/Wash buffer (BD) for 15 min at 4 °C. After centrifugation, cells were stained with cytokine antibodies diluted in 1x Perm/Wash buffer for 30-60 min at 4°C. After two washes in 1x Perm/Wash buffer, cells were resuspended in FACS buffer for acquisition. Alternatively, cells were fixed and permeabilized and cytokine and FoxP3 staining was performed using reagents and instructions provided with the Foxp3/Transcription Factor Staining Buffer Set (Thermo Fisher Scientific). Antibodies used for intracellular and intranuclear staining include: PE-FOXP3 (FJK-16S), Alexa488-FOXP3 (MF-14), FITC-GM-CSF (MP1-22E9), PE- IFN-γ (XMG1.2), APC- IFN-γ (XMG1.2), APC-IL-17A (eBio17B7) and PE-IL-17A (eBio17B7).
For MOG tetramer staining, Fc receptors were blocked, and cells were incubated with the mouse IAb-MOG38-49 variant S45D or IAb-human CLIP87-101 tetramer-APC reagents (NIH Tetramer Core Facility at Emory University) for 3 h at 37°C at 1:50 dilution in 50 μl of T cell complete media. After washing in 1 x PBS, samples were stained with CD4-PE-Cy7, CD44-FITC, and Fixable Viability Dye eFluor 506 for 30 min at 4 °C, and washed again with 1 x FACS buffer prior to flow cytometry.
For assessment of phospho-STAT (Y701) and total STAT staining, 106 cells were plated, stimulated, fixed, and permeabilized in the same 96-well U-bottomed plate. Cells were first serum-starved at 37°C for 1 h in RPMI prior to stimulation. eFluor 506 viability dye (prepared in 1 x PBS) was added to wells in the last 15 minutes of incubation. Cells were then stimulated with 100 ng/ml recombinant mouse IFN-γ (100 ng/ml) (Invitrogen) at 37°C. Stimulations were stopped by adding PFA (1.5% final concentration) to the wells at 0, 2, 5, 10 min, 15 min. For total STAT1 intracellular staining, cells were instead stained with viability dye (1:1000 in 1 x PBS) and then were fixed in 1.5% PFA. For both phospho-STAT and total STAT staining workflows, post-PFA-fixation, cells were permeabilized with ice-cold methanol (pre-chilled at −20°C, Fisher Scientific) for 10 min on ice and then were washed twice with 1 x PBS. Fc receptor blockade was performed as described above and cells were then stained in 1 x FACS buffer for 1 h at RT with both cell surface- and intracellular-targeted antibodies: anti-Stat1 pY701-Alex Fluor 647 (4a), CD4-APC-eF780 (GK1.5), CD44-PE (IM7), CD8-FITC (53-6.7), and CD19-BV421 (B4) for IFN-γ signaling and Stat1 (N-Terminus)-Alexa Fluor 647 (1/STAT1), CD4-APC-eF780 (GK 1.5), CD44-PE (IM7), CD8-FITC (53-6.7), and CD19-BV421 (B4) in FACS for STAT1 expression. Cells were washed twice in 1 x FACS buffer, and were resuspended in 1 x FACS buffer for acquisition.
Cells were acquired either on an LSR II (BD Biosciences) or Sony SP6800 and were analyzed using FlowJo (TreeStar). OneComp eBeads Compensation Beads (Invitrogen) were used as single stain controls. Fluorescence minus one (FMO) controls or unstimulated controls were used to set gates.
Dendritic cell (DC)/CD4+ T cell co-culture assay
For dendritic cell isolation studies, spleens were harvested from mice and then were placed in a petri dish containing 1 x HBSS (Gibco) supplemented with 1 mg/ml collagenase D (Roche). The tissue was injected with the collagenase D in 1 x PBS using 27 G needle and syringe and then the tissue was digested for 30 min at 37°C. Digested tissue was then dissociated through a 70 μm cell strainer into 1 x PBS. Cells were centrifuged, red blood cells were lysed in ACK lysis buffer, and cells were washed and resuspended in 1 x MACS buffer. CD11c+ cells were isolated from spleen mononuclear cells using the CD11c+ Magnisort kit (Invitrogen) and were resuspended in CM. These cells were irradiated at 30 Gy using a Cesium irradiator, were washed, and resuspended in CM. Total CD4+ T cells from 2D2 mice were negatively selected using magnetic isolation kits (Stem Cell or Invitrogen). In brief, spleens and lymph nodes from 2D2 mice were dissected, mononuclear cells were isolated and red blood cells lysed as described above, and cells were resuspended in 1 x MACS buffer. Magnetic isolation was performed according to kit directions and cells were resuspended in CM for counting. CD4+ T cells were co-cultured together with CD11c+ cells (1:2 ratio) with 0, 5, 20, or 40 μg/ml MOG35-55. The proliferation of CD4+ T cells was measured by [3H]-thymidine incorporation assay (wells pulsed 48 h and cells harvested 18 h later). Cytokine levels were measured in culture supernatants at 48 h using Ready-set-go ELISA kits (Invitrogen).
Treg suppression assay
CD4+ T cells from either DIO or NCD-fed mice magnetically isolated by negative selection from spleens and lymph nodes and then cells were stained for antibodies specific against CD4, CD25, CD44, and DAPI. CD4+CD25+ Tregs and CD4+CD44low-int CD25− naïve T cells were FACS using an Aria II FACS Sorter (BD) at the Sickkids/UHN flow cytometry facility. Cell fractions were washed, counted, and resuspended in CM. Tregs from DIO and control mice were co-cultured with CD4+CD44low-int T cells from sex-matched NCD-fed mice at the indicated ratios together with irradiated (30 Gy) splenocytes from sex-matched control mice and 5 μg/ml of soluble anti-CD3e (145-2C11) (Invitrogen). Cells were pulsed with by [3H]-thymidine at 72 h and cells were harvested 18 h later and beta counting (in CPM) was performed as described below.
[3H]-Thymidine incorporation assay
Cells were pulsed with thymidine (0.5 μCi/well) (Perkin Elmer). Eighteen hours later, cells were harvested onto glass fiber filter paper (Brandel Scientific) using a PHD cell harvester (Cambridge Technologies). Filter paper discs were air-dried overnight. The radioactivity in counts per minute (CPM) in filter paper discs was measured in liquid scintillation cocktail (MP Biomedicals) using a beta counter (Perkin Elmer). In all cases, the peak in the T cell proliferative response is shown.
Murine and human naive CD4+ T cell stimulation assays
For mice, naïve CD4+CD44lo T cells from spleen and lymph node mononuclear cell populations were resuspended in MACS buffer (Miltenyi) and further isolated by negative selection according to kit directions (Miltenyi) or by FACS sorting after cell surface staining with CD3 and CD44 antibodies using a FACS Aria II (Sickkids Flow Cytometry facility). For bead isolation, the purity of isolated CD4+ T cells was >95% as verified by flow cytometry using anti-CD4 and anti-CD44 antibodies. Post-isolation, cells were washed twice in CM and then plated on plates that had been pre-coated with 0-5 μg/ml of CD3 and CD28 antibodies.
Human naïve CD4+ T cell stimulations were performed as described previously in X-VIVO media-15 with Dynabeads human T-activator anti-CD3 and anti-CD28 (1 bead for every 5 cell)47. Proliferation of cells was measured by [3H]-thymidine incorporation assay in CPM. Cytokines were measured in the culture supernatants by ELISA using Ready-Set-Go human IL-2, IFN-γ, IL-17 ELISA kits (Invitrogen). Measurements shown were sampled in the linear phase of the activation curve.
Real-time RT-PCR
Naïve CD4+ T cells were isolated spleens and lymph nodes of female and male control or DIO mice and were frozen. Alternatively, naive CD4+ T cells were isolated as described above and stimulated with 2 μg/ml of plate-bound anti-CD3e and anti-CD28 (Invitrogen) for 0, 4, 8, and 16 h. Total RNA was isolated using a RNeasy Mini Kit (Qiagen) and RNA concentration and purity were measured using a NanoDrop (Thermo Fisher). cDNA was generated by reverse-transcribing 100 ng total RNA using Superscript III reverse transcriptase (Invitrogen). For real-time PCR (qPCR), cDNA amplification was performed using Universal SYBR Green Master Mix (Roche) following the manufacturer’s instructions. Data was normalized to ActB. Relative fold change was calculated using the Livak-method. Primers used include: Ifng (FWD) 5’ – TGGCTCTGCAGGATTTTCATG-3’, Ifng (REV) 5’-TCAAGTGGCATAGATGTGGAAGAA-3’, Stat1 (FWD) 5’-GGAGGTGAACCTGACTTCCA-3’, Stat1 (REV) 5’- TCTGGTGCTTCCTTTGGTCT-3’, Stat4 (FWD) 5’-TCTGCTCAAAGATAAAATGCCTG-3’, Stat4 (REV) 5’-TCCATTTTCAGATTGGTCCAC-3’, Tbx21 (FWD) 5’-GCCAAAGGATTCCGGGAGAA-3’, Tbx21 (REV) 5’-GGTAGAAACGGCTGGGAACA-3’, Actb (FWD) 5’-GAACCCTAAGGCCAACCG-3’ and Actb (REV) 5’-CACGCACGATTTCCCTCT-3’. Ifnar1 (FWD) 5’-AGAGGTAGTCTCCAGCTCCG, Ifnar1 (REV) 5’-CGCCTCGTCTTTTGTTCGAT-3’, Leprb (FWD) 5’-ACAATTGTAAGAGAGGCTGCTGA-3’, Leprb (REV) 5’-ACAATTGTAAGAGAGGCTGCTGA-3’.
Microarray
Naïve CD4+ T cells (CD4+ CD44ow-int) were magnetically isolated by negative selection from spleens and lymph nodes and either immediately frozen or stimulated with 2 μg/ml plate-bound anti-CD3 and anti-CD28 antibodies for 16 h as described above. Total RNA was isolated using the RNEAsy kit (Qiagen). Total RNA quality was verified using the RNA 6000 Pico LabChip on a 2100 BioAnalyzer (Agilent). Ten ng of total RNA was reverse transcribed using GeneChip WT Pico Kit (Affymetrix). Each sample was hybridized to a GeneChip Mouse Gene 2.0 ST array (Affymetrix) for 16-18 h at 45 °C. The arrays were scanned using a GeneChip Scanner 3000 (Affymetrix).
Data were analyzed using GeneSpring software (Version 12.1, Agilent) and was summarized using the ExonRMA16 algorithm followed by quantile normalization. A one-way ANOVA with post-hoc test (Tukey HSD test) and Benjamini-Hochberg FDR (false discovery rate) correction was used to identify differentially expressed genes (p ≤ 0.05). The enrichment of functional categories was tested using Database for Annotation, Visualization and Integrated Discovery (DAVID) Functional Annotation tool v6.8. For this analysis, lists of positively or negatively regulated genes (fold change of 1.5 cut-off for stimulated CD4+ T cells) were exported for use in DAVID. Each of these lists was analyzed against the background entities represented on the array. Gene ontology (GO) terms were compared using Benjamini-Hochberg FDR (false discovery rate) corrected p-values. The lists of differentially expressed genes were also compared against a published list of Th lineage genes27 and were used to query the IMMGEN dataset of IFN-stimulated genes in CD4+ T cells in the microarray browser to determine if they were inducible by type I, type II, or both type I and type II IFNs (http://immgen.org/Skyline_microarray/skyline.html).
Fecal DNA extraction
Fecal pellets from mice were collected and immediately flash frozen in liquid nitrogen. DNA was then extracted using DNeasy PowerSoil Pro kit (Qiagen) following the manufacturer’s instructions. Purity and quality of the DNA was assessed by NanoDrop (Thermo Scientific).
16S rRNA gene sequencing
The V4 hypervariable region of the 16S rRNA gene was amplified using uniquely barcoded 515F (forward) and 806R (reverse) sequencing primers to allow for multiplexing79. Amplification reactions were performed in a 25 μl reaction using 12.5 μL KAPA2G Robust HotStart ReadyMix (KAPA Biosystems), 1.5 μL each 10 μM forward and reverse primers, 7.5 μL of sterile water and 2 μL of DNA. The V4 region was amplified by cycling the reaction at 95°C for 3 minutes, 18 x cycles of 95°C for 15 seconds, 50°C for 15 seconds and 72°C for 15 seconds, followed by a 5-minute 72°C extension. Amplification reactions were done in duplicate to reduce amplification bias, were pooled, and amplicon lengths verified on 1% agarose TBE gels. Pooled duplicates were quantified using PicoGreen and combined by even concentrations. The library was then purified using Ampure XP beads and loaded on to the Illumina MiSeq for sequencing, according to manufacturer instructions (Illumina). Sequencing was performed using the V2 (150bp x 2) chemistry. A single-species (Pseudomonas aeruginosa DNA), a mock community (Zymo Microbial Community DNA Standard D6305), and a template-free negative control were included in the sequencing run. Sequencing was conducted at the Centre for the Analysis of Genome Evolution and Function (CAGEF) at the University of Toronto.
Analysis of the bacterial microbiome
The Qiime2 analysis package version 2023.2 was used for sequence analysis80. The quality of the sequencing run was first examined using FastQC. Cut adapt was used, following the default settings, to remove sequences with high error rates. Paired-end sequences were assembled, and quality trimmed using vsearch –fastq_mergepairs. The resulting high-quality data was then processed following the deblur pipeline. Sequences were clustered into Amplicon Sequence Variants (ASV) groups and singleton sequences were removed. Taxonomy assignment was executed using the Qiime2 classify-hybrid-vsearch-sklearn function and the Average ReadyToWear trained Silva database version 138.1. ASVs with an abundance less than 0.01% are removed to reduce the potential for observing bleed-through ASVs, and ASVs identified as contaminating chloroplast or mitochondria are removed. A phylogenetic tree was created using the SEPP function available through Qiime2.
Serum cytokine and chemokine measurements
Serum cytokine and chemokine levels were measured using a Mouse Adiponectin ELISA kit (Invitrogen), VeriKine-HS Mouse IFN-α All Subtype ELISA and Mouse IFN-β kit (PBL Assay Science), Mouse Adipokine magnetic bead panel (Millipore), and Mouse FlowCytomix assays (eBioscience, Invitrogen), following the manufacturer’s protocols.
Statistical analysis
With the exception of microarray and microbiome analysis, data were analyzed with GraphPad Prism (v5). Data is represented as mean ± S.E.M, except where noted. Statistical significance was set at p ≤ 0.05. A two-way ANOVA was performed followed by a Bonferroni post-hoc test to examine diet by sex interactions, surgery by diet interactions, or diet by genotype interactions. Sample sizes ranged between N=3-8/group for most studies, a sample size where homogeneity of variance tests have low power. Thus for greater than 2 sample comparisons, a one-way ANOVA with Tukey post-hoc test was used when group variances appeared to be similar, whereas a Kruskal-Wallis test (> 3 groups) and a non-parametric post-hoc test were used when group variances appeared to be non-homogeneous. Unpaired two-tail Mann-Whitney U tests were used for two group comparisons with the exception of when sample sizes were two small (N=3/group) for this test to be valid. In this case, an unpaired two-tail T-test was used. Linear correlation was determined using non-parametric Spearman’s test.
Supplementary Material
Supplemental Table 2: Differential protein expression between participants who were obese versus non-obese in the different cohorts (female RRMS, male RRMS, female controls, male controls). (Related to Figure 1)
Shown are the proteins that were differently abundant between obese and non-obese participants in female RRMS (orange), male RRMS (yellow), female control (green), and male control (blue) groups. Shown is the logFC value, the p value (unadjusted) after T-tests (two-tailed) and the adjusted p value after adjusting for multiple comparisons using the Bonferroni and Hochberg method (R v4.2.3). Results on the left are of the entire cohort and the results on the right are of the participants who self-identified as White. The right-most column indicates whether the difference between obese and non-obese was lost significance when focusing on only the White individuals. In addition, other colors denote what proteins loaded on the significant pathways that were identified to be upregulated in the female RRMS patients with obesity by Ingenuity Pathway analysis (dark green=S100 pathway, light green=cytokine storm pathway, red=Th1 pathway, brown=Th17 pathway, pink=IL-6 pathway, light blue=DC maturation pathway, grey=MS pathway) (also see Supplementary Table 3). This table shows that there was common upregulation of pathways with obesity in females with RRMS and female controls. The identity of the proteins that loaded onto these pathways in RRMS females were in partial overlap with the proteins that loaded on these pathways in control females.
Supplemental Table 3: Ingenuity Canonical Pathways (Related to Figure 1)
Shown are the significant pathways that were upregulated with obesity showing the negative log10-p value, the ratio (number of differentially abundant molecules that participate in a pathway, and then dividing it by the total number of molecules in that pathway), the z-score, and the names of molecules that mapped to the pathways. Pathways with negative log10-p value greater that 1.3 were considered significant.
Supplemental Table 4: Genes Upregulated with HFD in freshly isolated or TCR/CD28 stimulated naïve Cd4+ T cells (Related to Figure 6)
Shown is the probe ID on the microarray the gene symbol associated with the probe, the corrected p value after and the fold-change value of HFD over NCD value. Blue designates the genes that were found to be upregulated with DIO in the quiescent naïve CD4+ T cells and gold indicates genes that were upregulated with DIO in the naïve unstimulated CD4+ T cells. Differential expression between unstimulated and stimulated HFD and NCD groups was analyzed using a one-way ANOVA with post-hoc test (Tukey HSD test) followed by Benjamini-Hochberg FDR (false discovery rate) correction. Corrected p value of 0.05 was considered significant.
Supplemental Table 5: GO pathways upregulated with DIO in female T cells (Related to Figure 6)
Genes that were upregulated with HFD (DIO) in CD4+ T cells after anti-CD3/anti-CD28 stimulation (fold change of 1.5 cut-off for stimulated CD4+ T cells) were entered into the Database for Annotation, Visualization and Integrated Discovery (DAVID) Functional Annotation tool v6.8. Each of these lists was analyzed against the background entities represented on the array. Gene ontology (GO) terms were compared using Benjamini-Hochberg FDR (false discovery rate) to determine corrected p-values.
Highlights.
In women, obesity induces a pro-inflammatory Th1 serum protein signature
In female mice, obesity promotes Th1 inflammation and worsens CNS autoimmunity in EAE
Obesity increases serum IFN-α level and IFN-γ/STAT1 signaling in female CD4+ T cells
Obesity exacerbates EAE in females through Type I IFN signaling in T cells
Acknowledgements
We thank Danila Leontyev for help with cytokine profiling of mouse serum, Paulina C. Drohomyrecky and Fei Linda Zhao for help with tissue processing, Alexander Luchak and Ken Croitoru for help with extraction of DNA from mouse stool, and Helena Lei for assistance with metabolic assays. This work was supported by a Canadian Institutes of Health Research grant (to S.E.D. and D.A.W.), an MS Canada biomedical discovery grant (to S.E.D.), and National Institutes of Health grants R01Al137047 and R01EY027346 (to R.C.A.). B.C. is supported by a post-doctoral fellowship and J.J.A. by PhD studentship from MS Canada. N.A.S. is supported by a Keenan post-doctoral fellowship. The graphical abstract was created with BioRender.com.
Footnotes
Publisher's Disclaimer: This is a PDF file of an unedited manuscript that has been accepted for publication. As a service to our customers we are providing this early version of the manuscript. The manuscript will undergo copyediting, typesetting, and review of the resulting proof before it is published in its final form. Please note that during the production process errors may be discovered which could affect the content, and all legal disclaimers that apply to the journal pertain.
Declaration of Interests
J.J.A. is currently an employee of Bristol Myers Squibb.
References
- 1.Reich DS, Lucchinetti CF, and Calabresi PA (2018). Multiple Sclerosis. N. Engl. J. Med 378, 169–180. 10.1056/NEJMra1401483. [DOI] [PMC free article] [PubMed] [Google Scholar]
- 2.Dendrou CA, Fugger L, and Friese MA (2015). Immunopathology of multiple sclerosis. Nat. Rev. Immunol 15, 545–558. 10.1038/nri3871. [DOI] [PubMed] [Google Scholar]
- 3.Rasouli J, Ciric B, Imitola J, Gonnella P, Hwang D, Mahajan K, Mari ER, Safavi F, Leist TP, Zhang GX, and Rostami A (2015). Expression of GM-CSF in T Cells is increased in multiple sclerosis and suppressed by IFN-beta therapy. J. Immunol 194, 5085–5093. 10.4049/jimmunol.1403243. [DOI] [PMC free article] [PubMed] [Google Scholar]
- 4.McGinley MP, Goldschmidt CH, and Rae-Grant AD (2021). Diagnosis and treatment of multiple sclerosis: A review. JAMA 325, 765–779. 10.1001/jama.2020.26858. [DOI] [PubMed] [Google Scholar]
- 5.Rangachari M, and Kuchroo VK (2013). Using EAE to better understand principles of immune function and autoimmune pathology. J. Autoimmun 45, 31–39. S0896-8411(13)00082-6 [pii] 10.1016/j.jaut.2013.06.008. [DOI] [PMC free article] [PubMed] [Google Scholar]
- 6.Krishnarajah S, and Becher B (2022). T(H) cells and cytokines in encephalitogenic disorders. Front. Immunol 13, 822919. 10.3389/fimmu.2022.822919. [DOI] [PMC free article] [PubMed] [Google Scholar]
- 7.Hirota K, Duarte JH, Veldhoen M, Hornsby E, Li Y, Cua DJ, Ahlfors H, Wilhelm C, Tolaini M, Menzel U, et al. Fate mapping of IL-17-producing T cells in inflammatory responses. Nat. Immunol 12, 255–263. ni.1993 [pii] 10.1038/ni.1993. [DOI] [PMC free article] [PubMed] [Google Scholar]
- 8.Duhen R, Glatigny S, Arbelaez CA, Blair TC, Oukka M, and Bettelli E (2013). Cutting edge: the pathogenicity of IFN-gamma-producing Th17 cells is independent of T-bet. J. Immunol 190, 4478–4482. jimmunol.1203172 [pii] 10.4049/jimmunol.1203172. [DOI] [PMC free article] [PubMed] [Google Scholar]
- 9.Alfredsson L, and Olsson T (2019). Lifestyle and environmental factors in multiple sclerosis. Cold Spring Harb. Perspect. Med 9. 10.1101/cshperspect.a028944. [DOI] [PMC free article] [PubMed] [Google Scholar]
- 10.Alvarez-Sanchez N, and Dunn SE (2023). Immune cell contributors to the female sex bias in multiple sclerosis and experimental autoimmune encephalomyelitis. Curr. Top. Behav. Neurosci 62, 333–373. 10.1007/7854_2022_324. [DOI] [PubMed] [Google Scholar]
- 11.Koch-Henriksen N, and Sorensen PS (2010). The changing demographic pattern of multiple sclerosis epidemiology. Lancet Neurol. 9, 520–532. S1474-4422(10)70064-8 [pii] 10.1016/S1474-4422(10)70064-8. [DOI] [PubMed] [Google Scholar]
- 12.Orton SM, Herrera BM, Yee IM, Valdar W, Ramagopalan SV, Sadovnick AD, and Ebers GC (2006). Sex ratio of multiple sclerosis in Canada: a longitudinal study. Lancet Neurol. 5, 932–936. S1474-4422(06)70581-6 [pii] 10.1016/S1474-4422(06)70581-6. [DOI] [PubMed] [Google Scholar]
- 13.Versini M, Jeandel PY, Rosenthal E, and Shoenfeld Y (2014). Obesity in autoimmune diseases: not a passive bystander. Autoimmun. Rev 13, 981–1000. 10.1016/j.autrev.2014.07.001. [DOI] [PubMed] [Google Scholar]
- 14.Hedstrom AK, Lima Bomfim I, Barcellos L, Gianfrancesco M, Schaefer C, Kockum I, Olsson T, and Alfredsson L (2014). Interaction between adolescent obesity and HLA risk genes in the etiology of multiple sclerosis. Neurology 82, 865–872. WNL.0000000000000203 [pii] 10.1212/WNL.0000000000000203. [DOI] [PMC free article] [PubMed] [Google Scholar]
- 15.Daniel H, Gholami AM, Berry D, Desmarchelier C, Hahne H, Loh G, Mondot S, Lepage P, Rothballer M, Walker A, et al. (2014). High-fat diet alters gut microbiota physiology in mice. The ISME Journal 8, 295–308. 10.1038/ismej.2013.155. [DOI] [PMC free article] [PubMed] [Google Scholar]
- 16.Shahi SK, Ghimire S, Lehman P, and Mangalam AK (2022). Obesity induced gut dysbiosis contributes to disease severity in an animal model of multiple sclerosis. Front. Immunol 13. 10.3389/fimmu.2022.966417. [DOI] [PMC free article] [PubMed] [Google Scholar]
- 17.West DB, Boozer CN, Moody DL, and Atkinson RL (1992). Dietary obesity in nine inbred mouse strains. Am. J. Physiol 262, R1025–1032. 10.1152/ajpregu.1992.262.6.R1025. [DOI] [PubMed] [Google Scholar]
- 18.Chadt A, Leicht K, Deshmukh A, Jiang LQ, Scherneck S, Bernhardt U, Dreja T, Vogel H, Schmolz K, Kluge R, et al. (2008). Tbc1d1 mutation in lean mouse strain confers leanness and protects from diet-induced obesity. Nat. Genet 40, 1354–1359. 10.1038/ng.244. [DOI] [PubMed] [Google Scholar]
- 19.Parra-Vargas M, Ramon-Krauel M, Lerin C, and Jimenez-Chillaron JC (2020). Size does matter: Litter size strongly determines adult metabolism in rodents. Cell Metab. 32, 334–340. 10.1016/j.cmet.2020.07.014. [DOI] [PubMed] [Google Scholar]
- 20.Schulz EG, Mariani L, Radbruch A, and Hofer T (2009). Sequential polarization and imprinting of type 1 T helper lymphocytes by interferon-gamma and interleukin-12. Immunity 30, 673–683. 10.1016/j.immuni.2009.03.013. [DOI] [PubMed] [Google Scholar]
- 21.Afkarian M, Sedy JR, Yang J, Jacobson NG, Cereb N, Yang SY, Murphy TL, and Murphy KM (2002). T-bet is a STAT1-induced regulator of IL-12R expression in naive CD4+ T cells. Nat. Immunol 3, 549–557. 10.1038/ni794. [DOI] [PubMed] [Google Scholar]
- 22.Rogers NH, Perfield JW 2nd, Strissel KJ, Obin MS, and Greenberg AS (2009). Reduced energy expenditure and increased inflammation are early events in the development of ovariectomy-induced obesity. Endocrinology 150, 2161–2168. en.2008-1405 [pii] 10.1210/en.2008-1405. [DOI] [PMC free article] [PubMed] [Google Scholar]
- 23.Matarese G. (2023). The link between obesity and autoimmunity. Science 379, 1298–1300. 10.1126/science.ade0113. [DOI] [PubMed] [Google Scholar]
- 24.Nyirenda MH, Fadda G, Healy LM, Mexhitaj I, Poliquin-Lasnier L, Hanwell H, Saveriano AW, Rozenberg A, Li R, Moore CS, et al. (2021). Pro-inflammatory adiponectin in pediatric-onset multiple sclerosis. Mult. Scler 1352458521989090. 10.1177/1352458521989090. [DOI] [PubMed] [Google Scholar]
- 25.Marrodan M, Farez MF, Balbuena Aguirre ME, and Correale J (2021). Obesity and the risk of multiple sclerosis. The role of leptin. Ann. Clin. Transl. Neurol 8, 406–424. 10.1002/acn3.51291. [DOI] [PMC free article] [PubMed] [Google Scholar]
- 26.Matarese G, Sanna V, Di Giacomo A, Lord GM, Howard JK, Bloom SR, Lechler RI, Fontana S, and Zappacosta S (2001). Leptin potentiates experimental autoimmune encephalomyelitis in SJL female mice and confers susceptibility to males. Eur. J. Immunol 31, 1324–1332. 10.1002/1521-4141(200105)31:5<1324::Aid-immu1324>3.0.Co;2-y. [DOI] [PubMed] [Google Scholar]
- 27.Wei G, Abraham BJ, Yagi R, Jothi R, Cui K, Sharma S, Narlikar L, Northrup DL, Tang Q, Paul WE, et al. (2011). Genome-wide analyses of transcription factor GATA3-mediated gene regulation in distinct T cell types. Immunity 35, 299–311. 10.1016/j.immuni.2011.08.007. [DOI] [PMC free article] [PubMed] [Google Scholar]
- 28.Hoshino K, Tsutsui H, Kawai T, Takeda K, Nakanishi K, Takeda Y, and Akira S (1999). Cutting edge: generation of IL-18 receptor-deficient mice: evidence for IL-1 receptor-related protein as an essential IL-18 binding receptor. J. Immunol 162, 5041–5044. [PubMed] [Google Scholar]
- 29.Takeda K, Tsutsui H, Yoshimoto T, Adachi O, Yoshida N, Kishimoto T, Okamura H, Nakanishi K, and Akira S (1998). Defective NK cell activity and Th1 response in IL-18–deficient mice. Immunity 8, 383–390. [DOI] [PubMed] [Google Scholar]
- 30.Lee LF, Axtell R, Tu GH, Logronio K, Dilley J, Yu J, Rickert M, Han B, Evering W, Walker MG, et al. (2011). IL-7 promotes T(H)1 development and serum IL-7 predicts clinical response to interferon-β in multiple sclerosis. Sci. Transl. Med 3, 93ra68. 10.1126/scitranslmed.3002400. [DOI] [PMC free article] [PubMed] [Google Scholar]
- 31.Mostafavi S, Yoshida H, Moodley D, LeBoite H, Rothamel K, Raj T, Ye CJ, Chevrier N, Zhang SY, Feng T, et al. (2016). Parsing the interferon transcriptional network and its disease associations. Cell 164, 564–578. 10.1016/j.cell.2015.12.032. [DOI] [PMC free article] [PubMed] [Google Scholar]
- 32.Miller FW (2023). The increasing prevalence of autoimmunity and autoimmune diseases: an urgent call to action for improved understanding, diagnosis, treatment, and prevention. Curr. Opin. Immunol 80, 102266. 10.1016/j.coi.2022.102266. [DOI] [PMC free article] [PubMed] [Google Scholar]
- 33.Rasul T, and Frederiksen JL (2018). Link between overweight/obese in children and youngsters and occurrence of multiple sclerosis. J. Neurol 265, 2755–2763. 10.1007/s00415-018-8869-9. [DOI] [PubMed] [Google Scholar]
- 34.Gough DJ, Messina NL, Hii L, Gould JA, Sabapathy K, Robertson AP, Trapani JA, Levy DE, Hertzog PJ, Clarke CJ, and Johnstone RW (2010). Functional crosstalk between type I and II interferon through the regulated expression of STAT1. PLoS Biol. 8, e1000361. 10.1371/journal.pbio.1000361. [DOI] [PMC free article] [PubMed] [Google Scholar]
- 35.Brinkmann V, Geiger T, Alkan S, and Heusser CH (1993). Interferon alpha increases the frequency of interferon gamma-producing human CD4+ T cells. J. Exp. Med 178, 1655–1663. 10.1084/jem.178.5.1655. [DOI] [PMC free article] [PubMed] [Google Scholar]
- 36.Sareneva T, Matikainen S, Kurimoto M, and Julkunen I (1998). Influenza A virus-induced IFN-alpha/beta and IL-18 synergistically enhance IFN-gamma gene expression in human T cells. J. Immunol 160, 6032–6038. [PubMed] [Google Scholar]
- 37.Sareneva T, Julkunen I, and Matikainen S (2000). IFN-alpha and IL-12 induce IL-18 receptor gene expression in human NK and T cells. J. Immunol 165, 1933–1938. 10.4049/jimmunol.165.4.1933. [DOI] [PubMed] [Google Scholar]
- 38.Cho SS, Bacon CM, Sudarshan C, Rees RC, Finbloom D, Pine R, and O’Shea JJ (1996). Activation of STAT4 by IL-12 and IFN-alpha: evidence for the involvement of ligand-induced tyrosine and serine phosphorylation. J. Immunol 157, 4781–4789. [PubMed] [Google Scholar]
- 39.Nguyen KB, Watford WT, Salomon R, Hofmann SR, Pien GC, Morinobu A, Gadina M, O’Shea JJ, and Biron CA (2002). Critical role for STAT4 activation by type 1 interferons in the interferon-gamma response to viral infection. Science 297, 2063–2066. 10.1126/science.1074900. [DOI] [PubMed] [Google Scholar]
- 40.Athie-Morales V, Smits HH, Cantrell DA, and Hilkens CM (2004). Sustained IL-12 signaling is required for Th1 development. J. Immunol 172, 61–69. 10.4049/jimmunol.172.1.61. [DOI] [PubMed] [Google Scholar]
- 41.Berenson LS, Farrar JD, Murphy TL, and Murphy KM (2004). Frontline: absence of functional STAT4 activation despite detectable tyrosine phosphorylation induced by murine IFN-alpha. Eur. J. Immunol 34, 2365–2374. 10.1002/eji.200324829. [DOI] [PubMed] [Google Scholar]
- 42.Ramos HJ, Davis AM, George TC, and Farrar JD (2007). IFN-alpha is not sufficient to drive Th1 development due to lack of stable T-bet expression. J. Immunol, 179, 3792–3803. 10.4049/jimmunol.179.6.3792. [DOI] [PMC free article] [PubMed] [Google Scholar]
- 43.Gough DJ, Messina NL, Clarke CJ, Johnstone RW, and Levy DE (2012). Constitutive type I interferon modulates homeostatic balance through tonic signaling. Immunity 36, 166–174. 10.1016/j.immuni.2012.01.011. [DOI] [PMC free article] [PubMed] [Google Scholar]
- 44.Dunn SE, Perry WA, and Klein SL (2023). Mechanisms and consequences of sex differences in immune responses. Nat. Rev. Nephrol 10.1038/s41581-023-00787-w. [DOI] [PubMed] [Google Scholar]
- 45.Gal-Oz ST, Maier B, Yoshida H, Seddu K, Elbaz N, Czysz C, Zuk O, Stranger BE, Ner-Gaon H, and Shay T (2019). ImmGen report: sexual dimorphism in the immune system transcriptome. Nat. Commun 10, 4295. 10.1038/s41467-019-12348-6. [DOI] [PMC free article] [PubMed] [Google Scholar]
- 46.Schmiedel BJ, Singh D, Madrigal A, Valdovino-Gonzalez AG, White BM, Zapardiel-Gonzalo J, Ha B, Altay G, Greenbaum JA, McVicker G, et al. (2018). Impact of genetic polymorphisms on human immune cell gene expression. Cell 175, 1701–1715 e1716. 10.1016/j.cell.2O18.10.022. [DOI] [PMC free article] [PubMed] [Google Scholar]
- 47.Zhang MA, Ahn JJ, Zhao FL, Selvanantham T, Mallevaey T, Stock N, Correa L, Clark R, Spaner D, and Dunn SE (2015). Antagonizing peroxisome proliferator-activated receptor alpha (PPARalpha) activity enhances Th1 immunity in male mice. J. Immunol 95, 5189–5120. 10.4049/jimmunol.1500449. [DOI] [PubMed] [Google Scholar]
- 48.Dunn SE, Ousman SS, Sobel RA, Zuniga L, Baranzini SE, Youssef S, Crowell A, Loh J, Oksenberg J, and Steinman L (2007). Peroxisome proliferator-activated receptor (PPAR)alpha expression in T cells mediates gender differences in development of T cell-mediated autoimmunity. J. Exp. Med 204, 321–330. jem.20061839 [pii] 10.1084/jem.20061839. [DOI] [PMC free article] [PubMed] [Google Scholar]
- 49.Seillet C, Laffont S, Tremollieres F, Rouquie N, Ribot C, Arnal JF, Douin-Echinard V, Gourdy P, and Guery JC (2012). The TLR-mediated response of plasmacytoid dendritic cells is positively regulated by estradiol in vivo through cell-intrinsic estrogen receptor alpha signaling. Blood 119, 454–464. blood-2011-08-371831 [pii] 10.1182/blood-2011-08-371831. [DOI] [PubMed] [Google Scholar]
- 50.Fox HS, Bond BL, and Parslow TG (1991). Estrogen regulates the IFN-gamma promoter. J. Exp. Med 146, 4362–4367. [PubMed] [Google Scholar]
- 51.Bao M, Yang Y, Jun HS, and Yoon JW (2002). Molecular mechanisms for gender differences in susceptibility to T cell-mediated autoimmune diabetes in nonobese diabetic mice. J. Immunol 168, 5369–5375. [DOI] [PubMed] [Google Scholar]
- 52.Crow MK, Olferiev M, and Kirou KA (2019). Type I interferons in autoimmune disease. Annu. Rev. Pathol 14, 369–393. 10.1146/annurev-pathol-020117-043952. [DOI] [PubMed] [Google Scholar]
- 53.Liu Z, Bethunaickan R, Huang W, Lodhi U, Solano I, Madaio MP, and Davidson A (2011). Interferon-alpha accelerates murine systemic lupus erythematosus in a T cell-dependent manner. Arthritis Rheum. 63, 219–229. 10.1002/art.30087. [DOI] [PMC free article] [PubMed] [Google Scholar]
- 54.Scott O, Visuvanathan S, Reddy E, Mahamed D, Gu B, Roifman CM, Cohn RD, Guidos CJ, and Ivakine EA (2023). The human Stat1 gain-of-function T385M mutation causes expansion of activated T-follicular helper/T-helper 1-like CD4 T cells and sex-biased autoimmunity in specific pathogen-free mice. Front. Immunol 14, 1183273. 10.3389/fimmu.2023.1183273. [DOI] [PMC free article] [PubMed] [Google Scholar]
- 55.Ferreira RC, Guo H, Coulson RM, Smyth DJ, Pekalski ML, Burren OS, Cutler AJ, Doecke JD, Flint S, McKinney EF, et al. (2014). A type I interferon transcriptional signature precedes autoimmunity in children genetically at risk for type 1 diabetes. Diabetes 63, 2538–2550. 10.2337/db13-1777. [DOI] [PMC free article] [PubMed] [Google Scholar]
- 56.Bae HR, Leung PS, Tsuneyama K, Valencia JC, Hodge DL, Kim S, Back T, Karwan M, Merchant AS, Baba N, et al. (2016). Chronic expression of interferon-gamma leads to murine autoimmune cholangitis with a female predominance. Hepatology 64, 1189–1201. 10.1002/hep.28641. [DOI] [PMC free article] [PubMed] [Google Scholar]
- 57.Bae HR, Hodge DL, Yang GX, Leung PSC, Chodisetti SB, Valencia JC, Sanford M, Fenimore JM, Rahman ZSM, Tsuneyama K, et al. (2018). The interplay of type I and type II interferons in murine autoimmune cholangitis as a basis for sex-biased autoimmunity. Hepatology 67, 1408–1419. 10.1002/hep.29524. [DOI] [PMC free article] [PubMed] [Google Scholar]
- 58.Canto E, Isobe N, Didonna A, Group M-ES, Hauser SL, and Oksenberg JR (2018). Aberrant STAT phosphorylation signaling in peripheral blood mononuclear cells from multiple sclerosis patients. J. Neuroinflammation 15, 72. 10.1186/s12974-018-1105-9. [DOI] [PMC free article] [PubMed] [Google Scholar]
- 59.Hegen H, Adrianto I, Lessard CJ, Millonig A, Bertolotto A, Comabella M, Giovannoni G, Guger M, Hoelzl M, Khalil M, et al. (2016). Cytokine profiles show heterogeneity of interferon-beta response in multiple sclerosis patients. Neurol. Neuroimmunol. Neuroinflamm 3, e202. 10.1212/NXI.0000000000000202. [DOI] [PMC free article] [PubMed] [Google Scholar]
- 60.Nishimoto S, Fukuda D, Higashikuni Y, Tanaka K, Hirata Y, Murata C, Kim-Kaneyama JR, Sato F, Bando M, Yagi S, et al. (2016). Obesity-induced DNA released from adipocytes stimulates chronic adipose tissue inflammation and insulin resistance. Sci. Adv 2, e1501332. 10.1126/sciadv.1501332. [DOI] [PMC free article] [PubMed] [Google Scholar]
- 61.Revelo XS, Ghazarian M, Chng MH, Luck H, Kim JH, Zeng K, Shi SY, Tsai S, Lei H, Kenkel J, et al. (2016). Nucleic acid-targeting pathways promote inflammation in obesity-related insulin resistance. Cell Rep. 16, 717–730. 10.1016/j.celrep.2016.06.024. [DOI] [PMC free article] [PubMed] [Google Scholar]
- 62.Havenar-Daughton C, Kolumam GA, and Murali-Krishna K (2006). Cutting Edge: The direct action of type I IFN on CD4 T cells is critical for sustaining clonal expansion in response to a viral but not a bacterial infection. J. Immunol 176, 3315–3319. 10.4049/jimmunol.176.6.3315. [DOI] [PubMed] [Google Scholar]
- 63.Lee PW, Smith AJ, Yang Y, Selhorst AJ, Liu Y, Racke MK, and Lovett-Racke AE (2017). IL-23R-activated STAT3/STAT4 is essential for Th1/Th17-mediated CNS autoimmunity. JCI Insight 2, e91663. 10.1172/jci.insight.91663. [DOI] [PMC free article] [PubMed] [Google Scholar]
- 64.Buzzelli AA, McWilliams IL, Shin B, Bryars MT, and Harrington LE (2023). Intrinsic STAT4 expression controls effector CD4 T cell migration and Th17 pathogenicity. J. Immunol 210, 1667–1676. 10.4049/jimmunol.2200606. [DOI] [PMC free article] [PubMed] [Google Scholar]
- 65.Yang Y, Weiner J, Liu Y, Smith AJ, Huss DJ, Winger R, Peng H, Cravens PD, Racke MK, and Lovett-Racke AE (2009). T-bet is essential for encephalitogenicity of both Th1 and Th17 cells. J. Exp. Med 206, 1549–1564. jem.20082584 [pii] 10.1084/jem.20082584. [DOI] [PMC free article] [PubMed] [Google Scholar]
- 66.Papenfuss TL, Rogers CJ, Gienapp I, Yurrita M, McClain M, Damico N, Valo J, Song F, and Whitacre CC (2004). Sex differences in experimental autoimmune encephalomyelitis in multiple murine strains. J. Neuroimmunol 150, 59–69. 10.1016/j.jneuroim.2004.01.018 S0165572804000414 [pii]. [DOI] [PubMed] [Google Scholar]
- 67.International Multiple Sclerosis Genetics, C. (2019). Multiple sclerosis genomic map implicates peripheral immune cells and microglia in susceptibility. Science 365, eaav7188. 10.1126/science.aav7188. [DOI] [PMC free article] [PubMed] [Google Scholar]
- 68.Inzaugarat ME, Billordo LA, Vodanovich F, Cervini GM, Casavalle PL, Vedire C, and Chernavsky AC (2013). Alterations in innate and adaptive immune leukocytes are involved in paediatric obesity. Pediatr. Obes 9, 381–390. 10.1111/j.2047-6310.2013.00179.x. [DOI] [PubMed] [Google Scholar]
- 69.Pacifico L, Di Renzo L, Anania C, Osborn JF, Ippoliti F, Schiavo E, and Chiesa C (2006). Increased T-helper interferon-gamma-secreting cells in obese children. Eur. J. Endocrinol 154, 691–697. 10.1530/eje.1.02138. [DOI] [PubMed] [Google Scholar]
- 70.Rastogi D, Canfield SM, Andrade A, Isasi CR, Hall CB, Rubinstein A, and Arens R (2012). Obesity-associated asthma in children: a distinct entity. Chest 141, 895–905. 10.1378/chest.11-0930. [DOI] [PubMed] [Google Scholar]
- 71.Polman CH, Reingold SC, Banwell B, Clanet M, Cohen JA, Filippi M, Fujihara K, Havrdova E, Hutchinson M, Kappos L, et al. (2011). Diagnostic criteria for multiple sclerosis: 2010 revisions to the McDonald criteria. Ann. Neurol 69, 292–302. 10.1002/ana.22366. [DOI] [PMC free article] [PubMed] [Google Scholar]
- 72.Thompson AJ, Banwell BL, Barkhof F, Carroll WM, Coetzee T, Comi G, Correale J, Fazekas F, Filippi M, Freedman MS, et al. (2018). Diagnosis of multiple sclerosis: 2017 revisions of the McDonald criteria. Lancet Neurol. 17, 162–173. 10.1016/S1474-4422(17)30470-2. [DOI] [PubMed] [Google Scholar]
- 73.Zhang DJ, Wang Q, Wei J, Baimukanova G, Buchholz F, Stewart AF, Mao X, and Killeen N (2005). Selective expression of the Cre recombinase in late-stage thymocytes using the distal promoter of the Lck gene. J. Immunol 174, 6725–6731. 174/11/6725 [pii]. [DOI] [PubMed] [Google Scholar]
- 74.Drohomyrecky PC, Doroshenko ER, Akkermann R, Moshkova M, Yi TJ, Zhao FL, Ahn JJ, McGaha TL, Pahan K, and Dunn SE (2019). Peroxisome proliferator-activated receptor-δ acts within peripheral myeloid cells to limit Th cell priming during experimental autoimmune encephalomyelitis. J. Immunol 203, 2588–2601. 10.4049/jimmunol.1801200. [DOI] [PubMed] [Google Scholar]
- 75.Cahill LS, Zhang MA, Ramaglia V, Whetstone H, Pahlevan Sabbaugh, Yi TJ, Woo L, Przbycien T, Moshkova M, Zhao FL, Rojas O, Gomes J, Kuerten S, Gommerman JL, Sled JG, and Dunn SE (2019). Aged hind-limb clasping experimental autoimmune encephalomyelitis models aspects of the neurodegenerative process seen in multiple sclerosis. Proc. Natl. Acad. Sci. U S A 116, 22710–22720. 10.1073/pnas.1915141116. [DOI] [PMC free article] [PubMed] [Google Scholar]
- 76.Ucciferri CC, Gower A, Alvarez-Sanchez N, Whetstone H, Ramaglia V, Gommerman JL, Brand-Arzamendi K, Schneider R, and Dunn SE (2024). Scoring central nervous system inflammation, eemyelination, and axon injury in experimental autoimmune encephalomyelitis. J Vis Exp. 10.3791/65738. [DOI] [PubMed] [Google Scholar]
- 77.Dunn SE, Bhat R, Straus DS, Sobel RA, Axtell R, Johnson A, Nguyen K, Mukundan L, Moshkova M, Dugas JC, et al. (2010). Peroxisome proliferator-activated receptor delta limits the expansion of pathogenic Th cells during central nervous system autoimmunity. J. Exp. Med 207, 1599–1608. jem.20091663 [pii] 10.1084/jem.20091663. [DOI] [PMC free article] [PubMed] [Google Scholar]
- 78.Doroshenko ER, Drohomyrecky PC, Gower A, Whetstone H, Cahill LS, Ganguly M, Spring S, Yi TJ, Sled JG, and Dunn SE (2021). Peroxisome Proliferator-activated receptor-delta deficiency in microglia results in exacerbated axonal injury and tissue loss in experimental autoimmune encephalomyelitis. Front. Immunol 12, 570425. 10.3389/fimmu.2021.570425. [DOI] [PMC free article] [PubMed] [Google Scholar]
- 79.Caporaso JG, Lauber CL, Walters WA, Berg-Lyons D, Huntley J, Fierer N, Owens SM, Betley J, Fraser L, Bauer M, et al. (2012). Ultra-high-throughput microbial community analysis on the Illumina HiSeq and MiSeq platforms. The ISME Journal 6, 1621–1624. 10.1038/ismej.2012.8. [DOI] [PMC free article] [PubMed] [Google Scholar]
- 80.Bolyen E, Rideout JR, Dillon MR, Bokulich NA, Abnet CC, Al-Ghalith GA, Alexander H, Aim EJ, Arumugam M, Asnicar F, et al. (2019). Reproducible, interactive, scalable and extensible microbiome data science using QIIME 2. Nature Biotechnology 37, 852–857. 10.1038/s41587-019-0209-9. [DOI] [PMC free article] [PubMed] [Google Scholar]
Associated Data
This section collects any data citations, data availability statements, or supplementary materials included in this article.
Supplementary Materials
Supplemental Table 2: Differential protein expression between participants who were obese versus non-obese in the different cohorts (female RRMS, male RRMS, female controls, male controls). (Related to Figure 1)
Shown are the proteins that were differently abundant between obese and non-obese participants in female RRMS (orange), male RRMS (yellow), female control (green), and male control (blue) groups. Shown is the logFC value, the p value (unadjusted) after T-tests (two-tailed) and the adjusted p value after adjusting for multiple comparisons using the Bonferroni and Hochberg method (R v4.2.3). Results on the left are of the entire cohort and the results on the right are of the participants who self-identified as White. The right-most column indicates whether the difference between obese and non-obese was lost significance when focusing on only the White individuals. In addition, other colors denote what proteins loaded on the significant pathways that were identified to be upregulated in the female RRMS patients with obesity by Ingenuity Pathway analysis (dark green=S100 pathway, light green=cytokine storm pathway, red=Th1 pathway, brown=Th17 pathway, pink=IL-6 pathway, light blue=DC maturation pathway, grey=MS pathway) (also see Supplementary Table 3). This table shows that there was common upregulation of pathways with obesity in females with RRMS and female controls. The identity of the proteins that loaded onto these pathways in RRMS females were in partial overlap with the proteins that loaded on these pathways in control females.
Supplemental Table 3: Ingenuity Canonical Pathways (Related to Figure 1)
Shown are the significant pathways that were upregulated with obesity showing the negative log10-p value, the ratio (number of differentially abundant molecules that participate in a pathway, and then dividing it by the total number of molecules in that pathway), the z-score, and the names of molecules that mapped to the pathways. Pathways with negative log10-p value greater that 1.3 were considered significant.
Supplemental Table 4: Genes Upregulated with HFD in freshly isolated or TCR/CD28 stimulated naïve Cd4+ T cells (Related to Figure 6)
Shown is the probe ID on the microarray the gene symbol associated with the probe, the corrected p value after and the fold-change value of HFD over NCD value. Blue designates the genes that were found to be upregulated with DIO in the quiescent naïve CD4+ T cells and gold indicates genes that were upregulated with DIO in the naïve unstimulated CD4+ T cells. Differential expression between unstimulated and stimulated HFD and NCD groups was analyzed using a one-way ANOVA with post-hoc test (Tukey HSD test) followed by Benjamini-Hochberg FDR (false discovery rate) correction. Corrected p value of 0.05 was considered significant.
Supplemental Table 5: GO pathways upregulated with DIO in female T cells (Related to Figure 6)
Genes that were upregulated with HFD (DIO) in CD4+ T cells after anti-CD3/anti-CD28 stimulation (fold change of 1.5 cut-off for stimulated CD4+ T cells) were entered into the Database for Annotation, Visualization and Integrated Discovery (DAVID) Functional Annotation tool v6.8. Each of these lists was analyzed against the background entities represented on the array. Gene ontology (GO) terms were compared using Benjamini-Hochberg FDR (false discovery rate) to determine corrected p-values.
Data Availability Statement
Raw and processed microarray data have been deposited in Geo (accession number GSE241044). OLINK data was deposited in Mendeley Data (https://doi.org/10.17632/44khystv6t.1).
This paper does not report original code.
Data S1 contains the raw data values that were used to create all graphs in the paper. Additional information about research reagents is available in the Key resource Table.
Key Resource Table
| REAGENT or RESOURCE | SOURCE | IDENTIFIER |
|---|---|---|
| Antibodies | ||
| CD16/CD32 (93) | Biolegend | Biolegend Cat# 101301, RRID:AB_312800 |
| APC-CD3 (145-2C11) | Biolegend | Biolegend: Cat# 100312, RRID:AB_312677 |
| FITC-CD3 (145-2C11) | Biolegend | Biolegend: Cat# 100306, RRID:AB_312671 |
| FITC-CD4 (GK1.5) | Biolegend | Biolegend: Cat# 100406, RRID:AB_312690 |
| PE-Cy7-CD4 (RM4-5) | Biolegend | Biolegend: Cat# 100528, RRID:AB_312729 |
| PE-Cy5-CD8 (53-6.7) | Biolegend | Biolegend Cat# 100710, RRID:AB_312749 |
| PE-CD11b (M1/70) | Biolegend | Biolegend Cat# 101208, RRID:AB_312791 |
| APC-CD11b (M1/70) | Biolegend | Biolegend Cat# 101212, RRID:AB_312795 |
| APC-CD11c (HL3) | BD | BD Cat# 550261, RRID:AB_398460 |
| BV421-CD19 (B4) | BD | BD Cat# 562441, RRID:AB_11154587 |
| PE-CD25 (PC61.5) | Biolegend | BioLegend Cat# 102007, RRID:AB_312856 |
| APC-CD25 (PC61.5) | Biolegend | BioLegend Cat# 102011, RRID:AB_312860 |
| FITC-CD44 (IM7) | Biolegend | BioLegend Cat# 103022, RRID:AB_493685 |
| PE-CD44 (IM7) | Biolegend | BioLegend Cat# 103024, RRID:AB_493687 |
| PE-Cy5-CD44 (IM7) | Biolegend | BioLegend Cat# 103009, RRID:AB_312960 |
| PE-Cy7-CD44 (IM7) | Biolegend | BioLegend Cat# 103029, RRID:AB_830786 |
| Alexa fluor700-CD44 (IM7) | BD | BD Biosciences Cat# 560567, RRID:AB_1727480 |
| PE-Cy7 CD45 (30-F11) | Biolegend | BioLegend Cat# 103114, RRID:AB_312979 |
| PE-CD45.1 (A20) | Biolegend | BD Biosciences Cat# 561872, RRID:AB_10897174 |
| PE-Cy7 CD45.1 (A20) | Biolegend | BioLegend Cat# 110730 (also 110729), RRID:AB_1134168 |
| FITC-CD45.2 (104) | Biolegend | BioLegend Cat# 109805, RRID:AB_313442 |
| PE-IFNAR1 (MAR1-5A3) | Thermofisher | Thermo Fisher Scientific Cat# 12-5945-82, RRID:AB_2572646 |
| PE-IFNGR1 (GIR-208) | Thermofisher | Thermo Fisher Scientific Cat# 12-1199-42, RRID:AB_11150056 |
| eFluor450-IL-18Ra (P3TUNYA) | Thermofisher | Thermo Fisher Scientific Cat# 48-5183-82, RRID:AB_2574069 |
| FITC-Ly6G (1A8) | Biolegend | BioLegend Cat# 127605 (also 127606), RRID:AB_1236488 |
| PE-Vβ11 TCR (RR3-15) | Thermofisher | Thermo Fisher Scientific Cat# 12-5827-82, RRID:AB_2762684 |
| SB600-NK1.1 (PK136) | Thermofisher | Thermo Fisher Scientific Cat# 63-5941-82, RRID:AB_2637451 |
| PE-FOXP3 (FJK-16s) | Thermofisher | Thermo Fisher Scientific Cat# 12-5773-82, RRID:AB_465936 |
| Alexa488-FOXP3 (MF-14) | Biolegend | BioLegend Cat# 126406, RRID:AB_1089113 |
| FITC-GM-CSF (MP1-22E9) | Biolegend | BioLegend Cat# 505404, RRID:AB_315380 |
| PE-IFN-γ (XMG1.2) | Biolegend | BioLegend Cat# 505807, RRID:AB_315401 |
| APC-IFN-γ (XMG1.2) | Biolegend | BioLegend Cat# 505810, RRID:AB_315404 |
| APC-IL-17A (eBio17B7) | Thermofisher | Thermo Fisher Scientific Cat# 17-7177-81, RRID:AB_763580 |
| PE-IL-17A (eBio17B7) | Thermofisher | Thermo Fisher Scientific Cat# 12-7177-81, RRID:AB_763582 |
| APC-MOG38-49 variant S45D tetramer | NIH Tetramer Core Facility | N/A |
| APC-human CLIP87-101 I-Ab tetramer | NIH Tetramer Core Facility | N/A |
| anti-Stat1 pY701-Alex Fluor 647 (4a) | BD | BD Biosciences Cat# 612597, RRID:AB_399880 |
| Anti-Total STAT1 Alex Fluor 647 (1/Stat1) | BD | BD Biosciences Cat# 558560, RRID:AB_647143 |
| IL-7Rα PE-Cy7 (A7R34) | Biolegend | Biolegend Cat# 135013, RRID:AB_1937265 |
| CD4-APC-eF780 (GK1.5) | Thermofisher | Thermo Fisher Scientific Cat# 47-0041-82, RRID:AB_11218896 |
| CD8-FITC (53-6.7) | Biolegend | BioLegend Cat# 100705 (also 100706), RRID:AB_312744 |
| Vβ11-PE (RR3-15) | Biolegend | BioLegend Cat# 139003, RRID:AB_10613472 |
| CD28 Monoclonal Antibody (CD28.2) | Thermofisher | Thermo Fisher Scientific Cat# 16-0289-81, RRID:AB_468926 |
| CD3 Monoclonal Antibody (OKT3) | Thermofisher | Thermo Fisher Scientific Cat# 16-0037-81, RRID:AB_468854 |
| Biotin-IFNAR (MAR1-5A3) | Biolegend | BioLegend Cat# 127306, RRID:AB_ 1134249 |
| Biological samples | ||
| Human serum (O-link analysis) | Arthritis and Clinical Immunology Research Program, Oklahoma Medical Research Foundation | IRB# 16-05 |
| Peripheral blood mononuclear cells | University Health Network Stanford University | REB 09-0577-AE IRB# 97959 |
| Diets, chemicals, peptides, and recombinant proteins | ||
| High-fat diet (60% kcal of fat) | Research Diets | Research Diets Cat#: D12492i |
| Normal Chow Diet | Inotiv | # 7912 |
| MOG35-55 peptide MEVGWYRSPFSRVVHLYRNGK | Genemed Synthesis | Genemed Synthesis Cat#: MOG3555-P2-5 |
| PLP139-151 peptide HSLGKWLGHPDKF | Genemed Synthesis | Genemed Synthesis Cat#: SP-86876-5 |
| heat-killed Mycobacterium tuberculosis H37Ra | Difco Laboratories | Difco Laboratories Cat#: DF3114-33-8 |
| Bordetella pertussis toxin | List Biologicals | List Biologicals Cat#: 181 |
| luxol fast blue | Sigma | Sigma Cat#:L0294 |
| collagenase IV | Sigma | Sigma Cat#:C5138-500MG |
| Collagenase D | Roche | Roche Cat#: 11088866001 |
| DNAse I | Sigma | Sigma Cat#:11284932001 |
| Percoll | Fisher Scientific | Fisher Scientific Cat#: 45-001-747 |
| FBS | Corning | Corning Cat#: 35-077-CV |
| EDTA | Bioshop | Bioshop Cat#:EDT111.500 |
| HBSS | Thermo FisherScientific | Thermo FisherScientific Cat#: 14025092 |
| Foxp3/Transcription Factor Staining Buffer Set | Thermo FisherScientific | Thermo FisherScientific Cat#: 00-5523-00 |
| Fixable Viability Dye eFluor 506 | Thermo FisherScientific | Thermo FisherScientific Cat#: 65-0866-18 |
| phorbol 12-myristate 13-acetate (PMA) | Thermo FisherScientific | Thermo FisherScientific Cat#: J63916MCR |
| Ionomycin, Calcium Salt | Thermo FisherScientific | Thermo FisherScientific Cat#: I24222 |
| OneComp eBeads Compensation Beads | Thermo FisherScientific | Thermo FisherScientific Cat#: 01-1111-42 |
| [3H]-thymidine | Perkin Elmer | Perkin Elmer Cat#: NET027A001MC |
| RNAlater | Thermo FisherScientific | Thermo FisherScientific Cat#: AM7024 |
| GolgiPlug | BD | BD Cat#: 555029 |
| GolgiStop | BD | BD Cat#: 554724 |
| L-glutamine | BioShop | Wisent Cat#: GLU999 |
| Penicillin/Streptomycin | BioShop | BioShop Cat#: PST999.100 |
| Sodium Pyruvate | Thermo FisherScientific | Thermo FisherScientific Cat#: 11360-070 |
| MEM NEAA | Thermo FisherScientific | Thermo FisherScientific Cat#: 11140-050 |
| RPMI 1640 | Corning | Corning Cat#:10-041-CV |
| Critical commercial assays | ||
| Olink Explore 1536 | Olink Proteomics | OLink Proteomics Cat#: 1536 |
| RNeasy Mini Kit | QIAGEN | QIAGEN Cat#: 74104 |
| EasySep™ Mouse CD4+ T Cell Isolation Kit | Stemcell | Stemcell Cat#: 19852 |
| EasySep™ Mouse Naïve CD4+ T Cell Isolation Kit | Stemcell | Stemcell Cat#: 19765 |
| MagniSort™ Mouse CD11c Positive Selection Kit | Thermofisher | Thermofisher Cat#: 8802-6861-74 |
| SuperScript III reverse transcriptase | Thermofisher | Thermofisher Cat#: 18080093 |
| Universal SYBR Green Master Mix | Thermofisher | Thermofisher Cat#: 4309155 |
| GeneChip Mouse Gene 2.0 ST array | Thermofisher (Affymetrix) | Thermofisher Cat#: 902500 |
| DNeasy PowerSoil Pro kit | QIAGEN | QIAGEN Cat#: 47014 |
| VeriKine-HS Mouse IFN-α All Subtype ELISA kit | PBL Assay Science | PBL Assay Science Cat #:42115 |
| VeriKine-HS Mouse IFN-β All Subtype ELISA kit | PBL Assay Science | PBL Assay Science Cat #: 42410-1 |
| Mouse Adipokine magnetic bead panel | Millipore | Millipore Cat#: MADKMAG-71K RRID:AB_2801416 |
| DAPI | Biolegend | Biolegend Cat#: 422801 |
| Soluble anti-CD3e | Invitrogen | Invitrogen Cat#: 145-2C11 |
| BD perm wash | BD | BD Cat#: 554723 |
| X-Vivo 15 Serum Free Medium with Gentamicin and Phenol Red | Lonza | Lonza Cat#: 04-418Q |
| Dynabeads™ Human T-Activator CD3/CD28 for T Cell Expansion and Activation | Gibco | Gibco Cat#: 11131D RRID:AB_2916088 |
| mouse recombinant IL-12p70 | Biolegend | Biolegend Cat#: 577004 |
| mouse recombinant IFNγ | Biolegend | Biolegend Cat#: 575304 |
| Human IL-17A ELISA Ready-set-go | Invitrogen | Invitrogen Cat# : 5017243 |
| Human IFN-γ ELISA Ready-set-go | Invitrogen | Invitrogen Cat# : 5017325 |
| Human IL-2 ELISA Ready-set-go | Invitrogen | Invitrogen Cat# : 14-7029-68 |
| Mouse IL-17A ELISA MAX | Biolegend | Biolegend Cat# : 79108 |
| Mouse IFN-γ ELISA OptEIA | BD | BD Cat# : 51-26121E |
| Mouse IL-2 ELISA | Invitrogen | Invitrogen Cat# : 14-7022-85 |
| Mouse Flow Cytomix assays | Biolegend | Biolegend Cat# : BMS822FF |
| Deposited data | ||
| Raw and processed microarray data | Geo | GSE241044 |
| Olink data | Mendeley Data | https://doi.org/10.17632/44khystv6t.1 |
| Experimental models: Organisms/strains | ||
| C57BL/6J (#664) | The Jackson Laboratory | The Jackson Laboratory Cat#: RRID:IMSR_JAX:000664 |
| SJL/J (#686) | The Jackson Laboratory | The Jackson Laboratory Cat#: RRID:IMSR_JAX:000686 |
| C57BL/6-Tg (Tcra2D2,Tcrb2D2)1Kuch/J (#6912) | The Jackson Laboratory | The Jackson Laboratory Cat#: RRID:IMSR_JAX:006912 |
| B6.129S2-Cd4tm1Mak/J (CD4 KO) (#2663) | The Jackson Laboratory | The Jackson Laboratory Cat#: RRID:IMSR_JAX:002663 |
| B6.BKS(D)-Leprdb/(#697) | The Jackson Laboratory | The Jackson Laboratory Cat#: RRID:IMSR_JAX:000697 |
| B6.Cg-Tg(Lck-icre) 3779Nik/J (#12837) | The Jackson Laboratory | The Jackson Laboratory Cat#: RRID:MGI:4442208 |
| B6.129P2-Leprtm1Rck/J (#8327) | The Jackson Laboratory | The Jackson Laboratory Cat#: RRID:IMSR_JAX:008327 |
| B6(Cg)-Ifnar1tm1.1Ees/J (#28256) | The Jackson Laboratory | The Jackson Laboratory Cat#: RRID:IMSR_JAX:028256 |
| Oligonucleotides | ||
| Ifng (FWD) 5’ – TGGCTCTGCAGGATTTTCATG-3’ | IDT | N/A |
| Ifng (REV) 5’-TCAAGTGGCATAGATGTGGAAGAA-3’ | IDT | N/A |
| Stat1 (FWD) 5’-GGAGGTGAACCTGACTTCCA-3’ | IDT | N/A |
| Stat1 (REV) 5’-TCTGGTGCTTCCTTTGGTCT-3’ | IDT | N/A |
| Stat4 (FWD) 5’-TCTGCTCAAAGATAAAATGCCTG-3’ | IDT | N/A |
| Stat4 (REV) 5’-TCCATTTTCAGATTGGTCCAC-3’ | IDT | N/A |
| Tbx21 (FWD) 5’-GCCAAAGGATTCCGGGAGAA-3’ | IDT | N/A |
| Tbx21 (REV) 5’-GGTAGAAACGGCTGGGAACA-3’ | IDT | N/A |
| Actb (FWD) 5’-GAACCCTAAGGCCAACCG-3’ | IDT | N/A |
| Actb (REV) 5’-CACGCACGATTTCCCTCT-3’. | IDT | N/A |
| Ifnar1 (FWD) 5’-AGAGGTAGTCTCCAGCTCCG-3’ | IDT | N/A |
| Ifnar1 (REV) 5’-CGCCTCGTCTTTTGTTCGAT-3’ | IDT | N/A |
| Leprb (FWD) 5’-ACAATTGTAAGAGAGGCTGCTGA-3’ | IDT | N/A |
| Leprb (REV) 5’-ACAATTGTAAGAGAGGCTGCTGA-3’ | IDT | N/A |
| Software and algorithms | ||
| GraphPad Prism v9.5.0 | GraphPad | RRID:SCR_002798 |
| R v4.2.3 | R | RRID:SCR_001905 |
| Ingenuity Pathway Analysis (IPA) | QIAGEN | RRID:SCR_008653 |
| FlowJo v10.8.1 | TreeStar | RRID:SCR_008520 |
| ImageJ | NIH | RRID:SCR_003070 |
| GeneSpring software v12.1 | Agilent | RRID:SCR_010972 |
| DAVID Functional Annotation tool v6.8 | NIH | RRID:SCR_001881 |
| Qiime2 analysis package v2023.2 | Qiime2 | RRID:SCR_021258 |