Abstract
We employed a straightforward microwave-assisted extraction technique to investigate the presence of carbon dots (CDs) in Chinese herbal extracts derived from fructus gardeniae and gardenia charcoal, designated as CDs-1 and CDs-2, respectively. The found CDs exhibited unique photoluminescence with quantum yields of 0.95% for CDs-1 and 1.81% for CDs-2, indicating significant potential for bioimaging applications. Both CD types maintain approximately 80% of their fluorescence intensity after 120 min of continuous 365 nm UV exposure, underscoring their stability and suitability for prolonged biological studies. Moreover, antioxidant activity tests showed that CDs-2 have a higher scavenging capacity, with an SC-50 value of 21.7 μg/mL, compared to 35.9 μg/mL for CDs-1, attributed to their higher content of surface functional groups during the extraction procedure. Notably, the results indicated that the carbonization process of fructus gardeniae leads to the formation of CDs, suggesting a potential link between traditional herbal treatments and modern nanotechnology. This research demonstrates that active compounds in Chinese herbal medicine could possess therapeutic properties when adsorbed on the surface of CDs.
Keywords: Antioxidant activity, Bioimaging, Carbon dots, Gardenia, Microwave-assisted extraction
1. Introduction
Gardenia, the mature and dried fruit of the Rubiaceae plant Gardenia jasminoides Ellis, is recognized for its medicinal properties extending to its roots [1–3]. The fruits are harvested between September and November when they ripen to a red and yellow hue. Following harvest, the fruits are cleansed of stems and impurities, then briefly steamed or blanched, and finally dried. The roots are collected in summer and autumn and subsequently washed and air-dried. The efficacy of gardenia extends to treating a range of conditions. As a product, it is effective against fever, restlessness, insomnia, jaundice, gonorrhea, thirst, red eyes, sore throats, hematemesis (vomiting blood), nosebleeds, bloody dysentery, hematuria, heat-related ulcers, sprains, as well as swelling and pain [4–6].
Gardenia charcoal is prepared by crushing the fructus gardeniae and stir-frying them between 160 °C and 200 °C in a pot until they become dark black [7]. Once done, they are removed from the heat and allowed to cool. Its primary functions are to clear heat, purge fire, and cool the blood, making it suitable for treating fever, dysphoria, insomnia, jaundice, gonorrhea, thirst, red eyes, sore throat, hematemesis, nosebleeds, bloody dysentery, hematuria, heat sores, sprains, swelling, and pain [8–10]. Since their discovery in 2004, carbon dots (CDs) have gained widespread attention in medicine and biology, mainly due to their unique photoluminescence characteristics [11–14]. These nanoparticles exhibit bright fluorescence and exceptional optical stability when exposed to light. Such features facilitate a red shift in their emission spectrum and enhance fluorescence intensity, making CDs invaluable for biomedical testing and anti-counterfeiting.
This study explored whether the stir-frying (charcoal frying) process of fructus gardeniae facilitates the formation of CDs and assessed how the characteristics of these CDs compare to those produced by traditional synthesis methods. This investigation sought to integrate traditional herbal practices with modern nanotechnology, potentially opening new therapeutic avenues for CDs. We utilized a straightforward microwave-assisted extraction technique to derive extracts from fructus gardeniae and gardenia charcoal, subsequently identifying CDs designated as CDs-1 and CDs-2, respectively. This research aimed to validate the formation of CDs through a conventional Chinese herbal pre-treatment method, specifically the stir-frying process. We analyzed CDs sourced from fructus gardeniae and gardenia charcoal to delineate their properties and explore their potential applications in biological imaging and antioxidation fields.
2. Materials and methods
2.1. Chemicals
All chemical reagents used in this study were acquired from Sigma–Aldrich, based in Milwaukee, WI, USA. The experiments utilized ultrapure water with a resistivity of 18.2 MΩ cm, obtained from a Milli-Q ultrapure water system. The fructus gardeniae employed in the research were kindly provided by Dr. Chiu-Lan Hsieh from the National Changhua University of Education, Changhua, Taiwan. The gardenia charcoal was purchased from the local Chinese herbal medicine store in Changhua, Taiwan.
2.2. Characterization
The UV-visible spectra of the extracts were recorded using an Evolution 200 UV-Vis spectrophotometer from Thermo Fisher Scientific, NY, USA. X-ray diffraction (XRD) patterns were obtained with a Shimadzu LabX XRD-6000 X-ray diffractometer, utilizing Cu Kα radiation (λ = 0.15418 nm), based in Kyoto, Japan. The Fourier transform-infrared (FT-IR) spectra were acquired at room temperature using an Agilent Cary 600 FT-IR spectrometer from Agilent Technologies, California, USA. The morphology and microstructure of the CDs were examined using a JEOL-1200EX II transmission electron microscope (TEM) operating at a 200 kV accelerating voltage, made by JEOL, Tokyo, Japan. Photoluminescence (PL) spectra were collected with a Synergy H1 Hybrid Multi-Mode Microplate Reader from BioTek Instruments, Inc., Winooski, VT, USA. The surface composition of the CDs was analyzed using X-ray photoelectron spectroscopy (XPS) on a VG ESCA210 electron spectroscopy instrument from VG Scientific, West Sussex, UK. Time-resolved fluorescence spectra of the CDs were measured using a HORIBA MIRA time-correlated single photon counting spectrometer located in Nuneaton, Warwickshire, UK. Additionally, bacterial imaging was conducted with a Carl Zeiss 510 LSM laser scanning confocal microscope.
2.3. Microwave-assisted extraction of CDs
The extraction of CDs-1 begins by weighing 500 mg of finely ground fructus gardeniae (Zhi-zi), transferring them into a 100 mL sampling bottle, and then adding 50 mL of DMSO solvent. The mixture is then stirred using an electromagnetic heating stirrer set at 500 RPM and heated to 80 °C, which is maintained for 30 min. Subsequently, this heated mixture is transferred to a clean Erlenmeyer flask and microwaved at 70 W for 5 min. After microwaving, the mixture is cooled in a water bath and filtered through a 0.22 μm syringe filter. The filtered solution is freeze-dried to obtain a solid form and then stored in a moisture-proof container.
The extraction of CDs-2 starts with measuring 50 mg of finely ground gardenia charcoal (black Zhizi), placing it into a 100 mL sampling bottle, and adding 50 mL of DMSO solvent. Like CDs-1, this mixture is stirred at 500 RPM using an electromagnetic heating stirrer and heated to 80 °C for 30 min. The mixture is then poured into a fresh Erlenmeyer flask and microwaved for 5 min at 70 W. Following microwaving, it is cooled in a water bath, filtered through a 0.22 μm syringe filter, and the resultant solution is freeze-dried into a solid. Finally, the CDs-2 is stored in a moisture-proof container to ensure stability and quality.
2.4. Bacterial culture, survival rate, and imaging
The procedures of bacterial culture, survival rate, and imaging were followed according to our previous study [15]. A single colony of bacterial (Escherichia coli strain BRBC 12438 and Staphylococcus aureus (wild )) was meticulously picked from solid agar plates and inoculated into 1.0 mL of Luria Bertani (LB) broth. This bacterial culture was incubated at 37 °C with constant agitation at 200 rpm until it achieved an optical density (OD) of 1.0 at 600 nm, measured with an optical path length of 1.0 cm. Following incubation, the culture was centrifuged at 3000×g for 10 min at 25 °C. The collected bacterial pellets were washed thrice with phosphate-buffered saline (PBS).
To evaluate the antibacterial efficacy of the CDs against bacterial (E. coli strain BRBC 12438 and S. aureus (wild )), each bacterial suspension with 5.0 × 10³ colony-forming units (CFU) per milliliter was uniformly applied to solidified LB agar plates. Then, six paper disks were arranged on the agar surface. Various concentrations of the CDs, ranging from 0 to 400 μg/mL, were applied to these disks. As a positive control, a disk impregnated with 400 μg/mL of benzoic acid (BA) was used. After 24 h of incubation, the diameters of the inhibition zones around each disk were measured to compare the antibacterial activities across the different treatment groups [15].
To prepare bacterial-CD conjugates, bacterial cells were first treated with a 70% (v/v) ethanol solution to enhance CD internalization [15,16]. This treatment was performed at 4 °C for 5 min, aiming to permeabilize the cells without causing significant damage. After ethanol treatment, the cells were stained by resuspending them in 100 mM PBS containing 25.6 mg/mL of CDs, with the staining process lasting 10 min at room temperature. Following staining, the bacterial-CD conjugates were washed thoroughly with three successive rinses in ultrapure water to remove unbound CDs. For fluorescence analysis, 20 mL of the final conjugate suspension was placed onto a glass slide. Fluorescence microscopy images were then acquired using laser excitation wavelengths of 365, 475, and 532 nm to evaluate the distribution and localization of the CDs within the bacterial cells.
2.5. Determination of antioxidant ability
The procedure of the antioxidant ability test was followed according to our previous study with slight modifications [15]. In separate test tubes, 1 mL of each CD aqueous solution or gardenia precursor, with concentrations ranging from 0 to 800 μg/mL, was mixed with 1 mL of a 0.1 mM DPPH (2,2-diphenyl-1-picrylhydrazyl) solution. The mixtures in each tube were thoroughly agitated to ensure complete interaction between the CDs or gardenia precursor and DPPH for 20 min. Following this incubation period, the absorbance of each solution was measured at 525 nm using an Evolution 200 UV-V is spectrophotometer. The procedure was conducted in triplicate to ensure accuracy, using sodium ascorbate (10 μg/mL) as a standard. The antioxidant ability of the samples was determined by applying the following equation (Equation (1)):
| (1) |
where A0 and A are the absorbances of the DPPH solution without and with samples, respectively. B is the absorbance of the DPPH solution with sodium ascorbate.
3. Results and discussion
3.1. Optical properties of the extract from Chinese herbal
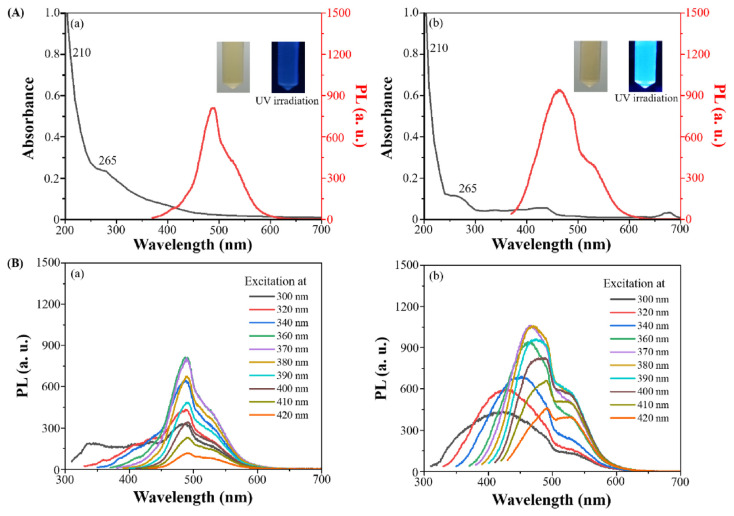
The UV-visible absorption spectra of both extracts demonstrate distinctive features, with the peak at 210 nm attributed to n→ρ* transitions of C = O bonds or ρ→ρ* transitions of N = O bonds. Another peak observed at 265 nm attributed to ρ→ρ* transitions of sp2 hybridized groups (C = C bonds), as depicted in Fig. 1A. The absorption characteristic peak signals observed are analogous to those typically found in traditional CDs [12,17]. When excited at a wavelength of 365 nm, the PL spectra of these extracts are presented in Fig. 1A. Experimental findings indicate that extract from gardenia charcoal displays a stronger fluorescence intensity than that from fructus gardeniae. This increased fluorescence is hypothesized to arise from the pretreatment of fructus gardeniae, which involves stir-frying at temperatures between 160 °C and 200 °C. This process likely leads to the forming of a greater quantity of fluorescent substances, thereby enhancing the fluorescence observed post microwave-assisted extraction.
Fig. 1.
(A) UV-Vis and PL spectra and (B) excitation-dependent emissions spectra of extract from (a) fructus gardeniae and (b) gardenia charcoal.
Subsequently, the excitation-dependent emissions spectra of both extracts, as shown in Fig. 1B, demonstrate that the emission spectra of both extracts vary with different excitation wavelengths, a phenomenon known as the red shift. Both extracts exhibit wavelength dependence of emission, analogous to the excitation wavelength dependence observed in traditional CDs [12,17]. Fig. 1B(a) shows that the red shift for the extract from fructus gardeniae is not pronounced; however, the extract from gardenia charcoal exhibits a noticeable red shift as shown in Fig. 1B(b). This may be attributed to the quantum size effect [18,19]. The stir-frying process of fructus gardeniae results in a broad size distribution of the extracted fluorescent particles. At the nanoscale, particles of different sizes possess distinct optical properties. The red shift in the fluorescence emission spectra arises when these particles of various sizes are excited at different wavelengths, potentially related to the composition of surface functional groups [20]. In contrast, the extract from fructus gardeniae, having been found through a straightforward microwave-assisted extraction process, results in fewer particles with a less varied size distribution. Consequently, we have verified the presence of CDs in the extracts derived from fructus gardeniae and gardenia charcoal, designated as CDs-1 and CDs-2, respectively.
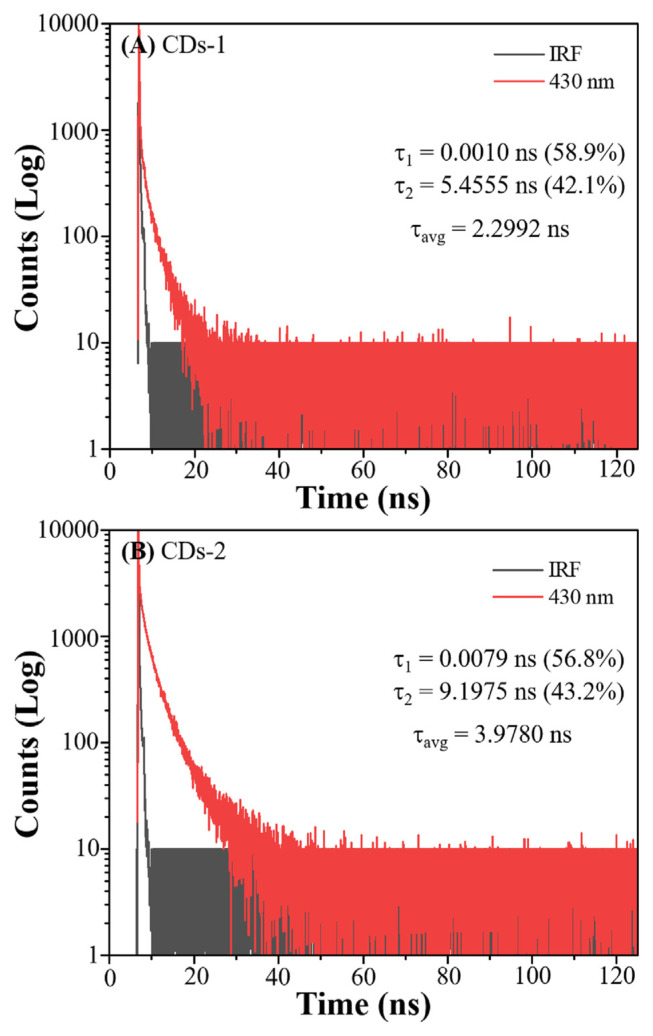
In the determination of the fluorescence quantum yields (QYs), quinine sulfate was utilized as a reference substance, known for its established QY of 54%. The QYs obtained from this experiment were 0.95% for CDs-1 and 1.81% for CDs-2, indicating a notable disparity in QYs between the two types of CDs extracted under similar conditions. The observed disparity in QY between the two types of CDs may be attributed to the differing pretreatment procedures. CDs-1, extracted solely through microwave heating of fructus gardeniae, exhibited a lower QY. In contrast, CDs-2 demonstrated a higher QY, potentially due to the stir-frying process of fructus gardeniae during an initial high-temperature carbonization treatment. Consequently, the enhanced QY of CDs-2 could be associated with the carbon formation process inherent to their synthesis. The fluorescence lifetimes of different CDs are illustrated in Fig. 2A. It is observed that CDs-2 possesses the longest fluorescence lifetime (τavg: 3.9780 ns, inset in Fig. 2B), followed by CDs-1 (τavg: 2.2992 ns, inset in Fig. 2A). This phenomenon is likely associated with their respective fluorescence QYs. Particles with higher QYs tend to have longer fluorescence lifetimes. In addition, PL decay curves for CDs-1 and CDs-2 exhibited multi-exponential behaviour, indicating the coexistence of different fluorescence mechanisms [15]. Due to the percentage of τ1 higher than that of τ2, we considered that CDs-1 and CDs-2 exhibited a fast radiative recombination of excited electron-hole pairs. This is often associated with quantum confinement effects or efficient surface passivation that minimizes non-radiative recombination pathways [15]. Thus, the fluorescence mechanism of CDs-1 and CDs-2 may involve mainly radiative recombination.
Fig. 2.
The decay curves of (A) CDs-1 and (B) CDs-2 in water collected at 430 nm when excited at 375 nm.
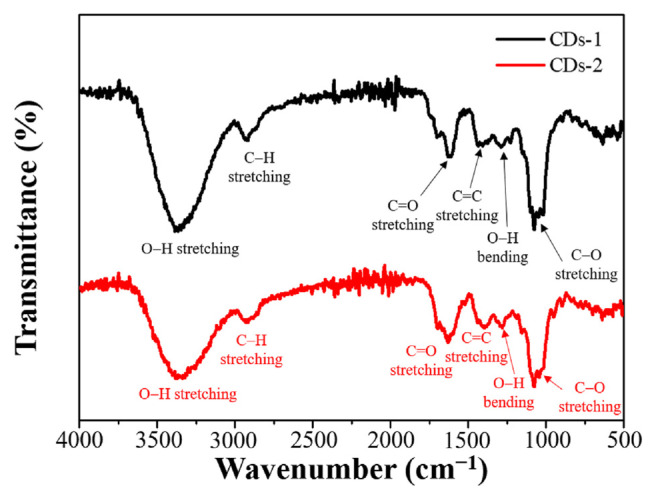
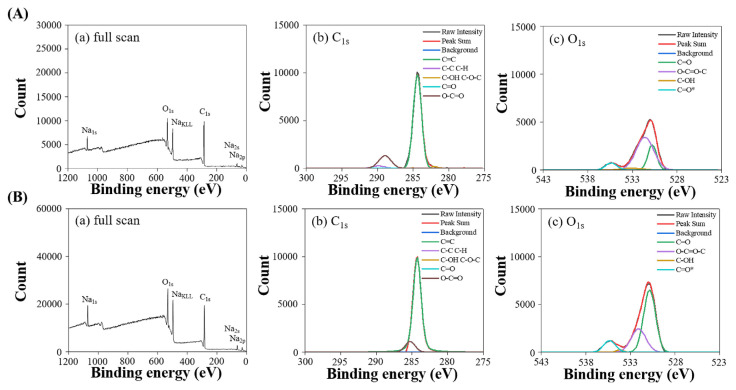
FT-IR and XPS analyses were conducted to identify the surface functional groups and elemental oxidation states of the extracted CDs, with the results presented in Figs. 3 and 4, respectively. As indicated in Fig. 3, CDs-1 and CDs-2 exhibit distinct spectral features indicative of their chemical composition. Notably, the presence of C–O stretching vibrations corresponding to ether or ester groups is observed near 1020 cm−1, while O–H bending vibrations associated with acidic, ester, or phenolic structures are identified in the range of 1310–1410 cm−1. Additionally, C = C stretching vibrations characteristic of ketones or alkenes are noted near 1595 cm−1, alongside C = O stretching vibrations of ketones near 1635 cm−1. C–H stretching vibrations of alkanes are discernible near 2910 cm−1, and O–H stretching vibrations are detected in the range of 3200–3700 cm−1. These spectral features collectively affirm the presence of abundant antioxidant functional groups within the CDs. These specific functional groups may be active ingredients that are co-extracted with the CDs during microwave extraction and subsequently adsorbed on the surface of the CDs. Fig. 4 displays the XPS spectra used to analyze the elemental composition and oxidation states. CDs-1 and CDs-2 show a predominance of carbon elements. Table 1 shows that CDs-1 and CDs-2 have the C–OH functional groups, which may enhance their ability to donate H atoms. Furthermore, CDs-2, which exhibit a higher fluorescence QY, display a more significant proportion of O–(C = O*)–C and *O–(C = O) functional groups. This increased presence of oxygen-containing groups could facilitate electron transitions, potentially leading to higher fluorescence QY.
Fig. 3.
FT-IR spectra of CDs-1 and CDs-2.
Fig. 4.
XPS spectra of (A) CDs-1 and (B) CDs-2: (a) full scan, high-resolution scan of (b) C1s, and (c) O1s region.
Table 1.
Chemical environments and peak ratios of C1s and O1s for the prepared CDs.
| Chemical environment and peak ratios | Functional group | Binding energy (eV) | CDs-1 | CDs-2 |
|---|---|---|---|---|
| C1S | C=C | 284.5 | 74.2% | 73.2% |
| C–C, C–H | 285.0 | 3.2% | 2.8% | |
| C–OH, C–O–C | 286.5 | 1.3% | 1.0% | |
| C=O | 288.0 | 2.0% | 2.1% | |
| O–C=O | 289.0 | 19.3% | 20.9% | |
| O1s | C=O | 531.0 | 64.1% | 59.6% |
| O-(C=O*)-C | 531.6 | 23.3% | 27.7% | |
| C–OH | 533.6 | 3.9% | 1.4% | |
| *O-(C=O) | 534.8 | 8.7% | 11.2% |
Note: The asterisk (*) symbol next to the atom denotes its known binding energy value from literature data.
3.2. Morphology of CDs
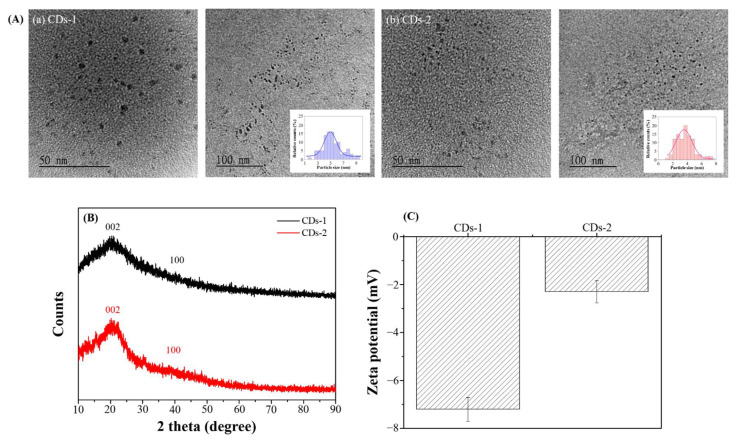
Fig. 5A and its inset present the TEM images and particle size distribution of the produced CDs. Statistical analysis of the particle size distribution reveals that the average diameter of CDs-2 is 3.73 ± 2.33 nm. In comparison, that of CDs-1 is 5.31 ± 4.21 nm, indicative of a significant variance in size, likely due to the use of fructus gardeniae as carbon sources, which results in a broader range of particle sizes. Compared to previous studies employing pyrolysis to prepare CDs [15,16], which necessitates higher energy input leading to complete pyrolysis of the carbonaceous precursors and subsequently smaller fragments of organic material, the particles formed are smaller due to the thorough decomposition and subsequent reassembly process. In contrast, in the current study, microwave-assisted extraction has the opposite effect, resulting in a broader particle size distribution and generally larger particles, as the energy applied may not induce a complete breakdown of fructus gardeniae, leading to the formation of larger CDs.
Fig. 5.
(A) TEM images (inset: particle size distribution), (B) XRD spectra, and (C) zeta potential of (a) CDs-1 and (b) CDs-2.
The XRD spectra of the CDs, as depicted in Fig. 5B, exhibit characteristic peaks at 2θ = 20° and 2θ = 40°, corresponding to the (002) and (100) crystallographic planes, respectively. These peaks are indicative of the typical amorphous nature of CDs. The formation of CDs often leads to electronic defects, increasing their disorder, which is manifested by the broad peak near 2θ = 20° and a less intense peak near 2θ = 40°. This data suggests that both CDs-1 and CDs-2 are amorphous. The presence of electronic defects within these CDs could facilitate electron transfer processes, thus enhancing their reactivity.
As shown in Fig. 5C, the surface charges of CDs-1 and CDs-2 are predominantly negative, likely related to breaking bonds associated with oxygen-containing functional groups, such as O–H and C–O. Further analysis from Fig. 5C indicates that the magnitude of surface charges follows the order CDs-1 > CDs-2. Based on observations from Figs. 3 and 4, as well as Table 1, it can be inferred that a higher content of oxygen elements may lead to more negatively charged functional groups following bond dissociation. Consequently, a richer composition of functional groups enhances the likelihood of bond breaks, thus increasing the overall negative charge on the surfaces of the CDs.
3.3. Stability of CDs
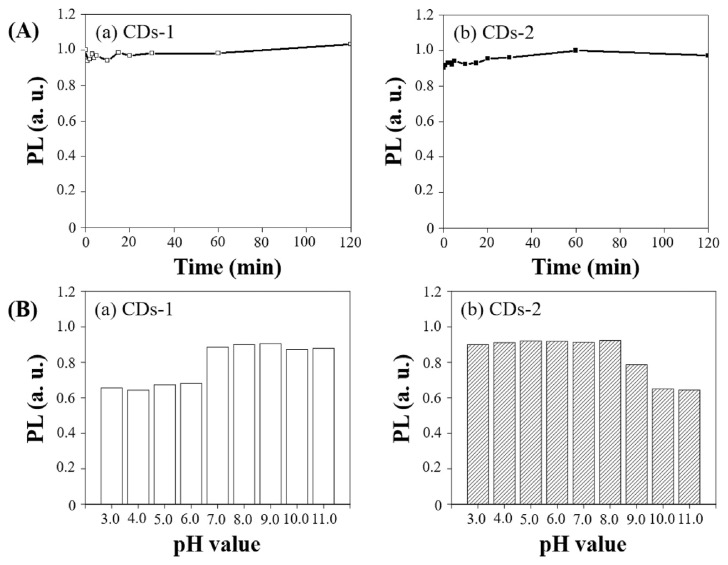
As depicted in Fig. 6A, after continuous exposure to 365 nm UV light (10 W, 1.48 mW/cm2) for 120 min, CDs-1 and CDs-2 retained approximately 92% of their initial fluorescence intensity, indicating their potential for cellular staining and tracking applications. This stability may be attributed to the structural integrity of the CDs, which could have been enhanced by prior thermal treatments such as stir-frying or heating before the microwave-assisted extraction, thus leading to improved UV light-induced fluorescence stability.
Fig. 6.
(A) Plots of the PL intensity at 450 nm of (a) CDs-1 and (b) CDs-2 under continuous irradiation of the 365 nm light with different time intervals. (B) pH dependence of PL response of (a) CDs-1 and (b) CDs-2 in various pH ranges.
The pH-dependence of the fluorescence of the CDs, as shown in Fig. 6B, reveals that CDs-1 and CDs-2 exhibit optimal fluorescence in a neutral environment (pH = 7.0–8.0). This finding suggests that the CDs produced in this experiment possess potential for biological applications. CDs-1 exhibits significant fluorescence quenching in acidic conditions, which have a higher abundance of functional groups on their surface, which could lead to fluorescence quenching in acidic conditions due to electrostatic interactions with H+ ions in the solution. CDs-2 may be due to deprotonation reactions of surface functional groups such as O = C–OH and O = C–H in the presence of a high concentration of OH− ions, affecting the surface chemistry and decreasing fluorescence.
3.4. Anti-bacterial activity and bacterial imaging
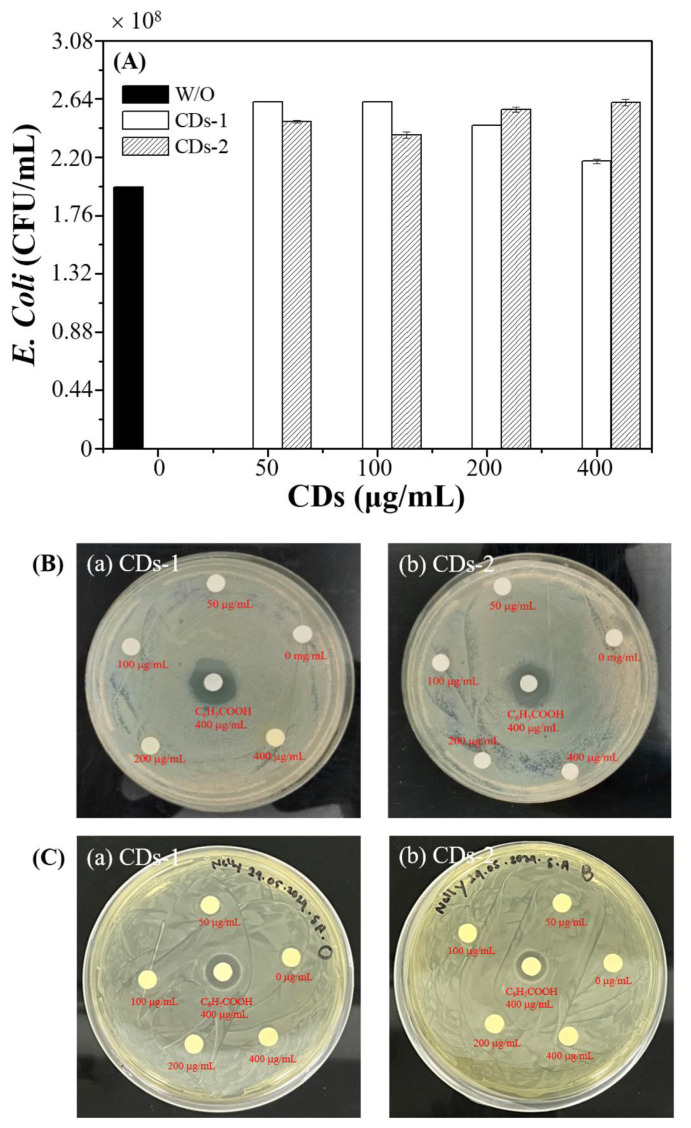
Fig. 7A and B showcase the assessment of antibacterial activity through bacterial viability tests. The bacterial viability tests in Fig. 7A show that, in contrast to the control group without addition, the amounts of E. coli did not decrease but instead showed an increase. Statistical analysis using ANOVA revealed that the differences were significant compared to the control group, with p-values less than 0.001. Our filtration and freeze-drying methods may not have fully isolated the CDs from other bioactive molecules, such as small peptides and oligosaccharides. Consequently, the original constituents of the plant materials, which could remain adsorbed on the surface of the CDs, may contribute to bacterial growth observed in our experiments. Despite literature indicating the antimicrobial activity of gardenia seeds [21–24], the microwave treatment extracted CDs might decompose or inactivate certain antimicrobial functional groups, thereby enhancing bacterial growth rather than inhibiting it [25]. The inhibition zone tests shown in Fig. 7B and C further corroborate the absence of antibacterial activity, indicating that concentrations of the CDs-1 and CDs-2 below 400 μg/mL are non-antibacterial for Gram-negative and Gram-positive bacteria.
Fig. 7.
(A) Bacterial amounts (CFU/mL) of E. coli and photograph images of the inhibition zone of (a) CDs-1 and (b) CDs-2 (0, 50, 100, 200, and 400 μg/mL) and BA (400 μg/mL) against (B) E. coli and (C) Staphylococcus aureus.
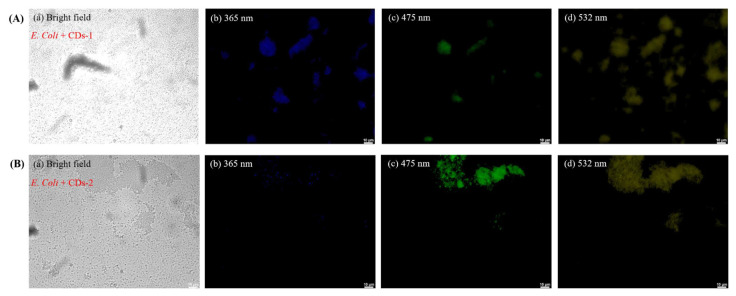
Following this, as illustrated in Fig. 8, E. coli incubated with CDs-1 and CDs-2 were subjected to staining, and upon excitation with light sources of different wavelengths, varying fluorescence colors were observed due to the wavelength-dependency of emission of the CDs [18,19]. It is important to note that the specific mechanisms of CD transport across the bacterial cell wall can vary depending on factors such as the size, surface properties, and composition of the CDs, as well as the type of bacteria and the conditions of the surrounding environment [15,16]. There are three potential mechanisms through which CDs may stain E. coli, (1) penetration: small-sized and highly water-soluble CDs may be able to passively diffuse through the pores and channels present in the bacterial cell wall, (2) endocytosis: the produced CDs can be actively taken up by bacterial cells through endocytosis or other energy-dependent processes [15,16]. Bacterial cells have mechanisms for internalizing various molecules, including nanoparticles, and (3) chemical binding: the produced CDs may bind to cell surface receptors [15,16]. Thus, the resulting fluorescence microscopy images demonstrate distinct colors, indicating that CDs-1 and CDs-2 can effectively stain cells, suggesting their potential for cellular tracking. In our case, ethanol treatment permeates bacterial cells, particularly Gram-negative bacteria (E. coli), with a complex cell wall rich in lipids. Ethanol can disrupt these lipids, loosening the cell wall structure and increasing its permeability. While this method effectively facilitates the entry or attachment of CDs into the cells, it does introduce an artificial enhancement of CD penetration. In the future, we will consider alternative methods to study the intrinsic interactions between CDs and bacterial cells without such pretreatments.
Fig. 8.
Confocal laser microscopic images of E. coli cells with (A) CDs-1 and (B) CDs-2 (25.6 mg/mL) after incubation at 37 °C for 6 h: (a) Bright field and fluorescence mode at excitation wavelengths of (b) 365, (c) 475, and (d) 532 nm.
3.5. Free radical scavenging ability of CDs
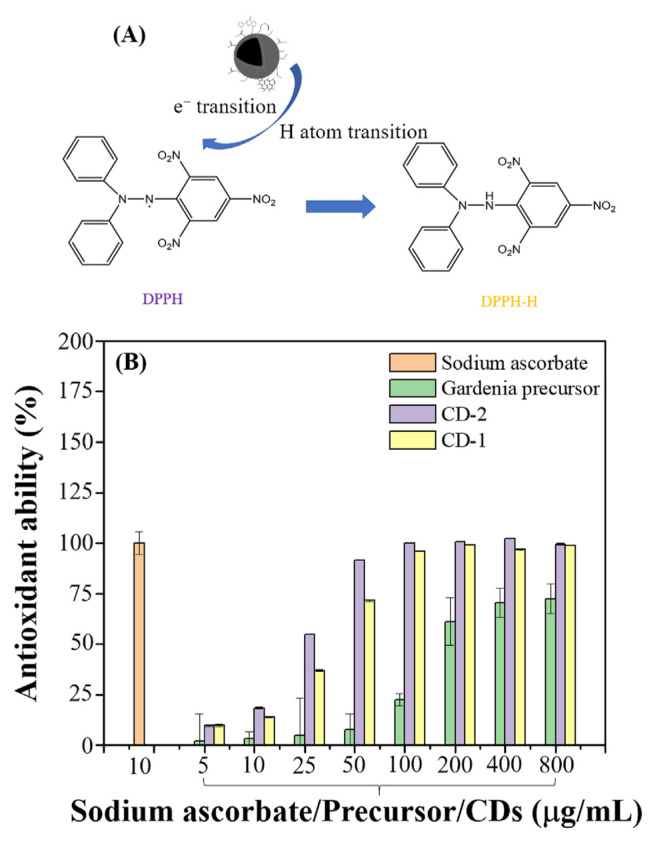
As shown in Fig. 9, the antioxidant capacities of CDs-1 and CDs-2 differ, with CDs-2 exhibiting more excellent antioxidant activity than CDs-1. The underlying mechanism, illustrated at the top of Fig. 9, suggests that through electron transition (ET) or hydrogen atom transfer (HAT), a stable yellow DPPH-H non-radical material is found when the purple DPPH free radical solution interacts with CDs [26]. Specifically, these hydrogen atoms originate from functional groups such as O = C–OH and C–OH. For O = C–OH, the electron-withdrawing capabilities of the C = O bond facilitate the dissociation of hydrogen atoms. In addition, within the C–OH group, the elevated electronegativity of oxygen compared to hydrogen promotes easier deprotonation. According to the functional group compositions presented in Figs. 3 and 4, CDs-2 contains more such groups than CDs-1, thus enhancing its antioxidant capacity. All compounds derived from gardenia showed some degree of antioxidant activity, but the antioxidant effect of CDs was significantly stronger than that of their precursors. This enhanced activity may be due to the higher concentration of active compounds on CDs due to the extraction and adsorption processes and the inherent reactive functional groups present in the precursors. Furthermore, compared with CDs-1, CDs-2 exhibits higher antioxidant capacity because it contains many smaller carbonized nanostructures. Therefore, the active functional groups are more densely packed on the surface of these nanostructures, significantly increasing the density of interfacial active functional groups and resulting in higher antioxidant activity. By examining the concentration required to achieve a 50% antioxidant capacity (SC-50), CDs-1 and CDs-2 have SC-50 values of 35.9 μg/mL and 21.7 μg/mL, respectively. Consequently, CDs extracted from gardenia sources demonstrate superior antioxidant capabilities [27–34].
Fig. 9.
(A) A possible reaction mechanism between CDs and DPPH radicals, (B) Antioxidant activity of different concentrations of sodium ascorbate, Gardenia precursor, CDs-1, and CDs-2 against DPPH radicals.
4. Conclusion
This study showcased the successful microwave-assisted extraction of CDs from fructus gardeniae (CDs-1) and gardenia charcoal (CDs-2) and highlighted their distinct photophysical and biological properties. The CDs exhibited remarkable photo-stability, with up to 92% fluorescence retention after 120 min under UV light, and notable antioxidant capacities, particularly CDs-2 with a SC-50 of 21.7 μg/mL. Both types of CDs demonstrated non anti-bacterial activity, rendering them suitable for cellular tracking, showcasing the versatility of CDs extracted from gardenia sources. Notably, the results also indicated that the carbonization process of fructus gardeniae leads to the formation of CDs, suggesting a potential link between traditional herbal treatments and modern nanotechnology. The relationship between the pharmacological effects of the gardenia charcoal and the derived CDs represents an intriguing future research direction for our laboratory. This novel intersection between traditional medicine and nanomaterial science opens new avenues for exploring the therapeutic potential of CDs.
Supplementary Information
Acknowledgments
This study was supported by the Taiwanese National Science and Technology Council (NSTC) under contracts (112-2113-M-018-005).
Funding Statement
This study was supported by the Taiwanese National Science and Technology Council (NSTC) under contracts (112-2113-M-018-005).
Footnotes
Declaration of competing interest: There are no conflicts to declare.
References
- 1. Yin S, Niu L, Zhang J, Liu Y. Gardenia yellow pigment: extraction methods, biological activities, current trends, and future prospects. Food Res Int. 2024;179:113981. doi: 10.1016/j.foodres.2024.113981. [DOI] [PubMed] [Google Scholar]
- 2. Qin S, Tian J, Zhao Y, Wang L, Wang J, Liu S, et al. Gardenia extract protects against intrahepatic cholestasis by regulating bile acid enterohepatic circulation. J Ethnopharmacol. 2024;319:117083. doi: 10.1016/j.jep.2023.117083. [DOI] [PubMed] [Google Scholar]
- 3. Lv C, Liu X, Chen S, Yi Y, Wen X, Li T, et al. Extract of Gardenia jasminoides Ellis attenuates high-fat diet-induced glycolipid metabolism disorder in rats by targeting gut microbiota and TLR4/Myd88/NF-κB pathway. Antioxidants. 2024;13:293. doi: 10.3390/antiox13030293. [DOI] [PMC free article] [PubMed] [Google Scholar]
- 4. Jin C, Zongo AW-S, Du H, Lu Y, Yu N, Nie X, et al. Gardenia (Gardenia jasminoides Ellis) fruit: a critical review of its functional nutrients, processing methods, health-promoting effects, comprehensive application and future tendencies. Crit Rev Food Sci Nutr. 2023:1–28. doi: 10.1080/10408398.2023.2270530. [DOI] [PubMed] [Google Scholar]
- 5. Yu R, Li Y, Si D, Yan S, Liu J, Si J, et al. Identification, quantitative and bioactivity analyses of aroma and alcohol-soluble components in flowers of Gardenia jasminoides and its variety during different drying processes. Food Chem. 2023;420:135846. doi: 10.1016/j.foodchem.2023.135846. [DOI] [PubMed] [Google Scholar]
- 6. Wen L, Fan C, Zhao X, Cao X. Rapid extraction of bioactive compounds from gardenia fruit using new and recyclable deep eutectic solvents. J Separ Sci. 2023;46:2300163. doi: 10.1002/jssc.202300163. [DOI] [PubMed] [Google Scholar]
- 7. Zong Y, Liu JX. Research progress in the treatment of perimenopausal abnormal uterine bleeding with traditional Chinese and western medicine. J Hainan Med Coll. 2021:27. [Google Scholar]
- 8. Wang L, Chen S, Liu S, Biu AM, Han Y, Jin X, et al. A comprehensive review of ethnopharmacology, chemical constituents, pharmacological effects, pharmacokinetics, toxicology, and quality control of gardeniae fructus. J Ethnopharmacol. 2023:117397. doi: 10.1016/j.jep.2023.117397. [DOI] [PubMed] [Google Scholar]
- 9. Tian J, Qin S, Han J, Meng J, Liang A. A review of the ethnopharmacology, phytochemistry, pharmacology and toxicology of Fructus Gardeniae (Zhi-zi) J Ethnopharmacol. 2022;289:114984. doi: 10.1016/j.jep.2022.114984. [DOI] [PubMed] [Google Scholar]
- 10. Chen L, Li M, Yang Z, Tao W, Wang P, Tian X, et al. Gardenia jasminoides Ellis: ethnopharmacology, phytochemistry, and pharmacological and industrial applications of an important traditional Chinese medicine. J Ethnopharmacol. 2020;257:112829. doi: 10.1016/j.jep.2020.112829. [DOI] [PubMed] [Google Scholar]
- 11. Bag P, Maurya RK, Dadwal A, Sarkar M, Chawla PA, Narang RK, et al. Recent development in synthesis of carbon dots from natural resources and their applications in biomedicine and multi-sensing platform. ChemistrySelect. 2021;6:2774–89. [Google Scholar]
- 12. Chahal S, Macairan J-R, Yousefi N, Tufenkji N, Naccache R. Green synthesis of carbon dots and their applications. RSC Adv. 2021;11:25354–63. doi: 10.1039/d1ra04718c. [DOI] [PMC free article] [PubMed] [Google Scholar]
- 13. Wei S-C, Lin Y-W, Chang H-T. Carbon dots as artificial peroxidases for analytical applications. J Food Drug Anal. 2020;28:558. doi: 10.38212/2224-6614.1090. [DOI] [PMC free article] [PubMed] [Google Scholar]
- 14. Xu D, Lin Q, Chang HT. Recent advances and sensing applications of carbon dots. Small Methods. 2020;4:1900387. [Google Scholar]
- 15. Tsai H-W, Wu T, Hsieh C-L, Fu S-F, Wu M-Y, Lin Y-W. Green synthesis of gardenia seeds-based carbon dots for bacterial imaging and antioxidant activity in aqueous and oil samples. RSC Adv. 2023;13:29283–90. doi: 10.1039/d3ra06293g. [DOI] [PMC free article] [PubMed] [Google Scholar]
- 16. Fang X-W, Chang H, Wu T, Yeh C-H, Hsiao F-L, Ko T-S, et al. Green synthesis of carbon quantum dots and carbon quantum dot-gold nanoparticles for applications in bacterial imaging and catalytic reduction of aromatic nitro compounds. ACS Omega. 2024 doi: 10.1021/acsomega.4c00833. [DOI] [PMC free article] [PubMed] [Google Scholar]
- 17. Das R, Bandyopadhyay R, Pramanik P. Carbon quantum dots from natural resource: a review. Mater Today Chem. 2018;8:96–109. [Google Scholar]
- 18. Liu J-H, Cao L, LeCroy GE, Wang P, Meziani MJ, Dong Y, et al. Carbon “quantum” dots for fluorescence labeling of cells. ACS Appl Mater Interfaces. 2015;7:19439–45. doi: 10.1021/acsami.5b05665. [DOI] [PubMed] [Google Scholar]
- 19. Luo PG, Sahu S, Yang S-T, Sonkar SK, Wang J, Wang H, et al. Carbon “quantum” dots for optical bioimaging. J Mater Chem B. 2013;1:2116–27. doi: 10.1039/c3tb00018d. [DOI] [PubMed] [Google Scholar]
- 20. Li L, Wu G, Yang G, Peng J, Zhao J, Zhu J-J. Focusing on luminescent graphene quantum dots: current status and future perspectives. Nanoscale. 2013;5:4015–39. doi: 10.1039/c3nr33849e. [DOI] [PubMed] [Google Scholar]
- 21. Zhang Y, Wen J, Zhou T-T. Zhi-Zi-Chi Decoction reverses depressive behaviors in CUMS rats by reducing oxidative stress Injury via regulating GSH/GSSG pathway. Front Pharmacol. 2022;13:887890. doi: 10.3389/fphar.2022.887890. [DOI] [PMC free article] [PubMed] [Google Scholar]
- 22.Mastura M, Mardina V, Sofiyan S, Rafikah R, editors. AIP conference proceedings. AIP Publishing; 2021. Antioxidant activity and toxicity of melur (Gardenia jasminoides Ellis) leaves as potential anti-cancer agent. [Google Scholar]
- 23. Chu H-W, Unnikrishnan B, Anand A, Lin Y-W, Huang C-C. Carbon quantum dots for the detection of antibiotics and pesticides. J Food Drug Anal. 2020;28:539. doi: 10.38212/2224-6614.1269. [DOI] [PMC free article] [PubMed] [Google Scholar]
- 24. Li P, Sun L, Xue S, Qu D, An L, Wang X, et al. Recent advances of carbon dots as new antimicrobial agents. SmartMat. 2022;3:226–48. [Google Scholar]
- 25. Wang Y, Li P, Zhang X, Li L, Liu M, Li X, et al. Mitochondrial-respiration-improving effects of three different gardeniae fructus preparations and their components. ACS Omega. 2021;6:34229–41. doi: 10.1021/acsomega.1c03265. [DOI] [PMC free article] [PubMed] [Google Scholar]
- 26. Tang L, Liu H, Huang G, Yuan Z, Fu M, Wen J, et al. The physicochemical properties and immunomodulatory activities of gardenia yellow pigment from gardenia fruit. J Funct Foods. 2022;93:105096. [Google Scholar]
- 27. Innocenzi P, Stagi L. Carbon dots as oxidant-antioxidant nanomaterials, understanding the structure-properties relationship. A critical review. Nano Today. 2023;50:101837. [Google Scholar]
- 28. da Silva LE, Calado OLdL, de Oliveira Silva SF, da Silva KRM, Almeida JH, de Oliveira Silva M, et al. Lemon-derived carbon dots as antioxidant and light emitter in fluorescent films applied to nanothermometry. J Colloid Interface Sci. 2023;651:678–85. doi: 10.1016/j.jcis.2023.07.124. [DOI] [PubMed] [Google Scholar]
- 29. Zheng Y, Li X, Wei C, Gao Y, Han G, Zhao J, et al. Long-lived phosphorescent carbon dots as photosensitizers for total antioxidant capacity assay. Anal Chem. 2023;95:8914–21. doi: 10.1021/acs.analchem.3c00657. [DOI] [PubMed] [Google Scholar]
- 30. Gedda G, Sankaranarayanan SA, Putta CL, Gudimella KK, Rengan AK, Girma WM. Green synthesis of multi-functional carbon dots from medicinal plant leaves for antimicrobial, antioxidant, and bioimaging applications. Sci Rep. 2023;13:6371. doi: 10.1038/s41598-023-33652-8. [DOI] [PMC free article] [PubMed] [Google Scholar]
- 31. Zhuang G-D, Gu W-T, Xu S-H, Cao D-M, Deng S-M, Chen Y-S, et al. Rapid screening of antioxidant from natural products by AAPH-Incubating HPLC-DAD-HR MS/MS method: a case study of Gardenia jasminoides fruit. Food Chem. 2023;401:134091. doi: 10.1016/j.foodchem.2022.134091. [DOI] [PubMed] [Google Scholar]
- 32. Saravanakumar K, Park S, Sathiyaseelan A, Kim K-N, Cho S-H, Mariadoss AVA, et al. Metabolite profiling of methanolic extract of Gardenia jaminoides by LC-MS/MS and GC-MS and its anti-diabetic, and anti-oxidant activities. Pharmaceuticals. 2021;14:102. doi: 10.3390/ph14020102. [DOI] [PMC free article] [PubMed] [Google Scholar]
- 33. Rodríguez-Varillas S, Fontanil T, Obaya ÁJ, Fernández- González A, Murru C, Badía-Laíño R. Biocompatibility and antioxidant capabilities of carbon dots obtained from tomato (Solanum lycopersicum) Appl Sci. 2022;12:773. [Google Scholar]
- 34. Wei X, Li L, Liu J, Yu L, Li H, Cheng F, et al. Green synthesis of fluorescent carbon dots from gynostemma for bioimaging and antioxidant in zebrafish. ACS Appl Mater Interfaces. 2019;11:9832–40. doi: 10.1021/acsami.9b00074. [DOI] [PubMed] [Google Scholar]
Associated Data
This section collects any data citations, data availability statements, or supplementary materials included in this article.


