Abstract
This study proposes a foaming method along with calcination to produce silica-based porous materials. The high-silicon-content waste residue reacts with sodium hydroxide for hydrogen evolution foaming reactions. Then, the foaming green bodies are embedded and calcined in the calcination powder consisting of silicon, silicon carbide, graphite, and activated carbon at 1200 °C. The calcination powder creates a reducing atmosphere and prevents adhesion of the foaming green bodies to the crucible during calcination. Furthermore, the addition of activated carbon and calcination improve the macroporosity issue of the prepared sample through a gas–liquid–solid transformation. The BET surface area measurement is 64.197 m2/g, and the mercury intrusion porosimetry measurement indicates a porosity of 56.48%, with an average pore diameter of 396.48 nm. The porous composite materials exhibit the capability to adsorb methylene blue in solution. The porous materials possessing functional groups suggest promising potential for future development and application prospects.
1. Introduction
Advances in photovoltaics and electronics have considerably increased the demand for high-purity silicon. High-purity silicon is derived from the refinement of silicon dioxide. Depending on its purity, silicon is classified into alloy silicon (98%), solar-grade silicon (>6–7 N), and the highest purity silicon wafers for semiconductor use (11 N).1−6 Accordingly, the silicon slag in the refined products of high-purity silicon and that produced during the refining process (i.e., 6 N crystalline silicon waste and wafer cutting waste) can serve as the source of silicon powder in the present study.7,8
Silicon powder, silicon slag, and silicon waste are reused in the manufacture of cement, ceramic additives, and silicon ingots in steelmaking. Following improvements in silicon purification and separation technologies, silicon waste recycling and reuse have become a focal point in cutting-edge research. Taking energy issues as an example, it is widely recognized that hydrogen has great potential as an energy vector. Hydrogen gas can be generated through electrolysis or photochemical methods. However, although hydrogen can be readily formed by such methods, it still remains difficult to store and transport because it has a very low density. This is a particular issue for portable applications, where a high gravimetric hydrogen storage efficiency is required.9 Nakayama et al. investigated a simple and safe method for producing hydrogen using Si powder, which is discarded in the semiconductor industry.10 The concept of hydrogen generation from silicon powder involves the reaction of pure silicon with a sodium hydroxide solution to produce hydrogen gas, as shown in the following reaction (eq 1. This method becomes a way of hydrogen storage and transportation. Therefore, waste silicon could be utilized based on this chemical reaction.11,12
| 1 |
In addition to facilitating the reaction mentioned above, the silicon slag formed a porous structure after the reaction. The foamed structure can serve as a precursor for porous materials and eliminate the need for pore-forming agents or foaming processes, thereby reducing manufacturing costs.13 Moreover, the presence of silicon dioxide and silicon carbide in silicon waste enables the multifunctional utilization of the prepared porous materials.14,15
The purpose of the thermal treatment of porous materials is to enhance their structure, properties, and characteristics. For instance, after foam processing, sintering or calcination is employed to burn off the foaming agent and reinforce the porous structure.16 This process occurs through the bonding of particles upon heating via bulk mass transfer and surface-transport mechanisms, with the main goal being to obtain a fully dense solid component. The efficiency of thermal treatment correlates with many factors such as heating temperature, time, and atmosphere as well as grain size, porosity, and agglomerates of the green density. According to the reports, the atmosphere during the thermal treatment process influences the rate of densification differently due to the diffusiveness of gases entrapped in pores as well as oxygen potential differences inside and outside of the specimen. Consequently, grain growth rate varies in various atmospheres.17−19 Sodium silicate, which exists in the foamed body in Reaction 1, could serve as a sintering aid during the sintering process, promoting the formation of liquid-phase sintering. This process reduces the sintering temperature.20
In this study, the foaming reaction between silicon waste and sodium hydroxide was adopted as a mechanism to produce porous green bodies. The silicon slag from refined high-purity silicon and the refining process (silicon waste and wafer cutting waste) were used as sources of silicon powder for waste recycling. During the foaming process, a suitable amount of activated carbon was added to improve the surface properties and increase the diversity of the pores in the foam body. Calcination was used to enhance the structure and porous properties of the material. Both the feasibility of this process and the properties of the porous materials were examined.
2. Experiment
2.1. Raw Materials and Their Properties
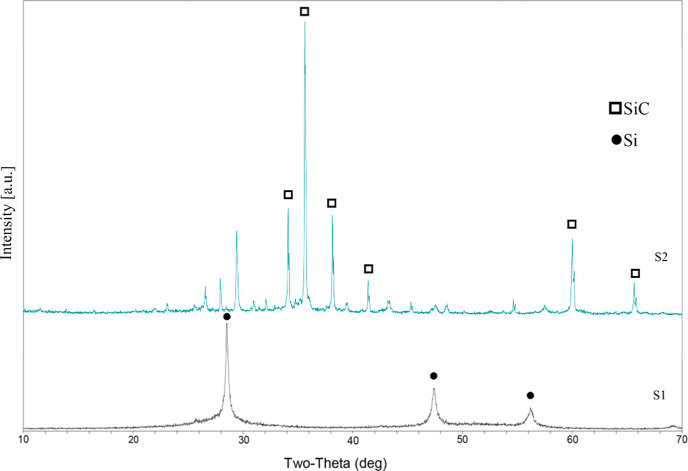
The silicon slag, namely, S1 and S2, with moisture contents of approximately 23.03% and 8.42%, respectively, comprised solid wastes from refined high-purity silicon and the refining process (silicon waste and wafer cutting waste). X-ray fluorescence spectrometry (Malvern PANalytical AxiosmAX, Worcestershire, UK) was used to analyze the components of the silicon slag. The major content of the slag was silicon, excluding a small number of impurities (e.g., calcium, aluminum, magnesium, and sodium). X-ray diffraction (XRD; Malvern PANalytical X’Pert3) was used to analyze the crystalline phase. The results indicated that S1 exhibited a pure silicon crystalline phase, whereas S2 exhibited a silicon oxide crystalline phase and a silicon carbide crystalline phase, in which the silicon carbide was 6H-SiC. As shown in Figure 1, both S1 and S2 exhibited impurity phases. S1 was used to obtain a foam body, and S2 was used as an ingredient in the calcination powder. The calcination powder, which was a mixture of S2, activated carbon powder, and graphite powder, was used to bury the foam body to prevent the body from adhering to the crucible during calcination.
Figure 1.
XRD patterns of silicon slag.
2.2. Experimental Methods
2.2.1. Foaming Preparation
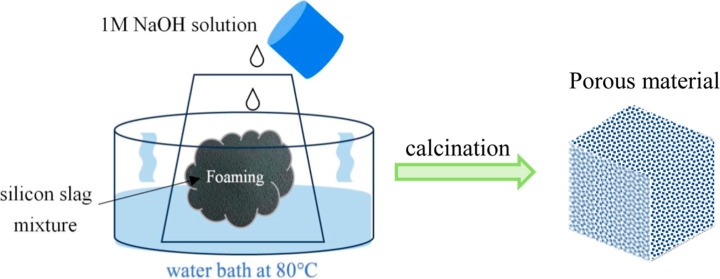
As shown in Reaction 1, high-purity silicon was reacted with sodium hydroxide to generate hydrogen, resulting in the formation of a foam body. S1 was selected for a foaming experiment. After the experiment, the samples were numbered depending on their mixing ratios (Table 1). This experiment was conducted in a water bath at 80 °C, with sodium hydroxide solution used at a concentration of 1 M.10,12 The foam body was rinsed with deionized water and dried in an oven at 105 °C.
Table 1. Composition of the Foam Samplesa.
| sample NO | S1 | C | NaOH |
|---|---|---|---|
| HG | 2.50 g | 0 | 6.0 mL |
| HGC | 2.50 g | 1.00 g | 6.0 mL |
S1: silicon slag, C: activated carbon.
The green body underwent a heat treatment process after being foamed and dried. To prevent the green body from sticking to the crucible during heat treatment, it was buried in calcination powder and placed in a crucible with a lid. The schematic diagram is shown in Figure 2. Subsequently, the foam body was calcined in a muffle furnace at 1000 and 1200 °C for 2 h with a heating rate of 10 °C/min. Finally, the calcined samples were ultrasonically oscillated for approximately 5 min to remove any unattached calcination powder. The samples were named as HG1000, HG1200, HGC1000, and HGC1200 according to the composition of the foam body and the calcined temperature.
Figure 2.
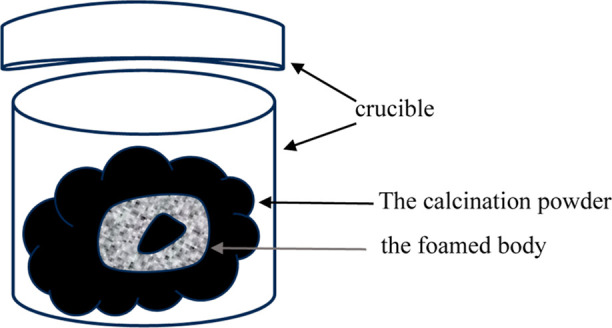
Heat treatment experimental diagram.
2.2.2. Analysis of the Performance of the Calcined Materials
XRD (Malvern PANalytical X’Pert3) was used to analyze changes in the crystalline phase of the samples after calcination. Scanning electron microscopy (SEM; FEI Quanta 250 FEG) was used to observe the structures and pores of the samples. Energy-dispersive spectroscopy (EDS; Oxford INCA Energy X-Max 50X) was used to obtain the partial energy spectra. Fourier-transform infrared (FTIR) spectroscopy (Thermo Scientific Nicolet iS5) was used to examine the bonded functional groups on the surface of the samples. A Brunauer–Emmett–Teller (BET) surface area analyzer (ASAP 2460; Micromeritics, Norcross, GA, USA) was used to estimate the surface area and pore distribution of the materials through nitrogen adsorption. Assisted by a mercury intrusion porosimeter (Micromeritics Autopore V 9600), the porosity was measured to compare the differences in pore formation due to high-temperature heat treatment with and without the addition of activated carbon. A methylene blue (MB) adsorption experiment was conducted to explore the application of porous materials in wastewater treatment.
2.2.3. Methylene Blue Adsorption Experiment
The suitability of the samples HG1000 and HGC1200 for use as degradable dyes was determined on the basis of their ability to adsorb the MB solution (0.01 mol/L). Approximately 1 g of each calcined sample was placed in a conical flask with 40 mL of the MB solution and shaken at room temperature. Samples were extracted after 30, 60, 120, and 180 min, and an ultraviolet–visible spectrophotometer (L8 Plus, INASE) was used for measurement (pH 7.5, 30 °C).
3. Results and Discussion
3.1. Calcination Powder and Heat Treatment Atmosphere
After the calcination powder was buried in the foamed samples, it was calcined at 1000 and 1200 °C and maintained at these temperatures for 2 h. The masses of the samples and calcination powder were measured before and after calcination. The results indicated an increase in the ignition loss and mass after calcination. For instance, when the mixing ratio of the calcination powder was G/S/C = 2:4:4 (with G, S, and C indicating graphite, S2 powder, and activated carbon, respectively), the masses of HG1000 and HGC1200 increased by 0.22 and 0.68 g, respectively. The calcination powder provided a reducing atmosphere because of the existence of graphite and activated carbon. Therefore, the increase in the calcined samples in mass might be attributable to the silicon phase change that occurred at high temperatures and the adhesion of the calcination powder. After calcination, the mass of the calcination powder decreased, with the amount of loss reported in Table 2. When the calcination temperature increased, ignition loss also increased. By contrast, when the content of S2 powder in the calcination powder decreased and the content of activated carbon increased, ignition loss decreased. Therefore, calcination powder with a mixing ratio of 2:4:4 was selected.
Table 2. Calcination Powder Formulations and Ignition Loss at Different Temperaturesa.
| calcining temperature | 1000 °C |
1200 °C |
||
|---|---|---|---|---|
| G:S:C | 2:4:4 | 2:3:5 | 2:4:4 | 2:3:5 |
| burn out(g) | 2.039 | 1.666 | 2.735 | 1.990 |
G: Graphite, S: S2 sample, and C: active carbon.
3.2. Morphology and Microstructure after Calcination
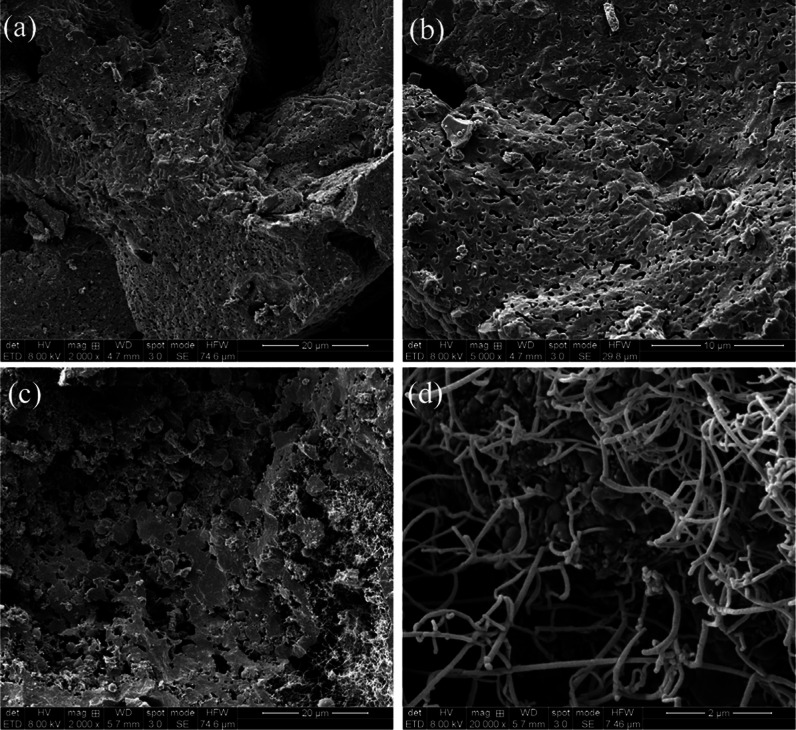
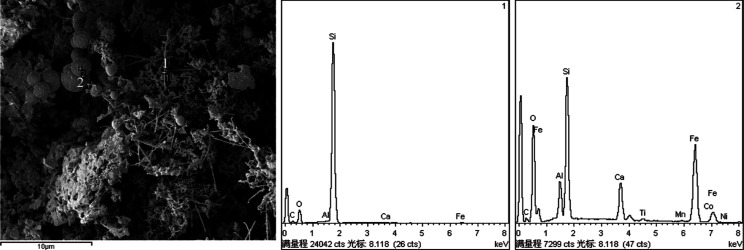
Figure 3 shows the SEM images of the samples after calcination. The results indicated that HG1000 exhibited a worm-like microporous surface, which formed due to foaming and due to coverage of the calcination powder. On the fracture surface of HGC1200, whisker and spherical particle structures were observed. As indicated by the EDS images (Figure 4), the whisker structures exhibited a high silicon content, and the spherical particle structures exhibited many impurities. These whisker and spherical particle structures were affected by the manufacturing process and the components of silicon slag and calcination powder. During this process, both the sodium hydroxide used for foaming to generate sodium silicate and the coated calcination powder were calcined in a reducing atmosphere at 1200 °C. In the presence of thermal expansion and surface tension, activated carbon, gas, and impurities in samples formed spherical structures.21,22 Whiskers were metal, oxide, or carbide micro- or nanoscale short fibers produced by high-purity crystals.23 They formed through a vapor–liquid–solid mechanism.24 When the temperature decreased, gaseous impurity vapor formed alloy droplets and deposits on the growth substrate, and whiskers were precipitated through supersaturation. Each type of alloy droplet formed whiskers with a unique composition.25 In this study, the EDS results indicated that the whiskers of HGC1200 were pure silicon whiskers.
Figure 3.
SEM micrographs of porous and fracture surface after calcination at different temperatures: (a) HG1000, 2000x; (b) HG1000, 5000x; (c) HGC1200, 2000x, and (d) HGC1200, 20000x.
Figure 4.
EDS analysis of sample HGC1200.
3.3. Pore Distribution and Formation Factors
BET analysis was conducted to determine the specific surface areas of the samples. The results are presented in Table 3. The specific surface area of HGC1200 (64.197 m2/g) was greater than that of HG1000 (3.393 m2/g). Micropores were scarce in HG1000 because of which the micropore area could not be estimated using a t-plot method, while they had a relatively high content in HGC1200. Comparing the mesopore surface area of both samples, it was observed that HGC1200 had a higher mesopore content than HG1000. The pore size distributions of the two samples by the DFT method are shown in Figure 5. HGC1200 had micropores ranging from 1 to 2 nm. The mesopore size distribution of HGC1200 was broader, from 2 to 35 nm. The pore size of HG1000 was from 1.69 to 20 nm.
Table 3. BET Analysis Value of Samples.
| HG1000 | HGC1200 | |
|---|---|---|
| BET surface area (m2/g) | 3.393 | 64.197 |
| t-plot micropore area (m2/g) | 27.960 | |
| t-plot external surface area (m2/g) | 3.393 | 36.237 |
| BJH surface area (m2/g) | 1.967 | 14.718 |
Figure 5.
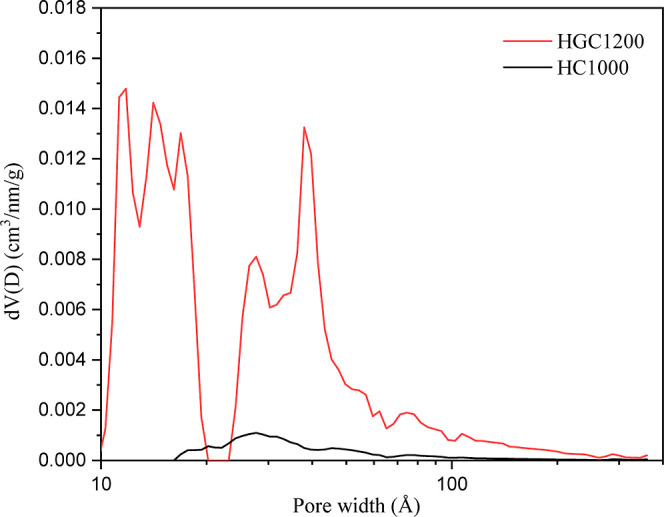
Pore size distribution by the DFT method for samples.
To further analyze the macropores in the samples, mercury intrusion porosimetry (MIP) was conducted. The results are presented in Table 4 and Figure 6. Under the measurement conditions of the mercury intrusion test, HGC1200 resulted in a smaller average pore size and a larger porosity. The average pore diameters were 930.41 nm for HG1000 and 396.48 nm for HGC1200, indicating that both samples contained macropores. HGC1200 exhibited a broader range of pore size distribution, which was from 4 nm to 10 μm, while the pore size of HG1000 started from 11 nm. The difference of the pore size distribution was due to the addition of activated carbon and the calcination temperature. The micropores of HGC1200 were mainly from activated carbon. Meanwhile, the addition of activated carbon during the process contributed to the generation of pores and an increase in porosity. This is achieved through the formation of a reducing atmosphere and the specific grain growth or boundary hindrance between different crystalline phases, contributing to the formation of stable pore structures.26,27 Whiskers and spherical oxides were generated in a high-temperature atmosphere to form pores with a special structure (Figure 3), characterized by micropore volume and size. This process alleviated the macropore problem that affects foaming materials.28,29
Table 4. MIP Analysis Value of Samples.
| HG1000 | HGC1200 | |
|---|---|---|
| report range (psi) | 0.10–61,000.00 | 0.10–61,000.00 |
| average pore diameter (4 V/A) | 930.41 nm | 396.48 nm |
| total pore area at 59,949.90 psia | 1.858 m2/g | 9.281 m2/g |
| porosity | 47.68% | 56.48% |
Figure 6.
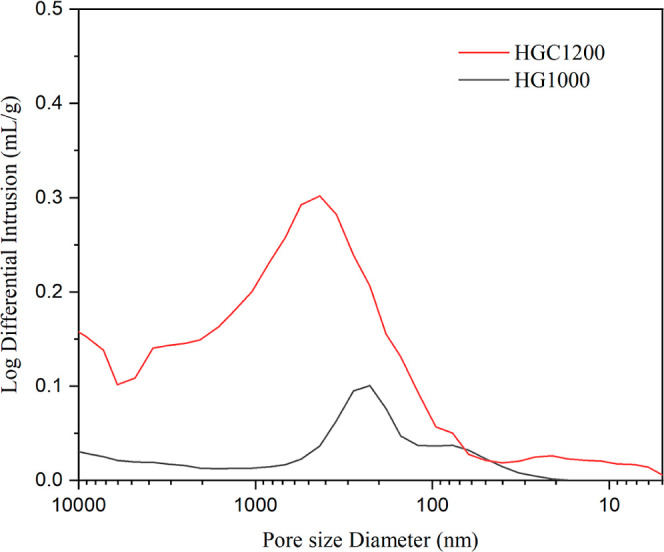
Log differential intrusion vs pore size distribution for samples.
3.4. Crystalline Phase after Calcination
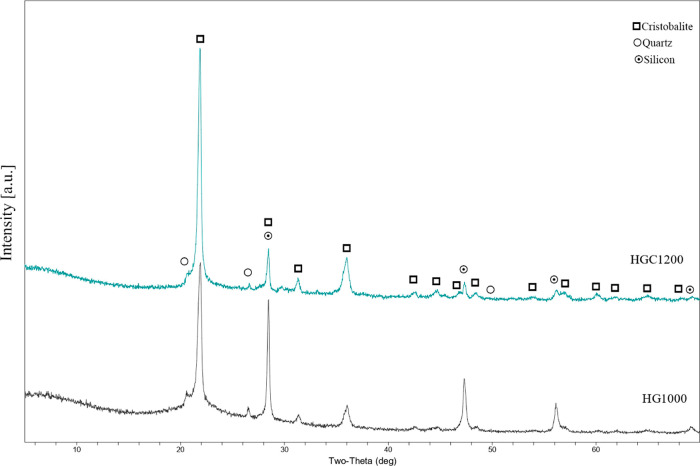
Figure 7 presents the XRD results of HG1000 and HGC1200. After calcination, the samples retained their original pure silicon crystalline phases, including a quartz phase with a main XRD peak of 26.64° and a high-temperature cristobalite phase with a main XRD peak of 21.98°. Because both S1 and S2 contained impurities (e.g., calcium, magnesium, aluminum, and sodium), gehlenite and omphacite crystalline phases were formed.
Figure 7.
XRD patterns of samples.
3.5. Surface Functional Group of Porous Materials
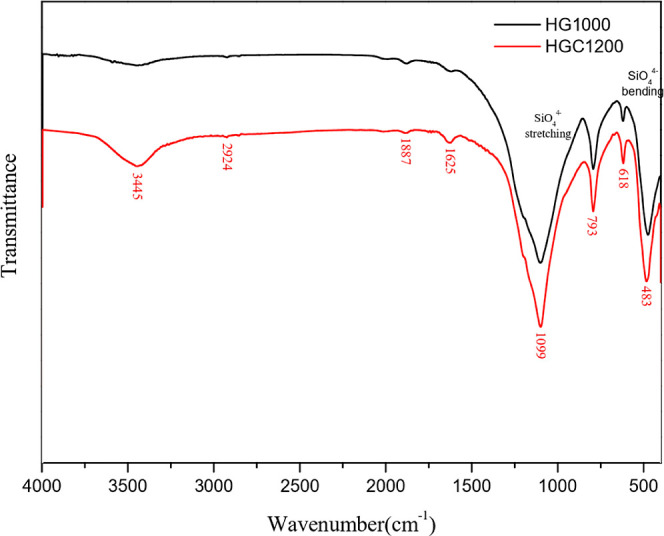
As shown in Figure 8, FTIR analysis was conducted to determine the surface properties of the porous materials with surface functional groups. According to the literature, silicon–oxygen tensile vibrations are associated with vibration peaks of 1000–1100, 960, and 873 cm–1 and bending vibration peaks of 616 and 460 cm–1.30 In this study, HG1000 and HGC1200 exhibited uniform vibration peaks. As for the transformation of silicon–oxygen tetrahedrons into cristobalite at high temperatures, a silicon–oxygen stretching peak was concentrated at 1092 cm–1, and a symmetrical stretching vibration peak was concentrated at 795 cm–1.31 Compared with HG1000, HGC1200 exhibited a more focused silicon–oxygen stretching vibration peak of 1099 cm–1.
Figure 8.
FTIR spectra for samples.
As a result of the added activated carbon and the adhesion of the calcination powder at high temperatures during the manufacturing process, carbon–oxygen functional groups formed on the surface of the samples. According to the literature, the characteristic absorption peak of carboxylic acid and carbonyl groups occurs at 1650–1860 cm–1.32 In addition, the stretching vibration absorption peak of C=O in lactone groups or carboxylic acid occurs at 1710–1760 cm–1, the absorption peak of chelated carbonyl groups occurs at 1650–1680 cm–1, and the absorption peak of phenolic hydroxyl groups occurs at 1000–1300 cm–1.33,34 The vibration peak values near carbonyl groups are 2926 and 2854 cm–1, corresponding to the antisymmetric and symmetric stretch peaks, respectively, of methylene.22,35 In this study, the carbon–oxygen functional groups of HGC1200 exhibited vibration peaks (Figure 8). However, because of the differences in the sample processing conditions and the formation of crystalline phases, the peak values obtained slightly deviated from or overlapped with those reported in other studies.36,37
3.6. MB Adsorption on Porous Materials
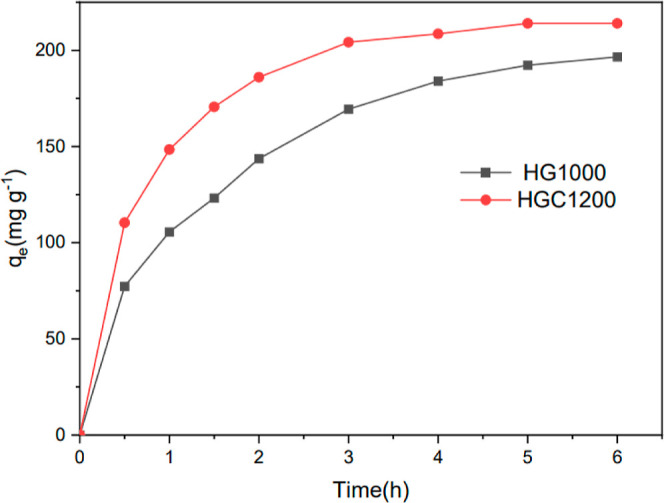
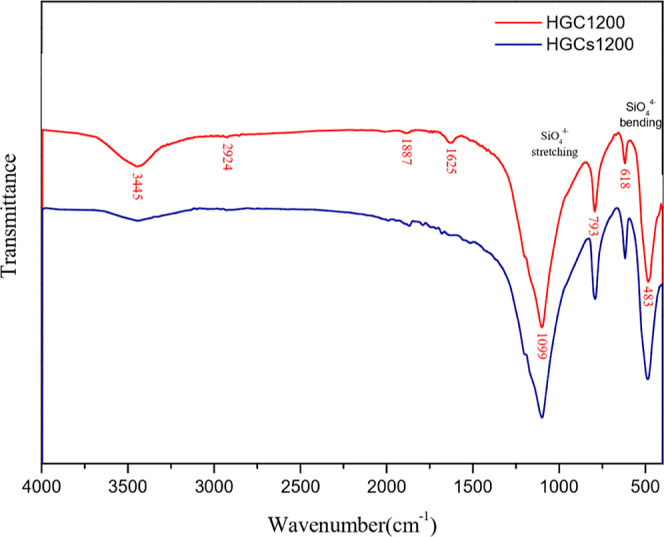
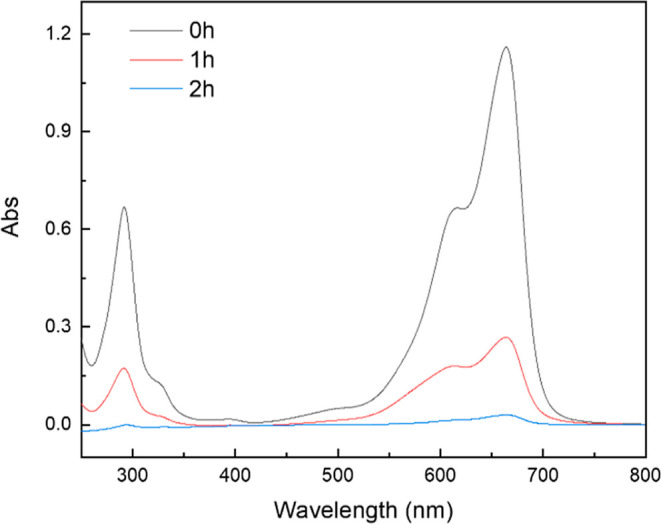
The adsorption results of the samples on the MB solution are shown in Figure 9. The results indicated that adsorption capacity increased over time. Compared with HG1000, HGC1200 exhibited a higher adsorption capacity, with the degree of adsorption increasing rapidly within 1 h. As reported by studies, the adsorption capacity was influenced by the specific surface area, pore structure, and adsorption points of adsorbents.38,39 In this study, HGC1200 showed a more superior performance in specific surface area and pore structure (Table 3) than HG1000. In addition, compared to HG1000, HGC1200 contained activated carbon, which had a good adsorption capacity of MB. Because of the competition of MB for the adsorption points in the samples, the pores of the samples were gradually filled up over time, and the adsorption of MB reached an equilibrium.40 Generally, in an aqueous solution, the hydrogen of the hydroxyl groups and the carboxylic acid and nitrogen of heterocyclic aromatic compounds in MB can easily form hydrogen bonds. In this study, the relative strength of stretching vibrations in relation to the C≡C–, CH, and C–O functional groups on the surface of HGC1200 decreased after adsorption (Figure 10), indicating a correlation between the samples and the adsorption of MB.41 To further analyze the removal mechanism of MB, the UV–vis spectra of MB during adsorption are shown in Figure 11. The concentration of MB was lower than that shown in Figure 9. As a result, the MB removal finished in 2 h. It can be seen that no characteristic peaks of MB disappeared during adsorption, as shown in Figure 11. The intensity of the peaks only decreased with time. Meanwhile, no new peaks appeared. Therefore, MB was adsorbed on the porous materials. To further analyze the removal mechanism of MB, the UV–vis spectra of MB during adsorption is shown in Figure 11. The concentration of MB was lower than that shown in Figure 9. As a result, the MB removal finished in 2 h. It can be seen from Figure 11 that no characteristic peaks of MB disappeared during adsorption. The intensity of the peaks only decreased with time. Meanwhile, no new peaks appeared. Therefore, MB was adsorbed on the porous materials.
Figure 9.
Adsorption curve of MB solution for samples.
Figure 10.
Comparison of FTIR before and after adsorption of MB by HGC1200.
Figure 11.
UV–vis spectra of MB during adsorption.
4. Conclusions
In addition to the production of hydrogen, the reaction between waste silicon slag containing high silicon content with sodium hydroxide solution could form the porous material with a large pore size. The addition of activated carbon, along with the encapsulation of the foaming body by calcination powder during the heat treatment process, could improve the large pore size issue of the porous material, resulting in porous materials with functional groups. Meanwhile, the calcination powder not only prevented the green body from sticking to the crucible during calcination but also utilized the complex effects of activated carbon, silicon slag components, and the atmosphere to hinder the growth of grain boundaries and crystallites. The pores and surface carbon–oxygen functional groups of the porous material samples facilitated the adsorption effect on aromatic heterocyclic compounds in the MB solution. This capability can be utilized for the removal of such dyes and for wastewater treatment. Therefore, the process elucidated in this study could promote the reuse of waste materials for the development and application of functional materials.
Acknowledgments
This work was supported by the Guangdong University Innovation Team (2021KCXTD055) and the Guangdong College Students’ Innovative Project (X202310580143). Also, the authors appreciated the technical support from Yanfang Liu and Zeman Fan.
The authors declare no competing financial interest.
References
- Jia F.; Sun H.; Koh L. Global solar photovoltaic industry: an overview and national competitiveness of Taiwan. J. Cleaner Prod. 2016, 126, 550–562. 10.1016/j.jclepro.2016.03.068. [DOI] [Google Scholar]
- Xi F.; Li S.; Ma W.; Chen Z.; Wei K.; Wu J. A review of hydrometallurgy techniques for the removal of impurities from metallurgical-grade silicon. Hydrometallurgy 2021, 201, 105553. 10.1016/j.hydromet.2021.105553. [DOI] [Google Scholar]
- Safarian J.; Tranell G.; Tangstad M. Processes for upgrading metallurgical grade silicon to solar grade silicon. Energy Procedia 2012, 20, 88–97. 10.1016/j.egypro.2012.03.011. [DOI] [Google Scholar]
- Woditsch P.; Koch W. Solar grade silicon feedstock supply for PV industry. Sol. Energy Mater. Sol. Cells 2002, 72, 11–26. 10.1016/S0927-0248(01)00146-5. [DOI] [Google Scholar]
- Surek T. Crystal growth and materials research in photovoltaics: progress and challenges. J. Cryst. Growth 2005, 275, 292–304. 10.1016/j.jcrysgro.2004.10.093. [DOI] [Google Scholar]
- Shimura F.Semiconductor silicon crystal technology; San Diego Academic Press Inc: CA, 1989; pp 114–214. [Google Scholar]
- Shen Z. Y.; Chen C. Y.; Lee M. T. Recovery of cutting fluids and silicon carbide from slurry waste. J. Hazard. Mater. 2019, 362, 115–123. 10.1016/j.jhazmat.2018.09.014. [DOI] [PubMed] [Google Scholar]
- Wang T. Y.; Lin Y. C.; Tai C. Y.; Fei C. C.; Tseng M. Y.; Lan C. W. Recovery of silicon from kerf loss slurry waste for photovoltaic applications. Prog. Phot. Res. Appl. 2009, 17, 155–163. 10.1002/pip.863. [DOI] [Google Scholar]
- Dalebrook A. F.; Gan W.; Grasemann M.; Moret S.; Laurenczy G. Hydrogen storage: beyond conventional methods. Chem. Commun. 2013, 49 (78), 8735–8751. 10.1039/c3cc43836h. [DOI] [PubMed] [Google Scholar]
- Nakayama S.; Kuwata S.; Imai S. Simple hydrogen gas production method using waste silicon. Results Mater. 2022, 13, 100254. 10.1016/j.rinma.2022.100254. [DOI] [Google Scholar]
- Weaver E. R. The generation of hydrogen by the reaction between ferrosilicon and a solution of sodium hydroxide. J. Ind. Eng. Chem. 1920, 12 (3), 232–240. 10.1021/ie50123a011. [DOI] [Google Scholar]
- Brack P.; Dann S. E.; Wijayantha K. G. U.; Adcock P.; Foster S. An assessment of the viability of hydrogen generation from the reaction of silicon powder and sodium hydroxide solution for portable applications. Int. J. Energy Res. 2017, 41, 220–228. 10.1002/er.3604. [DOI] [Google Scholar]
- Hirschfeld D. A.; Li T. K.; Liu D. M. Processing of porous oxide ceramics. Key Eng. Mater. 1995, 115, 65–80. 10.4028/www.scientific.net/KEM.115.65. [DOI] [Google Scholar]
- Lu J. S.; Lu Z. Y.; Peng C. H.; Li X.; Jiang H. Influence of particle size on sinterability, crystallisation kinetics and flexural strength of wollastonite glass-ceramics from waste glass and fly ash. Mater. Chem. Phys. 2014, 148, 449–456. 10.1016/j.matchemphys.2014.08.013. [DOI] [Google Scholar]
- Ren X.; Ma B.; Qian F.; Yang W.; Liu G.; Zhang Y.; Yu J.; Zhu Q. Green synthesis of porous SiC ceramics using silicon kerf waste in different sintering atmospheres and pore structure optimization. Ceram. Int. 2021, 47, 26366–26374. 10.1016/j.ceramint.2021.06.047. [DOI] [Google Scholar]
- Liu P.; Chen G. F.. Porous Materials: Processing and Applications; Tsinghua University Press Limited, 2014; p P34. Published by Elsevier Inc. [Google Scholar]
- Coble R. L. Sintering Alumina: Effect of Atmospheres. J. Am. Ceram. Soc. 1962, 45, 123–127. 10.1111/j.1151-2916.1962.tb11099.x. [DOI] [Google Scholar]
- Paek Y.-K.; Eun K. Y.; Kang S. J. L. Effect of Sintering Atmosphere on Densification of MgO-Doped Al2O3. J. Am. Ceram. Soc. 1988, 71, C-380. 10.1111/j.1151-2916.1988.tb06398.x. [DOI] [Google Scholar]
- Ayode Otitoju T.; Ugochukwu Okoye P.; Chen G.; Li Y.; Onyeka Okoye M.; Li S. Advanced Ceramic Components: Materials, Fabrication, And Applications. J. Ind. Eng. Chem. 2020, 85, 34–65. 10.1016/j.jiec.2020.02.002. [DOI] [Google Scholar]
- Liu C. Y.; Tuan W. H.; Chen S. C. Preparation of porous SiC ceramics for thermal dissipation purposes. Ceram. Int. 2015, 41 (3), 4564–4568. 10.1016/j.ceramint.2014.11.154. [DOI] [Google Scholar]
- Stöber W.; Arthur F.; Bohn E. Controlled growth of monodisperse silicon spheres in the micron size range. J. Colloid Interface Sci. 1968, 26, 62–69. 10.1016/0021-9797(68)90272-5. [DOI] [Google Scholar]
- Cai X.; Hong R. Y.; Wang L. S.; Wang X.; Li H.; Zheng Y.; Wei D. Synthesis of silica powders by pressured carbonation. Chem. Eng. J. 2009, 151, 380–386. 10.1016/j.cej.2009.03.060. [DOI] [Google Scholar]
- Takagi R. Growth of oxide whiskers on metals at high temperature. J. Phys. Soc. Jpn. 1957, 12, 1212–1218. 10.1143/JPSJ.12.1212. [DOI] [Google Scholar]
- Wagner R. S.; Ellis W. C. Vapor-liquid-solid mechanism of single crystal growth. Appl. Phys. Lett. 1964, 4, 89–90. 10.1063/1.1753975. [DOI] [Google Scholar]
- Milewski J. V.; Gac F. D.; Petrovic J. J.; Skaggs S. R. Growth of beta-silicon carbide whiskers by the VLS process. J. Mater. Sci. 1985, 20, 1160. 10.1007/bf01026309. [DOI] [Google Scholar]
- Liu R. L.; Ren Y. J.; Shi Y. F.; Zhang F.; Zhang L.; Tu B.; Zhao D. Controlled synthesis of ordered mesoporous C-TiO2 nanocomposites with crystalline titania frameworks from organic-inorganic-amphiphilic coassembly. Chem. Mater. 2008, 20, 1140–1146. 10.1021/cm071470w. [DOI] [Google Scholar]
- Luo W.; Wang Y. X.; Wang L. J.; Jiang W.; Chou S. L.; Dou S. X.; Liu H. K.; Yang J. Silicon/Mesoporous Carbon/Crystalline TiO2 Nanoparticles for Highly Stable Lithium Storage. ACS Nano 2016, 10, 10524–10532. 10.1021/acsnano.6b06517. [DOI] [PubMed] [Google Scholar]
- Gan Y. X.; Chen C.; Shen Y. P. Three-dimensional modeling of the mechanical property of linearly elastic open cell foams. Int. J. Solids Struct. 2005, 42, 6628–6642. 10.1016/j.ijsolstr.2005.03.002. [DOI] [Google Scholar]
- Li C.; Bian C.; Han Y.; Wang C. A.; An L. Mullite whisker reinforced porous anorthite ceramics with low thermal conductivity and high strength. J. Eur. Ceram. Soc. 2016, 36, 761–765. 10.1016/j.jeurceramsoc.2015.10.002. [DOI] [Google Scholar]
- Mirhadi S. F.; Tavangarian F.; Emadi R. Synthesis, characterization and formation mechanism of single-phase nanostructure bredigite powder. Mater. Sci. Eng., C 2012, 32, 133–139. 10.1016/j.msec.2011.10.007. [DOI] [Google Scholar]
- Bertoluzza A.; Fagnano C.; Morelli M. A.; et al. Raman and infrared spectra on silica gel evolving toward glass. J. Non-Cryst. Solids 1982, 48, 117–128. 10.1016/0022-3093(82)90250-2. [DOI] [Google Scholar]
- Moreno-Castilla C.; Lopez-Ramon M. V.; Carrasco-Marín F. Changes in surface chemistry of activated carbons by wet oxidation. Carbon 2000, 38, 1995–2001. 10.1016/S0008-6223(00)00048-8. [DOI] [Google Scholar]
- Meldrum B. J.; Rocheste C. H. In situ infrared study of the surface oxidation of activated carbon in oxygen and carbon dioxide. J. Chem. Soc., Faraday Trans. 1990, 86, 861–865. 10.1039/FT9908600861. [DOI] [Google Scholar]
- Tucureanu V.; Matei A.; Avram A. M. FTIR spectroscopy for carbon family study. Crit. Rev. Anal. Chem. 2016, 46, 502–520. 10.1080/10408347.2016.1157013. [DOI] [PubMed] [Google Scholar]
- Akhter M. S.; Chughtai A. R.; Smith D. M. The structure of hexane Soot I: Spectroscopic Studies. Appl. Spectrosc. 1985, 39, 143–153. 10.1366/0003702854249114. [DOI] [Google Scholar]
- Fanning P. E.; Vannice M. A. A drifts study of the formation of surface groups on carbon by oxidation. Carbon 1993, 31, 721–730. 10.1016/0008-6223(93)90009-y. [DOI] [Google Scholar]
- Gerasymenko N.; Reyes R. P.; Espinosa M. Á. H.; Mora E. S.; Petranovskii V. The adsorbing properties of mesoporous silica/carbon composites prepared by direct carbonization of the template as the sole source of the carbon phase. Adv. Compos Lett. 2019, 28, 2633366X1989599. 10.1177/2633366x19895993. [DOI] [Google Scholar]
- Qu Z.; Leng R.; Wang S. H.; Ji Z. Y.; Wang X. K. Nanomaterials Derived from Metal–Organic Frameworks and Their Applications for Pollutants Removal. Rev. Environ. Contam. Toxicol. 2024, 262 (1), 12. 10.1007/s44169-024-00064-2. [DOI] [Google Scholar]
- Chen Z. S.; Li Y.; Cai Y. W.; Wang S. H.; Hu B. W.; Li B. F.; Ding X. D.; Zhuang L.; Wang X. K. Application of covalent organic frameworks and metal–organic frameworks nanomaterials in organic/inorganic pollutants removal from solutions through sorption-catalysis strategies. Carbon Research 2023, 2 (1), 8. 10.1007/s44246-023-00041-9. [DOI] [Google Scholar]
- Hameed B. H.; Din A. T. M.; Ahmad A. L. Adsorption of methylene blue onto bamboo-based activated carbon: Kinetics and equilibrium studies. J. Hazard. Mater. 2007, 141, 819–825. 10.1016/j.jhazmat.2006.07.049. [DOI] [PubMed] [Google Scholar]
- Zou W.; Bai H.; Gao S.; Li K. Characterization of modified sawdust, kinetic and equilibrium study about methylene blue adsorption in batch mode. Korean J. Chem. Eng. 2013, 30, 111–122. 10.1007/s11814-012-0096-y. [DOI] [Google Scholar]


