
Figure 3.
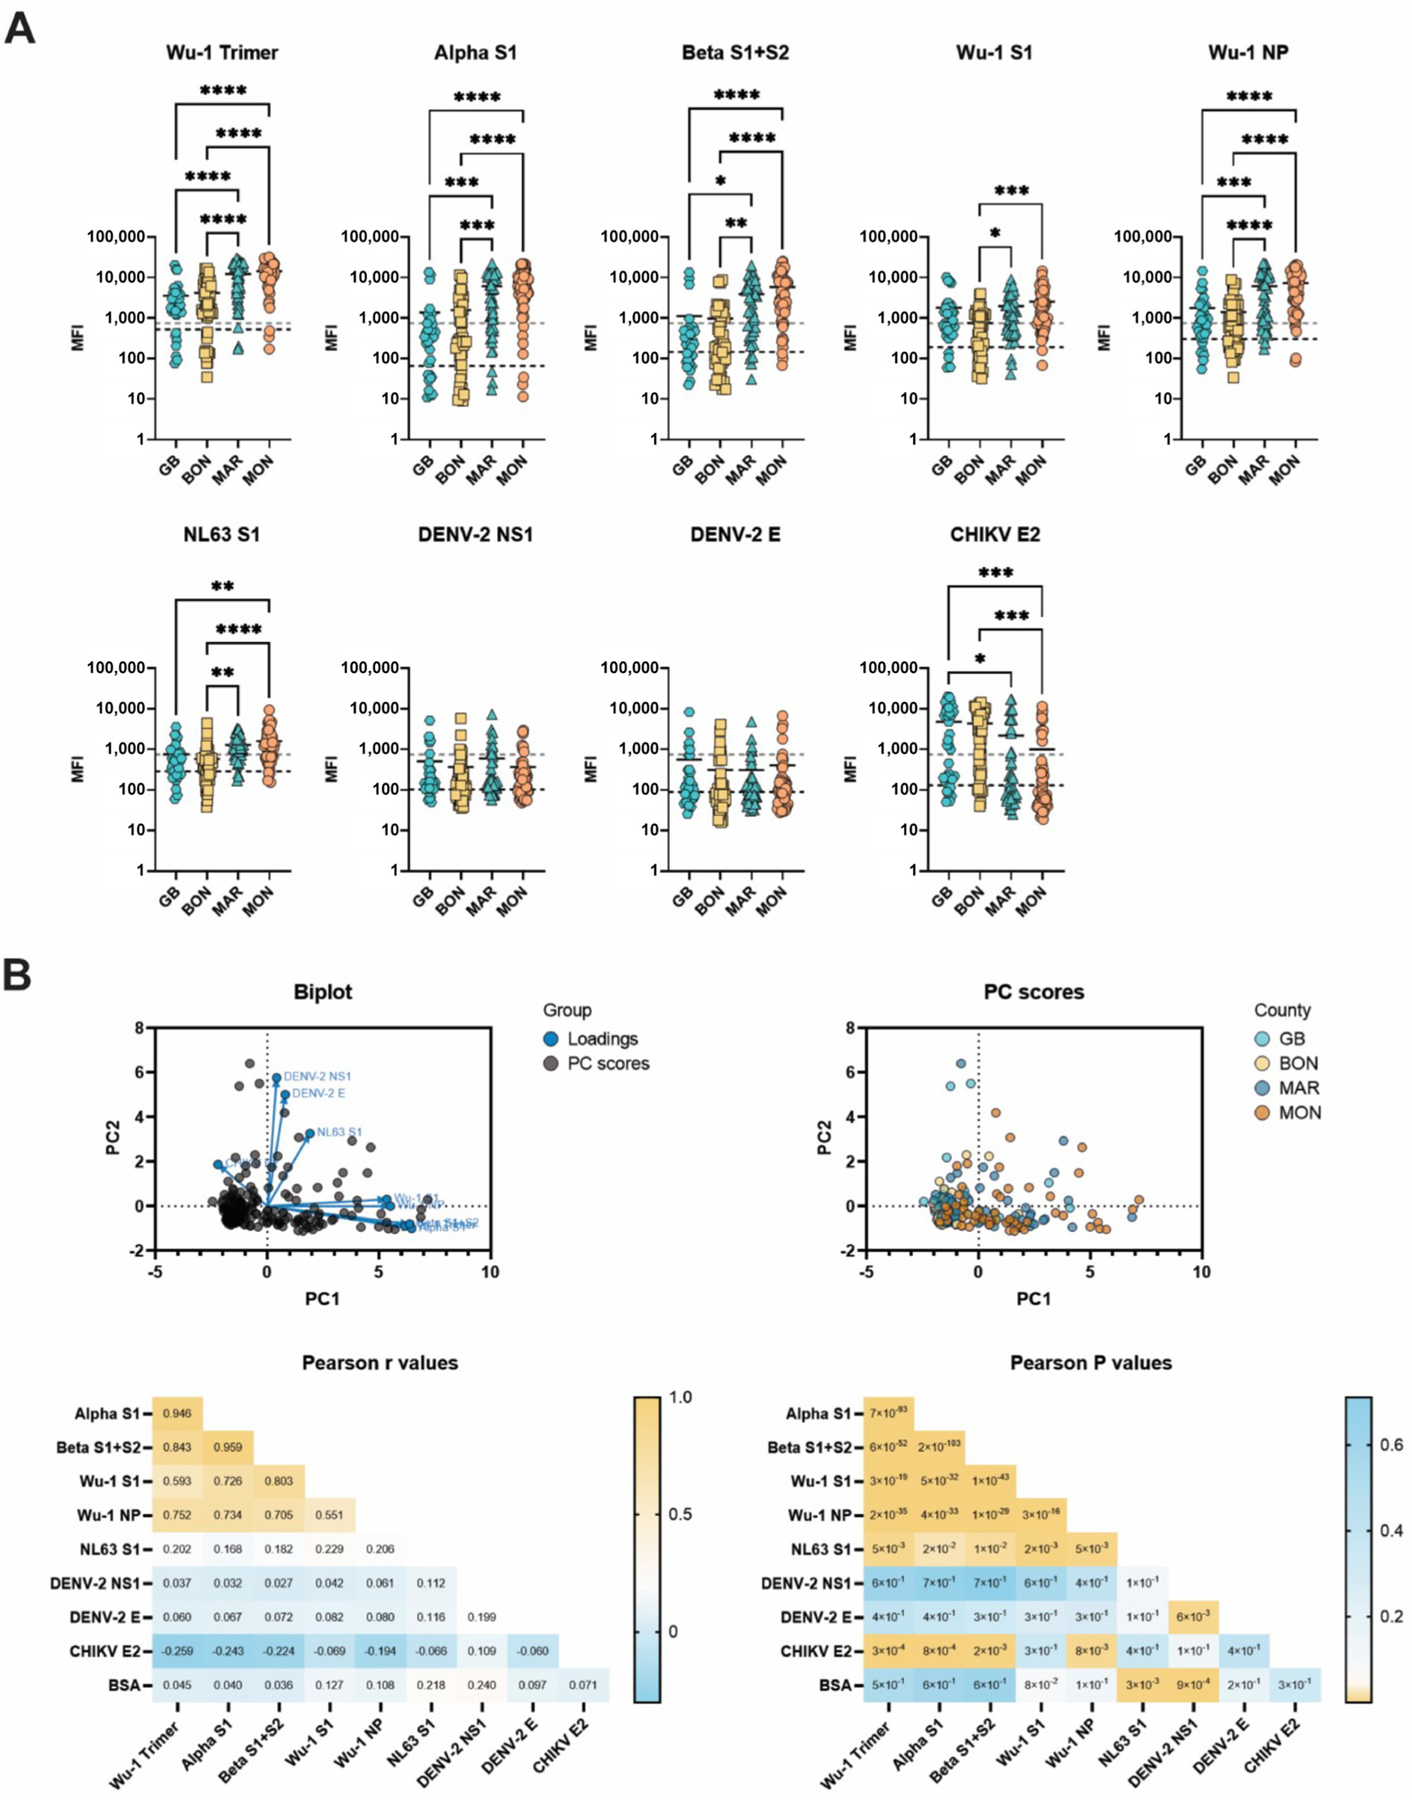
Analysis of serum reactivity in Liberia. (A) MIA of samples collected in Liberia. One-way ANOVA multiple comparison analysis. Grey lines indicate BSA cut-offs, and black lines indicate antigen cut-offs. (B) Principal component analysis of samples collected in Grand Bassa (GB), Bong (BON), Margibi (MAR), and Montserrado (MON) counties, Liberia (parallel analysis with 1000 simulations). Calculations completed in GraphPad Prism, Principal component analysis. * < 0.5, ** < 0.01, *** < 0.001, **** < 0.0001.