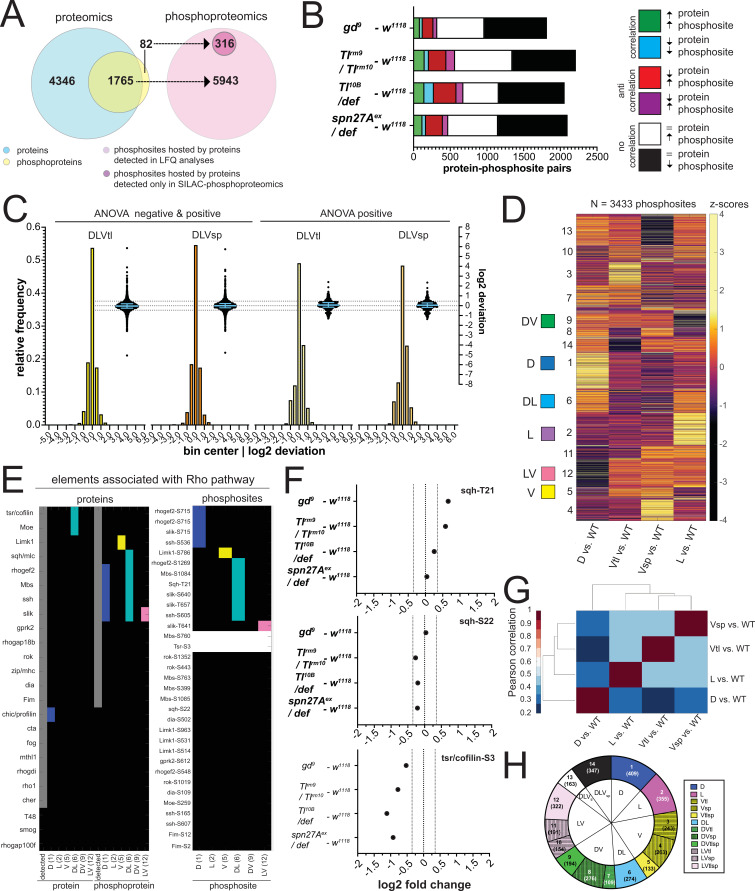
Figure 5. The phosphoproteomes of the mutant embryos.
(A) Match between detected protein groups in the proteomic and phosphoproteomic experiments. Left: light blue: protein groups detected in proteomes (LFQ); overlay between light blue and yellow: protein groups detected both in proteomic and phosphoproteomic experiments; non-overlapping yellow: protein groups not detected in proteomes but detected in phosphoproteomes. Right: pink: phosphosites hosted by a protein group detected in the proteomic analyses; magenta, phosphosites that could not be matched to a protein group detected in the proteomes. (B) Correlation between the fold changes (FCs) of phosphosites and their host proteins in DV mutants vs. wild type. Correlations: FC of protein and phosphosite are both positive (green) or negative (blue). Anti-correlation: FC of protein and phosphosite have different signs (red and magenta). No correlation: protein levels are unchanged but phosphosite FC is positive (white) or negative (black). Bars represent the number of phosphosite-host protein pairs falling in each correlation category within each DV mutant vs. wild type comparison. (C) Two different representations, a histogram and a swarm plot, of the deviation parameter (in log2 scale) calculated for each of the two ventralized genotypes (D: dorsalized, L: lateralized, Vtl: Toll10B/def, Vsp: spn27Aex/def). This was done once for all phosphosites present in all genotypes, and once only for those that were ANOVA positive. In the swarm plot, each dot represents a phosphosite. The y-axis for the histograms is shown on the left, for swarm plots on the right. Blue bars show the median with interquartile range (IQR). The median is close to zero and the IQRs range from –0.2387 to 0.3197. The dotted line indicates the 0.35 and –0.35 deviation in swarm plots. Histograms and swarm plots were assembled with phosphosites detected in all genotypes. (D) Clustergram of the hierarchical clustering of 3433 phosphosites. Z-scores were calculated using the thresholded fold changes between mutants and wild type. Coloured boxes indicate the clusters with consistent behavior for the two ventralising genotypes (for color-coding see Figure 3D). Numbers identify the different clusters for reference across panels, and are equivalent to the proteome (Figure 3B and C). (E) Detection and predicted regulation (DV clusters) of Rho pathway proteins and phosphoproteins (left panel) and the corresponding phosphosites (right panel). Colors mark proteins, phosphoproteins or phosphosites in DV clusters with ventralized consistent behavior(DV clusters 1, 2, 5, 6, 9, and 12). Gray boxes represent the detection of a particular protein or phosphoprotein in the wild type genotype. White boxes represent an increased or decreased abundance in all DV mutants vs. wild type. (F) log2 fold changes (FC) of known phosphosites in sqh: T21 (top) and S22 (center) and tsr/cofilin S3 (bottom). Dotted lines indicate log2 FC = 0, 0.35 and –0.35. Colors depict DV mutant genotypes and their corresponding comparisons against wild type: blue: dorsalized, magenta: lateralized, yellow: ventralized (Toll10B/def and spn27Aex/def). Bars depict mean and standard error of the mean across replicates. Absence of a dot indicates the protein was not detected in a particular condition or log2 FC calculation not feasible, absence of error bars in log2 intensity indicate protein was detected in a single replicate. Dotted line indicates log2 FC = 0 and log2 FC = 0.35 (for phosphosites). (G) Correlation matrices using Pearson correlation coefficient between the fold changes of each mutant vs. wild type comparison in the phosphoproteome experiment. (H) Pie chart showing the number of phosphosites allocated to each DV class in (C).

