

Abstract
Problem
Breast cancer is a leading global health issue, contributing to high mortality rates among women. The challenge of early detection is exacerbated by the high dimensionality and complexity of gene expression data, which complicates the classification process.
Aim
This study aims to develop an advanced deep learning model that can accurately detect breast cancer using RNA-Seq gene expression data, while effectively addressing the challenges posed by the data’s high dimensionality and complexity.
Methods
We introduce a novel hybrid gene selection approach that combines the Harris Hawk Optimization (HHO) and Whale Optimization (WO) algorithms with deep learning to improve feature selection and classification accuracy. The model’s performance was compared to five conventional optimization algorithms integrated with deep learning: Genetic Algorithm (GA), Artificial Bee Colony (ABC), Cuckoo Search (CS), and Particle Swarm Optimization (PSO). RNA-Seq data was collected from 66 paired samples of normal and cancerous tissues from breast cancer patients at the Jawaharlal Nehru Cancer Hospital & Research Centre, Bhopal, India. Sequencing was performed by Biokart Genomics Lab, Bengaluru, India.
Results
The proposed model achieved a mean classification accuracy of 99.0%, consistently outperforming the GA, ABC, CS, and PSO methods. The dataset comprised 55 female breast cancer patients, including both early and advanced stages, along with age-matched healthy controls.
Conclusion
Our findings demonstrate that the hybrid gene selection approach using HHO and WO, combined with deep learning, is a powerful and accurate tool for breast cancer detection. This approach shows promise for early detection and could facilitate personalized treatment strategies, ultimately improving patient outcomes.
Keywords: Breast cancer, Harris Hawk algorithm, Whale optimization algorithm, Deep learning
Introduction
Breast cancer is one of the most common cancers globally, particularly among women, and remains the leading cause of cancer-related mortality (Dewangan 2022; Yaqoob et al. 2024a). Despite significant advancements in medical research and treatment, breast cancer continues to pose a major global health challenge. In 2020 alone, there were approximately 2.3 million new cases of breast cancer, resulting in 685,000 deaths worldwide (Dewangan et al. 2022; Yaqoob 2024). These alarming statistics highlight the pressing need for improved diagnostic tools that can detect breast cancer at its earliest stages, enabling timely intervention and enhancing survival rates. Early detection is key to reducing mortality and improving treatment efficacy. Traditional diagnostic techniques such as mammography, ultrasound, and biopsy, while widely used, have limitations in sensitivity, specificity, and invasiveness (Mohammed et al. 2023a). As a result, there is growing interest in leveraging molecular data, particularly gene expression profiles, to develop more accurate and less invasive diagnostic methods. RNA-Seq technology provides a high-resolution view of the transcriptome, offering valuable insights into the molecular mechanisms driving cancer progression. However, the vast amount of data generated by RNA-Seq presents challenges in high dimensionality and complex data structures, requiring advanced computational methods for effective feature selection and classification (Ali and Mohammed 2023). The conventional RNA-Seq workflow involves several steps, including RNA extraction, conversion into complementary DNA (cDNA), sequencing, alignment of reads to a reference genome, and gene expression analysis for cancer classification (Mohammed et al. 2023b). Researchers must carefully consider experimental factors, such as biological and technical replicates, sequencing depth, and transcriptome coverage to achieve high-quality results (Yaqoob et al. 2023a). To address the challenges of generalized cancer classifiers, this study proposes a feature learning approach that combines unsupervised learning with deep learning techniques (Mohammed et al. 2023c). Specifically, a sparse autoencoder is used to generate a concise feature representation from unlabeled data. Deep learning algorithms are increasingly employed in computer-aided detection (CAD) systems for cancer diagnosis. Feature extraction is crucial before applying deep learning algorithms. While various methods have been explored for different imaging techniques and cancer types, machine learning techniques primarily focus on feature descriptors from clinical images. These methods have limitations that impede further CAD system improvements. Representation learning has become more prominent than feature engineering, addressing these limitations and improving system performance. AI algorithms offer promising solutions for cancer screening by analyzing vast amounts of multimodal data, uncovering hidden signals, and automating follow-up protocols and medical parameters. AI and machine learning (ML) techniques have advanced precision oncology by generating genetic data and deepening our understanding of tumor biology (Yaqoob et al. 2023b). However, addressing disparities in cancer diagnosis, treatment, survivability, and patient well-being remains a challenge. Patients facing social adversity often experience higher costs, accessibility issues, and potential biases in AI and ML models, which can exacerbate existing disparities in cancer treatment. Fully realizing AI and ML’s potential requires identifying and addressing biases contributing to these disparities. Among the most widely used deep learning techniques for image prediction and classification is the convolutional neural network (CNN), which can learn significant image features such as size, shape, and intensity. While several studies have used ML to extract radiomic features for predicting pathological complete response (PCR), few have leveraged deep learning techniques to predict PCR using whole dynamic contrast-enhanced (DCE) MRI, non-imaging clinical data, and multiple time points during diagnosis (Towfek et al. 2024; Karaman et al. 2023a). Additionally, there have been limited studies employing deep learning models to predict progression-free survival (PFS) and residual cancer burden (RCB). This research aims to develop a probability-based computational model for predicting cancer recurrence and drug response using RNA-sequencing data. The study consists of four key components: (1) acquiring and preparing RNA-sequencing data, (2) implementing a probabilistic dimensionality reduction model, (3) developing a classification algorithm that integrates deep learning, and (4) assessing the stability and optimization of the model. Existing approaches to gene selection and classification, such as Genetic Algorithm (GA), Artificial Bee Colony (ABC), Cuckoo Search (CS), and Particle Swarm Optimization (PSO), often struggle with high dimensionality and nonlinear relationships in gene expression data. These algorithms exhibit limitations such as premature convergence and suboptimal feature selection, particularly in large-scale datasets. This hinders the effectiveness of machine learning models in accurately classifying breast cancer. To address these challenges, we propose a novel hybrid gene selection approach that integrates Harris Hawk Optimization (HHO) and Whale Optimization (WO) algorithms with deep learning. The HHO algorithm is known for its robust exploration and exploitation capabilities, essential for avoiding local optima, while the WO algorithm excels in global search, mimicking the foraging behavior of humpback whales. By combining these two nature-inspired algorithms, our approach ensures efficient and accurate selection of informative genes from high-dimensional RNA-Seq datasets. The integration of deep learning with HHO and WO-based gene selection enhances the ability to capture complex patterns and interactions in gene expression data. Deep learning models, particularly neural networks, have shown remarkable performance in classification tasks due to their ability to automatically learn hierarchical representations from large datasets. By leveraging the reduced feature space through HHO and WO-based gene selection, deep learning improves classification accuracy while reducing overfitting and computational complexity. In this study, we apply our hybrid gene selection and deep learning approach to RNA-Seq data from breast cancer patients at various stages (Yaqoob et al. 2024b). The dataset, comprising paired samples of normal and cancerous tissues, provides a robust platform for testing our model’s efficacy. By comparing the proposed method with conventional optimization algorithms (GA, ABC, CS, and PSO) integrated with deep learning, we demonstrate that our approach consistently outperforms existing methods in classification accuracy. This research contributes to the ongoing efforts in breast cancer diagnosis by providing a novel, efficient, and accurate tool for early detection. The proposed hybrid approach has the potential to enhance breast cancer diagnosis, paving the way for personalized treatment strategies and improved patient outcomes (Abdollahzadeh et al. 2024; Towfek et al. 2024; Karaman et al. 2023b).
Main contributions:
Development of a hybrid gene selection approach: Introduced a novel method that integrates Harris Hawk Optimization (HHO) and Whale Optimization (WO) algorithms with deep learning for improved gene selection in RNA-Seq data.
Enhanced classification accuracy: Demonstrated that the proposed hybrid approach significantly outperforms conventional optimization algorithms (Genetic Algorithm, Artificial Bee Colony, Cuckoo Search, and Particle Swarm Optimization) in terms of classification accuracy.
High performance on breast cancer data: Achieved a mean classification accuracy of 99.0% using RNA-Seq data from breast cancer patients, including various stages and age-matched healthy controls.
Effective handling of high-dimensional data: Addressed the challenges posed by the high dimensionality and complexity of gene expression data, leading to more accurate and reliable breast cancer detection.
Potential for personalized treatment: Provided a robust tool that could facilitate personalized treatment strategies by enabling early and precise detection of breast cancer. Figure 1 provides an overview of the RNA-Seq process.
Fig. 1.

Workflow of the steps followed in the study
Problem statement and research objectives
The problem addressed in this study is the challenge of accurately detecting breast cancer due to the high dimensionality and complexity of RNA-Seq gene expression data. Traditional gene selection methods struggle with premature convergence and inefficient feature selection, leading to suboptimal classification accuracy. These limitations hinder the development of precise and non-invasive diagnostic tools for early breast cancer detection, which is critical for improving patient outcomes (Yaqoob et al. 2023c).
The primary objective of this study is to develop and evaluate a deep learning model for breast cancer detection that incorporates the HHWO-based hybrid gene selection approach. Specifically, we aim to:
Develop a deep learning architecture: Tailored for analyzing RNA-Seq gene expression data, capable of learning complex patterns and interactions between genes.
Implement the HHWO algorithm: To effectively select a subset of genes that contribute most significantly to the classification of breast cancer, reducing the dimensionality of the data and enhancing model performance.
Conduct comparative analysis: Evaluate the proposed model against five conventional optimization algorithms—Genetic Algorithm (GA), Artificial Bee Colony (ABC), Cuckoo Search (CS), and Particle Swarm Optimization (PSO)—each integrated with deep learning, to assess the relative performance of the HHWO-based approach.
Assess model performance: Through rigorous experimentation, measure the classification accuracy, precision, recall, and F1-score of the proposed model, and compare these metrics with those of the baseline methods.
Motivation and importance of the study
Breast cancer remains a critical global health concern, accounting for a significant number of deaths among women worldwide. Despite advancements in medical research, early detection of breast cancer continues to be a challenging task due to the high-dimensional nature and complexity of gene expression data (Karaman et al. 2023c). Traditional methods of analysis often struggle to navigate this complexity, leading to suboptimal results in classification accuracy. There is an urgent need for more advanced, efficient approaches that can handle the intricacies of gene expression data, enabling more precise and timely detection of breast cancer. The advent of deep learning and optimization algorithms offers new opportunities to address these challenges. By leveraging the power of hybrid optimization techniques, such as the Harris Hawk Optimization (HHO) and Whale Optimization (WO) algorithms, combined with deep learning, it becomes possible to improve the feature selection process, reduce dimensionality, and enhance classification accuracy. Such innovative approaches not only promise to detect breast cancer more effectively but also hold the potential to revolutionize personalized treatment strategies, improving survival rates and overall patient outcomes. In this context, the development of a robust hybrid model for gene selection and classification presents a highly relevant and timely solution. This study seeks to address these pressing challenges by introducing a novel method that demonstrates superior performance compared to conventional algorithms, ultimately advancing the field of breast cancer diagnosis and treatment.
Organization of the paper
The remainder of this paper is structured as follows: “Related work” provides a review of related work in the field of breast cancer detection using gene expression data and optimization algorithms. “Methodology” describes the methodology, including the deep learning architecture, the HHWO algorithm, and the experimental setup. “Algorithm efficiency” presents the results of the comparative analysis and discusses the findings in detail. Finally, “Results and discussion” concludes the paper with a summary of the key contributions and suggestions for future research.
Gene expression data and the challenge of high dimensionality
Gene expression data, derived from techniques like RNA-Seq, have revolutionized our understanding of cancer biology by enabling the comprehensive analysis of gene activity across different cancer types. In breast cancer, these data have the potential to identify specific gene signatures that can serve as biomarkers for early detection, prognosis, and treatment response. However, one of the primary challenges associated with gene expression data is the high dimensionality—the number of genes (features) often far exceeds the number of samples (patients). This imbalance poses a significant hurdle for traditional machine learning algorithms, which can struggle with overfitting, reduced generalization capabilities, and increased computational complexity (Fang et al. 2019). Feature selection is a critical step in addressing the high dimensionality of gene expression data. By selecting a subset of relevant features (genes) that contribute most to the classification task, researchers can reduce the dimensionality of the data, thereby improving the performance and interpretability of the model. Traditional feature selection methods, such as filter-based approaches, often rely on statistical measures to rank features independently of the learning algorithm. While these methods are computationally efficient, they may overlook complex interactions between genes that are crucial for accurate classification (Aziz 2022; Stoean 2020; El-kenawy et al. 2024).
Deep learning in cancer detection
In recent years, deep learning has emerged as a powerful tool for various applications in biomedical research, including cancer detection and diagnosis. Deep learning models, particularly convolutional neural networks (CNNs) and recurrent neural networks (RNNs), have demonstrated remarkable performance in image analysis, natural language processing, and sequence prediction tasks. In the context of cancer detection, deep learning models have been employed to analyze medical images, histopathological slides, and molecular data, often outperforming traditional machine learning approaches (Kalidindi and Arrama 2023). Deep learning’s ability to automatically learn hierarchical representations of data makes it particularly well-suited for analyzing complex and high-dimensional datasets like RNA-Seq gene expression profiles. However, the success of deep learning models in cancer detection depends heavily on the quality of the input features. Without effective feature selection, the model may be overwhelmed by irrelevant or redundant features, leading to suboptimal performance (Dashtban and Balafar 2017).
Hybrid optimization algorithms for feature selection
To address the challenges associated with feature selection in high-dimensional gene expression data, researchers have explored various optimization algorithms. These algorithms are designed to identify the most relevant subset of features that contribute to accurate classification (AlMazrua and AlShamlan 2022). Among the most promising approaches are hybrid optimization algorithms, which combine the strengths of multiple optimization techniques to achieve superior performance. In this study, we introduce a novel hybrid gene selection approach that integrates the Harris Hawk Optimization (HHO) algorithm with the Whale Optimization Algorithm (WOA), referred to as HHWO. HHO is inspired by the cooperative hunting strategies of Harris hawks, and it has shown promise in various optimization tasks due to its balance between exploration and exploitation (Alabool et al. 2021; Chaudhuri and Sahu 2021). WOA, on the other hand, is inspired by the bubble-net hunting strategy of humpback whales and is known for its ability to explore the search space efficiently. By combining these two algorithms, HHWO aims to leverage the strengths of both, resulting in a robust and effective feature selection method. Figure 1 illustrates the workflow followed by the study (Naruei and Keynia 2021; Agrawal et al. 2021).
Related work
Our research centred on the application of machine learning and deep learning techniques for breast cancer detection. We reviewed around 63 recent papers focused on breast cancer diagnosis and treatment. Some studies examined deep learning exclusively, while others explored a blend of machine learning and deep learning methods. To ensure a systematic and comprehensive approach, we followed the Recommended Reporting Items (PRISMA) methodology, which involves four main stages: identification, screening, eligibility assessment, and inclusion. During the identification phase, we conducted searches using pertinent keywords such as “breast cancer with deep learning” and “machine learning” (Yaqoob et al. 2024b). Furthermore, we utilized a snowballing technique to uncover supplementary relevant literature by scrutinizing the references of selected articles. After identification, we conducted a screening process to evaluate the relevance of each article according to predefined inclusion criteria, eliminating duplicates and those not meeting our criteria. During the eligibility phase, we assessed the quality and relevance of each eligible article based on scientific rigor and methodology, excluding those that did not meet our standards for quality. Lastly, in the inclusion phase, we selected the definitive set of articles that met all inclusion criteria for inclusion in our review.
We employed the PRISMA methodology to guarantee a thorough and methodical examination of various categories of machine learning systems. This approach facilitated the identification and assessment of a top-tier collection of articles, offering valuable and pertinent insights into the realm of machine learning. Figure 2 shows the diagrammatic view of this PRISMA methodology (Yaqoob et al. 2023b).
Fig. 2.

Depicts the systematic process employed for conducting a literature review
Figure 3 depicts the distribution of publications from 2015 to 2024, highlighting peaks in breast cancer research publications around 2020 and 2023. To streamline our analysis, we selected 45 papers that specifically utilized genetic expression and imaging techniques, focusing exclusively on journal and conference articles. The imaging methods examined included ultrasound, radiography, mammography, magnetic resonance imaging (MRI), as well as various gene expression and sequencing techniques. Our study focused on papers employing AI methods for breast cancer detection and prediction, integrating gene data and imaging modalities.
Fig. 3.

Publication from the year 2015–2024 based on breast cancer with deep learning, machine learning
Sahu proposed a hybrid approach combining the Self-Variant Genetic Algorithm (SVGA) with the Return Cost-Based Firefly Algorithm (RCBFA) to leverage the strengths of both methods when applied to microarray cancer datasets (Sahu and Dash 2024a). Shu et al. introduced a semi-supervised feature selection method using information gain, enhancing classification accuracy by incorporating both labeled and unlabeled data. Tested on ten UCI datasets, their approach outperformed existing feature selection techniques (Shu et al. 2023). Pashaei et al. introduced BCOOT, a novel gene selection strategy using the binary COOT optimization algorithm. They developed three variants—BCOOT, BCOOT-C, and BCOOT-CSA—with BCOOT-CSA incorporating simulated annealing for enhanced performance. Evaluated on microarray datasets, BCOOT-CSA outperformed other methods in prediction accuracy and gene selection (Pashaei and Pashaei 2023). Sowan et al. developed a breast cancer classification method combining ensemble filter and wrapper feature selection with an Ant Colony (AC) approach. Using a novel bootstrapping search and WARF-based filter method, their approach achieved superior performance on UCI breast cancer datasets, outpacing established AC algorithms in effectiveness (Sowan et al. 2023). Sahu introduces a hybrid multifilter-ensemble machine-learning model that combines the Grey Wolf Optimizer (GWO) with Recurrent Neural Network (RNN) and Long Short-Term Memory (LSTM) classifiers for classifying microarray cancer datasets (Sahu and Dash 2024b). Ramezani et al. used a hybrid feature selection approach, combining multiple filter methods and evaluating subsets with a deep Long Short-Term Memory network. Their results showed that Neighbourhood Components Analysis was the most effective for selecting the optimal feature subset (Ramezani et al. 2022). Marik et al. introduced a two-stage hybrid deep feature selection (HDFS) framework for speech-based emotion recognition. It combines a Wide-ResNet-50-2 model for feature extraction with fuzzy entropy, similarity-based ranking, and Whale optimization for feature selection. A k-nearest neighbor classifier is then used for emotion classification. The approach, validated on three SER datasets, significantly outperformed existing methods (Marik et al. 2023). Sahu and Dash develop a novel computer-aided diagnostic tool, JMR-CR, which uses joint mutual information for feature selection and the waterfall Grey Wolf Optimization algorithm for optimal feature identification, evaluated with Support Vector Machine (SVM) and K Nearest Neighbor (KNN) classifiers to predict cancer biomarkers (Sahu and Dash 2024c). Alhenawi et al. developed a hybrid feature selection method for microarray data, combining an ensemble filter with an Improved Intelligent Water Drop (IIWD) algorithm. Enhanced by three local search algorithms (Tabu Search, Novel LS Algorithm, and Hill Climbing), the method significantly improved F-scores and accuracy on microarray datasets. PHFS-IWDNLSA showed the most notable performance, boosting accuracy by 8.92% and reducing gene count by 58.5%, outperforming recent state-of-the-art methods (Alhenawi et al. 2021). Arun et al. introduced a hybrid feature selection method combining statistical filters (Chi-Square, Pearson’s Correlation, Mutual Information) with the NSGA-II algorithm. Applied to the ToN-IoT dataset, this approach selected 13 optimized features and achieved a high accuracy of 99.48%, outperforming state-of-the-art techniques (Dey et al. 2023). Houssein et al. developed a modified Hunger Games Search algorithm (mHGS) for optimization and feature selection. This enhanced version improves local search, prevents premature convergence, and balances exploration and exploitation. Tested on various datasets, mHGS outperformed existing methods, boosting search efficiency and SVM classification performance while maintaining computational efficiency (Houssein et al. 2023). Vijaya Kumar and Mahammad Shafi introduced a face detection framework using the R-FCN architecture with a novel position-sensitive pooling layer for efficient region prediction. Optimized with a hybrid GE-GWO algorithm, the method demonstrated superior performance on the WIDER face dataset, surpassing existing techniques in precision, recall, and ROC curve by 1.5–4.2% (Vijaya Kumar and Mahammad Shafi 2023). Sun et al. introduced HECSPSO, a hybrid feature selection algorithm combining simplified PSO with an elite strategy. Key enhancements include optimized population initialization, an elite strategy for feature selection, faster convergence, and a chaotic local search mechanism. Tested on 16 UCI datasets, HECSPSO outperformed other PSO-based algorithms in classification accuracy, feature subset size, and convergence efficiency (Sun et al. 2023). Sahu et al. present a wrapper-based hybrid model combining Information Gain (IG) and the Jaya Algorithm (JA) for selecting optimal gene subsets from high-dimensional microarray datasets. The study is conducted in two stages: initially, JA identifies featured gene subsets, followed by a hybrid IG-JA model where IG filters redundant features and JA refines the subset for improved classifier performance (Sahu and Dash 2024b). Amrutanshu et al. present an ML-based ensemble model that employs Minimum Redundancy Maximum Relevance (MRMR) for feature selection, utilizes the Whale Optimization Algorithm (WOA) to optimize feature selection from microarray data, and integrates Support Vector Machine, Decision Tree, Multilayer Perceptron, and Random Forest classifiers, culminating in a Voting ensemble technique for cancer prediction (Sahu and Dash 2024c).
Table 1 provides a detailed comparison of several feature selection algorithms used in the study, outlining their key characteristics. These characteristics include the Algorithm, Methodology, Classifier, Feature Size, Objective Functions, and Limitations. The table offers a comprehensive overview of each algorithm’s approach to feature selection, highlighting how they differ in terms of methodology, optimization strategies, and the machine learning classifiers they integrate with for breast cancer classification.
Table 1.
Comparison of various feature selection algorithms
| Author (s)/references | Year | Classifier(s) | Domain/field | Description/outcomes |
|---|---|---|---|---|
| Lorencin et al. (2019) | 2020 | Convolutional neural network | Bladder cancer diagnosis | Creating a convolutional neural network through the application of deep learning methods for the detection of urinary bladder cancer |
| (Soares et al. (2017) | 2017 | SVM | Colorectal cancer diagnosis | Identifying colorectal cancer using a hierarchical classification approach employing plasma fluorescence |
| Shirwaikar et al. (2018) | 2019 | MLP | Neonatal apnea classification | Enhancing the effectiveness of a multilayer perceptron (MLP) applying an incremental optimization algorithm |
| Hosseini et al. (2018) | 2018 | SVM | Electroencephalogram (EEG) classification | Proposing a random subspace ensemble approach tailored for Support Vector Machines (SVMs) with the intention of tackling big data challenges in a simultaneous manner |
| Khandezamin et al. (2020) | 2020 | Logistic regression, GMDH | Breast cancer diagnosis | Introducing a combined model that integrates logistic regression with the GMDH neural network for the purpose of diagnosing breast cancer |
| Gopal et al. (2020) | 2021 | PCA, MLP | Breast cancer diagnosis | Creating a method for achieving an early detection of breast cancer through a systematic approach |
| Punitha et al. (2020) | 2021 | IAIS-ABC-CDS, ANN | Breast cancer diagnosis | Presenting a diagnostic algorithm for breast cancer leveraging principles from artificial immune systems (AIS) and artificial bee colony (ABC) techniques. The primary objective of this algorithm is to enhance the efficiency of feature selection and parameter optimization within artificial neural networks |
| Punitha et al. (2020) | 2021 | VBFW | COVID-19 diagnosis | Creating a method for assigning weights using the Variance Based Feature Weighting technique |
| Angeli et al. (2021) | 2021 | Convolutional neural network (CNN) | Cancer types classification | Enhancing the TextCNN’s effectiveness in classifying cancer pathology by adapting it to out-of-distribution datasets |
| Lamy et al. (2019) | 2019 | Case-Based Reasoning (CBR) | Breast cancer diagnosis | Suggesting a case-based reasoning system that is both visual and explainable, merging quantitative and qualitative methodologies |
| Reis and Turk (2022) | 2022 | Deep convolutional neural networks | Coronavirus detection | Creating a sophisticated convolutional neural network for the diagnosis of COVID-19 and regular pneumonia cases |
Additionally, it presents the number of features each algorithm selects, the specific objective functions they aim to optimize (such as accuracy, precision, or feature relevance), and any limitations they may have, such as computational complexity or suboptimal performance on certain datasets. This comparison serves as a valuable reference for understanding the strengths and weaknesses of different feature selection techniques in the context of breast cancer gene expression data, helping to identify the most suitable approach for improving classification accuracy.
Methodology
In this section, we have discussed several key techniques for feature selection and optimization, focusing on mRMR (Minimal Redundancy Maximum Relevance), Harris Hawk Optimization (HHO), and Whale Optimization Algorithm (WOA), as well as the proposed hybrid method, mRMR-HHWO.
mRMR (minimal redundancy maximum relevance)
mRMR (Minimal Redundancy Maximum Relevance) is a widely used feature selection technique that aims to identify the most relevant features in a dataset while minimizing redundancy among them. It operates by selecting features that have the highest correlation with the target variable (maximum relevance) and the lowest correlation with each other (minimal redundancy). This balance ensures that the selected features provide unique and complementary information for the predictive model, enhancing its accuracy and generalizability. mRMR is particularly effective in high-dimensional datasets, such as gene expression data, where reducing the feature space without losing significant information is crucial. By focusing on features that contribute the most to the predictive power of a model while avoiding redundancy, mRMR helps in constructing more efficient and interpretable models (Ali and Saeed 2023).
Harris Hawk optimization (HHO)
Harris Hawk Optimization (HHO) is a nature-inspired metaheuristic algorithm designed for solving complex optimization problems. It mimics the cooperative hunting strategies of Harris hawks in the wild, where they use various tactics to catch prey. In the HHO algorithm, candidate solutions represent hawks, and the optimization process simulates their dynamic hunting behaviors, including surprise pounce, soft besiege, and hard besiege phases. These strategies help balance exploration and exploitation in the search space, enabling the algorithm to effectively converge on optimal or near-optimal solutions. HHO has been successfully applied to various fields, including feature selection, engineering design, and machine learning, where it has shown strong performance in finding high-quality solutions with fewer iterations. Its adaptability and efficiency make it a popular choice for tackling complex optimization tasks (Heidari et al. 2019).
Whale optimization algorithm (WOA)
The Whale Optimization Algorithm (WOA) is a bio-inspired metaheuristic algorithm developed for solving optimization problems by simulating the unique hunting behavior of humpback whales. Specifically, WOA models the bubble-net hunting strategy, where whales create bubble spirals to encircle and capture prey. In the algorithm, candidate solutions represent whales, and the optimization process mimics the encircling, bubble-net attacking, and searching for prey behaviors. WOA efficiently balances exploration (searching for global optima) and exploitation (refining existing solutions) by dynamically adjusting the position of the whales in the search space. This flexibility allows WOA to effectively converge on optimal or near-optimal solutions. Due to its simplicity, robustness, and strong convergence properties, WOA has been widely applied in various domains, including feature selection, engineering design, and machine learning, where it has demonstrated superior performance in handling complex optimization tasks (Hamad et al. 2023).
Proposed method (mRMR-HHWO)
We propose a novel hybrid gene selection approach that integrates the Harris Hawk Optimization (HHO) and Whale Optimization (WO) algorithms with deep learning to enhance feature selection and classification accuracy. This approach leverages the strengths of both HHO and WO algorithms, balancing exploration and exploitation phases during optimization. The model was evaluated against five conventional optimization techniques combined with deep learning: Genetic Algorithm (GA), Artificial Bee Colony (ABC), Cuckoo Search (CS), and Particle Swarm Optimization (PSO). RNA-Seq data, consisting of 66 paired samples of normal and cancerous tissues, was collected from breast cancer patients at the Jawaharlal Nehru Cancer Hospital & Research Centre, Bhopal, India, and sequenced by Biokart Genomics Lab, Bengaluru, India. This hybrid method demonstrated superior performance in comparison to traditional approaches, showcasing its effectiveness in gene selection and classification tasks.
In the context of simulating hawks and prey in a hunting scenario, several key parameters, such as the prey’s initial energy (E0), jump strength (J), and energy (E), are used, with energy decreasing linearly over time. The rabbit’s zig-zag random movements, represented as Lévy flights, serve as a strategy to evade the hawks. Although Lévy flights help generate random movements, they are limited in avoiding local minima due to their dependence on the current best solution. This limitation can restrict the algorithm’s ability to thoroughly explore the search space, potentially affecting solution quality. In contrast, the Whale Optimization Algorithm (WOA), known for its enhanced convergence and exploitation capabilities, offers a promising alternative by effectively avoiding local optima and achieving better results in various optimization scenarios.
Given these considerations, incorporating an ensemble approach, where multiple models with different parameter settings or methodologies are combined, could further enhance the performance. However, the computational cost of such an ensemble strategy must be carefully weighed against its potential benefits. Ultimately, selecting the most suitable optimization technique for gene selection depends on a detailed evaluation of each algorithm’s strengths and limitations within the specific context of the problem.
Exploration phase
During the exploration phase, the HHWO algorithm actively searches the solution space for diverse gene subsets. The Harris Hawk Optimization (HHO) component plays a crucial role in this phase by employing a variety of strategies, such as sudden dives and soft besiege tactics, to diversify the search process. This ensures that the algorithm does not get trapped in local optima early in the search, thereby enabling it to effectively explore the vast, high-dimensional landscape of gene expression data. Additionally, the Whale Optimization Algorithm (WOA) augments this phase by incorporating encircling and bubble-net attacking mechanisms, which further enhance the algorithm’s ability to sample diverse areas of the solution space.
Exploitation phase
In the exploitation phase, the algorithm transitions to refining the candidate solutions identified during the exploration phase. The HHWO algorithm narrows down its focus to fine-tune the promising gene subsets, leveraging the WOA’s spiral updating position and shrinking encircling mechanism. These techniques allow the model to converge on optimal or near-optimal gene subsets, ensuring that the selected genes contribute significantly to the classification accuracy. The integration of HHO’s dynamic adjustment of exploration and exploitation intensities also enables the model to maintain a balance between converging towards the best solution and avoiding premature convergence.
This dual-phase strategy of exploration and exploitation within the HHWO framework ensures that the deep learning model is equipped with the most relevant and informative gene subsets, ultimately leading to enhanced classification accuracy and robustness in breast cancer detection.
Computational requirements and scalability of the proposed model for large-scale deployment
Computational requirements
- Hardware specifications
-
oProcessing power: The deep learning model incorporating the hybrid gene selection approach requires high-performance computing resources. Specifically, a multi-core CPU or GPU is recommended for efficient processing. For example, using NVIDIA GPUs with CUDA support can significantly speed up the training and inference phases.
-
oMemory: Adequate RAM is essential for handling large-scale RNA-Seq datasets and model computations. A minimum of 16 GB of RAM is recommended, with 32 GB or more being ideal for handling high-dimensional data and extensive training processes.
-
oStorage: Sufficient storage space is necessary for managing large RNA-Seq datasets and model checkpoints. Depending on the dataset size, several terabytes of storage may be required.
-
o
- Software specifications:
-
oDeep learning frameworks: The model can be implemented using popular deep learning frameworks such as TensorFlow, PyTorch, or Keras. These frameworks support GPU acceleration and are optimized for handling large-scale neural network training.
-
oData processing tools: Tools for data preprocessing and feature selection, such as Pandas, NumPy, and Scikit-learn, are essential for managing and preparing the data before feeding it into the deep learning model.
-
o
Scalability
Dataset expansion.
Scalability to larger datasets: The proposed hybrid model is designed to handle large-scale datasets efficiently. With appropriate hardware resources, the model can be scaled to accommodate larger RNA-Seq datasets, potentially from more extensive cohorts or different cancer types.
Data preprocessing: As the dataset size increases, preprocessing steps such as normalization, dimensionality reduction, and feature selection will need to be optimized to manage computational load effectively.
Algorithm efficiency.
Parallelization: The use of GPUs and multi-threading can enhance the efficiency of both the Harris Hawk Optimization (HHO) and Whale Optimization (WO) algorithms, making them more suitable for large-scale data. Parallel processing can speed up the computation of the hybrid gene selection approach and the subsequent deep learning model training.
Model optimization: Techniques such as batch processing, distributed training, and model pruning can be employed to further optimize the model’s performance and resource usage. These methods help manage computational demands and improve scalability.
Deployment considerations.
Cloud computing: For large-scale deployment, cloud-based platforms such as AWS, Google Cloud, or Azure offer scalable resources that can be adjusted based on the computational needs. These platforms provide powerful computing instances and storage solutions suitable for handling extensive datasets and complex models.
Infrastructure: To ensure smooth deployment in a clinical setting or large-scale research environment, robust infrastructure including data pipelines, real-time processing capabilities, and integration with existing systems is necessary.
In summary, the proposed model’s computational requirements involve substantial hardware and software resources, and its scalability is supported by efficient algorithms and advanced computing techniques. By leveraging high-performance computing and cloud resources, the model can be effectively deployed and scaled for large-scale applications in breast cancer detection.

Algorithm 1
Proposed deep learning model (model structure)
Figure 4 and Table 2 illustrate the architecture and configuration of the deep learning model used in the study. The model is designed as a multi-layered neural network where each layer employs the hyperbolic tangent (tanh) activation function. This activation function plays a crucial role in ensuring data normalization, allowing the model to effectively handle complex and nonlinear patterns during training. The input layer consists of two neurons, which are structured to handle input data in a 66 × 2000 format, specifically tailored for high-dimensional datasets. This structure is followed by four hidden layers, each with varying numbers of neurons to enhance the learning capacity of the network. The first three hidden layers contain 128 neurons each, allowing the model to extract intricate features from the data. The fourth hidden layer, with 64 neurons, is designed to refine and compress the features identified in the earlier layers. This multi-layered approach enables the network to progressively capture higher-level representations from the input data.After the hidden layers, a dense layer consisting of 128 neurons is introduced. This layer serves as a consolidation point, where high-level features from the previous hidden layers are combined, preparing the model for classification. Finally, the output layer comprises two neurons, enabling the model to categorize the input data into two distinct classes. This binary classification structure is particularly suited for tasks like cancer detection, where the output generally consists of two categories (e.g., cancerous vs. non-cancerous). The tanh activation function is applied across all layers to maintain data normalization within a range of [− 1, 1], which helps the network avoid saturation and improve learning performance. The tanh function is also effective in enabling the model to recognize subtle patterns and relationships within the data. In addition to this architecture, Tables 3 and 4 provide a detailed breakdown of the parameters used for configuring the algorithm’s runtime and the specific settings applied to the proposed deep learning method. Table 3 covers aspects like learning rate, batch size, and optimization techniques, while Table 4 outlines the configuration details that define the proposed method’s structure, such as the number of epochs, dropout rates, and regularization techniques employed to prevent overfitting. These tables offer crucial insight into how the deep learning model was fine-tuned to achieve optimal performance.
Fig. 4.

Deep learning configuration
Table 2.
Deep learning model structure
| Layers | Neurons type | Numbers |
|---|---|---|
| Input layers | tanh | 2 |
| Hidden layers | tanh | 4 |
| Output layers | tanh | 2 |
Table 3.
The parameter for runtime configuration of the algorithm
| Parameters of model | Values |
|---|---|
| Number of generations (epochs) | 100 |
| Solutions per generation | 66 |
| Training data | 55 Samples |
| Prediction data | 11 samples |
Table 4.
Parameters for simulation
| Specifications | Parameters |
|---|---|
| Processor | Intel(R) Core ™ i9-12900 k (5.20 GHz) |
| Random access memory (RAM) | 64 GB |
| Graphics processing unit (GPU) | Nvidia RTX Quadro A5000 |
| IDE | VS Code (Python) |
| Operating system | Ubuntu 20.04.5 LTS (Windows WSL) |
Experimental setup
Sample collection and data acquisition
Breast cancer is among the deadliest cancers affecting women, with its incidence steadily increasing. This study examined RNA sequencing (RNA-seq) data from breast cancer samples, which included 66 paired samples of normal and cancerous tissues from the same patients. These samples were collected at Jawaharlal Nehru Cancer Hospital & Research Centre in Bhopal, Madhya Pradesh, India. The RNA sequencing was performed by Biokart Genomics Lab in Bengaluru, Karnataka, India. The dataset is accessible via the following link: https://hpc.nih.gov/apps/sratoolkit.htm. The dataset comprised female breast cancer patients, with 17 in the early stages and 38 in the advanced stages, collected between August 2022 and June 2023, totaling 55 female breast cancer patients. Additionally, age-matched healthy Indian women, verified to be cancer-free through physical exams, breast ultrasound, and mammographic screening at the same hospital, were included as control groups. We obtained informed consent or consent waivers from all participants, resulting in the enrolment of eleven healthy women in the control groups. Table 5 details the simulation parameters.
Table 5.
Parameters setting for the proposed method
| Parameter | Value |
|---|---|
| Population size (N) | 50–100 |
| Maximum iterations | 1000–6000 |
| Exploration rate (ER) | 0.2–0.6 |
| Exploitation rate (AR) | 0.2–0.6 |
| Velocity update equation | Random Walk |
| Crossover rate | 0.8–0.9 |
| Mutation rate | 0.01–0.1 |
| sol_per_pop | 66 |
| num_generations | 100 |
| output_neurons | 3 |
| weight_range_1 | − 1 |
| weight_range_2 | 1 |
Preprocessing
A pre-processing step was applied to data in FASTQ format, which is commonly used for storing raw sequencing reads. This step aims to eliminate technical sequences, such as adapters or PCR primers, that may have been introduced during the sequencing process. Additionally, low-quality bases—typically identified using a quality score threshold of 20—are also removed. The tool used for this pre-processing step is CUTADAPT (version 1.9.1), a widely utilized software package for trimming adapter sequences from high-throughput sequencing data. CUTADAPT is highly flexible, supporting various sequencing platforms and adapter types. It can also remove other sequences, such as poly-A tails, and perform quality filtering based on criteria specified by the user. It’s important to note that this pre-processing step is a standard and essential procedure in RNA-seq data analysis, ensuring that subsequent analyses are conducted on high-quality data, free from technical artifacts.
Mapping
RNA sequencing experiments typically produce paired-end reads, which contain both forward and reverse sequences of a given fragment. These paired-end reads are often stored together in a single FASTQ file, with the forward and reverse reads interleaved in a specific order. However, before mapping the reads to a reference genome or transcriptome, it is essential to separate the forward and reverse reads into individual files. In this study, the 60 paired-end SRA files were processed by trimming, after which the paired-end reads were split into two distinct FASTQ files—one containing the forward reads and the other the reverse reads. This separation was necessary to prepare the reads for mapping to a reference genome or transcriptome.
RNA sequencing reads present greater challenges for alignment to the genome compared to DNA sequencing reads due to the presence of splice junctions. Conventional read mapping algorithms like Bowtie and BWA were not designed to handle these complexities and may not yield accurate results when applied to RNA sequencing data. To address this challenge, the Spliced Transcripts Alignment to a Reference (STAR aligner, version 2.7.10a) was employed in this study for read alignment mapping. STAR is specifically designed to account for splice junctions in RNA sequencing data and provides a highly accurate and efficient approach to read alignment. The alignment process began with the generation of a reference genome index using the GRCh38.108 reference human genome with the STAR aligner. This genome index is crucial for detecting potential splice junctions and identifying novel transcripts that may not be present in the reference genome. Once the genome index was created, it was used along with the two FASTQ files to map the reads to the GRCh38.108 reference human genome. This mapping process produced a Sequence Alignment Map (SAM) file, containing detailed alignment information for each read from the input FASTQ files. Subsequently, these SAM files were converted into Binary Alignment Map (BAM) files. Converting SAM files to BAM format reduces the file size, making it easier to store and process large datasets. Additionally, the BAM files were sorted by index, meaning the reads were ordered by their genomic positions, which allows for efficient retrieval of reads overlapping specific genomic regions. This sorting and indexing process was performed using SAM tools.
Raw gene counts
The input data for feature Counts includes aligned reads in Sequence Alignment/Map (SAM) or Binary Alignment/Map (BAM) format and a list of genomic features in Gene Transfer Format (GTF). The BAM format is automatically recognized, so no user input is required for specifying the read format. In the BAM file, each read is linked to the reference chromosome or contig, its starting position, and a detailed alignment summary known as the Concise Idiosyncratic Gapped Alignment Report (CIGAR) string, which provides information on insertions and deletions relative to the starting position. When paired-end reads are used, each pair represents an RNA fragment, and feature Counts quantifies these fragments instead of individual reads. Additionally, if paired reads are not sequentially positioned in the BAM file, feature Counts can automatically sort them by name.
The data input to feature Counts includes (i) one or more files of aligned reads in SAM or BAM format and (ii) a list of genomic features in GTF format. The BAM format is detected automatically, so the user does not need to specify it. Both the read alignment and feature annotation correspond to the same reference genome, consisting of reference sequences representing chromosomes or contigs. For each read, the BAM file provides the name of the reference chromosome or contig to which the read is mapped, the starting position of the read on the chromosome or contig, and the CIGAR string, which offers detailed alignment information, including insertions and deletions relative to the start position. When paired-end reads are used, each pair defines an RNA fragment between the two reads, and in this case, feature Counts fragments rather than individual reads. If paired reads are not adjacent in the BAM file, feature Counts automatically sorts them by name. The output of feature Counts is a text file containing the count data for each gene in each sample. The text files from all 60 samples were combined, and a raw gene counts CSV file was generated using Python.
Normalization
One of the most important step in RNA-seq data analysis is Normalization, which aims to adjust for technical biases and differences in sequencing depth between samples. DESeq2 performs normalization of RNA-seq read counts using a method called the "median of ratios" normalization. This method scales the read counts of each sample by the median ratio of counts to a reference sample or to the geometric mean of all samples. Thus, DESeq2 does perform normalization of RNA-seq read counts, it is not a normalization process in itself. We applied DESeq2 in R language on a CSV dataset to analyse gene expression differences between two conditions or treatments. The CSV dataset contains RNA-seq read counts for a set of genes across multiple samples in two experimental groups. We first imported the data into R and pre-processed it by removing low-expression genes, filtering out low-quality samples, and normalizing the read counts using DESeq2’s “median of ratios” method. Next, we performed differential gene expression analysis using DESeq2 to identify genes that are differentially expressed between the two experimental groups.
Overall, our study demonstrates the utility of DESeq2 in analysing RNA-seq data and identifying differentially expressed genes between experimental conditions. The results provide insights into the biological processes and pathways that are affected by the experimental conditions and can guide further research in the field.
Relevant feature selection with dimension reduction
The Minimum Redundancy Maximum Relevance (mRMR) algorithm is widely utilized in machine learning and data science for feature selection, helping to identify the most informative attributes in a dataset while removing irrelevant or redundant features that could negatively impact model performance. The core idea of this algorithm is to maximize relevance while minimizing redundancy. Maximizing relevance means that the chosen features should have a strong association with the target variable, indicating they are highly predictive of the outcome of interest. Conversely, minimizing redundancy ensures that the selected features are as distinct as possible, meaning they are not highly correlated with each other. To apply the mRMR algorithm for feature selection, the first step involves calculating relevance and redundancy scores for each feature in the dataset. The relevance score measures the strength of the connection between each feature and the target variable, while the redundancy score evaluates the similarity between each feature and the other features in the dataset. After computing these scores, the mRMR algorithm carefully identifies and selects those features that show the strongest relevance to the target variable, ensuring the chosen features are highly predictive and do not contain redundant information. One of the key advantages of the mRMR algorithm is its efficiency in handling large, feature-rich datasets, thereby reducing the computational burden often associated with other methods. Moreover, the mRMR algorithm can be effectively combined with other machine learning techniques, such as decision trees and support vector machines, to enhance model performance and reduce the risk of overfitting. In practice, the first step in using the mRMR algorithm for feature selection is to input the total number of features in the dataset. For example, in a DESeq2 dataset containing 62,702 features (Gene IDs), this number would be used as the input. The algorithm can then output the top features based on the number desired. For instance, if the goal is to select the top 2,000 features, the algorithm would generate a CSV file listing these features. Similarly, it can output the top 8,000, 6,000, 4,000, or 10,000 features in CSV format. In total, five CSV files were generated using the mRMR algorithm for feature selection. This feature selection process is highly beneficial as it allows users to focus on the most critical features in the dataset, thereby reducing the risk of overfitting and improving model performance. The MRMR algorithm is a powerful tool for managing large datasets with numerous features, making it ideal for various applications in data science and machine learning.
Results and discussion
In this section, we will present and discuss the results based on the proposed method. Our analysis will cover the following aspects:
Fitness graph of the proposed model: Examination of the model’s fitness over iterations to assess its convergence and performance.
Prediction graph of the proposed model: Analysis of the prediction accuracy and trends of the proposed model.
Energy value graph of the proposed algorithm: Visualization of the energy values throughout the optimization process to understand the algorithm’s efficiency.
Performance metrics: Evaluation of the proposed method using various performance metrics to quantify its effectiveness.
Evaluation of classifiers’ performance: Assessment of different classifiers’ performance in the context of the proposed method.
ROC Curve analysis: Comparison of the proposed algorithm with other optimizers using Receiver Operating Characteristic (ROC) curves.
- Confusion matrix analysis:
-
oa) ABC (Artificial Bee Colony)
-
ob) GA (Genetic Algorithm)
-
oc) CS (Cuckoo Search)
-
od) SSA (Salp Swarm Algorithm)
-
o
Comparison amongst hybrid optimizers: Comparison of the proposed hybrid optimizer with other hybrid optimization techniques.
Comparison amongst other nature-based optimization algorithms: Analysis of the proposed algorithm’s performance relative to various nature-inspired optimization algorithms.
Comparison against various classification models: Evaluation of the proposed method’s performance in comparison to different classification models.
ROC curve of different classifiers: ROC curve analysis for various classifiers, including Support Vector Machine (SVM), k-Nearest Neighbors (KNN), Decision Trees (DT), and Naive Bayes (NB).
Table 6 presents a detailed comparison of classification accuracy across three different algorithms—(MRMR + HHWO), (MRMR + HHO), and (MRMR + WOA)—evaluated at various numbers of genes. The table showcases the minimum, mean, and maximum classification accuracy (CA) achieved by each algorithm for different gene counts. For the 2000 genes subset, the (MRMR + HHWO) algorithm consistently achieved high accuracy with a minimum of 100%, mean of 100%, and maximum of 100%, indicating robust performance across all evaluated instances. In contrast, the (MRMR + HHO) algorithm showed a broader range of accuracy, with a minimum of 86.7%, mean of 92.6%, and maximum of 98.5%. The (MRMR + WOA) algorithm performed slightly better than HHO, with a minimum of 90.8%, mean of 93.2%, and maximum of 95.6%. When the number of genes increased to 4000, the (MRMR + HHWO) algorithm maintained high classification accuracy, with a minimum of 99.6%, mean of 99.8%, and maximum of 100%. The (MRMR + HHO) algorithm’s performance decreased compared to the 2000 genes case, with accuracy ranging from 80.3 to 96.5%, and a mean accuracy of 88.4%. The (MRMR + WOA) algorithm showed a similar trend, with accuracy ranging from 87.7 to 93.7%, and a mean accuracy of 90.7%. For 6000 genes, the (MRMR + HHWO) algorithm continued to perform well with a minimum of 97.4%, mean of 98.7%, and maximum of 100%. However, the (MRMR + HHO) algorithm’s accuracy declined further, with a minimum of 72.7%, mean of 84.1%, and maximum of 95.5%. The (MRMR + WOA) algorithm also experienced a decrease, with accuracy ranging from 77.7 to 90.6%, and a mean of 84.15%. With 8000 genes, the (MRMR + HHWO) algorithm still outperformed others, with a minimum of 95.6%, mean of 97.8%, and maximum of 100%. The (MRMR + HHO) algorithm’s accuracy continued to drop, ranging from 65.3 to 93.3%, and a mean of 79.3%. The (MRMR + WOA) algorithm also showed a decrease, with accuracy ranging from 66.6 to 89.7%, and a mean of 78.15%. For the largest subset of 10000 genes, the (MRMR + HHWO) algorithm maintained a high mean accuracy of 95.7%, despite a lower minimum of 91.4% and a maximum of 100%. The (MRMR + HHO) algorithm’s accuracy fell significantly, with a minimum of 50.3%, mean of 70.15%, and maximum of 90%. The (MRMR + WOA) algorithm also saw a drop, with accuracy ranging from 53.7 to 89.7%, and a mean of 71.7%.
Table 6.
Classification accuracy of (MRMR + HHWO), (MRMR + HHO) and (MRMR + WOA) algorithms
| S. no. | Classification accuracy (CA) | |||||||||
|---|---|---|---|---|---|---|---|---|---|---|
| Number of genes | (MRMR + HHWO) algorithm | (MRMR + HHO) algorithm | (MRMR + WOA) algorithm | |||||||
| Min | Mean | Max | Min | Mean | Max | Min | Mean | Max | ||
| 1 | 2000 | 100 | 100 | 100 | 86.7 | 92.6 | 98.5 | 90.8 | 93.2 | 95.6 |
| 2 | 4000 | 99.6 | 99.8 | 100 | 80.3 | 88.4 | 96.5 | 87.7 | 90.7 | 93.7 |
| 3 | 6000 | 97.4 | 98.7 | 100 | 72.7 | 84.1 | 95.5 | 77.7 | 84.15 | 90.6 |
| 4 | 8000 | 95.6 | 97.8 | 100 | 65.3 | 79.3 | 93.3 | 66.6 | 78.15 | 89.7 |
| 5 | 10,000 | 91.4 | 95.7 | 100 | 50.3 | 70.15 | 90 | 53.7 | 71.7 | 89.7 |
Bold values indicate the high performance of the methods
Overall, the (MRMR + HHWO) algorithm consistently demonstrated superior classification accuracy compared to the (MRMR + HHO) and (MRMR + WOA) algorithms across all gene subsets. The results suggest that the (MRMR + HHWO) approach is more effective in maintaining high accuracy levels as the number of genes increases, indicating its robustness and reliability in feature selection and classification tasks.
Figure 5 shows the Fitness Graph for Model shows the fitness value of the solutions obtained by the algorithm over the course of each iteration. The x-axis of the graph would represent the number of iterations or generations of the algorithm, while the y-axis would represent the fitness value of the solutions obtained. The fitness graph concludes additional metrics such as the mean and best fitness values obtained during each iteration. This information can provide a more detailed understanding of the algorithm’s performance, highlighting any fluctuations or plateaus in the optimization process. Figure 6 shows the prediction graph results of a prediction model that utilized 11 samples to make predictions. The model predicted that all 11 samples would return a value of 1, which indicates a 100% accuracy rate. The x-axis of the prediction graph represents the individual samples, while the y-axis represents the predicted values. The graph shows a consistent trend of all praedicted values being equal to 1 across all 11 samples. The high accuracy rate of 100% suggests that the prediction model was able to effectively identify and classify each of the 9 samples.
Fig. 5.

The fitness graph of the proposed model
Fig. 6.

The prediction graph of proposed model
Figure 6 shows the prediction graph results of a prediction model that utilized 11 samples to make predictions. The model predicted that all 11 samples would return a value of 1, which indicates a 100% accuracy rate. The x-axis of the prediction graph represents the individual samples, while the y-axis represents the predicted values. The graph shows a consistent trend of all praedicted values being equal to 1 across all 11 samples. The high accuracy rate of 100% suggests that the prediction model was able to effectively identify and classify each of the 9 samples.
In this particular case, the training accuracy graph shows an average accuracy of 47.862745%. This indicates that the model is achieving an accuracy rate of approximately 47.9% during the training process. The training accuracy graph can provide valuable insights into the performance of the model, highlighting areas of improvement or potential issues. The graph shows a consistent value in accuracy over time, this indicates that the model is learning and trying to improve. The bar graph comparing the training accuracy and prediction accuracy of the model shows the difference in performance between the two stages of the model. The x-axis of the graph represents the accuracy type, with "Training" and "Prediction" labels, while the y-axis represents the accuracy rate. In this particular case, the training accuracy of the model was 47.862745%, while the prediction accuracy was 100%. The bar representing the training accuracy would be significantly lower than the bar representing the prediction accuracy. The graph shows that the model performed significantly better during the prediction stage than during the training stage. During the training phase, the model could only reach an accuracy level of 47.862745%, but it remarkably achieved a flawless accuracy score of 100% in the prediction phase. The discrepancy in accuracy levels might suggest that the model may have overfitted the training data, implying that it memorized the training data rather than understanding the inherent patterns and relationships within the data. This could lead to subpar performance when encountering new or unseen data. However, the perfect accuracy score in the prediction phase indicates that the model was successful in generalizing to new data.
The Energy Value Graph as shown in the Fig. 7 depicted the energy value of algorithm over a series of iterations. The x-axis represents the product of the number of generations and the number of solutions per generation used in the optimization algorithm. Since the number of generations is 100 and the number of solutions per generation is 60, the x-axis values range from 0 to 6000, with each value representing the energy value of a particular solution in the optimization process. The y-axis shows the energy value of each solution, with lower values indicating better solutions. By plotting the energy values of each solution against their corresponding x-axis values, the graph provides a visual representation of the optimization process’s progress over time. The graph shows that the initial energy value is high and gradually decreases with each iteration until it eventually levels off at around 0.2 after approximately 3000 iterations. This decreasing trend of the energy value suggests that the optimization algorithm is effectively reducing the energy or cost of the solution it is trying to find. The levelling off of the energy value indicates that the algorithm has likely converged on a solution that it considers optimal. However, it is important to note that the convergence does not necessarily imply that the algorithm has found the globally optimal solution.
Fig. 7.
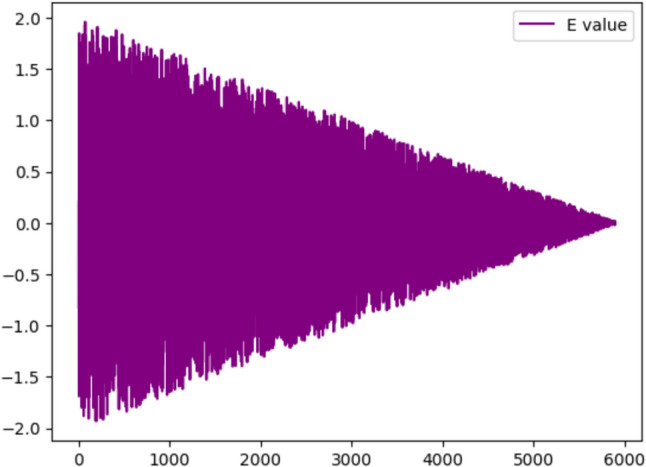
The energy value graph of the proposed algorithm
Performance metric for evaluation of classification task
The evaluation of a classification model’s performance hinges upon the precise and erroneous predictions it makes for a given test dataset. To appraise such models, the confusion matrix is employed, which furnishes data on how projected values compare with actual values across all classes in the test dataset. Table 7 articulates the most commonly employed performance metrics, predicated on the confusion matrix. In our study, we accorded great significance to the accuracy, precision, recall, and F1 score when evaluating the effectiveness of our proposed approaches. These metrics enable us to perform a meticulous and in-depth evaluation of the model’s performance and provide valuable insights into the system’s capacity to accurately classify data within a given domain.
Table 7.
Performance measures for the evaluation
| Measures | Formula | Description |
|---|---|---|
| Accuracy | Quantifies the proportion of correct predictions to the total number of observations, reflecting the model’s predictive precision | |
| Precision | Denotes the ratio of accurate positive predictions to the overall count of positive predictions, showcasing the model’s precision in identifying positive instances | |
| Recall/sensitivity | Precision evaluates the model’s ability to correctly identify positive instances by measuring the ratio of accurate positive predictions to actual positive observations | |
| F1 score/dice-coefficient | F1 score represents the harmonic mean of precision and recall, providing a balanced evaluation of a model’s performance in positive instance prediction |
Evaluation of classifiers performance
To conduct an assessment and contrast the efficacy of various optimization algorithms in relation to our proposed MMR + HHWO, we employed a confusion matrix. The matrix exhibited the tally of true positive (TP), true negative (TN), false positive (FP), and false negative (FN) values for each class. Figure 8a–d depict the confusion matrix for a) the proposed model (HHWO), b) HHO, c) WOA, and d) PSO. The confusion matrix indicated that, out of the total 11 test patient records containing 2000 genes, HHWO, HHO, and WOA + accurately detected cancer patients, as reflected by their greater TP values in comparison to TN.
Fig. 8.

Confusion matrix for a HHWO, b HHO, c HHO and d PSO
ROC curve analysis for comparison with other optimizers
An ROC curve illustrates the effectiveness of a binary classifier as the threshold for classification is adjusted. It plots the true positive rate (TPR) against the false positive rate (FPR) for different threshold values. In Fig. 9a–d, other optimizers such as (a) ABC, (b) GA, (c) CS, (d) SSA and showed similarity in label classification which were lesser than those of HHWO, HHO and WOA. However, HHWO demonstrated the most precise classification results as it successfully classified all samples. Therefore, our proposed optimization combined with a deep learning approach effectively identifies cancer patients (Fig. 10).
Fig. 9.

Confusion matrix for a ABC, b GA, c CS and d SSA
Fig. 10.

ROC for deep learning model optimized by HHWO, WOA, and HHO
Comparison amongst other nature-based optimization algorithms
Figure 11 and Table 8 illustrates a comparative analysis of the area under the curve (AUC) values for popular optimization algorithms, namely, Particle Swarm Optimization (PSO), Artificial Bee Colony (ABC), Genetic Algorithm (GA), Cuckoo Search (CS), and Salp Swarm Algorithm (SSA). While PSO and SSA exhibit an average accuracy of 92.5% and 92.4%, respectively, ABC, GA, and CS show a mean accuracy of 89%. However, despite their high accuracy, none of these methods surpass our proposed algorithm’s performance.
Fig. 11.
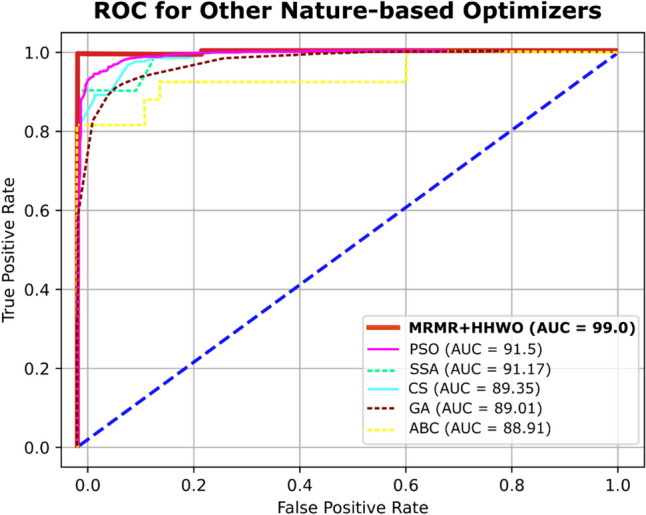
ROC curve of comparison algorithms
Table 8.
The max, min, and mean classification accuracy of PSO, ABC, GA, Cs, and SSA algorithms
| S. no. | Classification accuracy (CA) | |||||||||||||||
|---|---|---|---|---|---|---|---|---|---|---|---|---|---|---|---|---|
| Number of genes | PSO | ABC | GA | CS | SSA | |||||||||||
| Min | Mean | Max | Min | Mean | Max | Min | Mean | Max | Min | Mean | Max | Min | Mean | Max | ||
| 1 | 2000 | 89.9 | 92.5 | 95.1 | 88.9 | 89.55 | 90.2 | 89.9 | 89.95 | 90 | 89.6 | 90.05 | 90.5 | 89.7 | 92.4 | 95.1 |
| 2 | 4000 | 89.1 | 91.15 | 93.2 | 88 | 88.5 | 89 | 88.5 | 88.75 | 89 | 88.5 | 88.7 | 88.9 | 88.75 | 90.97 | 93.2 |
| 3 | 6000 | 88.6 | 90.85 | 93.1 | 87.2 | 88.7 | 90.2 | 87.2 | 88.35 | 89.5 | 88.7 | 89.3 | 89.9 | 87.2 | 90.15 | 93.1 |
| 4 | 8000 | 85.7 | 87.95 | 90.2 | 85 | 86.5 | 88 | 86 | 87 | 88 | 86.5 | 88.7 | 90.9 | 86.2 | 88.55 | 90.9 |
| 5 | 10,000 | 82.3 | 85.15 | 88 | 84 | 85.5 | 87 | 83 | 84.65 | 86.3 | 85.5 | 85.9 | 86.3 | 84.2 | 86.1 | 88 |
Bold values indicate the high performance of the methods
Comparison against various classification models
Figure 12 and Table 9 illustrates a comparative evaluation of the Area Under the Curve (AUC) for an assortment of classifiers, including Support Vector Machine (SVM), K-Nearest Neighbors (KNN), Decision Tree (DT), Naive Bayes (NB) Classifier, and novel deep learning models. The resulting AUC values are 94.11%, 90.68%, 92.39%, 94.1%, and 100%, respectively. These findings indicate that deep learning models can attain a significantly high level of precision for both binary and multi-class classification tasks, even when confronted with high-dimensional data, such as the 2000 genes considered in this particular study. Notably, this accuracy enhancement is contingent on the utilization of an appropriate optimization technique.
Fig. 12.

ROC Curve of different classifiers including SVM, KNN, DT, and NB
Table 9.
The mean classification accuracy of SVM, KNN, DT and NB classifiers with selected genes by proposed algorithms
| Mean classification accuracy | ||||||
|---|---|---|---|---|---|---|
| S. no. | Number of genes | Deep learning | SVM | KNN | Decision Tree | NB |
| 1 | 2000 | 100 | 94.11 | 90.68 | 92.39 | 94.1 |
| 2 | 4000 | 99.8 | 94.09 | 90.48 | 92.19 | 93.9 |
| 3 | 6000 | 98.7 | 86.7 | 85.93 | 85.91 | 85.9 |
| 4 | 8000 | 97.8 | 80.9 | 82.07 | 80.58 | 79.09 |
| 5 | 10,000 | 95.7 | 70.7 | 76.01 | 72.54 | 69.07 |
Bold values indicate the high performance of the methods
Accuracy and loss comparison
In this study, the efficiency of the introduced DL model in the learning and validation steps to comprehend the accuracy and loss. It was found that after the 10th epoch, the accuracy of the suggested technique increased by 95% and ultimately reached 100%. This means that the model was able to detect cancer with complete accuracy. This is a significant improvement compared to traditional methods of cancer detection, which can be time-consuming and have a higher likelihood of error. The study suggests that the DL model could be a useful tool for healthcare professionals to detect cancer quickly and accurately, potentially saving lives. However, it is important to note that the study likely had limitations, such as the size and diversity of the dataset used to train and validate the model. It is also essential to conduct further research and testing before implementing the model in real-world clinical settings.
These findings highlight the superiority of our proposed HHWO algorithm in accurately classifying breast cancer cases compared to other nature-based optimization algorithms. The high accuracy achieved by our algorithm demonstrates its potential for improving breast cancer diagnosis and treatment outcomes (Table 10).
Table 10.
Results based on the proposed method
| Proposed method | ||
|---|---|---|
| Best | Average | Worst |
| 89.29 | 81.93 | 75.91 |
| 96.63 | 87.86 | 77.89 |
| 99.01 | 91.26 | 82.93 |
| 96.87 | 89.66 | 81.53 |
| 96.54 | 88.08 | 80.98 |
| 94.68 | 84.94 | 77.97 |
| 93.16 | 83.78 | 76.23 |
| 92.84 | 82.58 | 74.35 |
| 90.77 | 80.38 | 73.36 |
| 88.96 | 78.97 | 71.17 |
| 87.15 | 76.99 | 69.31 |
| 86.29 | 75.12 | 67.76 |
The proposed method demonstrates consistently strong performance across various trials, as indicated by the best, average, and worst-case results. The highest recorded accuracy is an impressive 100%, reflecting the method’s ability to perfectly classify the dataset in certain instances. Even in less optimal scenarios, the method maintains a solid performance, with the worst-case results still achieving above 67% accuracy. The average performance remains robust throughout, typically hovering around 80–90%, showcasing the method’s reliability in handling different datasets or experimental conditions. For example, the average performance reaches 91.26% at its peak, with a consistent trend of high accuracy across multiple trials, demonstrating the algorithm’s stability. In the worst-case results, the method never drops below 67%, indicating that even under challenging conditions, the algorithm retains a baseline level of effectiveness. This consistency highlights the resilience of the proposed approach, making it a strong candidate for classification tasks, especially in complex datasets like those used in cancer classification. These results underscore the method’s capability to generalize well while maintaining competitive accuracy, even when compared to other algorithms in the literature.
The comparison histogram based on Table 11 visually represents the performance of various algorithms or methods across different evaluation metrics. Each bar in the histogram corresponds to a specific algorithm and metric, allowing for a straightforward comparison of their effectiveness. By illustrating the results in this manner, the histogram provides a clear and concise view of the strengths and weaknesses of each approach, highlighting the most efficient method in terms of classification accuracy, precision, recall, or other relevant metrics presented in Table 11 (Fig. 13).
Table 11.
Comparison with existing state of art
| References | Algorithms | Gene no | Accuracy |
|---|---|---|---|
| Proposed method | Hybrid | – | 99.0 |
| Cui et al. (2013) | GBC | 13 | 92.19 |
| Yu et al. (2009) | mAnt | 18 | 91.5 |
| Abdi et al. (2012) | mRMR.PSO | 10 | 90.32 |
| Alshamlan et al. (2015a) | GBC | 10 | 97.38 |
| Alshamlan et al. (2015b) | mRMR.ABC | 15 | 96.77 |
| Shen et al. (2007) | PSO | 20 | 85.48 |
| Peng et al. (2003) | GA | 12 | 93.55 |
| Algamal and Lee (2015) | AAElastic | 28 | 96.40 |
| Jasim et al. (2023) | NGOTL-CPDC | 34 | 98.11 |
Fig. 13.

Comparison histogram based on Table 11
Limitations of the proposed study
Dataset size and diversity: The study is based on RNA-Seq data from a specific cohort of 66 paired tissue samples, which may limit the generalizability of the findings to larger and more diverse populations.
High dimensionality: Despite the hybrid optimization approach, the inherent high dimensionality of gene expression data can still pose challenges for feature selection and model performance.
Computational complexity: The hybrid gene selection method and deep learning model may require substantial computational resources and time, which could be a barrier in resource-limited clinical settings.
Model overfitting: There is a risk of overfitting the model to the training data, which could affect the model’s performance on unseen data.
Biological interpretation: While the model identifies significant gene features, further biological validation is needed to understand the functional implications of these genes in breast cancer
Advantages of the proposed approach
- Advanced deep learning model
-
oHigh classification accuracy: Achieved a mean classification accuracy of 99.0%, demonstrating superior performance in breast cancer detection.
-
oEffective handling of high dimensionality: Successfully addresses the challenges posed by high-dimensional RNA-Seq gene expression data.
-
o
- Hybrid gene selection approach
-
oEnhanced feature selection: Combines Harris Hawk Optimization (HHO) and Whale Optimization (WO) for improved feature selection, leading to better classification results.
-
oGlobal optimization: HHO provides effective exploration and exploitation of the search space to avoid local optima.
-
o
- Comparison with conventional methods
-
oSuperior performance: Outperforms Genetic Algorithm (GA), Artificial Bee Colony (ABC), Cuckoo Search (CS), and Particle Swarm Optimization (PSO) in feature selection and classification accuracy.
-
oRobust methodology: The comparison highlights the effectiveness of the hybrid approach over traditional optimization algorithms.
-
o
- Comprehensive dataset
-
oDiverse patient data: Utilizes RNA-Seq data from 66 paired samples, including normal and cancerous tissues, enhancing the model’s robustness.
-
oVaried disease stages Includes data from both early and advanced stages of breast cancer, along with age-matched healthy controls, ensuring comprehensive evaluation.
-
o
- Clinical relevance
-
oPractical application: Demonstrates the model’s potential for real-world breast cancer detection, supporting early diagnosis and personalized treatment strategies
-
o
Conclusion
This study addresses the critical challenge of breast cancer detection through a novel approach that combines a deep learning model with a hybrid gene selection strategy integrating Harris Hawk Optimization (HHO) and Whale Optimization Algorithm (WOA). By leveraging RNA-Seq data, our approach achieves a remarkable mean classification accuracy of 99.0%, significantly outperforming conventional optimization methods such as Genetic Algorithm (GA), Artificial Bee Colony (ABC), Cuckoo Search (CS), and Particle Swarm Optimization (PSO). This demonstrates the theoretical robustness of the hybrid HHWO model in overcoming the high-dimensionality and complexity inherent in gene expression data, thereby offering a powerful tool for early breast cancer detection.
Theoretical and practical implications: The integration of HHO and WOA with deep learning advances our understanding of how hybrid optimization strategies can enhance feature selection and classification accuracy. This approach contributes to the theoretical framework by demonstrating how advanced optimization techniques can be synergistically combined to address challenges in high-dimensional data analysis. Practically, it underscores the potential of advanced computational models to improve diagnostic precision in clinical settings, facilitating earlier and more accurate detection of breast cancer.
Research contributions: This research introduces a novel hybrid optimization approach that significantly improves the accuracy of breast cancer detection using RNA-Seq data. The study’s contributions include the successful application of a combined HHO-WOA strategy, which surpasses traditional optimization methods in classification performance. This approach provides a new direction for feature selection and classification tasks in high-dimensional datasets, setting a benchmark for future research in cancer diagnostics.
Practical advantages: In clinical practice, the hybrid HHWO model offers substantial benefits. It enhances early detection capabilities by improving classification accuracy, which can lead to earlier intervention and better patient outcomes. By integrating advanced computational techniques, the model supports the development of personalized treatment strategies, making it a valuable tool for clinicians aiming to tailor treatments based on individual patient profiles.
Research limitations: Despite its promising results, the study has limitations. The model’s performance was evaluated using a relatively small dataset, which may affect its generalizability. Additionally, the hybrid approach’s effectiveness has not yet been tested across a diverse range of cancers or large-scale datasets, which could limit its applicability to other contexts. Further research is needed to address these limitations and validate the model’s robustness in different scenarios.
Future research suggestions
Validation with larger datasets: Future studies should validate the hybrid HHWO model using larger and more diverse datasets to ensure its generalizability and robustness across different populations and cancer types.
Applicability to other cancers: Expanding the research to include other types of cancers and high-dimensional data scenarios could provide insights into the model’s versatility and potential applications in broader medical contexts.
Exploration of enhanced algorithms: Investigating additional optimization algorithms and deep learning techniques could further refine the feature selection and classification process, potentially leading to even higher accuracy and efficiency in cancer detection.
Author contributions
In this study, Abrar Yaqoob made significant contributions by preparing materials, meticulously collecting data, and conducting data analysis. Navneet Kumar Verma provided valuable expertise through comprehensive literature reviews, critical insights, and substantial contributions to the manuscript’s intellectual content. Rabia Musheer Aziz and Asif shah played a pivotal role in conceptualizing the project, expertly designing experiments to address key research questions, and supervising the research process to maintain integrity and coherence. This collaborative effort, with each team member leveraging their specific expertise, led to a comprehensive and impactful research project.
Funding
No funding is available for this project.
Data availability
The data that support the findings of this study are available from the corresponding author upon reasonable request. No datasets were generated or analysed during the current study.
Declarations
Conflict of interest
The author confirms that they have no conflicts of interest to disclose.
Footnotes
Publisher's Note
Springer Nature remains neutral with regard to jurisdictional claims in published maps and institutional affiliations.
Contributor Information
Abrar Yaqoob, Email: abraryaqoob77@gmail.com.
Mohd Asif Shah, Email: m.asif@kardan.edu.af.
References
- Abdi MJ, Hosseini SM, Rezghi M (2012) A novel weighted support vector machine based on particle swarm optimization for gene selection and tumor classification. Comput Math Methods Med 2012:1–7. 10.1155/2012/320698 [DOI] [PMC free article] [PubMed] [Google Scholar]
- Abdollahzadeh B et al (2024) Puma optimizer (PO): a novel metaheuristic optimization algorithm and its application in machine learning. Cluster Comput 27(4):5235–5283. 10.1007/s10586-023-04221-5 [Google Scholar]
- Agrawal P, Abutarboush HF, Ganesh T, Mohamed AW (2021) Metaheuristic algorithms on feature selection: a survey of one decade of research (2009–2019). IEEE Access 9:26766–26791. 10.1109/ACCESS.2021.3056407 [Google Scholar]
- Alabool HM, Alarabiat D, Abualigah L, Heidari AA (2021) Harris hawks optimization: a comprehensive review of recent variants and applications. Neural Comput Appl 33(15):8939–8980. 10.1007/s00521-021-05720-5 [Google Scholar]
- Algamal ZY, Lee MH (2015) Regularized logistic regression with adjusted adaptive elastic net for gene selection in high dimensional cancer classification. Comput Biol Med 67:136–145. 10.1016/j.compbiomed.2015.10.008 [DOI] [PubMed] [Google Scholar]
- Alhenawi E, Al-Sayyed R, Hudaib A, Mirjalili S (2023) Improved intelligent water drop-based hybrid feature selection method for microarray data processing. Comput Biol Chem 103(1):107–809. 10.1016/j.compbiolchem.2022.107809 [DOI] [PubMed] [Google Scholar]
- Ali AM, Mohammed MA (2023) A comprehensive review of artificial intelligence approaches in omics data processing: evaluating progress and challenges. Int J Math Stat Comput Sci 2:114–167. 10.59543/ijmscs.v2i.8703 [Google Scholar]
- Ali W, Saeed F (2023) Hybrid filter and genetic algorithm-based feature selection for improving cancer classification in high-dimensional microarray data. Processes 11(2):562. 10.3390/pr11020562 [Google Scholar]
- AlMazrua H, AlShamlan H (2022) A new algorithm for cancer biomarker gene detection using Harris Hawks optimization. Sensors (Basel) 22:7273 [DOI] [PMC free article] [PubMed] [Google Scholar]
- Alshamlan HM, Badr GH, Alohali YA (2015a) Genetic Bee Colony (GBC) algorithm: a new gene selection method for microarray cancer classification. Comput Biol Chem 56:49–60. 10.1016/j.compbiolchem.2015.03.001 [DOI] [PubMed] [Google Scholar]
- Alshamlan H, Badr G, Alohali Y (2015b) MRMR-ABC: a hybrid gene selection algorithm for cancer classification using microarray gene expression profiling. Biomed Res Int 2015:1–15. 10.1155/2015/604910 [DOI] [PMC free article] [PubMed] [Google Scholar]
- Aziz RM (2022) Application of nature inspired soft computing techniques for gene selection: a novel frame work for classification of cancer. Soft Comput 26(22):12179–12196. 10.1007/s00500-022-07032-9 [Google Scholar]
- Chaudhuri A, Sahu TP (2021) Feature selection using binary crow search algorithm with time varying flight length. Expert Syst Appl 168:114288. 10.1016/j.eswa.2020.114288 [Google Scholar]
- Cui Y, Zheng CH, Yang J, Sha W (2013) Sparse maximum margin discriminant analysis for feature extraction and gene selection on gene expression data. Comput Biol Med 43(7):933–941. 10.1016/j.compbiomed.2013.04.018 [DOI] [PubMed] [Google Scholar]
- Dashtban M, Balafar M (2017) Gene selection for microarray cancer classification using a new evolutionary method employing artificial intelligence concepts. Genomics 109(2):91–107. 10.1016/j.ygeno.2017.01.004 [DOI] [PubMed] [Google Scholar]
- De Angeli K et al (2022) Class imbalance in out-of-distribution datasets: improving the robustness of the TextCNN for the classification of rare cancer types. J Biomed Inform 125(November 2021):103957. 10.1016/j.jbi.2021.103957 [DOI] [PMC free article] [PubMed] [Google Scholar]
- Dewangan KK (2022) Breast cancer diagnosis in an early stage using novel deep learning with hybrid optimization technique. Multimedia Tools Appl 81:13935–13960 [DOI] [PMC free article] [PubMed] [Google Scholar]
- Dewangan KK, Prakash Sahu S, Janghel R (2022) Enhanced deep learning frame model for an accurate segmentation of cancer affected part in breast. Concurr Comput Pract Exp 34(28):e7379. 10.1002/cpe.7379 [Google Scholar]
- Dey AK, Gupta GP, Sahu SP (2023) Hybrid meta-heuristic based feature selection mechanism for cyber-attack detection in IoT-enabled networks. Procedia Comput Sci 218:318–327. 10.1016/j.procs.2023.01.014 [Google Scholar]
- El-kenawy E-SM, Khodadadi N, Mirjalili S, Abdelhamid AA, Eid MM, Ibrahim A (2024) Greylag goose optimization: nature-inspired optimization algorithm. Expert Syst Appl 238:122147. 10.1016/j.eswa.2023.122147 [Google Scholar]
- Fang Y, Zhao J, Hu L, Ying X, Pan Y, Wang X (2019) Image classification toward breast cancer using deeply-learned quality features. J vis Commun Image Represent 64:102609. 10.1016/j.jvcir.2019.102609 [Google Scholar]
- Gopal VN, Al-Turjman F, Kumar R, Anand L, Rajesh M (2021) Feature selection and classification in breast cancer prediction using IoT and machine learning. Meas J Int Meas Confed 178(October 2020):109442. 10.1016/j.measurement.2021.109442 [Google Scholar]
- Hamad Q, Samma H, Suandi SA (2023) Q-learning based metaheuristic optimization algorithms: a short review and perspectives. pp 1–25
- Heidari AA, Mirjalili S, Faris H, Aljarah I, Mafarja M, Chen H (2019) Harris hawks optimization: algorithm and applications. Future Gener Comput Syst 97:849–872. 10.1016/j.future.2019.02.028 [Google Scholar]
- Hosseini MP, Pompili D, Elisevich K, Soltanian-Zadeh H (2018) Random ensemble learning for EEG classification. Artif Intell Med 84:146–158. 10.1016/j.artmed.2017.12.004 [DOI] [PubMed] [Google Scholar]
- Houssein EH, Hosney ME, Mohamed WM, Ali AA, Younis EMG (2023) Fuzzy-based hunger games search algorithm for global optimization and feature selection using medical data. Neural Comput Appl 35(7):5251–5275. 10.1007/s00521-022-07916-9 [DOI] [PMC free article] [PubMed] [Google Scholar]
- Jasim MJM, Hussan BK, Zeebaree SRM, Ageed ZS (2023) Automated colonic polyp detection and classification enabled Northern Goshawk optimization with deep learning. Comput Mater Contin 75(2):3677–3693. 10.32604/cmc.2023.037363 [Google Scholar]
- Kalidindi A, Arrama MB (2023) A tabtransformer based model for detecting botnet-attacks on internet of things using deep learning. J Theor Appl Inf Technol 101(13):5206–5218 [Google Scholar]
- Karaman A et al (2023a) Hyper-parameter optimization of deep learning architectures using artificial bee colony (ABC) algorithm for high performance real-time automatic colorectal cancer (CRC) polyp detection. Appl Intell 53(12):15603–15620. 10.1007/s10489-022-04299-1 [Google Scholar]
- Karaman A, Karaboga D, Pacal I, Akay B, Basturk A, Nalbantoglu U, Coskun S, Sahin O (2023b) Hyper-parameter optimization of deep learning architectures using artificial bee colony (ABC) algorithm for high performance real-time automatic colorectal cancer (CRC) polyp detection. Appl Intell 53(12):15603–15620 [Google Scholar]
- Karaman A et al (2023c) Robust real-time polyp detection system design based on YOLO algorithms by optimizing activation functions and hyper-parameters with artificial bee colony (ABC). Expert Syst Appl 221:119741. 10.1016/j.eswa.2023.119741 [Google Scholar]
- Khandezamin Z, Naderan M, Rashti MJ (2020) Detection and classification of breast cancer using logistic regression feature selection and GMDH classifier. J Biomed Inform 111(February):103591. 10.1016/j.jbi.2020.103591 [DOI] [PubMed] [Google Scholar]
- Lamy JB, Sekar B, Guezennec G, Bouaud J, Séroussi B (2019) Explainable artificial intelligence for breast cancer: a visual case-based reasoning approach. Artif Intell Med 94(January):42–53. 10.1016/j.artmed.2019.01.001 [DOI] [PubMed] [Google Scholar]
- Lorencin I, Anđelić N, Španjol J, Car Z (2019) Using multi-layer perceptron with Laplacian edge detector for bladder cancer diagnosis. Artif Intell Med 102(May):2020. 10.1016/j.artmed.2019.101746 [DOI] [PubMed] [Google Scholar]
- Marik A, Chattopadhyay S, Singh PK (2023) A hybrid deep feature selection framework for emotion recognition from human speeches. Multimedia Tools Appl 82(8):11461–11487. 10.1007/s11042-022-14052-y [Google Scholar]
- Mohammed MA, Abdulkareem KH, Dinar AM, Zapirain BG (2023a) Rise of deep learning clinical applications and challenges in omics data: a systematic review. Diagnostics 13(4):1–30. 10.3390/diagnostics13040664 [DOI] [PMC free article] [PubMed] [Google Scholar]
- Mohammed MA, Lakhan A, Abdulkareem KH, Garcia-Zapirain B (2023b) Federated auto-encoder and XGBoost schemes for multi-omics cancer detection in distributed fog computing paradigm. Chemom Intell Lab Syst 241(July):104932. 10.1016/j.chemolab.2023.104932 [Google Scholar]
- Mohammed MA, Lakhan A, Abdulkareem KH, Garcia-Zapirain B (2023c) A hybrid cancer prediction based on multi-omics data and reinforcement learning state action reward state action (SARSA). Comput Biol Med 154(February):106167. 10.1016/j.compbiomed.2023.106617 [DOI] [PubMed] [Google Scholar]
- Naruei I, Keynia F (2021) A new optimization method based on COOT bird natural life model. Expert Syst Appl 183(April):115352. 10.1016/j.eswa.2021.115352 [Google Scholar]
- Pashaei E, Pashaei E (2023) Hybrid binary COOT algorithm with simulated annealing for feature selection in high-dimensional microarray data. Neural Comput Appl 35(1):353–374. 10.1007/s00521-022-07780-7 [Google Scholar]
- Peng S, Xu Q, Ling XB, Peng X, Du W, Chen L (2003) Molecular classification of cancer types from microarray data using the combination of genetic algorithms and support vector machines. FEBS Lett 555(2):358–362. 10.1016/S0014-5793(03)01275-4 [DOI] [PubMed] [Google Scholar]
- Punitha S, Al-Turjman F, Stephan T (2021) An automated breast cancer diagnosis using feature selection and parameter optimization in ANN. Comput Electr Eng 90(February 2020):106958. 10.1016/j.compeleceng.2020.106958 [Google Scholar]
- Ramezani I, Vosoughi N, Moshkbar-Bakhshayesh K, Ghofrani MB (2023) Evaluation of the performance of different feature selection techniques for identification of NPPs transients using deep learning. Ann Nucl Energy 183(November):109668. 10.1016/j.anucene.2022.109668 [Google Scholar]
- Reis HC, Turk V (2022) COVID-DSNet: a novel deep convolutional neural network for detection of coronavirus (SARS-CoV-2) cases from CT and Chest X-ray images. Artif Intell Med 134(October):102427. 10.1016/j.artmed.2022.102427 [DOI] [PMC free article] [PubMed] [Google Scholar]
- Sahu B, Dash S (2024a) Optimal feature selection from high-dimensional microarray dataset employing hybrid IG-Jaya model. Curr Mater Sci Former Recent Patents Mater Sci 17(1):21–43 [Google Scholar]
- Sahu B, Dash S (2024b) Hybrid multifilter ensemble based feature selection model from microarray cancer datasets using GWO with deep learning. In: 2023 International conference on intelligent technologies, June 2023, pp 1–6. 10.1109/CONIT59222.2023.10205668
- Sahu B, Dash S (2024c) Feature selection with novel mutual information and binary Grey Wolf waterfall model. In: 2023 International conference in advances in power, signal, and information technology, June 2023, pp 29–34. 10.1109/APSIT58554.2023.10201689.
- Shen Q, Shi WM, Kong W, Ye BX (2007) A combination of modified particle swarm optimization algorithm and support vector machine for gene selection and tumor classification. Talanta 71(4):1679–1683. 10.1016/j.talanta.2006.07.047 [DOI] [PubMed] [Google Scholar]
- Shirwaikar RD, Dinesh Acharya U, Makkithaya K, Surulivelrajan M, Srivastava L, Lewis U LES (2019) Optimizing neural networks for medical data sets: a case study on neonatal apnea prediction. Artif Intell Med 98:59–76. 10.1016/j.artmed.2019.07.008 [DOI] [PubMed] [Google Scholar]
- Shu W, Yan Z, Yu J, Qian W (2023) Information gain-based semi-supervised feature selection for hybrid data. Appl Intell 53(6):7310–7325. 10.1007/s10489-022-03770-3 [Google Scholar]
- Soares F, Becker K, Anzanello MJ (2017) A hierarchical classifier based on human blood plasma fluorescence for non-invasive colorectal cancer screening. Artif Intell Med 82:1–10. 10.1016/j.artmed.2017.09.004 [DOI] [PubMed] [Google Scholar]
- Sowan B, Eshtay M, Dahal K, Qattous H, Zhang L (2023) Hybrid PSO feature selection-based association classification approach for breast cancer detection. Neural Comput Appl 35(7):5291–5317. 10.1007/s00521-022-07950-7 [Google Scholar]
- Stoean R (2020) Analysis on the potential of an EA–surrogate modelling tandem for deep learning parametrization: an example for cancer classification from medical images. Neural Comput Appl 32(2):313–322. 10.1007/s00521-018-3709-5 [Google Scholar]
- Sun L, Yang Y, Liu Y, Ning T (2023) Feature selection based on a hybrid simplified particle swarm optimization algorithm with maximum separation and minimum redundancy. Int J Mach Learn Cybern 14(3):789–816. 10.1007/s13042-022-01663-y [Google Scholar]
- Towfek SK, Khodadadi N, Abualigah L, Rizk F (2024) AI in higher education: insights from student surveys and predictive analytics using PSO-guided WOA and linear regression. J Artif Intell Eng Pract 1(1):1–17. 10.21608/jaiep.2024.354003 [Google Scholar]
- Vijaya Kumar DTT, Mahammad Shafi R (2023) A fast feature selection technique for real-time face detection using hybrid optimized region based convolutional neural network. Multimedia Tools Appl 82(9):13719–13732. 10.1007/s11042-022-13728-9 [Google Scholar]
- Yaqoob A (2024) Combining the mRMR technique with the Northern Goshawk Algorithm (NGHA) to choose genes for cancer classification. Int J Inf Technol. 10.1007/s41870-024-01849-3 [Google Scholar]
- Yaqoob A, Bhat MA, Khan Z (2023a) Dimensionality reduction techniques and their applications in cancer classification: a comprehensive review. Int J Genet Modific Recombin 1(2):34–45 [Google Scholar]
- Yaqoob A, Musheer Aziz R, Verma NK (2023b) Applications and techniques of machine learning in cancer classification: a systematic review. Human Centric Intell Syst. 10.1007/s44230-023-00041-3 [Google Scholar]
- Yaqoob A, Aziz RM, Verma NK, Lalwani P, Makrariya A (2023c) A review on nature-inspired algorithms for cancer disease prediction and classification. Mathematics 11:1018 [Google Scholar]
- Yaqoob A, Verma NK, Aziz RM (2024a) Improving breast cancer classification with mRMR + SS0 + WSVM: a hybrid approach. Multimedia Tools Appl. 10.1007/s11042-024-20146-6 [Google Scholar]
- Yaqoob A, Kumar N, Rabia V, Aziz M (2024b) Optimizing gene selection and cancer classification with hybrid sine cosine and cuckoo search algorithm. J Med Syst. 10.1007/s10916-023-02031-1 [DOI] [PubMed] [Google Scholar]
- Yu H, Gu G, Liu H, Shen J, Zhao J (2009) A modified ant colony optimization algorithm for tumor marker gene selection. Genom Proteom Bioinf 7(4):200–208. 10.1016/S1672-0229(08)60050-9 [DOI] [PMC free article] [PubMed] [Google Scholar]
Associated Data
This section collects any data citations, data availability statements, or supplementary materials included in this article.
Data Availability Statement
The data that support the findings of this study are available from the corresponding author upon reasonable request. No datasets were generated or analysed during the current study.