

Abstract

Aerosol and aqueous particles are ubiquitous in Earth’s atmosphere and play key roles in geochemical processes such as natural chemical cycles, cloud and fog formation, air pollution, visibility, climate forcing, etc. The surface tension of atmospheric particles can affect their size distribution, condensational growth, evaporation, and exchange of chemicals with the atmosphere, which, in turn, are important in the above-mentioned geochemical processes. However, because measuring this quantity is challenging, its role in atmospheric processes was dismissed for decades. Over the last 15 years, this field of research has seen some tremendous developments and is rapidly evolving. This review presents the state-of-the-art of this subject focusing on the experimental approaches. It also presents a unique inventory of experimental adsorption isotherms for over 130 mixtures of organic compounds in water of relevance for model development and validation. Potential future areas of research seeking to better determine the surface tension of atmospheric particles, better constrain laboratory investigations, or better understand the role of surface tension in various atmospheric processes, are discussed. We hope that this review appeals not only to atmospheric scientists but also to researchers from other fields, who could help identify new approaches and solutions to the current challenges.
1. Introduction
Surface tension is a key parameter that controls the shape and size of liquid particles present in another medium and the exchange of matter across their interface. It is thus expected to affect some important properties of the liquid particles present in Earth’s atmosphere and the processes in which they are involved, such as their formation and growth, size distribution, potentially their chemical evolution, and optical properties, all of which are important for the atmosphere and climate. However, measuring the surface tension of atmospheric particles is challenging. In fact, at the time of publication of this review, the surface tension of individual atmospheric particles has not yet been directly measured. Thus, for decades, the role of this parameter in atmospheric processes was neglected, and its value was systematically assumed to be equal to that of pure water. This has changed over the last 15 years with the emergence of various experimental approaches that are now giving some information about the surface tension of atmospheric aerosol samples and relevant laboratory mixtures or particles. This review presents an overview of this field of research, including a presentation of some basic concepts related to surface tension, emphasizing a molecular-level description (Section 1), a discussion of the atmospheric processes, in which surface tension is expected to play a role (Section 2), a presentation of the relevant measurement techniques (Section 3), and the current knowledge of the surface tension of atmospheric particles (Section 5). Section 4 presents a unique inventory of the experimental adsorption isotherms for about 130 water/organic mixtures, which can be used to develop relationships between molecular structure and surface tension in models or to validate other types of surface tension models for atmospheric particles. The last section of this review (Section 6) discusses the remaining challenges and identifies future areas of research such as future technical developments that would better constrain fundamental (laboratory) investigations, future investigations improving the understanding of atmospheric processes, and future areas of research addressing more specifically environmental issues. Previous reviews have discussed some aspects of the surface tension of atmospheric particles, but primarily focusing on specific processes, mostly cloud droplet formation,1,2 or on the compounds present at the surface of atmospheric aerosols and their properties.3,4 Other reviews have focused on the measurements techniques for surface tension.5,6 The sections overlapping with these previous articles have been kept as concise as possible in the present review to emphasize the complementary aspects and updates, and we refer to these articles for more complete information. Surface tension models themselves are beyond the scope of this review, and we refer to previous articles and reviews7−14 for more information on these theoretical approaches. We hope that, beyond atmospheric chemistry, this review raises the interest of chemists and chemical physicists from other fields to develop cross-disciplinary collaborations and possibly identify new solutions to the current challenges.
1.1. Definitions and Key Concepts
The following definitions are basic and can be found in textbooks. They are presented only briefly to clarify potential discrepancies between the concepts used in atmospheric chemistry and in other fields of chemistry and chemical physics. They are also presented to propose, whenever possible, a molecular description of the relevant processes and properties, most of which are inspired by the book of Rosen and Kunjappu.15
The historical definition of the surface tension, σ, by Gibbs16 is that of a thermodynamic and, thus, a macroscopic quantity: the energy per unit of surface area corresponding to the change dA to a surface area A, resulting from applying the element of work, dW:
| 1 |
where σ is usually expressed in mN m–1. Note that the surface tension is represented by the symbol “γ” in most fields of chemistry and chemical physics but by “σ” in the atmospheric chemical literature.
It has been recently demonstrated that the surface tension of solids is not related to their surface energy, thus that the Gibbs definition of surface tension does not apply to them.17 The present review thus discusses essentially the surface tension of liquid particles and mixtures. Surface tension effects can, however, been considered in solids such as the ice particles discussed in Section 2.4. Evidence has also been reported that solid particles such as soot coated with surface-active organic compounds, such as oleic acid or adipic acid, were more efficient in condensing water,18,19 which could potentially be attributed to surface tension effects.
Surface tension has a constant value (static surface tension) if the system of interest (bulk liquid or particle in contact with another phase) is equilibrated. However, with a rapidly changing system or interface, the surface tension will converge toward the new equilibrium value with some delay (dynamic surface tension), mostly due to diffusion effects.20,21 For atmospheric particles, such rapid changes in the interface occur, for instance, at the point of activation of forming water droplets or during the nucleation of new particles (see Section 2). The diffusion coefficients estimated for surfactants from atmospheric aerosols suggest that their diffusion time to the surface of a 1 μm-radius particle would be of the order of 1–100 s.22 Water droplet activation processes in the atmosphere are estimated to occur over the same time scale. Experimental measurements of the dynamic surface tension of aqueous solutions of amphiphilic surfactants (see Section 1.2.3 below) have shown that the largest differences between the static and dynamic surface tension occur at time scales shorter than 1 s.20,23 These dynamic surface tension effects are thus expected to have limited impacts on the atmospheric processes involving particles, as confirmed by recent measurements.24 The remainder of this review thus focuses on the static surface tension.
The International Union for Pure and Applied Chemistry (IUPAC)25 defines a surfactant as “a substance which reduces the surface tension of the medium in which it is present”. The above definition implies that surfactants are at low molar fraction in the medium (otherwise they are part of the medium itself) so that this condition is explicit in the definition used in surfactant science: “a substance which, at low concentration, reduces the surface tension of the medium”.15 Since the term “surfactant” is the contraction of “surface-active agent”,15,25 both terms have the same meaning, as well as similar terms such as “surface-active compounds”. In the atmospheric chemical literature there is often confusion between surfactants and organic coatings, surface layers, or surface films.4 The latter differ from surfactants, as they form separate phases at the surface of the liquids without (necessarily) lowering their surface tension. Organic coatings, surface layers, and surface films will not be further discussed in this review, unless they clearly involve surface tension effects, and we refer to previous reviews3,4 for more information on such systems.
Since surfactants act on the surface tension at low molar fraction, they can be described, from a molecular point of view, as molecules present in small concentration in a solvent. In atmospheric chemistry the solvent of highest relevance is water but, as will be underlined in Section 2, surface tension can also play a role in particles made of other substances, such as concentrated sulfuric acid (as in newly nucleated particles) or organic liquids (as in Secondary Organic Aerosols). Surfactant molecules reduce the surface tension by replacing a small fraction of the solvent molecules at the surface and weakening the interactions between them.15 To achieve this, the surfactant needs to be not entirely soluble in the solvent, i.e., is dissolved in the solvent only up to a specific concentration, beyond which it builds a separate phase on top of it. Their presence in the solvent thus results in a distortion of the solvent structure and in an increase of the free energy of the mixture.15 However, the surfactant also needs to be at least partly soluble in the solvent to avoid being expelled into the adjacent phase (e.g., into the gas for a liquid/gas system), since the mixture will tend to minimize its energy by reducing the contact between the surfactant and the solvent and expelling the surfactant to the surface. Most organic compounds fulfill this partial solubility criterion in aqueous mixtures, thus acting as a surfactant with various degrees of efficiency (see Section 4). However, sugars, which are highly soluble in water, do not significantly reduce the surface tension of aqueous solutions (in fact, they tend to increase it). Similarly, organic compounds do not act as surfactants in organic solvents or particles in which they are fully soluble. At the opposite, the most efficient surfactants in aqueous solutions are amphiphilic compounds, which possess both a water-soluble (hydrophilic) moiety and nonwater-soluble (hydrophobic) molecular chains. The different types of surfactants potentially present in atmospheric aerosols have been discussed in previous reviews3,4 and the role of the molecular structure on the surfactant efficiency will be further discussed in Section 4.
1.1.1. Variation of the Surface Tension with Surfactant Concentration: Adsorption Isotherms
Building on the thermodynamic description of the surface tension (eq 1), the relationship between the surface concentration of surfactant, Γ, and the corresponding bulk concentration, C, is described with an adsorption isotherm, where the term “isotherm” indicates that it is established for a given temperature. However, for liquid/liquid and liquid/gas systems, the surfactant concentration at the interface can not be easily measured, and the Gibbs adsorption equation is rather expressed as a relationship between the surface tension of the mixture, σ, the surface concentration, Γi, and chemical potential, μi (thus, the bulk concentration) of the different components “i” present in the mixture:
| 2 |
For each component in the system
| 3 |
where ai = activity of compound i, R the gas constant, and T temperature. Thus, for system made of a solvent (for instance, water) with a1 ∼ 1 and a surfactant with a2 ∼ C, the bulk concentration, and Γ2 = Γm,
| 4 |
Eq 4 thus gives the variation of σ with the concentration of surfactant, C. Integrating eq 4 is not straightforward, and various assumptions can be used. An empirical equation that is often used to approximate the integration of eq 4 is the Szyszkowski equation:
| 5 |
where K is a constant depending on the surfactant, and σw is the surface tension of the pure solvent (here, assumed to be water). Numerous examples of adsorption isotherms are presented in Section 4 of this review, displaying a large range of shapes. Nonamphiphilic compounds accumulate at the surface of a mixture proportionally to their concentration in the bulk. This results in isotherms displaying two main regions: a first region at low bulk concentration, C, where σ ∼ σw, followed by a second region where σ decreases with C, until the concentration reaches the maximum solubility of the compound in water. Such isotherms are often described with a Szyszkowski-type equation (eq 5). By contrast, amphiphilic surfactants accumulate essentially at the surface (or interface) of a mixture so that their bulk concentration, C, is very small until the surface reaches saturation. When surface saturation is reached the surface tension is at its minimum value, σo. Beyond this concentration, the surfactant molecules do not dissolve in the bulk but produce micelles, which are highly organized phases and distinct from the bulk solution phase. The surface tension of the mixture does not further decrease with C but remains constant at σo. The value of C for which surface saturation is reached is thus called Critical Micelle Concentration (CMC). As a result, the adsorption isotherms for amphiphilic compounds display three distinct regions: a region at low C where σ = σw, an intermediate region where σ decreases sharply with C to reach σo, and a third region at large C where σ is constant and equal to σo (this last part is not predicted by the Szyszkowski equation, eq 5).
1.2. Surfactant Properties and External Parameters Affecting the Surface Tension
This section lists the various parameters affecting the surface tension of particles and mixtures, which includes both properties of the surfactants themselves (semisoluble surfactants, amphiphilic surfactants, etc.) and properties resulting from the medium in which they are present (mixing effects, geometric effects, etc.).
1.2.1. In Aqueous Media: Hydrogen Bond and Solvation
In aqueous solutions, the most important type of mixtures for atmospheric particles, the main molecular interactions between the solvent molecules (water) are hydrogen bonds. These bonds are responsible for the exceptionally large surface tension of water, σ (293 K) = 72.8 mN m–1. Although the strongest hydrogen bonds are those between water molecules, hydrogen bonding can also occur in other solvents containing hydrogen and electronegative atoms, such as oxygen, nitrogen, or halogen atoms: sugars, alcohols, organic acids, for instance. However, many organic compounds form only weak or no hydrogen bonds and, as solvents, have a surface tension markedly lower than that of water (typically, σ ≤ 30 mN m–1).26
As a consequence, semisoluble organic molecules present in aqueous mixtures, which do not form significant hydrogen bonds with water, weaken the hydrogen bonds between the water molecules and reduce the surface tension of the mixtures (see examples for many different organic molecules in Section 4). This effect is, however, modest and usually requires large bulk concentrations (>1 M) to substantially lower the surface tension (δσ > 10 mN m–1). It also decreases rapidly with dilution. Highly water-soluble organic molecules, such as sugars, which form substantial hydrogen bonds with water, do not act as surfactants as they do not fulfill the condition of partial solubility of surfactants. In addition, the formation of solvation shells (or solvation cages) around these compounds creates new structures for the water molecules, thus reinforcing the cohesion of the solvent and increasing the surface tension (see Section 4).
1.2.2. In Ion-Containing Media: Electrostatic Interactions
Ions, especially inorganic ones, are ubiquitous in the natural environment, including atmospheric aerosols. They strongly affect the interactions between the solvent molecules in which they are present and, thereby, the surface tension because they generate strong electrostatic forces. Depending on the solvent and on their charge and size, ions can either strengthen or weaken the cohesion between the solvent molecules and, thus, the surface tension. Inorganic salts such as NaCl and (NH4)2SO4 and, therefore, ions such as Na+, Cl–, SO42–, and NH4+ are ubiquitous and abundant in atmospheric particles. However, because they are fully soluble in aqueous mixtures, they do not act as a surfactant. However, the strong electrostatic fields that they produce reinforce the cohesions between the water molecules, resulting in the well-known effect of inorganic salts in increasing the surface tension of aqueous mixtures compared with pure water. The intensity of these effects depends on ions with their charge/radius ratio. Thus, among anions, SO42– has a larger effect than Cl– and, among cations, NH4+, has stronger effects than Na+.27,28 However, as electrostatic forces decrease rapidly with the distance between the charges, all of these effects decrease rapidly with dilution. Note, however, that the electrostatic interactions generated by dissolved inorganic ions also affect other components of solutions beside the solvent molecules and that their overall effects on the surface tension can be opposite to their effect in water alone (see Section 1.2.5 below).
1.2.3. Amphiphilic Interactions
As explained above, the most efficient surfactants for aqueous mixtures are amphiphilic molecules (also called amphipathic), carrying both a hydrophilic group (water-soluble) and one or more hydrophobic (=nonwater-soluble) groups (usually organic chains). In a water/air system, their hydrophobic groups ensure that their presence is essentially limited to the surface, the hydrophobic chains being in the air above the surface, where they can adopt a range of conformations (Figure 1). At the same time, their water-soluble moieties ensure their “anchoring” in the aqueous phase and prevent the molecules from being expelled from the aqueous phase and forming a separate phase above the surface. The physical process by which amphiphilic molecules lower the surface tension of aqueous solutions has been the subject of numerous experimental and theoretical studies (the latter mostly by molecular dynamics simulations).29,30 This effect is generally accepted to result from micromechanical “push-pull” effects of the hydrophobic chains perpendicular to the surface, as evidenced, for instance, by correlations between the surface tension and the chain length and rigidity of different amphiphilic surfactants.29 Depending on their water-hydrophilic group, amphiphilic compounds are classified as anionic, cationic, zwitterionic, or nonionic.15 These properties affect, for instance, their affinity toward negatively or positively charged surfaces.
Figure 1.

Illustration of the salting out and solvation of an amphiphilic surfactant (represented by the molecules with a long “tail”) by inorganic ions (red and green dots) and distribution of the different components between the surface and the bulk of an aqueous solution. From ref (60). Copyright 2020 American Chemical Society. Licensed under the CC-BY-NC-ND.
1.2.4. Macromolecules
Some organic molecules found in atmospheric aerosols contain more than 20 C atoms and have a molecular weight of several hundred Da or more. From the point of view of atmospheric chemistry, they can be considered as macromolecules, even though in chemistry and biochemistry this term is usually employed for much larger molecules. They include biopolymers (polysaccharides such as cellulose, chitosan, chitin, starch, etc.; polypeptides such as collagen and gelatin, etc.),31,32 polymers from biomass burning (some Polycyclic Aromatic Hydrocarbons, PAHs, and graphitic material, etc.),33−37 gels and hydrogels (extracellular polymeric substances),38−40 and polyphenolic compounds (lignin, humic, and fulvic substances).41−45 Their large molecular structure limits their solubility in water, thus allowing them to act as a surfactant. Some of those reported in atmospheric particles, and their commercial reference, have been shown to reduce the surface tension of aqueous solutions (see also Section 4, Table 5). They include fulvic acids (Suwannee River Fulvic Acid, SRFA41,44,46−48 and Nordic Aquatic Fulvic Acids, NAFAs41,49,50), commercial humic acid,48,51,52 aerosol-extracted Humic-Like substances (HULISs),41,42,44 and microbial or environmentally extracted Extracellular Polymeric Substances (EPSs).53−55 The mode of action of these macromolecular compounds on the surface tension of aqueous mixtures is unclear. Aqueous solutions of macromolecules have been shown to undergo liquid–liquid phase separation and organize internally to lead to ultralow surface tension (down to 1 mN m–1).56,57 Such effects can thus not be excluded with humic substances, HULISs, and EPSs. However, humic and fulvic substances have also been shown to have some amphiphilic properties,58 and EPSs to contain non-negligible fractions of amphiphilic compounds.59 Thus, their surface tension properties could also partly result from these amphiphilic properties.
Table 5. List of the Binary Mixtures of Macromolecules in Water Included in This Inventory.
| n. | Type | Common name (IUPAC Name) | MW (g mol–1) | *σmin (mN m–1) | **ρ (g/cm3) | ***Atmos. ? | Method |
|---|---|---|---|---|---|---|---|
| MA1 | macromolecules | SRFA (Suwannee river fulvic acid) | 57043 | 64.6,41 52.0,46 38.2,44 51.9,47 44.748 | 1.543 | PD,41,44,46,47 WP48 | |
| MA2 | macromolecules | NAFA (Nordic aquatic fulvic acid) | 4266359 | 63.4,41 55.2,49 52.550 | 1.5b | PD,49,50 NR41 | |
| MA3 | macromolecules | humic acid (commercial) | 226.14a | 48.1,51 52.5–65.8,48 58.7,52 57.5360 | 1.5b | WP,48,52 NR51,360 | |
| MA4 | macromolecules | HULIS (humic like substances) | ∼507 (410–610)44 | 49.6,42 ∼48.1 (41.8–53.0),41 41.4–42.944 | 1.643 | Y | NR,41 PD42,44 |
| MA5 | macromolecules | EPS (extracellular polymeric substances) | ∼158000 (62.4–213.1 kDa)361 | 52,53 66.6,54 59.6–61.555 | NR53−55 |
Data measured at 20–25 °C.
Data measured at 15–25 °C.
Reported in atmospheric aerosols; WP = Whilhelmy plate; PD = pending droplet, NR = Nouy ring.
Commercial Humic acid sodium salt C9H8Na2O4 68131-04-4 Thermo Scientific Chemicals.
Extrapolated from the surface tension of SRFA.43
1.2.5. Mixing Effects: Salting Out
In contrast with the increase in surface tension resulting from the presence of inorganic ions alone in water, adding inorganic ions to aqueous mixtures containing organic surfactants further reduces the surface tension. This effect has been observed both with nonamphiphilic, semisoluble organic compounds41,49,61−68 and with amphiphilic surfactants.60,68−74 It is known to result from the “salting out” of the organic molecules toward the surface, and is quantified by a Setschenow (or salting out) coefficient, Ks [M–1].15,75−77 In this process, the strong electrostatic interactions result in a strong reorganization of the water molecules as solvation shells (or “cages”) around the ions (Figure 1), thus lowering the solvation of the organic compounds and increasing the energy of the mixture.15 To minimize this energy, the organic molecules are “pushed” to the surface, resulting in larger surface concentration and thus lower surface tension than in the absence of salt. It also implies that surface saturation is reached with lower surfactant concentration and thus that the CMC is shifted to lower concentrations. As for the electrostatic interactions described above in Section 1.2.2, different anions and cations have different efficiencies in these processes, depending on their charge/radius ratio. Thus, SO42– and NH4+ have stronger salting out effects than Cl– and Na+,15 resulting in a more efficient surface tension reduction.
The salting out of organic surfactants by inorganic salts and additional reduction of the surface tension has been evidenced not only with bulk mixtures but also with submicrometer particles, both artificial ones49,67,78 and particles generated from surfactants extracted from atmospheric aerosols.64 In all cases, combining surface tension measurements with CN/CCN or CCN growth factor measurements (where “CN” stands for “Condensation Nuclei” and “CCN” for “Cloud Condensation Nuclei”) revealed that adding inorganic salts to the organic particles further decreased their critical supersaturation, which was unambiguously attributed to a decrease in the surface tension rather than to hygroscopic effects. In some cases, the critical supersaturation obtained with the mixed particles was even below that obtained with the salt alone,49,64 thus evidencing synergistic effects (see also definition in next paragraph) even in activated particles. This was shown, in particular, for particles made of organic fractions extracted from atmospheric (biomass burning) aerosols, displaying surface-active properties, with σ = 35–68 mN m–1. Adding (NH4)2SO4 to these particles reduced the critical supersaturation to below the value for pure (NH4)2SO4 particles.64 Salting out effects are thus important to take into account in atmospheric aerosols.
1.2.6. Mixing Effects: Nonideality, Synergism, and Antagonism
Atmospheric particles contain different types of organic compounds, which can affect the surface tension in different ways than simply adding their individual contributions. The simplest description of such mixtures is a two-component organic mixture including an organic acid that is abundant in atmospheric aerosols, such as oxalic, succinic acid, and an amphiphilic surfactant in a much smaller molar fraction. If these two components do not interact molecularly, i.e., have no direct or induced electrostatic attraction or repulsion between them (or at least not more than between each compound and the solvent) the mixture is defined as ideal.79 In that case, its overall properties, in particular the surface tension and CMC, is simply the combination of the contributions of each component, weighted by their relative molar fractions. However, if the organic components interact, the surface tension or CMC of the mixture can be lower or higher than expected for an ideal mixture, and the mixture is said to be nonideal. In some extreme cases, the overall surface tension can be even lower than both those for the pure components, and the mixture is said to be synergistic.15 Inversely, if the surface tension of the mixture is larger than those of the pure components, the mixture is antagonistic.15
Until now, mixing and ideality effects have mostly been studied for mixtures of different amphiphilic compounds. The molecular interactions between surfactants at the surface of a liquid and in the bulk during micelle formation are very different. At the surface, all the surfactant molecules have the same orientation, hydrophilic end in water and hydrophobic chains in the air above the surface. Thus, attraction or repulsion between surfactants can occur either between the hydrophilic ends at the surface or between the hydrophobic chains just above the surface. By contrast, the molecular interactions (attractions or repulsion) taking place in the bulk during micelle formation involve the entire surfactant molecules, which can take any orientation or conformation, thus leading to a wide variety of micelle structures. These different interactions at the surface and in the bulk explain why some mixtures of surfactants can be nonideal in surface tension but ideal in CMC, and vice versa.15,80 Examples of mixtures reported to be nonideal, and even synergistic or antagonistic, on the surface tension but ideal in CMC are mixtures of dodecyltrimethylammonium bromide (DTAB), and didodecyldimethylammonium bromide (DDAB) in water.80,81 Recently, it has been shown that mixtures of amphiphilic compounds (Sodium Dodecyl Sulfate or SDS, CetylTrimethyl Ammonium Chloride or CTAC, Triton X100/X114, Brij35) with oxalic and glutaric acid are nonideal in surface tension, even exhibiting some synergistic effects, but ideal in CMC.68 The nonideal effects on the surface tension were attributed to weakly repulsive effects (ionic or dipole–dipole) between the two types of molecules at the surface, thus reducing the surface tension. Synergistic effects on the CMC, such as observed in mixtures of different amphiphilic surfactants, are attributed to the formation of mixed micelles, i.e., including the two types of molecules.15,82 Antagonistic effects on the CMC are attributed to competition or steric hindrance between the two surfactants during the formation of the micelles.15,82
Nonideality, synergism, and antagonism are also likely to take place within the mixtures of amphiphilic surfactants present in atmospheric particles. However, to simplify the description of the surface tension of atmospheric aerosols, it might be easier to consider these amphiphilic mixtures as a single component, with net surface properties and isotherms resulting from all the interactions in the mixture.
1.2.7. Surface Curvature: Tolman Length
Because the surface tension results from the interactions between molecules at the surface of a liquid, it can be affected by the geometry of this surface. In small particles the curvature of the surface results in larger distances between the solvent molecules than in flat surfaces, thus weakening the interactions between the molecules83 and lowering the surface tension compared to flat surfaces. The impact of such geometry on the surface tension has been extensively studied since the 1950s84−86 and resulted in the definition of a characteristic radius, Tolman length, δ, for which the surface tension of a substance diverges significantly from that of a planar surface. For most substances the Tolman length is less than 1 nm:84,87,88 δ = 0.2189 and 0.53 nm87 for pure water (Figure 2), δ = 0 0.1 nm for deliquescent NaCl particles,86 and δ = 0.5–0.7 nm for organic compounds such as pentane and heptane.88 Most of these estimates are, however, obtained from theoretical models, as measuring this quantity experimentally is difficult and experimental values are scarce. In conclusion, particles made of pure substances or of homogeneous mixtures (i.e., having the same composition throughout the particle) have the same surface tension as flat surfaces of the same composition, down to radii as small as a few nanometers.
Figure 2.

Variation of the surface tension of water (here, “γ”) as a function of the particle radius predicted by different models (dashed line = fit with Tolman’s equation; continuous line: modified Tolman model accounting for the size-dependent surface energy; dots: simulation of the system using thermodynamic perturbation theory). Adapted with permission from ref (87). Copyright 2005 American Chemical Society.
It is interesting to note that, in small particles, the “Tolman effect” on the surface tension and the well-known Kelvin effect83 on the vapor pressure (i.e., a larger vapor pressure of a compound above a curved surface than above a flat surface) are two sides of the same molecular phenomenon: the weakening of the bonds between the molecules on the curved surface. In the Kelvin effect, the weakening of the bonds allows more molecules to leave the surface for the gas, thereby increasing the vapor pressure. This effect becomes significant for larger radii (several 10 of nm) than the “Tolman effect” (≤1 nm) because the molecules occupy more space in the gas than in the condensed phase (or at the surface), thereby resulting in a stronger effect on the vapor pressure than on the surface tension. While the Kelvin effect is the main constraint in homogeneous nucleation processes, and largely taken into account to describe the nucleation of new aerosol particles and water droplets in the atmosphere, the role of surface tension in these processes has been much less taken into account (see Section 2).
1.2.8. Surface/Volume Ratio: Bulk-to-Surface Partitioning
Because surfactants accumulate primarily at the surface of liquids rather than in the bulk, the existence of concentration gradients for these compounds inside small particles, referred to as bulk-to-surface partitioning, was proposed.90 The main implication is that, for a given ratio of total surfactant molecule number to sample volume (indicated as bulk concentration in adsorption isotherms), the surface tension of small particles would be larger than that of large-volume samples. As a discussion of surface tension models is beyond the scope of the present review, we refer to previous articles2−4,8,91,92 for more details on these theoretical discussions. Practically, bulk/surface partitioning implies that the surface tension values obtained from large-volume samples (>μL, corresponding to a particle radius of ∼1 mm), using classical techniques such as Wilhelmy plates, Du Noüy ring, or pendant drop (see Section 3) should underestimate the surface tension of microscopic particles of the same composition. As further discussed in Section 6, the occurrence and magnitude of these partitioning effects is still being debated, as very few experimental setups are able to investigate them and give somewhat contradictory results. For now, we underline in Section 3 that the measurements obtained from large-volume samples might need to be corrected for partitioning effects to be applied to micrometer or submicrometer particles.
1.2.9. Temperature
As the temperature increases the motion of molecules, it weakens the interactions at the surface of liquids. Thus, high temperature reduces the surface tension, while low temperature increases it. The effects are, however, relatively small over the range of atmospheric temperature. The surface tension of water decreases by about 10% between 273 and 323 K.93 And while the surface tension of pure organic compounds varies by as much as 40% over the same range94 (Figure 3) it varies much less when they are present in aqueous solutions (<5% over 290–330 K).95 No significant effects of temperature was observed either on the CMC of SDS mixtures over 298–313 K.96
Figure 3.
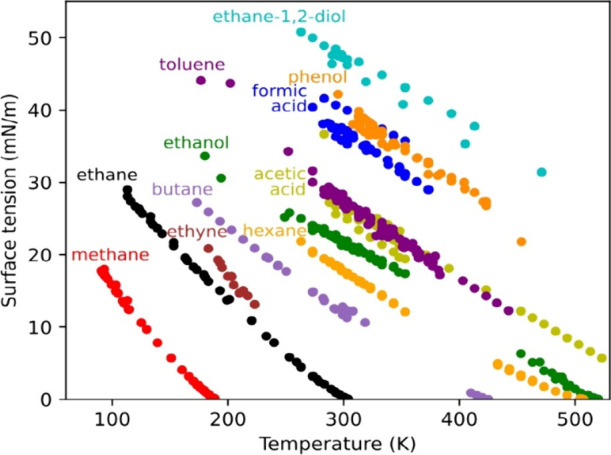
Variation of the surface tension with temperature for various organic compounds. Plotted from the surface tension data from ref (94). Reproduced with permission of SNCSC. Copyright 1997 Springer-Verlag.
2. The Role of Surface Tension in Atmospheric Processes
Surface tension affects a number of phenomena and properties in gas/liquid systems, from their shape and size (spherical shape of droplets, formation or dampening of surface waves, etc.) and other capillary phenomena97 to the more complex Marangoni effects,98 resulting in common observations such as tears of wine and coffee stains.99 It also affects the transfer of mass and heat across the gas/liquid interface.100−104 Surface tension is thus expected to control many important properties and processes in atmospheric particles and droplets (Figure 4, top). However, only a few of them have been studied so far, which are discussed below. We emphasize again that the present review discusses exclusively the processes directly related to surface tension and not those involving organic coatings and surface films, for which we refer to previous reviews.3,4 The studies discussed below are thus either those in which surface tension was measured and a reduction evidenced or those that involve amphiphilic surfactants. It is also important to keep in mind that, besides actual atmospheric processes, surface tension is likely to be important in most of the techniques used for generating artificial particles in the laboratory. These techniques and their limits are directly relevant to the understanding of atmospheric processes as generating artificial particles in a controlled way, i.e., with a controlled composition and size distribution, is essential for constraining fundamental investigations.
Figure 4.

A) Overview of the atmospheric processes in which surface tension can potentially play a role; B) Variation of the surface tension (σ) of nanodroplets containing different amounts of organic molecules (represented by Norg = number of organic molecules) during the condensation of water (Nw = water molecule number). From ref (122). Copyright 2023 American Chemical Society. Licensed under CC-BY-NC-ND 4.0; C) Evolution of the surface tension of sulfur particles during their nucleation, normalized by that of the corresponding flat surface, σ∞, and determined experimentally from their nucleation rate at different temperatures. Reproduced with permission from ref (125). Copyright 2016 Elsevier Ltd.
2.1. Cloud Droplet Formation
The atmospheric process in which the role of surface tension has been the most investigated is by far the formation of cloud droplets. By potentially affecting the size distribution of cloud droplets, surface tension could affect the cloud optical and radiative properties (Figure 4A) and also the cloud lifetime in the atmosphere. Because the Kelvin effect precludes the homogeneous nucleation of liquid water in Earth’s atmosphere (see Section 2.3 below), liquid cloud droplets are formed exclusively by the condensation of water on pre-existing particles, called Cloud Condensation Nuclei (CCN).105 The founding work of Köhler105,106 resulted in an equation describing the equilibrium between the water vapor concentration in the gas (or saturation ratio, S) and the particle radius, r, resulting from the water uptake:
| 6 |
where e is the water vapor pressure, es the saturation water vapor, and Mw and ρw are the molecular weight of water (18 g mol–1) and density of water (1 g cm–3), respectively. In eq 6 three parameters depend on the properties of the initial particle: its initial size (as an offset in the variable r), the water activity, aw, and the surface tension of the particle and forming droplet, σsol. The curves corresponding to eq 6 display a maximum, defining a critical radius, rcrit, and critical in saturation, Scrit, below which (S < Scrit) evaporation dominates and the droplets evaporate and above which (S > Scrit) condensation dominates and the droplets grow. Lowering the surface tension reduces Scrit thus enhances either evaporation or condensation, depending on the conditions of relative humidity (i.e., the value of S). Since these early works, these processes have been the subject of thousands of articles, some of the most representative being refs (1, 8, 9, 107, and 108) and the reviews (1−4), to which we refer for more information. For instance, ref (108) alone is cited by more than 2200 articles, giving a scale for the number of studies focusing on CCN activation over the last 20 years. A small fraction of these studies has addressed specifically the role of surface tension.8,9 For a long time, the approaches to investigate the CCN properties of atmospheric aerosols were almost exclusively the measurement of CCN growth factors with Hygroscopic Tandem Differential Mobility Analyzers, HTDMAs or CCN numbers Cloud Condensation Nuclei Counters, CCNCs.1,109 It is, however, difficult to isolate the effects specifically due to surface tension from other effects (hygroscopcity, etc.) with these instruments. In laboratory, these effects have been distinguished, for instance, by exposing (NH4)2SO4 particles to organic vapors (methylglyoxal and acetaldehyde) and observing a reduction of the critical supersaturation based on CN/CCN measurements.110 However, only a few HTDMA-based observations of surface tension effects have been reported for atmospheric particles: measurements of CCN growth factors in the tropical Atlantic Ocean111 and Central Germany112 indicated that these particles might have a surface tension significantly lower than pure water (50–60 mN m–1).111,112 Recent HTDMA measurements of CCN growth factors in Southern China reported similar observations for newly formed particles (σ ∼ 60 mN m–1).113 To go around the lack of sensitivity of HTDMA and CCNC measurements to surface tension and the absence of direct surface tension measurements for atmospheric particles, different approaches have been developed over the last 15 years to estimate this parameter and its importance in cloud droplet formation. One approach consists of using in models the surface tension properties of surfactants extracted from atmospheric aerosols to estimate the surface tension of atmospheric particles and their contribution to cloud droplet formation. However, such multiple-step approaches result in large uncertainties. More global (or top-down) investigations of the role of surface tension in cloud droplet formation would be advantageous. To our knowledge, at the time of publication of this review, no direct evidence for the role of surface tension on cloud formation or properties has been reported yet. However, some potential future directions of investigation are proposed below in Section 2.5.
2.2. Nucleation of New Particles
Besides aqueous droplets, surface tension is expected to affect the nucleation of all types of materials. This parameter would affect both the condensation processes and the evaporation of the forming nanoparticles (the Kelvin effect). In the atmosphere, this applies to the homogeneous nucleation of sulfuric acid, amines and other organic compounds,114−119 processes reported to be potentially reversible in some observations.120 However, while surface tension in an explicit parameter in nucleation theory,115,117 its value is generally assumed to be constant and its importance for the formation of atmospheric particles has, to our knowledge, not been investigated experimentally. An experimental study of the nucleation of sub-3 nm sulfuric acid particles has shown that the classical condensation model fails to predict the observed growth, as well as its dependence on temperature and RH,121 indicating the involvement of other parameters, which could include the surface tension. Molecular dynamics simulations of the nucleation of organic/water particles,122 have also reported strong deviations of the surface tension from the continuous behavior assumed in usual theories, with surface tension of ∼20 to 40 mN m–1 predicted for sub-4 nm particles (Figure 4, bottom), thus underlining the importance of investigating this parameter experimentally.
To our knowledge, experimental investigations of the role of surface tension in nucleation processes were performed only in fields other than atmospheric science. They further confirm the importance of the surface tension in these processes. For instance, a study measuring the surface tension as a function of the surface curvature for nucleating colloidal particles of polyn-isopropylacrylamide (PNIPAM) in solutions of 3-methylpyridine (3MP) and heavy water showed that a reduction of the surface tension by 20% resulted in an increase of the nucleation rate by 3 orders of magnitude.123 In other studies, the surface tension of nucleating metal zinc and silver particles124 and of sulfur nanoparticles125 (Figure 4, bottom) from the gas phase and its variation with the particle radius (down to less than 1 nm) were determined from their nucleation rates. Given the strong impact of surface tension on nucleation rates, it could be interesting to study this parameter in atmospherically relevant nucleation processes. Some potential directions of investigation are proposed in Section 2.5.
2.3. Uptake of Gases and Heterogeneous Reactions
In addition to condensation/evaporation processes, surface tension is expected to affect the exchange of other compounds across the gas/liquid interface. For instance, adding relatively small surfactants (up to 10 C atoms) to solutions was shown to enhance the uptake of ammonia, NH3,100,104 and carbon dioxide, CO2.103 Inversely, adding long-chain surfactants (C > 10) to aqueous solutions was shown to oppose the uptake of NH3100 and O2,101 with a clear correlation between the surfactant chain length and mass-transfer reduction in the H2O/NH3 system.100 Thus, the surface tension of atmospheric particles is expected to affect the uptake and release of gases, which can, in turn, affect the removal of some gases from the atmosphere, the chemical composition of the particles, and possibly some reactions at the particle surface (heterogeneous reactions).
However, the effect of surface tension on the uptake of gases by atmospheric particles has been little studied. Most focus has been on the effects of organic coatings and surface films on the uptake of gases,3,4 which oppose the exchanges with the gas, but are not related to surface tension. A few exceptions could have been the studies involving amphiphilic surfactants such as Sodium Dodecyl Sulfate (SDS). However, they focused on the oxidation processes at the air/water interface, in particular on the reaction of SDS with an OH radical126,127 and its impact on the reaction rate of an organic compound (Tricarballylic acid, TCA) dissolved in the bulk.127 However, surface tension was not measured in these studies, and its potential effects on the gas uptake and surface reactivity were not investigated. Thus, to the best of our knowledge, the effects of surface tension on the uptake of gases by atmospheric particles and their heterogeneous chemistry still remain to be studied.
2.4. Ice Nucleation
Although, as indicated in Section 1, the Gibbs definition of surface tension might not apply to solids, a number of studies have addressed the potential role of surfactants on the nucleation of ice crystals in the atmosphere (see, for instance, the reviews3,4). This topic is thus briefly discussed here. In Earth’s atmosphere, the formation of ice crystals can occur either by homogeneous nucleation from liquid water at a temperature near or below −38 °C (235 K)105 or by heterogeneous nucleation on pre-existing solid particles, referred to as Ice Nucleating Particles (INPs) at much higher temperature, almost up to 0 °C. These heterogeneous processes can occur in different modes, referred to as immersion freezing, condensation freezing, and contact freezing. In immersion freezing the INP acts as CCN and the resulting water droplet freezes, in condensation freezing water vapor condenses on the INP to form first a liquid droplet, then freezes, and in contact freezing the INP collides with a water droplet, then freezes.128 While immersion freezing involves initially the same processes as described in Section 2.1 for liquid droplets formation, homogeneous nucleation and condensation freezing can be described by classical nucleation theory,129 in which surface tension is an explicit parameter. However, the key surface tension in these processes, and possibly also contact freezing, is that between the ice-nucleating surface (liquid water or INP) and the ice phase.105 Substances such as mineral dust, inorganic salts, soot,130 or biological particles,131 have been reported to act as INPs, i.e., to increase the threshold temperature at which ice crystals are formed. In particular, experimental studies such as refs (132−139) have even evidenced the INP efficiency of monolayers of amphiphilic organic compounds. However, these substances do not affect the interfacial tension between the ice-nucleating surface and the ice phase. Their INP efficiency is due to their highly ordered molecular structures, providing a 2D-lattice pattern favoring the nucleation of hexagonal ice. To our knowledge, no experimental data are available on the interfacial tension between the ice-nucleating surface and the ice phase, as this parameter is very challenging to measure. Such experimental data would be interesting to have. However, unlike for liquid surfaces, this interfacial tension is not expected to vary significantly during the ice nucleation processes in the atmosphere or to be affected by the presence of surfactants and, thus, to be a limiting factor in the nucleation processes.
2.5. Perspectives on the Investigations of Surface Tension in Various Atmospheric Processes
As discussed in this section, the role of surface tension in atmospheric processes has mostly been investigated for cloud droplet formation. However, even in this case, no clear evidence of a role of surface tension on cloud formation has been established, and there is a need to develop new directions of investigation to overcome the limits of the current techniques. An interesting approach could be, for instance, to develop methods to achieve the selective sampling of CCN and interstitial aerosols or of cloudwater and interstitial aerosols. Such a selection could perhaps be performed based on growth factors at the output of a HTDMA, collecting separately the particles with GF = 1 (interstitial particles) and those with GF > 1 (CCN). Provided that enough material can be accumulated, the surface tension could be measured for both populations and compared and indicate whether the CCN or cloudwater contain more surfactants than the interstitial aerosols. Even more global investigation of a role of surface tension on cloud formation or properties could consist, for instance, in evidencing correlations or causality relationships140 between long-term series of cloud properties (frequency, lifetime, droplet size distribution, etc.) at a given site and corresponding series for the surface tension of the aerosols or CCN upwind from the site.
As discussed in Section 2.2, although evidenced in other fields, the role of surface tension in the nucleation of materials other than water remains entirely to be studied for atmospheric particles. This could be investigated in the laboratory. For instance, for organic particles by comparing the nucleation rates of different organic materials with different surface tensions. For more complex mixtures, such as sulfuric acid/organic, the surface tension could be estimated from the vaporization enthalpies.141,142
The role of surface tension in the uptake and release of gases, while also evidenced in other fields of research, remains also largely to be investigated from the point of view of atmospheric particles. This could also be done in the laboratory, where the role of common organic aerosol components (for instance, organic acids) or amphiphilic surfactants in the uptake and release of gases could be studied, the same way as many other uptake processes have been studied in the atmospheric literature.
As in the case of cloud droplet formation, a main reason for not exploring the role of surface tension in these other processes was, for a long time, the lack of data on the surface tension of atmospheric particles and widespread belief that it was identical with that of pure water. However, the progress made over the last 15 years shows that this is not the case, and the new approaches for measuring the surface tension now allow us to explore its role in these other processes.
3. Surface Tension Measurement Techniques for Atmospherically Relevant Mixtures and Particles
Some of the most spectacular developments in the investigation of the surface tension of atmospheric particles and relevant mixtures over the last 10 years were those of measurement techniques. While surface tension had mostly been studied with techniques requiring large volume samples in other fields of chemistry and chemical physics, within a decade the atmospheric community has developed approaches to determine the surface tension of μL-atmospheric samples and individual pL (pico-L) particles. This section presents the techniques currently available to determine the surface tension of atmospherically relevant mixtures and particles. This includes the classical techniques requiring large volume samples (≥μL), which are still largely used for the investigation of model mixtures in the laboratory, those requiring mL- to μL-volume samples, that have been applied to atmospheric fogwater, cloudwater and aerosol sample extracts (see Section 5), and the techniques applicable to micrometer or submicrometer individual particles. The main reason for developing techniques applicable to individual micrometer-sized particles is to eventually measure the surface tension of individual atmospheric particles. In addition, as discussed in Section 1.2.8, such techniques are the only ones allowing to investigate bulk-to-surface partitioning and other effects specific to microscopic particles. It is thus important to keep in mind that the results of the “bulk techniques” presented below (and the isotherms presented in Section 4) might require some bulk-to-surface partitioning corrections to be applicable to microscopic particles.
Note that as underlined in Section 1, the techniques presented in this section measure the static surface tension, except perhaps for the optical traps and optical tweezers techniques described in Section 3.2.1. Many of the techniques described below have already been presented elsewhere,5 in particular those for individual particles,6,143−146 and we refer to these previous articles for more detail. The descriptions below are kept short to focus on the main features, advantages, or limitations regarding atmospheric samples. Each of the techniques described below is assigned an abbreviation, referring to the literature data presented in Section 4 and in Tables 1−5.
Table 1. List of the Binary Mixtures of Organic Acids in Water Included in This Inventory.
| n. | Common name (IUPAC Name) | Brut formula | CAS n. | MW (g mol–1) | *σpur (mN m–1) | **ρ (g cm–3)248 | ***Atmos. ? | Method |
|---|---|---|---|---|---|---|---|---|
| AC1 | formic acid (methanoic acid) | CH2O2 | 64-18-6 | 46.03 | 37.2,15 38.17,249 37.03,250 35.81–40.7194 | 1.220 | Y192,194,196 | DVT,249 WP250 |
| AC2 | acetic acid (ethanoic acid) | C2H4O2 | 64-19-7 | 60.05 | 29.4,10 27.08,249 27.12,250 25.61–27.894 | 1.045 | Y196 | DVT,249 WP250 |
| AC3 | propionic acid (propanoic acid) | C3H6O2 | 79-09-4 | 74.08 | 26.17,250 26.2,20,248 26.15,249 25.13–2794 | 0.988 | DVT,249 WP250 | |
| AC4 | butyric acid (butanoic acid) | C4H8O2 | 107-92-6 | 88.11 | 26.05,248 26.19,249 26.21,251 25.31–26.8394 | 0.953 | DVT,249,251 CR151 | |
| AC5 | oxalic acid (ethanedioic acid) | C2H2O4 | 144-62-7 | 90.03 | 1.900 | Y192−198 | PD,47,68,252,253 WP48,149,150,254 | |
| AC6 | methanesulfonic acid | CH4O3S | 75-75-2 | 96.11 | 53255 | 1.481 | Y196 | WP,255,256 NR148 |
| AC7 | valeric acid (pentanoic acid) | C5H10O2 | 109-52-4 | 102.13 | 26.7,15 26.63251 | 0.934 | DVT,251 NR257 | |
| AC8 | malonic acid (propanedioic acid) | C3H4O4 | 141-82-2 | 104.06 | 1.63a | Y192,196,197 | PD,47,252,253 WP,149,150 AFM183 | |
| AC9 | β-hydroxybutyric acid (3-hydroxybutanoic acid) | C4H8O3 | 300-85-6 | 104.11 | 1.13b | WP52 | ||
| AC10 | maleic acid ((2Z)-but-2-enedioic acid) | C4H4O4 | 110-16-7 | 116.07 | 1.590 | Y192,197,198 | PD,47,253 WP150,254 | |
| AC11 | caproic acid (hexanoic acid) | C6H12O2 | 142-62-1 | 116.16 | 27.51,251 27.2–28.194 | 0.921 | DVT,251 NR,257 AFM,186 NP186 CR62 | |
| AC12 | succinic acid (butanedioic acid) | C4H6O4 | 110-15-6 | 118.10 | 1.572 | Y192−199 | PD,46,47,252,253,258,259 WP,48,149,150,254 CR65 | |
| AC13 | benzoic acid (benzenecarboxylic acid) | C7H6O2 | 65-85-0 | 122.12 | 1.266 | DW260 | ||
| AC14 | cyclohexylmethanoic aci (cyclohexanecarboxylic acid) | C7H12O2 | 98-89-5 | 128.17 | 1.033 | DVT261 | ||
| AC15 | enanthic acid (heptanoic acid) | C7H14O2 | 111-14-8 | 130.19 | 27.8,15 30.07,257 28.14–28.794 | 0.912 | NR,257 WP262 | |
| AC16 | glutaric acid (pentanedioic acid) | C5H8O4 | 110-94-1 | 132.11 | 1.429 | Y193,194,196−198 | PD,47,68,252,253,259 WP,48,149,174,263 AFM,183 OT174,264 | |
| AC17 | malic acid (2-hydroxybutanedioic acid) | C4H6O5 | 6915-15-7 | 134.09 | 1.601 | Y192,194,197−199 | PD,47,253 WP150 | |
| AC18 | p-toluic acid (4-methylbenzoic acid) | C8H8O2 | 99-94-5 | 136.15 | 1.06c | DW260 | ||
| AC19 | 3-hydroxybenzoic acid | C7H6O3 | 99-06-9 | 138.12 | 71.352 | 1.485 | WP52 | |
| AC20 | cyclohexylethanoic acid | C8H14O2 | 5292-21-7 | 142.20 | 1.042 | DVT261 | ||
| AC21 | caprylic acid (octanoic acid) | C8H16O2 | 124-07-2 | 144.21 | 28.2–29.294 | 0.907 | NR257 | |
| AC22 | adipic acid (hexanedioic acid) | C6H10O4 | 124-04-9 | 146.14 | 1.360 | Y193,197,198 | PD,47,252,253 WP48,265 | |
| AC23 | 4-ethylbenzoic acid | C9H10O2 | 619-64-7 | 150.17 | 1.1p | DW260 | ||
| AC24 | cyclohexylpropanoic acid | C9H16O2 | 701-97-3 | 156.22 | 0.912 | DVT261 | ||
| AC25 | pelargonic acid (nonanoic acid) | C9H18O2 | 112-05-0 | 158.24 | 26.2–29.794 | 0.905 | NR,257 WP,266 PB267 | |
| AC26 | 4-propylbenzoic acid | C10H12O2 | 2438-05-03 | 164.20 | 1.1p | DW260 | ||
| AC27 | phtalic acid (benzene-1,2-dicarboxylic acid) | C8H6O4 | 88-99-3 | 166.13 | 1.59d | Y192,197−199 | WP48 | |
| AC28 | cyclohexylbutanoic acid | C10H18O2 | 4441-63-8 | 170.25 | 1.0p | DVT261 | ||
| AC29 | capric acid (decanoic acid) | C10H20O2 | 334-48-5 | 172.27 | 0.9p | NR,257 PB268 | ||
| AC30 | 4-butylbenzoic acid | C11H14O2 | 20651-71-2 | 178.23 | 1.1p | DW260 | ||
| AC31 | pinonic acid (3-acetyl-2,2-dimethylcyclobutylacetic acid) | C10H16O3 | 473-72-3 | 184.23 | 1.1p | Y193 | DVT,61 PD,47,253 WP,52,150 NR63 | |
| AC32 | undecylic acid (undecanoic acid) | C11H22O2 | 112-37-8 | 186.29 | 0.891 | NR257 | ||
| AC33 | azealic acid (nonanedioic acid) | C9H16O4 | 123-99-9 | 188.22 | 1.225 | Y193,197−199 | WP48,52 | |
| AC34 | citric acid (2-hydroxypropane-1,2,3-tricarboxylic acid) | C6H8O7 | 77-92-9 | 192.12 | 1.665 | PD,47,253,269 WP254,263 | ||
| AC35 | 4-pentylbenzoic acid | C12H16O2 | 26311-45-5 | 192.25 | 1.0p | DW260 | ||
| AC36 | lauric acid (dodecanoic acid) | C12H24O | 143-07-7 | 200.32 | 0.9p | WP270 | ||
| AC37 | trimesic acid (benzene-1,3,5-tricarboxylic acid) | C9H6O6 | 554-95-0 | 210.14 | 1.7p | WP48 | ||
| AC38 | oleic acid ((9Z)-octadec-9-enoic acid) | C18H34O2 | 112-80-1 | 282.47 | 32.79,271 31.8,272 30.99–32.894 | 0.894 | NR,273,274 PD,275 WP276 | |
| AC39 | ricinoleic acid ((9Z,12R)-12-hydroxyoctadec-9-enoic acid) | C18H34O3 | 141-22-0 | 298.46 | 0.945 | NR277 | ||
| AC40 | arachidonic acid ((5Z,8Z,11Z,14Z)-icosa-5,8,11,14-tetraenoic acid) | C20H32O2 | 506-32-1 | 304.5 | 0.908 | NR278 | ||
| AC41 | 7,10-dihydroxy-8(E)-octadecenoic acid | C18H34O4 | 131021-99-3 | 314.5 | 1.0p | NR277 |
Data measured at 20–25 °C.
Data measured at 15–25 °C.
Reported in atmospheric aerosols; WP = Whilhelmy plate; PD = pending droplet (shape of a droplet); DVT = drop volume tensiometry, NR = Nouy ring; CR = capillary rise; DW = drop weight; PB = pending Bubble; AFM = atomic force microscopy, NP: Du Noüy-Padday method, OT = optical tweezer.
ThermoFischer Scientific, Safety Data sheet according to Regulation UK SI 2019/758 and UK SI 2020/1577, Malonic acid, A11526, 2024 Revision 6.
Sigma-Aldrich, Safety Data Sheet according to Regulation (EC) No. 1907/2006, 3-Hydroxybutyric acid, 166898, 2023 Version 6.4.
Sigma-Aldrich, Safety Data Sheet according to Regulation (EC) No. 1907/2006, 4-Methylbenzoic acid for synthesis, 2023 Version 6.12.
Sigma-Aldrich, Safety Data Sheet, 4-Phthalic acid for synthesis, 2023 Version 9.0.
Predicted data from ChemSpider (RSC) generated using the ACD/Laboratories Percepta Platform - PhysChem Module version 14.00.
3.1. Techniques Applicable to Bulk Samples (>1 μL)
3.1.1. Force Measurement (WP, NR, DNP)
Some of the oldest and most common techniques to measure the surface tension of liquids, which are also those requiring the largest sample volume (>mL), are based on dropping a metal object, a plate (Wilhelmy Plate, WP), a ring (Du Noüy Ring, NR) (Figure 5), or a thin rod (Du Noüy-Padday, DNP) in the liquid of interest and measuring the force, F, necessary to pull it up, usually with an electrobalance:
| 7 |
where A is the surface area of the object in contact with the liquid. Thus, these techniques depend on the surface area of the object in contact with liquid A, and might require some correction factors to account for limited wettability. The uncertainties on the measurements with these techniques have been reported to be of the order of 0.1 mN m–1.147 However, the required sample volumes are at least in the mL range. These techniques have been used to measure the surface tension of a large number of binary aqueous mixtures of reference compounds of atmospheric relevance (organic acids, etc.) in the laboratory (see Section 4 and refs (48, 148−150)).
Figure 5.

Schematics of various experimental techniques used to determine the surface tension. Adapted with permission from ref (169). Crown copyright 2015 Elsevier Ltd.
3.1.2. Gravitational Equilibrium (CR, PD, PB, DVT, DW, DN, BP)
A vast class of techniques for the measurement of the surface tension of liquids is based on equilibrating the surface tension forces, F, applied to a sample with gravity, i.e., with the sample weight. They include the Capillary Rise (CR), Pendant Droplet (PD, also referred to as “Pending droplet” or “Hanging droplet”), Pendant Bubble (PB), Drop Volume Tensiometry (DVT), Drop Weight (DW), Drop Number (DN), and Bubble Pressure (BP) techniques. In these techniques, the surface tension is determined from the Young–Laplace equation, expressing the capillary pressure, ΔP, across an interface of area A, thus corresponding to a force, F, resulting from the surface tension, σ:
| 8 |
where R1 and R2 are the two main radii of curvature, in the case of a nonspherical surface. Equilibrating the force F with the sample weight thus gives
| 9 |
where m is the mass of the sample and g the gravitational constant.
There are many variations on this approach. The one requiring the most volume samples (≥mL) is the Capillary Rise technique (CR, Figure 5), which consists in dipping a capillary tube into the liquid of interest and measuring the height of the liquid, h, in the capillary tube. In this approach, the adhesion forces result in the formation of a meniscus at the interface, so that both R1 and R2 can be replaced by R in eq 9 and A/R = π r cos θ, where r is the radius of the liquid column and θ is the contact angle between the liquid and the capillary (often neglected). Expressing m as a function of the liquid density, ρ, and volume of the liquid column (h × π r2) in eq 9 thus allows σ to be determined. This technique has the advantage to convert small forces into a significant height, h, thus lowering the uncertainties compared with direct force measurements such as WP and NR. CR has thus mostly been used for the investigation of artificial mixtures of atmospheric relevance, such as in ref (151).
Other variants of this approach consist in forming a small droplet of the liquid of interest at the tip of a needle or a capillary tube and equilibrating it against its own weight. A very common method is the Pendant Droplet (PD, Figure 5), in which the shape of the droplet is measured with a camera to determine the radii R1 and R2. Comparing the droplet shape with its weight using the Young–Laplace equation (eq 9) provides the value of σ.152 The Drop Volume Tensiometry (DVT), Drop Weight (DW), and Drop Number (DN)153 approaches are based on the same principle than PD, the droplet being formed at the extremity of a capillary and equilibrated with the surface tension force by eq 9 at the time of its detachment. However, instead of measuring the shape of the droplet, the DW and DN techniques consist of measuring the combined weight or volume resulting from several droplets, thus avoiding the need of a camera. The DVT technique is similar to PD, as the volume of the droplet is measured with a camera just before its detachment, but is usually employed for droplets formed inside another liquid. Other approaches that are also based on eq 9 consist of forming a small gas bubble inside of the liquid of interest and measuring either its shape with a camera (Pendant Bubble, PB) or determining its pressure from its curvature (Bubble Pressure, BP, Figure 5).
Several of these gravitational techniques, in particular PD, DW, and DVT, require relatively small volume samples (<100 mL) and, thus, are applicable to atmospheric samples. The techniques based on the formation of bubbles in a liquid, such as DW and PB, require at least several tens of milliliters of samples and thus can be applied to fog or cloudwater samples. DW has thus been used to measure the surface tension of atmospheric fogwater154 and PB for fog and cloudwater.155,156 The PD is the technique requiring the least sample volume (<μL) and also limits the contacts between the sample and laboratory vessels (thus potential contamination) and thus are most applicable to atmospheric aerosol samples, as illustrated by several studies.157−168
3.2. Techniques Applicable to Individual Particles (<μL)
3.2.1. Airborne Particles: Electrodynamic Balance, Optical Tweezers, and Optical Traps (OTs)
Techniques to isolate individual particles with a diameter between 10 and 200 μm in air or microfluidic systems and determine their surface tension have been developed as early as the 1990s.170−172 Airborne particles can be isolated in a small domain by combing oscillating and static electric fields in electrodynamic balance,168 or by levitating them on a focused laser beam or stabilizing them between two crossing beams in optical traps and optical tweezers (Figure 6).24,173−181 In these techniques, the surface tension of the particles is usually determined by inducing first a deformation of the particle, then by monitoring the resulting oscillations from the backscattered light or Quasi-Elastic-Laser Scattering (QELS),168,181,182 from which the surface tension is obtained. Initial deformation and surface oscillations have thus been generated by applying a pulsed electric field,172 coalescing two particles inside the optical trap,174,175,178,180,181 or by applying thermal fluctuations.182 These techniques have the advantage of avoiding contacts between the particles and any surface in the instruments and of being noninvasive, thus avoiding contaminations. The individual particles can be stabilized long enough to vary the RH and study complete adsorption isotherms. The uncertainties reported on the surface tension measurements with these techniques are reported to be of the order of ±1 mN m–1,174 thus substantially larger than with the large-volume techniques for bulk samples because of the inherent difficulties in studying micrometer-size particles. Potential drawbacks of these techniques are that, because of the induced oscillations, they might be measuring a dynamic σ rather than a static one and the analysis performed to determine the surface tension must involve some assumptions on the dynamic behavior of the particle material (density, viscosity, compressibility, etc.). However, by measuring the surface tension of particles in the 5–10 μm size range, these techniques are among the only ones allowing investigating some fundamental aspects, such as the importance of bulk-to-surface partitioning on the surface tension. These techniques also allow one to study other properties of the particles.177 For instance, they could be used to study the role of σ in condensation/evaporation, in nucleation processes, or in the exchange of compounds between the particles and air discussed in Section 2. They are also the most promising techniques to determine another essential parameter related to surface tension: the concentration of the surfactant in individual particles (see Section 6). This information is key in many investigations of the surface tension of particles but particularly challenging to measure. This could potentially be done by adding specific dyes to the particles, that would complex with the surfactant molecules, and measuring their signatures with optical spectroscopies.
Figure 6.

Illustration of an optical tweezer/optical trap: A) Two optical traps are generated using a kinoform on a spatial light modulator (SLM). Once the droplets are confined to the traps, they are moved together to coalesce; B) Elastically scattered light of the event collected with a photodiode and a fast-Fourier transform (FFT) providing the oscillation frequency of the surface modes from which the surface tension is determined; C) Cavity-enhanced Raman spectrum collected with the spectrograph yielding, after analysis of the spectrum with Mie Theory, the radius and refractive index of the droplet resulting from coalescence. The concentration of the cosolute is determined from the refractive index. Reproduced with permission from ref (180). Copyright 2023 American Chemical Society. Licensed under CC-BY 4.0.
3.2.2. Deposited Particles: Nanotensiometry, Atomic Force Microscopy (AFM)
Another family of techniques allowing the measurements of the surface tension of individual particles are those based on nanotensiometry, i.e., the same principle as the Wilhelmy plate (WP) and Du Noüy ring (NR) techniques, but at microscopic scale: to drop the tip (diameter < a few μm) of an Atomic Force Microscopy (AFM, Figure 7)) instrument or a nanoneedle (typically several 100 of nm in diameter),183 in the sample of interest and measure the force necessary to retrieve it. Atomic Force Microscopy, which is used routinely to study submicrometer details on surfaces, has also been used to measure the surface tension of small surfaces.144 Over the last 10 years it has been used to measure the surface tension of submicrometer atmospherically relevant particles,183−188 as summarized in ref (6). The uncertainties on the surface tension values obtained with such techniques are reported to be on the order of ±0.5 mN m–1. These techniques are the only ones able to investigate particles well below the micrometer-size. It has also the advantages of being a direct determination of σ, i.e., with few intermediate steps and corrections, and to measure a static σ rather than a dynamic one. Its main drawback, however, is that the droplets are not airborne but necessarily deposited on a surface (substrate), thus increasing the risks of contamination of the sample. Potential further development and applications of these different techniques are discussed in Section 6.
Figure 7.

Illustration of surface tension measurements by AFM. A) Top: zoom on the nanoneedle used to probe the surface; bottom: example of force curves obtained from the measurements, from which the surface tension is determined. Reproduced with permission from ref (186). Copyright 2021 American Chemical Society. B) Illustration of the interactions between the AFM tip and microdroplets deposited on a surface. Reproduced with permission from ref (189). Copyright 2023 American Chemical Society. Licensed under CC-BY 4.0.
4. Adsorption Isotherms for Organic/Water Mixtures of Atmospheric Relevance
4.1. Scope of the Inventory
The increase of interest for the surface tension of atmospheric particles over the last 15 years has led to the development of a number of models trying to predict it.7−14 However, the experimental data on the surface tension of atmospherically relevant organic compounds in water, which are needed to validate such models or develop relationships between molecular structure and surface tension, are widely dispersed in the literature. To facilitate these works, this section presents a unique inventory of experimental adsorption isotherms reported in the literature for more than 130 aqueous mixtures of organic compounds. Complete lists of the organic compounds included in this inventory are given in Tables 1, 2, 3, 4, and 5: organic acids (Table 1), alcohols, aldehydes, and ketones (Table 2), amines, amino acids, and sugars, (Table 3), amphiphilic compounds in Table 4, and macromolecular compounds (Table 5). Most of these data was measured at 20–25 °C, unless indicated otherwise. The uncertainties reported on these measurements are generally less than ±1% or ±0.2 mN m–1. The complete isotherm data are provided in Sections S2 and S3 of the Supporting Information, reporting all the data sets found in the literature for each compound, those originally published being shown in bold. All the isotherms are presented as a function of both concentration, C (M), and molar fraction, x, of the compound, and the conversion made between these units are presented in Section S1. Whenever available in the literature, other units, such as mass fraction, are also provided in the SI.
Table 2. List of the Binary Mixtures of Aldehydes, Ketones, and Alcohols in Water Included in This Inventory.
| n. | common name (IUPAC Name) | Brut formula | CAS n. | MW (g mol–1) | *σpur (mN m–1) | **ρ (g cm–3)248 | ***Atmos. ? | Method |
|---|---|---|---|---|---|---|---|---|
| AK1 | formaldehyde (methanal) | CH2O | 50-00-0 | 30.03 | 1.09sa | PD279 | ||
| AK2 | methanol | CH3OH | 67-56-1 | 32.04 | 22.51,280 24,281 22.14,282 25,283 22.7,284 21.8–22.9594 | 0.791 | WP,280,281 DVT,282 BP,283 NR284 | |
| AK3 | acetaldehyde (ethanal) | C2H4O | 75-07-0 | 44.05 | 20.6–21.294 | 0.783 | PD279 | |
| AK4 | ethanol | C2H5OH | 64-17-5 | 46.07 | 22.0,285 21.82,280 22,281 21.72,282 22.07–22.85,286 22.6,284 21.3–23.3294 | 0.789 | CR,285 WP,280,281 DVT,282 DN,286 NR284 | |
| AK5 | acetone (propan-2-one) | C3H6O | 67-64-1 | 58.08 | 23.1,287 23.02,288 24.5,283 21.62–24.0294 | 0.785 | CR,289 BP,283,287 PD,288 NR290 | |
| AK6 | propan-1-ol | C3H7OH | 71-23-8 | 60.1 | 23.28,280 26,291 23.1,292 23.32,282 23.5,284 23.1–23.994 | 0.800 | WP,280 BP,291 CR,151,292 DVT,282 NR,284 CR62 | |
| AK7 | propan-2-ol | C3H7OH | 67-63-0 | 60.1 | 21.22,280 23.5,283 20.34–21.7494 | 0.781 | WP,280 BP283 | |
| AK8 | ethylene glycol (ethane-1,2-diol) | C2H6O2 | 107-21-1 | 62.06 | 46.24,293 47,291 47.6–48.4994 | 1.114 | CR,293 BP291 | |
| AK9 | propylene glycol (propane-1,2-diol) | C3H8O2 | 57-55-6 | 76.09 | 35.46,293 36.6,294 35.6,292 35.8–36.694 | 1.036 | CR,292,293 BP294 | |
| AK10 | propane-1,3-diol | C3H8O2 | 504-63-2 | 76.09 | 45.58,292 46.95,293 45.62–49.294 | 1.054 | CR292 | |
| AK11 | pentan-1-ol | C5H11OH | 71-41-0 | 88.15 | 24.8–25.694 | 0.814 | DVT295 | |
| AK12 | 1,3-butanediol | C4H10O2 | 107-88-0 | 90.12 | 37.04293 | 1.005 | CR293 | |
| AK13 | 1,4-butanediol | C4H10O2 | 110-63-4 | 90.12 | 43.79,293 44.6–47.494 | 1.017 | CR293 | |
| AK14 | glycerol (propane-1,2,3-triol) | C3H8O3 | 56-81-5 | 92.09 | 63.4,296 62.5,285 63.0,292 59.5,189 62.9,189 59.4–63.794 | 1.261 | CR,285,292 WP,189,296 AFM189 | |
| AK15 | phenol (benzenol) | C6H6O | 108-95-2 | 94.11 | 39.59–42.294 | 1.07a | DW260 | |
| AK16 | hexan-1-ol | C6H13OH | 111-27-3 | 102.18 | 24.08–26.5594 | 0.814 | DVT,295 WP297 | |
| AK17 | hexan-2-ol | C6H13OH | 626-93-7 | 102.18 | 24.25–24.794 | 0.818b | WP297 | |
| AK18 | 2,3-dimethylbutan-2-ol | C6H13OH | 594-60-5 | 102.18 | 23.74–23.7494 | 0.824 | WP297 | |
| AK19 | 2-methylpentan-2-ol | C6H13OH | 590-36-3 | 102.18 | 22.58–22.994 | 0.835 | WP297 | |
| AK20 | 1,5-pentanediol | C5H12O2 | 111-29-5 | 104.15 | 44.16,298 43.394 | 0.991 | WP298 | |
| AK21 | p-cresol (4-methylbenzenol) | C7H8O | 106-44-5 | 108.13 | 1.034c | DW260 | ||
| AK22 | heptan-1-ol | C7H15OH | 111-70-6 | 116.2 | 25.7–27.2594 | 0.822 | WP,262 DVT295 | |
| AK23 | hexane-1,2-diol | C6H14O2 | 6920-22-5 | 118.17 | 23.8299 | 0.951d | CR299 | |
| AK24 | hexane-1,6-diol | C6H14O2 | 629-11-8 | 118.17 | 0.96e | CR299 | ||
| AK25 | hexane-1,5-diol | C6H14O2 | 928-40-5 | 118.17 | 33.9299 | 0.971 | CR299 | |
| AK26 | hexane-2,5-diol | C6H14O2 | 2935-44-6 | 118.17 | 31.6299 | 0.961 | CR299 | |
| AK27 | 4-ethylphenol | C8H10O | 123-07-9 | 122.16 | 1.01f | DW260 | ||
| AK28 | octan-1-ol | C8H17OH | 111-87-5 | 130.2 | 25.56–27.994 | 0.826 | NR,300 DVT,295 WP297 | |
| AK29 | octan-2-ol | C8H17OH | 123-96-6 | 130.2 | 25.5–26.794 | 0.819g | WP297 | |
| AK30 | 4-propylphenol | C9H12O | 645-56-7 | 136.19 | 1.009 | DW260 | ||
| AK31 | 1-naphthol (naphthalen-1-ol) | C10H8O | 90-15-3 | 144.17 | 1.28h | NR301 | ||
| AK32 | 2-naphthol (naphthalen-2-ol) | C10H8O | 135-19-3 | 144.17 | 1.28 | NR301 | ||
| AK33 | nonan-1-ol | C9H19OH | 143-08-8 | 144.25 | 27–28.394 | 0.828 | WP297 | |
| AK34 | nonan-5-ol | C9H19OH | 623-93-8 | 144.25 | 0.822 | WP297 | ||
| AK35 | 4-tert-butylphenol | C10H14O | 98-54-4 | 150.22 | 0.908i | DW260 | ||
| AK36 | 4-s-butylphenol | C10H14O | 99-71-8 | 150.22 | 0.986 | DW260 | ||
| AK37 | 2,3-dihydroxynaphthalene | C10H8O2 | 92-44-4 | 160.17 | 1.3p | NR301 |
Data measured at 20–25 °C.
Data measured at 15–25 °C.
Reported in atmospheric aerosols; WP = Whilhelmy plate; PD = pending droplet (shape of a droplet); DVT = drop volume tensiometry, NR = Nouy ring; DN = drop number; DW = drop weight; BP = bubble pressure; CR = capillary rise; sa37 wt.% in H2O, Sigma-Aldrich (pure: 0.815 at 253.15 K248).
Roth, Safety Data Sheet acc. to Regulation (EC) No. 1907/2006 (REACH), Phenol ≥99%, Ph.Eur., crystalline, 3215, 2020, Version 5.0.
Sigma-Aldrich, Safety Data Sheet according to Regulation (EC) No. 1907/2006, 2-Hexanol, 128570, 2023, Version 6.3.
Sigma-Aldrich, Safety Data Sheet according to Regulation (EC) No. 1907/2006, p-Cresol, C85751, 2023, Version 7.2.
Sigma-Aldrich, Safety Data Sheet according to Regulation (EC) No. 1907/2006, 1,2-Hexanediol, 213691, 2022, Version 6.7.
Sigma-Aldrich, Safety Data Sheet according to Regulation (EC) No. 1907/2006, 1,6-Hexanediol for synthesis, 804308, 2023, Version 6.8.
Sigma-Aldrich, Safety Data Sheet according to Regulation (EC) No. 1907/2006, 4-Ethylphenol, E44205, 2023, Version 8.6.
Sigma-Aldrich, Safety Data Sheet according to Regulation (EC) No. 1907/2006, 2-Octanol, O4504, 2023, Version 6.6.
Sigma-Aldrich, Safety Data Sheet according to Regulation (EC) No. 1907/2006, 1-Naphthol for synthesis, 822289, 2023, Version 6.15.
Sigma-Aldrich, Safety Data Sheet according to Regulation (EC) No. 1907/2006, 4-tert-Butylphenol, B99901, 2024, Version 6.11.
Predicted data from ChemSpider (RSC) generated using the ACD/Laboratories Percepta Platform - PhysChem Module version 14.00.
Table 3. List of the Binary Mixtures of Sugars and Amines in Water Included in This Inventory.
| n. | Common name (IUPAC name) | Brut formula | CAS n. | MW (g mol–1) | *σpure (mN m–1) | **ρ (g cm–3)248 | ***Atmos. ? | Method |
|---|---|---|---|---|---|---|---|---|
| SA1 | colamine (2-aminoethan-1-ol) | C2H7NO | 141-43-5 | 61.08 | 48.95,302 48.10,303 48.30,304 48.3–49.2494 | 1.018 | Y196 | WP,302 PD303 |
| SA2 | pyrrolidine (prolamine) | C4H9N | 123-75-1 | 71.12 | 29.75,305 29.65,304 29.23–29.6594 | 0.859 | WP305 | |
| SA3 | glycine (aminoacetic acid) | C2H5NO2 | 56-40-6 | 75.07 | 1.161 | Y196 | PD,306 DVT307 | |
| SA4 | threamine (1-aminopropan-2-ol) | C3H9NO | 78-96-6 | 75.11 | 37.38 | 0.973a | PD308 | |
| SA5 | 3-aminopropan-1-ol | C3H9NO | 156-87-6 | 75.11 | 43.90,308 44.7304 | 0.982 | PD308 | |
| SA6 | 2-(methylamino)ethan-1-ol | C3H9NO | 109-83-1 | 75.11 | 35.28309 | 0.937 | WP309,310 | |
| SA7 | piperidine (pyridine) | C5H11N | 110-89-4 | 85.15 | 29.56,305 29.48304 | 0.861 | WP305 | |
| SA8 | N,N′-dimethylethane-1,2-diamine | C4H12N2 | 110-70-3 | 88.15 | 26.4311 | 0.828 | WP311 | |
| SA9 | dl-alanine (2-aminopropanoic acid) | C3H7NO2 | 302-72-7 (dl-alanine) 56-41-7 (l-alanine) | 89.09 | 1.432, 1.424 | Y196 | PD,306 DVT307 | |
| SA10 | β-alanine (3-aminopropanoic acid) | C3H7NO2 | 107-95-9 | 89.09 | 1.437 | Y196 | DVT312 | |
| SA11 | 2-(ethylamino)ethan-1-ol | C4H11NO | 110-73-6 | 89.14 | 32.21309 | 0.914 | WP309 | |
| SA12 | 2-amino-2-methylpropan-1-ol | C4H11NO | 124-68-5 | 89.14 | 31.37302 | 0.934 | WP302 | |
| SA13 | 2-(dimethylamino)ethan-1-ol | C4H11NO | 108-01-0 | 89.14 | 31.5313 | 0.887 | CR313 | |
| SA14 | cyclohexanamine | C6H13N | 108-91-8 | 99.17 | 32.4,314 31.81,304 31.51–31.5494 | 0.819 | NR314 | |
| SA15 | piperidic acid (4-aminobutanoic acid) | C4H9NO2 | 56-12-2 | 103.12 | 1.1p | DVT312 | ||
| SA16 | dl-2-aminobutanoic acid | C4H9NO2 | 2835-81-6 | 103.12 | 1.230 | DVT307 | ||
| SA17 | 1-dimethylaminopropan-2-ol | C5H13NO | 108-16-7 | 103.16 | 24.0315 | 0.837 | WP315 | |
| SA18 | diolamine (2,2′-azanediyldi(ethan-1-ol)) | C4H11NO2 | 111-42-2 | 105.14 | 47.21316 | 1.097 | WP,316,317 PD318 | |
| SA19 | 5-aminopentanoic acid | C5H11NO2 | 660-88-8 | 117.15 | 1.1p | DVT312 | ||
| SA20 | dl-norvaline (2-aminopentanoic acid) | C5H11NO2 | 760-78-1 | 117.15 | 1.1p | DVT307 | ||
| SA21 | methyl diethanolamine (2,2′-(methylazanediyl)di(ethan-1-ol)) | C5H13NO2 | 105-59-9 | 119.16 | 38.90,319 38.3,313 37.29,320 39.894 | 1.043 | WP,317,319 CR,313 PD318,320 | |
| SA22 | 2-amino-2-ethyl-1,3-propanediol | C5H13NO2 | 115-70-8 | 119.16 | 1.099 | CR321 | ||
| SA23 | 2-amino-2-hydroxymethyl-propane-1,3-diol | C4H11NO3 | 77-86-1 | 121.14 | 1.32b | PD322 | ||
| SA24 | erythritol (2R,3S)-butane-1,2,3,4-tetrol | C4H10O4 | 149-32-6 | 122.12 | 1.451 | Y192 | DVT323 | |
| SA25 | 6-aminohexanoic acid | C6H13NO2 | 60-32-2 | 131.17 | 1.0p | DVT312 | ||
| SA26 | dl-norleucine (2-aminohexanoic acid) | C6H13NO2 | 616-06-8 | 131.17 | 1.172 | DVT307 | ||
| SA27 | l-leucine ((S)-2-amino-4-methylpentanoic acid) | C6H13NO2 | 61-90-5 | 131.17 | 1.293 | Y196 | WP,324 DVT325 | |
| SA28 | hexamethylenetetramine (1,3,5,7-tetraazaadamantane) | C6H12N4 | 100-97-0 | 140.18 | 1.331c | WP326 | ||
| SA29 | trolamine (2,2′,2″-nitrilotri(ethan-1-ol)) | C6H15NO3 | 102-71-6 | 149.19 | 45.95,316 45.95–4894 | 1.124 | WP316 | |
| SA30 | xylitol (meso-xylitol) | C5H12O5 | 87-99-0 | 152.15 | 1.52d | DVT323 | ||
| SA31 | levoglucosan ((1R,2S,3S,4R,5R)-6,8- dioxabicyclo[3.2.1]octane-2,3,4-triol) | C6H10O5 | 498-07-7 | 162.14 | 1.646 | Y192,193,199 | WP,48,52 PD46,47 | |
| SA32 | l-phenylalanine | C9H11NO2 | 63-91-2 | 165.19 | 1.2p | Y196 | PD306 | |
| SA33 | d-(+)-glucose ((2R,3S,4R,5R)-2,3,4,5,6-pentahydroxyhexanal) | C6H12O6 | 50-99-7 | 180.16 | 1.5443 | WP,48,327 DVT323 | ||
| SA34 | d-(+)-galactose ((2R,3S,4S,5R)-2,3,4,5,6-pentahydroxyhexanal) | C6H12O6 | 59-23-4 | 180.16 | 1.5e | WP48 | ||
| SA35 | inositol (1,2,3,4,5,6-hexahydroxycyclohexane) | C6H12O6 | 87-89-8 | 180.16 | 1.752f | DVT323 | ||
| SA36 | sorbitol ((2S,3R,4R,5R)-hexane-1,2,3,4,5,6-hexol) | C6H14O6 | 50-70-4 | 182.17 | 1.489 | Y192 | DVT323 | |
| SA37 | d-(+)-maltose ((3R,4R,5S,6R)-6-(hydroxymethyl)-5-[[(2R,3R,4S,5S,6R)-3,4,5-trihydroxy-6-(hydroxymethyl)oxan-2-yl]oxy]oxane-2,3,4-triol) | C12H22O11 | 69-79-4 | 342.3 | 1.8p | WP48 | ||
| SA38 | sucrose (β-d-fructofuranosyl α-d-glucopyranoside) | C12H22O11 | 57-50-1 | 342.3 | 1.581 | Y192 | WP48 |
Data measured at 20–25 °C.
Data measured at 15–25 °C.
Reported in atmospheric aerosols; WP = Whilhelmy plate; PD = pending droplet (shape of a droplet); DVT = drop volume tensiometry, NR = Nouy ring; CR = capillary rise.
Sigma-Aldrich, Safety Data Sheet according to Regulation (EC) No. 1907/2006, 1-Amino-2-propanol, 110248, 2023, Version 7.4.
Supelco, Safety Data Sheet according to Regulation (EC) No. 1907/2006, Tris(hydroxymethyl)aminomethane 77-86-1, 102408, 2023, Version 6.6.
Sigma-Aldrich, Safety Data Sheet according to Regulation (EC) No. 1907/2006, Hexamethylenetetramine, 398160, 2023, Version 6.1.
Sigma-Aldrich, Safety Data Sheet according to Regulation (EC) No. 1907/2006, Xylitol, X3375, 2023, Version 6.5.
Roth, Safety Data Sheet acc. to Regulation (EC) No. 1907/2006 (REACH), d(+)-Galactose ≥98%, 4987, 2020, Version GHS 3.0.
Sigma-Aldrich, Safety Data Sheet according to Regulation (EC) No. 1907/2006, myo-Inositol, I5125, 2023, Version 6.7.
Predicted data from ChemSpider (RSC) generated using the ACD/Laboratories Percepta Platform - PhysChem Module version 14.00.
Table 4. List of the Binary Mixtures of Synthetic and Biological Surfactants in Water Included in This Inventory.
| n. | Type | Common name (IUPAC Name) | Brut formula | CAS n. | MW (g mol–1) | *σmin (mN m–1) | **ρ (g/cm3) | ***Atmos. ? | Method |
|---|---|---|---|---|---|---|---|---|---|
| SB1 | anionic surfactant | SDS (sodium dodecyl sulfate) | NaC12H25SO4 | 151-21-3 | 288.38 | 39.1,328 38.3,329 39.6,330 37.6,331 34.0668 | 0.998330a | NR,329 WP,328,331 DN,330 PD68 | |
| SB2 | cationic surfactant | DTAB (dodecyltrimethylammonium bromide) | C15H34BrN | 1119-94-4 | 308.34 | 38.7,332 40.0,333 37.0,334 37.7331 | 0.998335b | WP,331,332 DN,334 PD333 | |
| SB3 | cationic surfactant | CTAB (cetyltrimethylammonium bromide) | C19H42BrN | 57-09-0 | 364.45 | 36.5,336 36.3,337 37.5,329 41.6,331 36.6,60 | 0.9964338c | DW,336 PB,337 NR,60,329 WP331 | |
| SB4 | anionic surfactant | AOT (sodium bis(2-ethylhexyl)sulfosuccinate) | C20H36Na2O7S | 577-11-7 | 444.56 | 29.5,339 27.3,340 32.5,341 29.2,342 26.1343 | 1.140344 | DVT,339 WP,340,343 NR,341,342 | |
| SB5 | nonionic surfactant | Triton X114 ((1,1,3,3-tetramethylbutyl)phenyl-polyethylene glycol) | (C2H4O)nC14H22O, n = 7 or 8 | 9036-19-5 | ∼537 | 29.1,345 31.1,346 28.4,347 30.8,329 29.0348 | 1.058d | WP,345 NR,329,346,347 PD348 | |
| SB6 | nonionic surfactant | Brij35 (polyoxyethylene lauryl ether) | (C2H4O)nC12H26O, n = 23 | 9002-92-0 | 1198.57 | 44.0,349 43.6,350 43.5,342 42.7351 44.9168 | 1.05e | NR,342,349 WP,350,351 PD68 | |
| SB7 | biological surfactant | monorhamnolipid | C26H48O9 | 37134-61-5 | 504.3 | 25.3,352 30,69 27.9353 | 1.0669 0.998211353 | NR69,352,353 | |
| SB8 | Biological surfactant | dirhamnolipid | C32H58O13 | 4348-76-9 | 650.4 | 28.8,352 32.0,69 27.9353 | 1.0669 0.998211353 | NR69,352,353 | |
| SB9 | biological surfactant | surfactin from Bacillus subtilis | C53H93N7O13 | 24730-31-2 | 1036.3 | 31.9,354 31.1,355 29.0,161 26.6356 | 1p | NR,354 DVT,355 PD161 WP356 | |
| SB10 | biological surfactant | syringafactin B/C from Xanthomonas and Pseudomonas | C55H101O13N9 | 1094.75 | 25.0245 | PD245 | |||
| SB11 | biological surfactant | viscosin from Pseudomonas | C54H95N9O16 | 27127-62-4 | 1125.69 | 30.6,357 27.6,358 ∼25245 | 1.2p | NR,357,358 PD245 |
Data measured at 20–25 °C.
Data measured at 15–25 °C.
Reported in atmospheric aerosols; WP = Whilhelmy plate; PD = pending droplet (shape of a droplet); DW = drop weight; DVT = drop volume tensiometry, NR = Nouy ring; DN = drop number; PB = Pending bubble.
Density of an aqueous solution of SDS at 0.014 M [25 °C].330
Density of an aqueous solution of DTAB at 0.005 M [25 °C].335
Density of an aqueous solution of CTAB at 0.001 M [25 °C].338
Sigma-Aldrich, Safety Data Sheet according to Regulation (EC) No. 1907/2006, Triton X-114, X114, 2023, Version 6.11.
Sigma-Aldrich, Safety Data Sheet according to Regulation (EC) No. 1907/2006, Brij 35 for synthesis, 801962, 2023, Version 6.10.
Predicted data from ChemSpider (RSC) generated using the ACD/Laboratories Percepta Platform - PhysChem Module version 14.00.
The corresponding adsorption isotherm curves are presented in Figures 8−17, where symbols represent experimental data points reported in the literature (when only one data set was available for the mixture). When several data sets were available, curves interpolating at best the data sets were calculated (see next paragraph), which are represented by smooth lines in the Figures.
Figure 8.

Adsorption isotherms for binary mixtures in water of linear organic monoacids. The curves represented by solid lines are recommended values based on multiple data sets (see SI and text), while those with symbols represent single experimental data sets.
Figure 17.

Adsorption isotherms for binary mixtures in water of macromolecules. The curves represented by solid lines are recommended values based on multiple data sets (see SI and text), while those with symbols represent single experimental data sets.
Figure 9.

Adsorption isotherms for binary mixtures in water of organic diacids, triacids, unsaturated acids, and other substituted acids. The curves represented by solid lines are recommended values based on multiple data sets (see SI and text), while those with symbols represent single experimental data sets.
Figure 12.

Adsorption isotherms for binary mixtures in water of di- and trialcohols. Curves represented by solid lines are recommended values for multiple data sets (see SI and text), while those with symbols represent single experimental data sets.
4.1.1. Modeling and Recommended Curves for the Surface Tension Isotherms
For the mixtures for which more than one data set is reported in the literature, curves interpolating at best the different data sets were calculated and are recommended in the SI. These interpolated curves were obtained by performing, for each substance, nonlinear least-squares fits of the data set to a Sigmoid curve, according to the model developed by Kleinheins et al.14 (see also Section S2.1):
| 10 |
with σw the surface tension of pure water, σpure the surface tension of the pure substance, p and d optimized parameters (position of the inflection and distance of the estimated CMC, critical micellar concentration, from the inflection point, respectively), and xmlc the molar fraction. For substances where σpure is not known, this value was determined by fitting together with parameters p and d.
Nonlinear least-squares fits (RMSE, root mean squared error), 95% confidence intervals on the fit parameters, and the 95% confidence band were obtained using the module “kmpfit” of the Python package “Kapteyn”.190 The curves thus obtained are recommended only over the concentration range covered by the corresponding experimental data sets.
4.2. Compounds Included in the Inventory
Thousands of organic compounds are thought to be present in atmospheric aerosols, although different analytical techniques are only able to identify specific subclasses of compounds.191 Merging different studies reporting the analysis of PM2.5 and PM10 aerosols from remote regions of the Amazonia,192 rural regions of Europe193,194 and the USA,195 and urban areas of China,196,197 India,198 and the USA195,199 resulted in a list of ∼50 most abundant organic compounds in atmospheric aerosols, for which adsorption isotherms were searched in priority in the literature. Adsorption isotherms were found for about 25 of these compounds, marked with a “Y” in the “Atmos. ?” columns of Tables 1−5. However, for some relatively common compounds, such as glyoxal, glyoxylic acid, glyceric acid, pyruvic acid, pinic acid, and β-caryophillinic acid, no adsorption isotherms could be found, and the latter need potentially to be determined in future studies. In addition, more complex compounds, such as oxidation products of isoprene and terpenes, while shown to display some surface tension effects,200 are not included in this inventory because their structures are not completely elucidated. Furthermore, it can be seen in Table 2 that relatively little information is found in the literature on the adsorption isotherms for aldehydes and ketones in water, which could also be the subject of future studies. The inventory also includes some macromolecular compounds (C atoms > 20, Table 5), for which the molecular structure is not fully elucidated but which have been reported in atmospheric aerosols, such as Humic Like Substances (HULISs) and their commercial references, SRFA and NAFA fulvic acids and commercial humic substances, as well as Extracellular Polymeric Substances (EPSs) found in marine aerosols.
In addition to the organic compounds of direct relevance for atmospheric aerosols, over a hundred other organic acids, alcohols, amines, and sugars, for which the adsorption isotherm in water was reported in the literature, are also included in the inventory. The motivation for including all of these compounds is that they provide a wide range of molecular structures and carbon chain length, which is useful to link molecular structure and surface activity in models (see discussion below). Finally, the isotherms for a few amphiphilic compounds are also included in this inventory (Table 4) as they are an important class of compounds to take into account when investigating surface tension.
However, nonamphiphilic compounds with low solubility in water, such as alkanes, alkenes, and reduced aromatic and polyaromatic compounds, were not included in the inventory, even though they can be present in atmospheric particles, because they are not expected to act significantly as surfactants, especially at their aerosol concentrations.
4.3. Trends Observed in the Inventory: “Weak” vs “Strong” Surfactants
The adsorption isotherms presented in Figures 8−17 provide some general trends on the efficiency of different types of organic compounds in reducing the surface tension of aqueous mixtures.
4.3.1. Lowering or Increasing the Surface Tension
Nearly all the organic compounds presented in Figures 8−17 tend to lower the surface tension of aqueous mixtures, albeit at large concentration, which was expected as most of them are semisoluble in water (cf. Section 1.2.1). Only the most soluble compounds, sugars (Figure 15), tend to increase the surface tension by forming hydrogen bonds with the water molecules (Section 1.2.1). Note, however, that this hydrogen-bonding effect is rather modest, with an increase of surface tension of δσ ≤ 5 mN m–1 relative to pure water, even at very large concentrations (C ≥ 0.5 M).
Figure 15.

Adsorption isotherms for binary mixtures in water of sugars. The curves represented by solid lines are recommended values based on multiple data sets (see SI and text), while those with symbols represent single experimental data sets.
4.3.2. Role of the Carbon Chain Length
The isotherms in Figures 8−15 clearly show that, within each class of compound, the efficiency of semisoluble organic molecules in lowering the surface tension of aqueous mixtures increases with the organic chain length. This was expected as the increase of surfactant efficiency with the organic (hydrophobic) chain length has been established for a long time.29,30,201 This is especially clear for the organic acids in Figure 8−10, for which the isotherms shift progressively toward lower concentrations as the chain length increases, and the alcohols in Figure 11 and, to a lesser extent, the amines and amino acids in Figures 13 and 14. Thus, in order to discuss the relative surfactant efficiency of different classes of compounds, it is necessary to compare compounds with identical organic chain length.
Figure 10.

Adsorption isotherms for aromatic and cyclic acids. The curves represented by solid lines are recommended values based on multiple data sets (see SI and text), while those with symbols represent single experimental data sets.
Figure 11.

Adsorption isotherms for binary mixtures in water of aldehydes, ketones, and monoalcohols. The curves represented by solid lines are recommended values based on multiple data sets (see SI and text), while those with symbols represent single experimental data sets.
Figure 13.

Adsorption isotherms for binary mixtures in water of amines. The curves represented by solid lines are recommended values based on multiple data sets (see SI and text), while those with symbols represent single experimental data sets.
Figure 14.

Adsorption isotherms for binary mixtures in water of amino acids. The curves represented by solid lines are recommended values based on multiple data sets (see SI and text), while those with symbols represent single experimental data sets.
4.3.3. Role of the Molecular Structure and Type of Substituents
Comparing the isotherms for the molecules with 6 carbon atoms in Figure 18 shows the relative surfactant efficiencies of different classes of organic molecules and substituents. The objective of the present inventory is only to gather all of these data for future studies but not to propose an in-depth analysis of it. However, the general trends displayed in Figure 18 can be briefly discussed. The effects of different compounds on the surface tension, Δσ, can be compared at a given concentration, for instance, C = 0.1 M, for which most isotherms are available. The most efficient surfactant in Figure 18 appears to be hexan-1-ol (AK16), with Δσ(0.1 M) ∼ 50 mN m–1. Then, for hexanoic acid (AC11) Δσ(0.1 M) ∼ 40 mN m–1, for the aromatic phenol (AK15) Δσ(0.1 M) ∼ 10 mN m–1 and for amines and amino acids, such as amino hexanoic acid (SA25), and leucine (SA26, SA27) it is negligible (Δσ(0.1 M) ∼ 0 mN m–1). Finally, the C6-sugars, glucose (SA33), galactose (SA24), inositol (SA35), and sorbitol (SA36), have a negligible effect at C = 0.1 M but tend to increase the surface tension at larger concentrations. Thus, between molecules with the same organic chain length, the general trend in surfactant efficiency in aqueous solutions is linear alcohols > linear acids ≫ linear amines and amino acids > sugars.
Figure 18.

Comparison of the adsorption isotherms for nonamphiphilic organic compounds with 6 C atoms, evidencing the effect of different organic substituents on the surface tension of aqueous solutions. The curves represented by solid lines are recommended values based on multiple data sets (see SI and text), while those with symbols represent single experimental data sets.
Within each class of compounds, the presence of multiple substituents (double or triple acids or alcohols), different isomers, or branching on the organic chain also affects the surfactant efficiency. For instance, for the diacid adipic acid (AC22) Δσ (0.1 M) ∼ 10 mN m–1 and for the triacid citric acid (AC34), Δσ (0.1 M) ∼ 0 clearly showing that the number of acid groups in the molecule decreases the surface tension effect. A similar effect is observed with the alcohols, the hexanediol isomers (AK23, AK24, AK25, AK26) having all smaller surface tension effects than hexan-1-ol, with Δσ (0.1 M) ∼ 15–25 mN m–1. Interestingly, there are large differences between the surfactant effects of the different isomers, hexan-1,2-diol (AK23) having much larger surfactant effects than the 1,5, 1,6, and 2,5 isomers. Finally, branched monoalcohols such as dimethyl butan-2-ol (AK18) and methyl pentan-2-ol (AK19) have slightly smaller effects than their linear counterpart hexan-1-ol, with Δσ (0.1 M) ∼ 30–40 mN m–1.
These simple comparisons evidence the importance of the molecular structure of nonamphiphilic organic compounds on their surface tension effect in aqueous solutions. The data presented in this section can thus be used in future studies to establish relationships between the molecular structure of nonamphiphilic organic compounds and their surface tension effects and, potentially, with other properties such as their solubility or polarity.
4.3.4. Compounds of Potential Importance in Activated CCN and Cloud Formation
The isotherms presented in this section give some general ideas about the types of compound that can affect cloud droplet formation at activation and thus on those that should be taken into account or ignored when investigating these processes. At activation, CCN have typically undergone a volume increase due to water uptake by a factor 1000, thus a dilution of their components by the same factor. This implies that, in order for organic compound to have some significant effect (i.e., Δσ ≥ 10 mN m–1) at activation, their effect needs to be achieved for concentrations of C ≤ 10–3 M. Applying this criterion (Δσ ≥ 10 mN m–1 with c ≤ 10–3 M) to the isotherms in Figures 8−15 show that only molecules with at least 7 or 8 C atoms for the linear acids and alcohols, and at least 9 or 10 C atoms for amines and amino acids (based on the curve for the C9-phenylalanine, SA32) are likely to affect the surface tension at activation. By contrast, nearly all of the amphiphilic compounds in Figure 16 fulfill this criterion, except SDS (SB1) and DTAB (SB2).
Figure 16.

Adsorption isotherms for binary mixtures in water of amphiphilic and macromolecular compounds (synthetic and biological surfactants). The curves represented by solid lines are recommended values based on multiple data sets (see SI and text), while those with symbols represent single experimental data sets.
Future investigations on cloud droplet formation should thus probably focus on such organic compounds, i.e., nonamphiphilic compounds with at least 8 or 9 C atoms and amphiphilic compounds except SDS and DTAB. The criterion Δσ ≥ 10 mN m–1 with C ≤ 10–3 M can thus be considered as an empirical distinction between “weak” and “strong” surfactants with respect to cloud droplet formation.
5. Current Knowledge of the Surface Tension of Atmospheric Particles
As underlined above, at the time of publication of this review, the surface tension of atmospheric particles has not been measured yet, although the techniques recently developed should soon converge toward such measurements. Different methodological approaches have thus been used to estimate the surface tension of atmospheric particles or determine the concentration of surfactants in such particles. Such measurements are summarized in Table 6 while the different methodologies used to determine the surface tension are described below. We distinguish two main types of approaches: the “top-down” ones, which consist in determining the surface tension of aerosol particles or populations based on direct or in situ atmospheric measurements (i.e., thus excluding any chemical treatment of the samples beside drying) and the “bottom-up” approaches, which consist in characterizing the surfactants extracted from atmospheric aerosols and calculating all the other relevant factors to estimate the average surface tension of the aerosol population. Bottom-up approaches are more frequent than top-down ones, both because few measurements techniques allow us to determine the surface tension of atmospheric particle populations and also because bottom-up approaches follow the historical step-by-step progression from first evidencing the presence of surfactants in atmospheric aerosols, to characterizing their properties, to characterizing all the other factors contributing to the surface tension.
Table 6. Surface Tension, CMC, and Concentration of Aerosols from Atmospheric Samples Reported in the Literature (Articles in Chronological Order)a.
| Sample type | Particle diameter | Location | Surfactant concentration | Extraction method/sample treatment | CMC (M) | Minimum surface tension σmin (mN m–1) | Tensiometry method |
|---|---|---|---|---|---|---|---|
| fog water | Dübendorf, Zwitzerland | filtration | 60.9 | DVT154 | |||
| fog water | Po Valley, Italy | evaporation | 58.8 | PB155 | |||
| fine aerosols | <1.5 μm | Po Valley, Italy | water extraction | 62.3 | PB156 | ||
| fog water | Po Valley, Italy | filtration | 55.5 | ||||
| cloud water | Puy de Dôme, France | 72.6 | |||||
| cloud water | Tenerife, Canary Island Spain | 72.7 | |||||
| cloud water | Rax, European Alps, Austria | 62 | NR362 | ||||
| semiurban aerosols | coarse mode (>1 μm) | Norwich, England | AS (MBAS): ∼1.95 (0.0–5.67) μmol g–1 | water extraction | 68.5–71.2 | PD157 | |
| AS (EVAS): ∼11 (1.9–21.9) μmol g–1 | |||||||
| CS (DBAS): ∼0.17 (0.00–1.22) μmol g–1 | |||||||
| fine mode (<1 μm) | AS (MBAS): ∼4.7 (0.57–14.3) μmol g–1 | ||||||
| AS (EVAS): ∼23.9 (4.4–699) μmol g–1 | |||||||
| CS (DBAS): ∼0.31 (0.00–1.45) μmol g–1 | |||||||
| total suspended solid (TSP) | AS (MBAS): ∼1.2 (0.28–3.07) μmol g–1 | ||||||
| AS (EVAS): 7.8 (2.4–9.5) μmol g–1 | |||||||
| atmospheric aerosols | stage 1: 0.2–0.5 mm | Jeju Island, Korea | water extraction | stage 1: 71.8 | PD158 | ||
| stage 2: 0.5–1.5 mm | stage 2: 71.4 | ||||||
| stage 3: 1.5–5.5 mm | stage 3: 71.9 | ||||||
| stage 4: 5.5–10 mm | stage 4: 72.0 | ||||||
| cloud water | I: 7–11 mm | evaporation | I: 69.1 | ||||
| III: > 17 mm | III: 64.4 | ||||||
| semiurban aerosols | PM10 | Bangi, Malaysia | AS (MBAS): 2.5 (2.1–3.4) μmol g–1 | water extraction | 67.2 | PD160 | |
| AS (EVAS): 12.6 (10.4–39.0) μmol g–1 | |||||||
| CS (DBAS): 0.06 (0.00–0.16) μmol g–1 | |||||||
| urban aerosols | PM10 | Penang, Malaysia | AS (MBAS): 4.7 (1.1–6.7) μmol g–1 | ∼68.5 | |||
| AS (EVAS): 13.6 (4.6–18.1) μmol g–1 | |||||||
| CS (DBAS): 0.15 (0.03–0.30) μmol g–1 | |||||||
| Amazonian aerosol (during dry, transition and wet periods) | 5 stages from 0.05 to 10 μm | Rondônia, Brazil | water extraction | 50.3 | PB/PD159 | ||
| fine biomass burning particulate matter | PM2.5 | Georgia (Augusta and Columbus), USA | water extraction | 59 | PD64 | ||
| temperate forest aerosols | PM10 | Hyytiälä, Finland | water extraction | ∼59.6 | PD161 | ||
| Amazonian forest aerosols | PM10 | Manaus, Brazil | 53.1 | ||||
| temperate forest aerosols | PM10 | Hyytiälä, Finland | double extraction (water + silicone microextraction) | 28.5 | |||
| coastal aerosols | PM2.5 | Aspvreten, Sweden | 29.0 | ||||
| Amazonian forest aerosols | PM10 | Manaus, Brazil | 27.3 | ||||
| urban aerosols | PM10 | Grenoble, France | double extraction (water + silicone microextraction) | ∼30 (summer) | PD162 | ||
| 35–45 (winter) | |||||||
| forested/coastal aerosol | PM2.5 | Aspvreten, Sweden | ∼40 | ||||
| urban aerosols | PM10 | Grenoble, France | double extraction (water + silicone microextraction) | 28–42 | PD22 | ||
| coastal aerosols | PM2.5 | Askö, Sweden | TS: 3.8 (2.7–14.3) × 10–2 M | double extraction (water + one SPE cartridge) | m1.34 (0.49–2.45) × 10–4 | m33.7 (32.1–39.8) | PD163 |
| atmospheric fog and cloudwater samples | Italy (Po Valley), North East Atlantic (Tenerife), Korea | evaporation | 40 | PD164 | |||
| coastal aerosols | PM1 | Rogoznica, Croatia | TS: 22.2 (7.2–134.3) × 10–3 M | wouble extraction (water + one SPE cartridge) | m1.90 (0.45–3.30) × 10–4 | m36.0 (29.8–46.0) | PD165 |
| urban aerosols | PM1 | Lyon, France | TS: 73.0 (12.8–1333.1) × 10–3 M | m12.00 (0.34–92.0) × 10–4 | m34.8 (27.0–47.1) | ||
| remote (edge of the boreal forest) aerosols | PM1 | Pallas, Finland | TS: 48.6 (8.9–1110.4) × 10–3 M | m1.60 (0.57–8.20) × 10–4 | m35.0 (28.2–48.7) | ||
| aerosols from estuarine water environment | 0.560–1 μm and 1.–3.2 μm size bins | Skidaway Island, USA | double extraction (water + two SPE cartridges) | 53.4 | PD166 | ||
| marine influenced aerosols | submicrometer (4 sizes ranges) | Skidaway Island, USA | double extraction (water + two SPE cartridges) | 36.8 (34.8–39.5) | PD167 | ||
| supermicrometer (6 size ranges) | 42.2 (37.5–48.3) | ||||||
| mixed (marine/continental) influenced aerosols | submicrometer (4 size ranges) | 40.4 (38.5–42.7) | |||||
| supermicrometer (6 size ranges) | 40.8 (37.9–45.9) | ||||||
| urban aerosols | <0.95 μm | Nagoya, Japan | water extraction | 48.3–55.4 | QELS168 |
(m) median; AS (MBAS): anionic surfactants by methylene blue active substances colorimetric method; AS (EVAS): anionic surfactants by ethyl violet active substances colorimetric method; CS (DBAS): cationic surfactants by disulfine blue active substances colorimetric method; TS: Total surfactant fraction: anionic surfactants + cationic surfactants + nonionic surfactants; TOC total organic compounds; WSOC: water-soluble organic carbon Content; ; PM10, PM2.5, PM1: particulate matter with diameter below 10 μm, 2.5 μm, and 1 μm, respectively; TSP: total suspended solids; SPE: solid phase extraction; NR: Nouy ring; DVT: Drop Volume Tensiometry; PB = pending bubble; PD = pending droplet (shape of a droplet); QELS: quasi-elastic light scattering.168
5.1. Bottom-Up Approaches
5.1.1. Evidencing and Characterizing Surfactants in Atmospheric Particles
Interestingly, the identification and measurement of surfactants in the natural environments202 and in atmospheric waters and aerosols both started in the 1990s and early 2000s.41,44,64,154−156,158,159,161,162,164 For the atmospheric samples, these measurements proceeded essentially by extracting specific fractions from the samples: water-soluble fraction,154−156,158,159,164 humic-like substances,41,44 hydrophobic and hydrophilic fractions,64 or total amphiphilic fraction.161,162,166,167 However, quantifying their effects on the surface tension in term of absolute concentration (i.e., determining their adsorption isotherms) took more time, as the exact molecules responsible for the surface tension effects could not be isolated in these early studies (except for humic-like substances).41,44 The development of methods to measure the concentration of surfactants in atmospheric aerosols using dyes and colorimetric techniques157,160,203−225 or electrochemical techniques (Figure 19),226,227 not only further confirmed the presence of surfactants in atmospheric particles, but has allowed to identify some of their sources,208,212,214 or to characterize their distribution in different aerosol size fractions (Figure 19).227
Figure 19.

Seasonal distribution of the mass of surface-active compounds (SAS) throughout different size fractions of aerosols at an urban site in Ljubljana, Slovenia. Reproduced with permission from ref (227). Copyright 2018 American Chemical Society.
Combining these quantification techniques with extractions targeting specifically amphiphilic compounds then allowed to establish the adsorption isotherms for the amphiphilic fractions of PM2.5 and PM1 aerosols from urban, rural, and remote regions of the atmosphere163,165,228 and for seawater-generated aerosols.229 These isotherms display CMC that are typically in the range 5 × 10⁻⁵–10–3 M, thus indicating that, without other effects (mixing or bulk-to-surface partitioning), these surfactant fractions should be able to reduce the surface tension of forming water droplets even at activation.
5.1.2. Mixing Effects with Other Aerosol Components
Once atmospheric surfactants are characterized, the next factor potentially affecting their contribution to the surface tension of the aerosol particles is their mixing with other aerosol components. A number of studies have investigated the effects of adding inorganic salts, NaCl or (NH4)2SO4 to aqueous solutions containing either semisoluble organic compounds,49,61−63,65−68 humic substances,41 or amphiphilic surfactants.60,68−74 To a few exceptions,66,107 they report a significant reduction of the surface tension due to the addition of salt. This effect was observed not only with bulk solutions but also with submicrometer particles, for which measurements of CN/CCN numbers49,67 or CCN growth factors64,67,78 indicated a reduction of the critical supersaturation, which could be unambiguously attributed to a surface tension reduction rather than hygroscopicity effects. Some of these studies even reported a reduction of the critical supersaturation to values that were lower than with the organic particles or salt particles, thus evidencing synergistic effects.49,64 As explained in Section 1.2.5, this surface tension reduction is due to the salting out of the surfactants to the surface of the liquid.15,68
Fewer studies have explored the effects of mixing amphiphilic surfactants with organic aerosol components, such as organic acids. In other fields of application, investigations of aqueous mixtures of SDS230 and CTAB231 with ascorbic acid reported a reduction of the CMC upon addition of ascorbic acid. More recently, investigations of aqueous mixtures of Triton X100, Brij35, and CTAC with oxalic and glutaric acid reported some nonideal behavior in term of surface tension, i.e., a surface tension for the mixture which was lower than expected from the sum of the contributions of the two components and, in some cases, some synergistic effects.68 As organic acids, such as oxalic, succinic, or glutaric acids, are very common in atmospheric particles, more of their mixtures with amphiphilic compounds must be studied. In particular, these mixing effects should be best studied with surfactants extracted from authentic atmospheric samples rather than with reference compounds.
Based on the observations made so far, it seems that mixing surfactants with major aerosol components such as inorganic salts and organic acids would further decrease the surface tension. However, more of such mixtures would need to be studied to confirm these trends. These mixing effects would also need to be investigated with surfactants extracted from atmospheric samples and not only with reference compounds.
5.1.3. Evidencing Surface Tension Depression and Bulk-to-Surface Partitioning Effects in Microscopic Droplets
Other effects that need to be investigated experimentally and taken into account when estimating the surface tension of atmospheric particles by bottom-up approaches are bulk-to-surface partitioning effects. Few experiments have been able to explore these effects and seem to yield contradictory conclusions. Experiments in which submicrometer particles (mean radius ∼250 nm) of (NH4)2SO4 were exposed to organic vapors (methylglyoxal and acetaldehyde) reported a decrease of the critical supersaturation based on CN/CCN measurements, thus showing that surface tension effects overcome the potential bulk-to-surface partitioning effects.110 Similarly, submicrometer particles (150–650 nm in diameter) coated with organic compounds (oxidation products from terpenes) displayed an increase of their growth factors measured with a custom-made chamber at a Relative Humidity (RH) up to 99.9%, which was unambiguously attributed to a surface tension depression,10,232−234 and thereby showing the dominant effect of surface tension over bulk-to-surface partitioning. The critical saturation, measured from CN/CCN numbers, for submicrometer particles containing hydrophilic surfactants from biomass burning aerosol was shown to be reduced by adding (NH4)2SO4 to below the critical saturation of pure (NH4)2SO4 particles, thus clearly evidencing surface tension effects over hygroscopic effets64 and either the absence or limited impact of bulk-to-surface partitioning effects.
Recent studies of the surface tension of ∼5–12 μm-diameter particles with optical tweezers, on the other hand, reported more contrasted results. For aqueous solutions of semisoluble organic compounds such as glutaric acid,174 and some amphiphilic surfactants such as octyl-β-d-1-thioglucopyranodide (OTG)180 a good agreement is reported between with the surface tension of the microscopic particles and large-volume samples. However, for other amphiphilic surfactants, such as Triton X100,178 TWEEN20, the glycol ethers C16E8, C12E5, C10E8, and C14E6, and their mixtures with NaCl and glutaric acid,180 the surface tension of the microscopic particles was significantly larger than that of large-volume samples of the same mixtures, which was attributed to bulk-to-surface partitioning effects.
The contrasted results obtained with different types of experiments do not allow one to conclude on the importance of bulk-to-surface partitioning effects on the surface tension yet. As discussed in Section 6, it is possible that some of these discrepancies result from the different techniques used to produce the particles in these experiments.
5.2. Top-Down Determination of the Surface Tension of Atmospheric Particles
Until now, the only examples of top-down determination of the surface tension of atmospheric particles are based on the measurements of atmospheric CCN growth factors and numbers. However, as mentioned in Section 2, because such measurements are rather unsensitive to surface tension, only a limited number of them have reported estimates of the surface tension of atmospheric particles: CCN growth measured in the tropical Atlantic Ocean and Central Germany indicated that these particles might have a surface tension between 50 and 70 m Nm–1 at activation,111,112 and recent CCN measurements in Southern China for newly formed particles report σ ∼ 60 mN m–1 above activation (supersaturation = 1%).113
Other types of measurements could be applied to atmospheric samples for the top-down determination of the surface tension in the future. Those include, for instance, the development of techniques to measure the vaporization enthalpy of atmospheric samples, a quantity known to be correlated to surface tension. More sophisticated techniques, such as surface-specific spectroscopies, Sum Frequency Generation235 or Second harmonic Scattering,236 could also be employed and use some vibrational properties of the surface molecules in atmospheric samples as a proxy for the surface tension. These approaches can only be applied to aerosol samples (for instance deposited on a substrate) and not individual particles but would provide overall values for the surface tension of the particle population, i.e., including mixing, partitioning, and all other relevant effects, unlike bottom-up approaches.
6. Conclusions and Perspectives
After being ignored or questioned for decades,8,108,111,112,237,238 surface tension depression in atmospheric particles has been shown by the many measurements reported in this review to be likely to occur and worth further investigating, in particular by developing sophisticated new techniques.9,164,239,240 However, major gaps remain in the knowledge of the surface tension of atmospheric particles and of its role in atmospheric processes. The following sections propose some potential future directions of research that could help to fill these gaps.
6.1. The Technical Challenges
Although the main objective when studying the surface tension of atmospheric particles is to answer scientific questions about atmospheric processes, the lack of techniques to measure the surface tension of small particles and to investigate related properties has been a major hurdle in the progress of this field of investigation. These technical limits are thus discussed first, focusing on a few major objectives.
6.1.1. Measuring the Surface Tension of Individual Atmospheric Particles
At the time of this review, the most important technical objective in this field of investigation should probably be to achieve direct measurements of the surface tension of individual atmospheric particles, as this would allow us to determine realistically the importance of this parameter in atmospheric processes and bypass all the uncertainties involved in bottom-up estimates. Such direct measurements could potentially be achieved by further developing the techniques that are already used to investigate the surface tension of individual particles (Section 3.2), such as optical tweezers or nanotensiometry (e.g., AFM). Besides direct measurements on individual particles, other “top-down” approaches, i.e., determining the surface tension of atmospheric particles without any (or only minimal) chemical treatment (cf. Section 5), would also be very valuable. As discussed in Section 5.2, techniques and approaches to be developed could be based, for instance, on measuring the vaporization enthalpy of atmospheric samples, as this parameter is known to be closely linked to the surface tension.141,142 Since surface tension reflects molecular interactions at the surface, it is possible that some vibrational properties of the surface molecules could be used as a proxy for the surface tension. Or, if this is not the case for the surfactants alone, then adding dyes forming complexes with the surfactants might display such vibrational signatures. If so, surface-specific spectroscopies, such as Sum Frequency Generation235 or Second Harmonic Scattering,236 could be employed to determine the surface tension of particle populations. Unfortunately, neither the measurement of vaporization enthalpy nor surface-specific spectroscopies are applicable to individual particles; they require sample masses of the scale of a particle population. And, in the case of the spectroscopic techniques, the particles would have to be deposited on a substrate. However, such approaches would be helpful, as they would provide net surface tension values for the particle population, i.e., including all mixing and partitioning effects (albeit averaged over the population).
6.1.2. Measuring the Surfactant Concentration in Individual Particles
Another parameter that is essential for the understanding and prediction of the surface tension of atmospheric particles but represents a major technical challenge is the surfactant concentration in the individual particles. Until now, only population-averaged surfactant concentration can be determined based on laborious extraction and colorimeric or electrochemical approaches (see Section 5.1.1). The techniques the most likely to be further developed into measuring surfactant concentration in individual particles are those used today to study individual particles: electrodynamic balance or optical tweezers or AFM. The quantification of surfactant molecules at the surface could be based on emission or scattering spectroscopies, with or without the addition of surfactant-complexing dyes.
6.1.3. Generating Artificial Particles of Controlled Composition
Last but not least, making substantial progress in the fundamental understanding of surface tension and its role in atmospheric processes would require the ability to produce micrometer- or submicrometer-sized particles in a controlled way in the laboratory, i.e., with a known size and surfactant concentration. While generating aqueous particles with a controlled concentration of inorganic salts is routinely done with nebulization or atomization techniques, it is much more difficult to control the particle surfactant content with such techniques. This is because the amount of surfactant transferred to the particles during the breakdown of the bulk surface into small droplets in the evaporation process is uncontrolled. Such a separation between the inorganic particles and the organic surfactant was evidenced, for instance, by the electron microscopic analyses (SEM-EDX) of mixed ammonium sulfate–Triton X114 solutions nebulized onto silicon wafers.241 These analyses showed that the surfactant (characterized by a majority of C atoms) was largely ejected from the ammonium sulfate particles (characterized by a majority of N- and S atoms) during nebulization (Figure 20).241 The difficulty in generating controlled particles is worsened by the absence of technique allowing us to verify the surfactant concentration in the generated particles. Thus, the development of better particle-generation techniques goes hand in hand with those techniques to measure surfactant concentration in individual particles. Until such individual particle techniques are developed, those based on colorimetric or electrochemical techniques (Section 5.1.1) could be applied to verify the surfactant concentration in laboratory-generated particles. Alternative particle-generation techniques, minimizing evaporation, could also be explored, such as the use of particle dispensers, as for instance in ref.168 An approach that ensure the best transfer of surfactant to the particles is probably that consisting in coating inorganic seed particles with organic surfactants by condensation.10,110,232−234 Unfortunately, this approach is difficult to apply to amphiphilic surfactants as they are not volatile. However, it can probably be attempted with a wide range of semisoluble (and semivolatile) organic surfactants. As emphasized above, generating controlled particles is essential for the fundamental understanding of surface tension effects in small particles. In particular, the different conclusions reported by different studies on the importance of bulk-to-surface partitioning on surface tension (Section 5.1.3) could result from using different particle-generation techniques. The different techniques used in these studies include the condensation of organic surfactants onto inorganic seeds,10,110,232−234 and others atomization/nebulization of aqueous mixtures,178,180 thus most likely resulting in very different surfactant contents in the particles.
Figure 20.

Impaction of particles generated by nebulizing an aqueous solution of (NH4)2SO4 0.1 M/Triton X114, 0.1 M onto a silicon wafer. A salt particle (∼3 μm) is visible at the center of the picture, and the dark spots are the surfactant. The spot patterns around the particle show that most of the surfactant from the solution is ejected outside the particles during the evaporation step of the nebulization. Picture obtained with a scanning electron microscope (ESEM, Quattro, ThermoFisher Scientific, USA).241
6.2. The Scientific Challenges
6.2.1. A Better Knowledge of the Properties of Atmospheric Surfactants
Besides addressing important scientific questions regarding the role of surface tension in atmospheric processes, many properties of atmospheric surfactants are still unknown and would require investigations in order to better understand and predict their impacts. Among the most important aspects to investigate is the identification of the compounds responsible for most of the surface tension depression in atmospheric particles and of their molecular structures. Although these compounds might vary between different regions, such identification would considerably simplify the investigation and prediction of their effects by identifying specific molecules or proxies that could be studied in the laboratory and by enabling targeted identification and characterization of their sources. Identifying the compounds responsible for most of the surface tension depression could proceed by isolating different extracts from atmospheric aerosols and comparing their surface tension. This has been done, for instance, for biomass burning aerosols,64 from which hydrophilic and hydrophobic organic fractions were extracted. While both fractions displayed some surface-active properties (with σ = 68 and 35 mN m–1, respectively), the hydrophobic fraction was the most surface-active. Identifying the compounds having the strongest surface-active contribution would then require further chemical analysis of this hydrophobic fraction, probably with separative techniques (gas or liquid chromatography). Alternative approaches to determine the type of surfactant having the most effect on the surface tension of atmospheric particles could be by investigating the presence of specific organic groups in the molecules present at the surface of particles using surface-specific spectroscopies.235,236 X-ray spectroscopy methods, such as scanning transmission X-ray microscopy, or STXM,242 sometimes combined with near-edge X-ray absorption fine structure analysis (STXM-NEXAFS),243 have thus been able to identify some specific organic groups at the surface of individual micrometer and submicrometer aerosol particles (Figure 21). Recently, X-ray photoelectron spectroscopy (XPS) investigation of aqueous solutions containing surface-active organics (carboxylic acids, alkyl-amines) were able to measure some important molecular information such as the surface enrichment of the organics and changes in the preferential orientation of the molecules at the surface, hydrophobic alkyl chains pointing increasingly outward from the solution.244 Such techniques are very promising for the characterization of the compounds acting on the surface tension of the droplets. A complete identification of the surfactant molecular structure would, however, probably require full (bulk) chemical analysis and would be a challenging task in itself. Such analyses have only been recently attempted.166
Figure 21.

Identification of the Organic Groups at the surface of individual particles with STXM-NEXAFS. A) Laboratory-generated Secondary Organic Aerosol from terpenes and isoprene oxidation; B) Amazonian organic aerosols with different potassium mass fractions. Reproduced from ref (243). Copyright 2012 American Association for the Advancement of Science.
6.2.2. A Better Understanding of the Role of Surface Tension in Cloud Droplet Formation
As indicated in Section 2.1, cloud droplet formation is, by far, the process in which the role of the surface tension of particles has been the most studied. It is also one of the most important atmospheric processes, both for the sustainability of life on Earth, human activities, and climate. Yet, the role of surface tension in cloud droplet formation has not been established yet. Some potential future directions of research that could help in elucidating these questions have been presented in Section 2.5. Besides the development of techniques to measure the surface tension of individual particles, allowing one to quantify its importance in cloud droplet formation, more global approaches are proposed, such as developing methods to collect separately CCN or cloudwater from interstitial aerosols and comparing the surface tension of the different samples. Even more global approaches could be based on establishing statistical relationships, such as correlations or causality relationships,140 between long-term measurements of cloud properties and of surface tension in aerosols at given locations. The advantage of the latter approach is that, provided that the data is available, it would allow investigating the effects of surface tension on specific cloud properties such as the droplet number, size distribution, cloud lifetime, etc.
6.2.3. A Better Understanding of the Role of Surface Tension in Other Atmospheric Processes
As underlined in Section 2, there are several other atmospheric processes in which the surface tension is expected to play a role, based on observations in other fields of science, but which remain almost entirely to be studied in the case of atmospheric particles. This includes the role of surface tension in the nucleation of new particles and in the uptake and release of gases by atmospheric particles. As indicated in Section 2.5, many aspects of these processes could be studied in the laboratory using model compounds. Understanding the role of surface tension in these processes could thus improve the prediction of the nucleation of new particles in the atmosphere and of the chemical evolutions of aerosol particles.
6.3. The Societal Challenges
Besides the scientific questions, the atmospheric processes in which surface tension is expected to play a role are linked to a range of environmental issues, such as water precipitation or drought, air quality, and global warming. Some research efforts could thus address these issues more directly to get a better understanding of their causes and mechanisms and perhaps identify some solutions.
6.3.1. Water Precipitation
If surface tension plays a significant role in cloud droplet formation, it is expected to affect the size distribution of cloud droplets and, therefore, the precipitation (rain) probability or frequency. Thus, for instance, investigating the type of surfactants affecting precipitation in some regions and having a knowledge of their sources in the local biosphere or microbiosphere,245 might help locally to identify solutions (in term of land use) to curb or mitigate recurring drought events. Another example is cloud seeding, to which numerous communities throughout the world are resorting today,246 and which represent substantial investments. While such solutions need to be used sparingly and only as emergency measures, understanding the role of surface tension in these processes could help make them less polluting by replacing silver iodide or other salts with less polluting seeds. Understanding the role of surface tension could also make cloud seeding more efficient, thus reducing the number of flights or shots necessary and also reducing the environmental impact.
6.3.2. Fog-Haze Pollution
An air quality issue in which surface tension might also play a role are the recurring fog-haze events in Asia247 and other parts of the World, characterized by a strong water uptake by atmospheric particles. Understanding the potential role of surface tension in the large water uptake of the particles could possibly help to find measures to reduce the duration or intensity of such events, for instance, by favoring the growth and precipitation of the particles.
In conclusion, studying the surface tension of atmospheric particles and its role in atmospheric processes is a relatively young field of research, which has emerged over the last two decades. The number of studies and published articles on these topics has increased tremendously over these last decades, with even the formation of a small community around these questions in the last years. However, many scientific questions remain to be answered, and many technical challenges need to be overcome to answer them. It is, therefore, a promising and exciting topic for the future at the interface between fundamental science and environmental issues.
Acknowledgments
The authors thank the French National Research Agency (ANR) and Swiss National Science Foundation (SNSF) for funding through the ORACLE (AerOsol-Cloud Interactions: the Role of orgAnic compounds in CLoud droplEt activation) project, Grant no ANR-20-CE93-0008 and SNF 200021L_197149. Dr. C. Marcolli and Prof. T. Peter, ETH Zurich, Switzerland, and Prof. A. Monod and J. Grisillon, LCE, CNRS and Aix Marseille Université, France, are gratefully thanked for proof-reading and commenting the paper.
Biographies
Manuella El Haber received a Master’s degree in Analytical Chemistry from the Faculty of Sciences of the Lebanese University, Lebanon (2018). She is preparing a Ph.D. in Physical Chemistry at the University of Lyon, France. She is working on the characterization of surfactants in atmospheric aerosols and investigating their effect on cloud formation. Her research interests mainly include analytical chemistry, atmospheric chemistry, and environmental science.
Violaine Gérard obtained an Engineer degree from the European School of Chemistry, Polymers and Materials in Strasbourg, France, and a Master’s degree in Chemistry (2013) from the University of Stuttgart, Germany. She also holds a Ph.D. in Chemistry (2016) from the University of Lyon, France. During her Ph.D., she worked in the group of Barbara Nozière, investigating the presence and properties of surfactants in atmospheric aerosols and their impact on cloud droplet formation, on a joint ANR-NSF project with the National Centre for Scientific Research (CNRS), France, and the University of California, Berkeley, USA. For the past dozen years, she has participated in multidisciplinary research projects in academia and industry, in collaboration with international teams, mostly from France, Germany, USA and Finland. Her research interests mainly focus on analytical chemistry, surfactant science, atmospheric chemistry, and environmental science.
Judith Kleinheins is currently a third-year doctoral student at the Institute for Atmospheric and Climate Science at ETH Zurich, Switzerland. In her Ph.D. work, she is focusing on the influence of surface tension on cloud formation. From 2013 until 2020, she studied Chemical and Process Engineering (B.Sc. and M.Sc.) at the Karlsruhe Institute of Technology in Karlsruhe, Germany. Besides surface tension, she has been working on heat transfer, computational fluid dynamics, co-condensation, and secondary ice production.
Corinne Ferronato is currently an Associate Professor at the University Claude Bernard Lyon 1 (UCBLyon1), France. She received her Ph.D. in Atmospheric Chemistry from the University Joseph Fourier, Grenoble, France. After a postdoctoral stay at National Center for Atmospheric Research in Boulder (USA) in the Goeffrey Tyndall group, she joined IRCELYON (Institute of research on catalysis and the environment of Lyon) at UCBLyon1. Her research interests include analytical chemistry and environmental science.
Barbara Nozière is a Professor in Physical Chemistry and Atmospheric Chemistry at the Royal Institute of Technology (KTH), Sweden. She received her Ph.D. in Physical Chemistry from the University of Bordeaux, France and has been working on the reactivity and properties of organic compounds in the atmosphere since then. Since 2007, one of her research interests has been the characterization of surfactants in atmospheric aerosols and of their effects on surface tension.
Supporting Information Available
The Supporting Information is available free of charge at https://pubs.acs.org/doi/10.1021/acs.chemrev.4c00173.
Section S1 (pp. S6–S7): Concentration conversions used in the inventory. Section S2 (pp. S8–S10): Determination of recommended values for the surface tension isotherms. Section S3 (pp. S11–S208): Adsorption isotherm data and recommendations. (PDF)
Author Present Address
⊥ Laboratoire Eurofins Hydrologie Est, Eurofins Environnement France, 54320 Maxéville, France
Author Contributions
M. E. H. and V. G. gathered information and data from the literature for the text and the inventory, and prepared the inventory (calculations, Tables, Figures). J. K. performed the calculations of the recommended data in the inventory; C. F. and B. N. wrote the text and supervised the paper structure and presentation. All the authors contributed to writing and proofreading the paper and have given their approval to the final version of the paper. CRediT: Manuella El Haber data curation, formal analysis, methodology, validation, visualization, writing-review & editing; Violaine Gérard data curation, formal analysis, methodology, validation, visualization, writing-review & editing; Judith Kleinheins data curation, software, validation, writing-review & editing; Corinne Ferronato funding acquisition, project administration, resources, supervision, writing-review & editing; Barbara Noziere funding acquisition, methodology, project administration, supervision, writing-original draft, writing-review & editing.
French National Research Agency (ANR-20-CE93-0008) and Swiss National Science Foundation (SNF 200021L_197149).
The authors declare no competing financial interest.
Supplementary Material
References
- McFiggans G.; Artaxo P.; Baltensperger U.; Coe H.; Facchini M. C.; Feingold G.; Fuzzi S.; Gysel M.; Laaksonen A.; Lohmann U.; et al. The effect of physical and chemical aerosol properties on warm cloud droplet activation. Atmos. Chem. Phys. 2006, 6, 2593–2649. 10.5194/acp-6-2593-2006. [DOI] [Google Scholar]
- Farmer D. K.; Cappa C. D.; Kreidenweis S. M. Atmospheric processes and their controlling influence on cloud condensation nuclei activity. Chem. Rev. 2015, 115, 4199–4217. 10.1021/cr5006292. [DOI] [PubMed] [Google Scholar]
- McNeill V. F.; Sareen N.; Schwier A. N. Surface-active organics in atmospheric aerosols. Atmos. Aerosol Chem. 2013, 339, 201–259. 10.1007/128_2012_404. [DOI] [PubMed] [Google Scholar]
- Wokosin K. A.; Schell E. L.; Faust J. A. Surfactants, films, and coatings on atmospheric aerosol particles: A review. Environ. Sci: Atmos. 2022, 2, 775. 10.1039/D2EA00003B. [DOI] [Google Scholar]
- Mott D. M.; Fukuyama M.; Hibara A. Aerosol droplet surface measurement methods. Anal. Sci. 2021, 37, 61–68. 10.2116/analsci.20SAR01. [DOI] [PubMed] [Google Scholar]
- Lee H. D.; Tivanski A. V. Atomic force microscopy: An emerging tool in measuring the phase state and surface tension of individual aerosol particles. Annu. Rev. Phys. Chem. 2021, 72, 235. 10.1146/annurev-physchem-090419-110133. [DOI] [PubMed] [Google Scholar]
- Li Z.; Williams A. L.; Rood M. J. Influence of soluble surfactant properties on the activation of aerosol particles containing inorganic solute. J. Atmos. Sci. 1998, 55, 1859–1866. . [DOI] [Google Scholar]
- Sorjamaa R.; Svenningsson B.; Raatikainen T.; Henning S.; Bilde M.; Laaksonen A. The role of surfactants in köhler theory reconsidered. Atmos. Chem. Phys. 2004, 4, 2107–2117. 10.5194/acp-4-2107-2004. [DOI] [Google Scholar]
- Petters S. S.; Petters M. D. Surfactant effect on cloud condensation nuclei for two-component internally mixed aerosols. J. Geophys. Res: Atmos. 2016, 121, 1878–1895. 10.1002/2015JD024090. [DOI] [Google Scholar]
- Ruehl C. R.; Davies J. F.; Wilson K. R. An interfacial mechanism for cloud droplet formation on organic aerosols. Science 2016, 351, 1447–1450. 10.1126/science.aad4889. [DOI] [PubMed] [Google Scholar]
- Prisle N. L. A predictive thermodynamic framework of cloud droplet activation for chemically unresolved aerosol mixtures, including surface tension, non-ideality, and bulk-surface partitioning. Atmos. Chem. Phys. 2021, 21, 16387–16411. 10.5194/acp-21-16387-2021. [DOI] [Google Scholar]
- Vepsäläinen S.; Calderón S. M.; Malila J.; Prisle N. L. Comparison of six approaches to predicting droplet activation of surface active aerosol - part 1: Moderately surface active organics. Atmos. Chem. Phys. 2022, 22, 2669–2687. 10.5194/acp-22-2669-2022. [DOI] [Google Scholar]
- Vepsäläinen S.; Calderón S. M.; Prisle N. L. Comparison of six approaches to predicting droplet activation of surface active aerosol-part 2: Strong surfactants. EGUsphere 2023, 23, 15149–15164. 10.5194/acp-23-15149-2023. [DOI] [Google Scholar]
- Kleinheins J. V.; Shardt N.; El Haber M.; Ferronato C.; Nozière B.; Peter T.; Marcolli C. Surface tension models for binary aqueous solutions: A review and intercomparison. Phys. Chem. Chem. Phys. 2023, 25, 11055. 10.1039/D3CP00322A. [DOI] [PMC free article] [PubMed] [Google Scholar]
- Rosen M. J.; Kunjappu J. T.. Surfactants and interfacial phenomena; John Wiley & Sons, 2012. [Google Scholar]
- Gibbs J. W. On the equilibrium of heterogeneous substances. Am. J. Sci. 1878, s3-16, 441–458. 10.2475/ajs.s3-16.96.441. [DOI] [Google Scholar]
- Makkonen L. Misinterpretation of the shuttleworth equation. Scr. Mater. 2012, 66, 627–629. 10.1016/j.scriptamat.2012.01.055. [DOI] [Google Scholar]
- Hings S.; Wrobel W.; Cross E.; Worsnop D.; Davidovits P.; Onasch T. Ccn activation experiments with adipic acid: Effect of particle phase and adipic acid coatings on soluble and insoluble particles. Atmos. Chem. Phys. 2008, 8, 3735–3748. 10.5194/acp-8-3735-2008. [DOI] [Google Scholar]
- Dalirian M.; Ylisirniö A.; Buchholz A.; Schlesinger D.; Ström J.; Virtanen A.; Riipinen I. Cloud droplet activation of black carbon particles coated with organic compounds of varying solubility. Atmos. Chem. Phys. 2018, 18, 12477–12489. 10.5194/acp-18-12477-2018. [DOI] [Google Scholar]
- Tricot Y.-M.Surfactants: Static and dynamic surface tension. In Liquid film coating: Scientific principles and their technological implications; Springer, 1997; pp 99–136. [Google Scholar]
- Rice O. K. Dynamic surface tension and the structure of surfaces. J. Phys. Chem. 1927, 31, 207–215. 10.1021/j150272a004. [DOI] [Google Scholar]
- Nozière B.; Baduel C.; Jaffrezo J.-L. The dynamic surface tension of atmospheric aerosol surfactants reveals new aspects of cloud activation. Nat. Commun. 2014, 5, 4335. 10.1038/ncomms4335. [DOI] [PMC free article] [PubMed] [Google Scholar]
- Bain A.; Lalemi L.; Croll Dawes N.; Miles R. E.; Prophet A. M.; Wilson K. R.; Bzdek B. R. Surfactant partitioning dynamics in freshly generated aerosol droplets. J. Am. Chem. Soc. 2024, 146, 16028. 10.1021/jacs.4c03041. [DOI] [PMC free article] [PubMed] [Google Scholar]
- Miles R. E.; Glerum M. W.; Boyer H. C.; Walker J. S.; Dutcher C. S.; Bzdek B. R. Surface tensions of picoliter droplets with sub-millisecond surface age. J. Phys. Chem. A 2019, 123, 3021–3029. 10.1021/acs.jpca.9b00903. [DOI] [PubMed] [Google Scholar]
- Chalk S. J.The iupac gold book website, 2019 ed.; International Union of Pure and Applied Chemistry, 2019. [Google Scholar]
- Delgado E.; Diaz G. A molecular structure based model for predicting surface tension of organic compounds 2006, 17, 483–496. 10.1080/10629360600933913. [DOI] [PubMed] [Google Scholar]
- Hribar B.; Southall N. T.; Vlachy V.; Dill K. A. How ions affect the structure of water. J. Am. Chem. Soc. 2002, 124, 12302–12311. 10.1021/ja026014h. [DOI] [PMC free article] [PubMed] [Google Scholar]
- Marcus Y. Effect of ions on the structure of water: Structure making and breaking. Chem. Rev. 2009, 109, 1346–1370. 10.1021/cr8003828. [DOI] [PubMed] [Google Scholar]
- Smit B.; Schlijper A.; Rupert L.; Van Os N. Effects of chain length of surfactants on the interfacial tension: Molecular dynamics simulations and experiments. J. Phys. Chem. 1990, 94, 6933–6935. 10.1021/j100381a003. [DOI] [Google Scholar]
- Catarino Centeno R.; Bustamante-Rendón R. A.; Hernández-Fragoso J. S.; Arroyo-Ordoñez I.; Pérez E.; Alas S.; Gama Goicochea A. Surfactant chain length and concentration influence on the interfacial tension of two immiscible model liquids: A coarse-grained approach. J. Mol. Model. 2017, 23, 1–8. 10.1007/s00894-017-3474-x. [DOI] [PubMed] [Google Scholar]
- Hawkins L. N.; Russell L. M. Polysaccharides, proteins, and phytoplankton fragments: Four chemically distinct types of marine primary organic aerosol classified by single particle spectromicroscopy. Adv. Meteorol. 2010, 2010, 612132. 10.1155/2010/612132. [DOI] [Google Scholar]
- Aller J. Y.; Radway J. C.; Kilthau W. P.; Bothe D. W.; Wilson T. W.; Vaillancourt R. D.; Quinn P. K.; Coffman D. J.; Murray B. J.; Knopf D. A. Size-resolved characterization of the polysaccharidic and proteinaceous components of sea spray aerosol. Atmos. Environ. 2017, 154, 331–347. 10.1016/j.atmosenv.2017.01.053. [DOI] [Google Scholar]
- Allen J. O.; Dookeran N. M.; Smith K. A.; Sarofim A. F.; Taghizadeh K.; Lafleur A. L. Measurement of polycyclic aromatic hydrocarbons associated with size-segregated atmospheric aerosols in massachusetts. Environ. Sci. Technol. 1996, 30, 1023–1031. 10.1021/es950517o. [DOI] [Google Scholar]
- Kiss G.; Varga-Puchony Z.; Rohrbacher G.; Hlavay J. Distribution of polycyclic aromatic hydrocarbons on atmospheric aerosol particles of different sizes. Atmos. Res. 1998, 46, 253–261. 10.1016/S0169-8095(97)00067-7. [DOI] [Google Scholar]
- Chang K.-F.; Fang G.-C.; Chen J.-C.; Wu Y.-S. Atmospheric polycyclic aromatic hydrocarbons (pahs) in asia: A review from 1999 to 2004. Environ. Pollut. 2006, 142, 388–396. 10.1016/j.envpol.2005.09.025. [DOI] [PubMed] [Google Scholar]
- Hopkins R. J.; Tivanski A. V.; Marten B. D.; Gilles M. K. Chemical bonding and structure of black carbon reference materials and individual carbonaceous atmospheric aerosols. J. Aerosol Sci. 2007, 38, 573–591. 10.1016/j.jaerosci.2007.03.009. [DOI] [Google Scholar]
- Mertes S.; Dippel B.; Schwarzenböck A. Quantification of graphitic carbon in atmospheric aerosol particles by raman spectroscopy and first application for the determination of mass absorption efficiencies. J. Aerosol Sci. 2004, 35, 347–361. 10.1016/j.jaerosci.2003.10.002. [DOI] [Google Scholar]
- Kuznetsova M.; Lee C.; Aller J. Characterization of the proteinaceous matter in marine aerosols. Mar. Chem. 2005, 96, 359–377. 10.1016/j.marchem.2005.03.007. [DOI] [Google Scholar]
- Orellana M. V.; Hansell D. A.; Matrai P. A.; Leck C. Marine polymer-gels’ relevance in the atmosphere as aerosols and ccn. Gels 2021, 7, 185. 10.3390/gels7040185. [DOI] [PMC free article] [PubMed] [Google Scholar]
- van Pinxteren M.; Robinson T.-B.; Zeppenfeld S.; Gong X.; Bahlmann E.; Fomba K. W.; Triesch N.; Stratmann F.; Wurl O.; Engel A.; et al. High number concentrations of transparent exopolymer particles (tep) in ambient aerosol particles and cloud water-a case study at the tropical atlantic ocean. Atmos. Chem. Phys. Discuss. 2022, 22, 5725. 10.5194/acp-22-5725-2022. [DOI] [Google Scholar]
- Kiss G.; Tombacz E.; Hansson H. C. Surface tension effects of humic-like substances in the aqueous extract of tropospheric fine aerosol. J. Atmos. Chem. 2005, 50, 279–294. 10.1007/s10874-005-5079-5. [DOI] [Google Scholar]
- Salma I.; Ocskay R.; Varga I.; Maenhaut W. Surface tension of atmospheric humic-like substances in connection with relaxation, dilution, and solution ph. J. Geophys. Res: Atmos. 2006, 111, D23205. 10.1029/2005JD007015. [DOI] [Google Scholar]
- Dinar E.; Mentel T.; Rudich Y. The density of humic acids and humic like substances (hulis) from fresh and aged wood burning and pollution aerosol particles. Atmos. Chem. Phys. 2006, 6, 5213–5224. 10.5194/acp-6-5213-2006. [DOI] [Google Scholar]
- Taraniuk I.; Graber E. R.; Kostinski A.; Rudich Y.. Surfactant properties of atmospheric and model humic-like substances (hulis). Geophys. Res. Lett. 2007, 34. 10.1029/2007GL029576. [DOI] [Google Scholar]
- Zangrando R.; Barbaro E.; Vecchiato M.; Kehrwald N. M.; Barbante C.; Gambaro A. Levoglucosan and phenols in antarctic marine, coastal and plateau aerosols. Sci. Total Environ. 2016, 544, 606–616. 10.1016/j.scitotenv.2015.11.166. [DOI] [PubMed] [Google Scholar]
- Svenningsson B.; Rissler J.; Swietlicki E.; Mircea M.; Bilde M.; Facchini M. C.; Decesari S.; Fuzzi S.; Zhou J.; Monster J.; et al. Hygroscopic growth and critical supersaturations for mixed aerosol particles of inorganic and organic compounds of atmospheric relevance. Atmos. Chem. Phys. 2006, 6, 1937–1952. 10.5194/acp-6-1937-2006. [DOI] [Google Scholar]
- Topping D. O.; McFiggans G. B.; Kiss G.; Varga Z.; Facchini M. C.; Decesari S.; Mircea M. Surface tensions of multi-component mixed inorganic/organic aqueous systems of atmospheric significance: Measurements, model predictions and importance for cloud activation predictions. Atmos. Chem. Phys. 2007, 7, 2371–2398. 10.5194/acp-7-2371-2007. [DOI] [Google Scholar]
- Aumann E.; Hildemann L. M.; Tabazadeh A. Measuring and modeling the composition and temperature-dependence of surface tension for organic solutions. Atmos. Environ. 2010, 44, 329–337. 10.1016/j.atmosenv.2009.10.033. [DOI] [Google Scholar]
- Kristensen T. B.; Prisle N. L.; Bilde M. Cloud droplet activation of mixed model hulis and nacl particles: Experimental results and κ-köhler theory. Atmos. Res. 2014, 137, 167–175. 10.1016/j.atmosres.2013.09.017. [DOI] [Google Scholar]
- Lin J. J.; Kristensen T. B.; Calderón S. M.; Malila J.; Prisle N. L. Effects of surface tension time-evolution for ccn activation of a complex organic surfactant. Environ. Sci-Proc. Imp. 2020, 22, 271–284. 10.1039/C9EM00426B. [DOI] [PubMed] [Google Scholar]
- Guetzloff T. F.; Rice J. A. Does humic acid form a micelle?. Sci. Total Environ. 1994, 152, 31–35. 10.1016/0048-9697(94)90548-7. [DOI] [Google Scholar]
- Tuckermann R.; Cammenga H. K. The surface tension of aqueous solutions of some atmospheric water-soluble organic compounds. Atmos. Environ. 2004, 38, 6135–6138. 10.1016/j.atmosenv.2004.08.005. [DOI] [Google Scholar]
- Radchenkova N.; Panchev I.; Vassilev S.; Kuncheva M.; Dobreva S.; Kambourova M. Continuous cultivation of a thermophilic bacterium aeribacillus pallidus 418 for production of an exopolysaccharide applicable in cosmetic creams. J. Appl. Microbiol. 2015, 119, 1301–1309. 10.1111/jam.12944. [DOI] [PubMed] [Google Scholar]
- Schwehr K. A.; Xu C.; Chiu M.-H.; Zhang S.; Sun L.; Lin P.; Beaver M.; Jackson C.; Agueda O.; Bergen C.; et al. Protein: Polysaccharide ratio in exopolymeric substances controlling the surface tension of seawater in the presence or absence of surrogate macondo oil with and without corexit. Mar. Chem. 2018, 206, 84–92. 10.1016/j.marchem.2018.09.003. [DOI] [Google Scholar]
- Maulana A.; Adiandri R. S.; Boopathy R.; Setiadi T. Extraction, characterization, and biosurfactant properties of extracellular polymeric substance from textile wastewater activated sludge. J. Biosci. Bioeng. 2022, 134, 508–512. 10.1016/j.jbiosc.2022.08.005. [DOI] [PubMed] [Google Scholar]
- Brangwynne C. P.; Eckmann C. R.; Courson D. S.; Rybarska A.; Hoege C.; Gharakhani J.; Jülicher F.; Hyman A. A. Germline p granules are liquid droplets that localize by controlled dissolution/condensation. Science 2009, 324, 1729–1732. 10.1126/science.1172046. [DOI] [PubMed] [Google Scholar]
- Testa A.; Spanke H. T.; Jambon-Puillet E.; Yasir M.; Feng Y.; Küffner A. M.; Arosio P.; Dufresne E. R.; Style R. W.; Rebane A. A. Surface passivation method for the super-repellence of aqueous macromolecular condensates. Langmuir 2023, 39, 14626–14637. 10.1021/acs.langmuir.3c01886. [DOI] [PMC free article] [PubMed] [Google Scholar]
- Yee M. M.; Miyajima T.; Takisawa N. Evaluation of amphiphilic properties of fulvic acid and humic acid by alkylpyridinium binding study. Colloids Surf. A Physicochem. Eng. Asp. 2006, 272, 182–188. 10.1016/j.colsurfa.2005.07.022. [DOI] [Google Scholar]
- Stewart T. J.; Traber J.; Kroll A.; Behra R.; Sigg L. Characterization of extracellular polymeric substances (eps) from periphyton using liquid chromatography-organic carbon detection-organic nitrogen detection (lc-ocd-ond). Environ. Sci. Pollut. Res. 2013, 20, 3214–3223. 10.1007/s11356-012-1228-y. [DOI] [PMC free article] [PubMed] [Google Scholar]
- Qazi M. J.; Schlegel S. J.; Backus E. H. G.; Bonn M.; Bonn D.; Shahidzadeh N. Dynamic surface tension of surfactants in the presence of high salt concentrations. Langmuir 2020, 36, 7956–7964. 10.1021/acs.langmuir.0c01211. [DOI] [PMC free article] [PubMed] [Google Scholar]
- Shulman M. L.; Jacobson M. C.; Carlson R. J.; Synovec R. E.; Young T. E. Dissolution behavior and surface tension effects of organic compounds in nucleating cloud droplets. Geophys. Res. Lett. 1996, 23, 277–280. 10.1029/95GL03810. [DOI] [Google Scholar]
- Demou E.; Donaldson D. Adsorption of atmospheric gases at the air- water interface. 4: The influence of salts. J. Phys. Chem. A 2002, 106, 982–987. 10.1021/jp0128628. [DOI] [Google Scholar]
- Tuckermann R. Surface tension of aqueous solutions of water-soluble organic and inorganic compounds. Atmos. Environ. 2007, 41, 6265–6275. 10.1016/j.atmosenv.2007.03.051. [DOI] [Google Scholar]
- Asa-Awuku A.; Sullivan A. P.; Hennigan C. J.; Weber R. J.; Nenes A. Investigation of molar volume and surfactant characteristics of water-soluble organic compounds in biomass burning aerosol. Atmos. Chem. Phys. 2008, 8, 799–812. 10.5194/acp-8-799-2008. [DOI] [Google Scholar]
- Vanhanen J.; Hyvärinen A. P.; Anttila T.; Raatikainen T.; Viisanen Y.; Lihavainen H. Ternary solution of sodium chloride, succinic acid and water; surface tension and its influence on cloud droplet activation. Atmos. Chem. Phys. 2008, 8, 4595–4604. 10.5194/acp-8-4595-2008. [DOI] [Google Scholar]
- Frosch M.; Prisle N. L.; Bilde M.; Varga Z.; Kiss G. Joint effect of organic acids and inorganic salts on cloud droplet activation. Atmos. Chem. Phys. 2011, 11, 3895–3911. 10.5194/acp-11-3895-2011. [DOI] [Google Scholar]
- Hansen A. M. K.; Hong J.; Raatikainen T.; Kristensen K.; Ylisirniö A.; Virtanen A.; Petäjä T.; Glasius M.; Prisle N. Hygroscopic properties and cloud condensation nuclei activation of limonene-derived organosulfates and their mixtures with ammonium sulfate. Atmos. Chem. Phys. 2015, 15, 14071–14089. 10.5194/acp-15-14071-2015. [DOI] [Google Scholar]
- El Haber M.; Ferronato C.; Giroir-Fendler A.; Fine L.; Nozière B. Salting out, non-ideality and synergism enhance surfactant efficiency in atmospheric aerosols. Sci. Rep. 2023, 13, 20672. 10.1038/s41598-023-48040-5. [DOI] [PMC free article] [PubMed] [Google Scholar]
- Helvacı Ş.; Peker S.; Özdemir G. Effect of electrolytes on the surface behavior of rhamnolipids r1 and r2. Colloids Surf., B 2004, 35, 225–233. 10.1016/j.colsurfb.2004.01.001. [DOI] [PubMed] [Google Scholar]
- Farajzadeh R.; Krastev R.; Zitha P. L. J. Foam films stabilized with alpha olefin sulfonate (aos). Colloids Surf. A Physicochem. Eng. Asp. 2008, 324, 35–40. 10.1016/j.colsurfa.2008.03.024. [DOI] [PubMed] [Google Scholar]
- Xu Q.; Nakajima M.; Ichikawa S.; Nakamura N.; Roy P.; Okadome H.; Shiina T. Effects of surfactant and electrolyte concentrations on bubble formation and stabilization. J. Colloid Interface Sci. 2009, 332, 208–214. 10.1016/j.jcis.2008.12.044. [DOI] [PubMed] [Google Scholar]
- Sharma P.; MacNeil J. A.; Bowles J.; Leaist D. G. The unusual importance of activity coefficients for micelle solutions illustrated by an osmometry study of aqueous sodium decanoate and aqueous sodium decanoate+ sodium chloride solutions. Phys. Chem. Chem. Phys. 2011, 13, 21333–21343. 10.1039/c1cp22437a. [DOI] [PubMed] [Google Scholar]
- Yekeen N.; Manan M. A.; Idris A. K.; Samin A. M. Influence of surfactant and electrolyte concentrations on surfactant adsorption and foaming characteristics. J. Pet. Sci. Eng. 2017, 149, 612–622. 10.1016/j.petrol.2016.11.018. [DOI] [Google Scholar]
- Majeed T.; Solling T. I.; Kamal M. S. Foamstability: The interplay between salt-, surfactant- and critical micelle concentration. J. Pet. Sci. Eng. 2020, 187, 106871. 10.1016/j.petrol.2019.106871. [DOI] [Google Scholar]
- Wang C.; Lei Y. D.; Endo S.; Wania F. Measuring and modeling the salting-out effect in ammonium sulfate solutions. Environ. Sci. Technol. 2014, 48, 13238–13245. 10.1021/es5035602. [DOI] [PubMed] [Google Scholar]
- Endo S.; Pfennigsdorff A.; Goss K.-U. Salting-out effect in aqueous nacl solutions: Trends with size and polarity of solute molecules. Environ. Sci. Technol. 2012, 46, 1496–1503. 10.1021/es203183z. [DOI] [PubMed] [Google Scholar]
- Fu C.; Li Z.; Sun Z.; Xie S. A review of salting-out effect and sugaring-out effect: Driving forces for novel liquid-liquid extraction of biofuels and biochemicals. Front. Chem. Sci. Eng. 2021, 15, 854–871. 10.1007/s11705-020-1980-3. [DOI] [Google Scholar]
- Asa-Awuku A.; Nenes A.; Gao S.; Flagan R.; Seinfeld J. H. Water-soluble soa from alkene ozonolysis: Composition and droplet activation kinetics inferences from analysis of ccn activity. Atmos. Chem. Phys. 2010, 10, 1585–1597. 10.5194/acp-10-1585-2010. [DOI] [Google Scholar]
- Atkins P. W.; De Paula J.; Keeler J.. Atkins’ physical chemistry; Oxford University Press, 2023. [Google Scholar]
- Holland P. M.; Rubingh D. N.. Mixed surfactant systems: An overview; American Chemical Society: Washington, DC., 1992. [Google Scholar]
- Weers J. G.; Scheuing D. R. Structure/performance relationships in monoalkyl/dialkyl cationic surfactant mixtures. J. Colloid Interface Sci. 1991, 145, 563–580. 10.1016/0021-9797(91)90386-M. [DOI] [Google Scholar]
- Shah S. K.; Chakraborty G.; Bhattarai A.; De R. Synergistic and antagonistic effects in micellization of mixed surfactants. J. Mol. Liq. 2022, 368, 120678. 10.1016/j.molliq.2022.120678. [DOI] [Google Scholar]
- Brune W.Curvature effect: Kelvin effect. In METEO 300: Fundamentals of Atmospheric Science; Pennsylvania State University: Pennsylvania, USA, 2023. [Google Scholar]
- Tolman R. C. The effect of droplet size on surface tension. J. Chem. Phys. 1949, 17, 333–337. 10.1063/1.1747247. [DOI] [Google Scholar]
- Blokhuis E. M.; Kuipers J.. Thermodynamic expressions for the tolman length. J. Chem. Phys. 2006, 124. 10.1063/1.2167642. [DOI] [PubMed] [Google Scholar]
- Bahadur R.; Russell L. M. Effect of surface tension from md simulations on size-dependent deliquescence of nacl nanoparticles. Aerosol Sci. Technol. 2008, 42, 369–376. 10.1080/02786820802104965. [DOI] [Google Scholar]
- Lu H. M.; Jiang Q. Size-dependent surface tension and tolman’s length of droplets. Langmuir 2005, 21, 779–781. 10.1021/la0489817. [DOI] [PubMed] [Google Scholar]
- Xue Y.-Q.; Yang X.-C.; Cui Z.-X.; Lai W.-P. The effect of microdroplet size on the surface tension and tolman length. J. Phys. Chem. B 2011, 115, 109–112. 10.1021/jp1084313. [DOI] [PubMed] [Google Scholar]
- Kim S.; Kim D.; Kim J.; An S.; Jhe W. Direct evidence for curvature-dependent surface tension in capillary condensation: Kelvin equation at molecular scale. Phys. Rev. X 2018, 8, 041046. 10.1103/PhysRevX.8.041046. [DOI] [Google Scholar]
- Sorjamaa R.; Svenningsson B.; Raatikainen T.; Henning S.; Bilde M.; Laaksonen A. The role of surfactants in köhler theory reconsidered. Atmos. Chem. Phys. 2004, 4, 2107–2117. 10.5194/acp-4-2107-2004. [DOI] [Google Scholar]
- Petters M.; Kreidenweis S. A single parameter representation of hygroscopic growth and cloud condensation nucleus activity-part 3: Including surfactant partitioning. Atmos. Chem. Phys. 2013, 13, 1081–1091. 10.5194/acp-13-1081-2013. [DOI] [Google Scholar]
- Wilson K. R.; Prophet A. M. Chemical kinetics in microdroplets. Annu. Rev. Phys. Chem. 2024, 75, 185. 10.1146/annurev-physchem-052623-120718. [DOI] [PubMed] [Google Scholar]
- Vargaftik N.; Volkov B.; Voljak L. International tables of the surface tension of water. J. Phys. Chem. Ref. Data 1983, 12, 817–820. 10.1063/1.555688. [DOI] [Google Scholar]
- Wohlfarth C.; Wohlfarth B.. Binary mixtures: Data. In Surface tension of pure liquids and binary liquid mixtures; Lechner M. D., Ed.; Springer: Berlin, 1997; Vol. IV/24, pp 1–209. [Google Scholar]
- Tahery R.; Modarress H.; Satherley J. Surface tension prediction and thermodynamic analysis of the surface for binary solutions. Chem. Eng. Sci. 2005, 60, 4935–4952. 10.1016/j.ces.2005.03.056. [DOI] [Google Scholar]
- Sayem Alam M.; Ragupathy R.; Mandal A. B. The self-association and mixed micellization of an anionic surfactant, sodium dodecyl sulfate, and a cationic surfactant, cetyltrimethylammonium bromide: Conductometric, dye solubilization, and surface tension studies. J. Dispers. Sci. Technol. 2016, 37, 1645–1654. 10.1080/01932691.2015.1120677. [DOI] [Google Scholar]
- Levich V.; Krylov V. Surface-tension-driven phenomena. Annu. Rev. Fluid Mech. 1969, 1, 293–316. 10.1146/annurev.fl.01.010169.001453. [DOI] [Google Scholar]
- Scriven L.; Sternling C. The marangoni effects. Nature 1960, 187, 186–188. 10.1038/187186a0. [DOI] [Google Scholar]
- Deegan R. D.; Bakajin O.; Dupont T. F.; Huber G.; Nagel S. R.; Witten T. A. Capillary flow as the cause of ring stains from dried liquid drops. Nature 1997, 389, 827–829. 10.1038/39827. [DOI] [Google Scholar]
- Burnett J. Jr; Himmelblau D. The effect of surface active agents on interphase mass transfer. AIChE J. 1970, 16, 185–193. 10.1002/aic.690160207. [DOI] [Google Scholar]
- Lee Y.; Tsao G.; Wankat P. Hydrodynamic effect of surfactants on gas-liquid oxygen transfer. AIChE J. 1980, 26, 1008–1012. 10.1002/aic.690260616. [DOI] [Google Scholar]
- Chen R.-H.; Phuoc T. X.; Martello D. Surface tension of evaporating nanofluid droplets. Int. J. Heat Mass Transfer 2011, 54, 2459–2466. 10.1016/j.ijheatmasstransfer.2011.02.016. [DOI] [Google Scholar]
- Bryant J. J.; Lippert C.; Qi G.; Liu K.; Mannel D. S.; Liu K. Enhanced carbon capture through incorporation of surfactant additives. Ind. Eng. Chem. Res. 2016, 55, 7456–7461. 10.1021/acs.iecr.5b04906. [DOI] [Google Scholar]
- Kini G.; Garimella S. Passive enhancement of ammonia-water absorption by the addition of surfactants. Int. J. Heat Mass Transfer 2021, 176, 121478. 10.1016/j.ijheatmasstransfer.2021.121478. [DOI] [Google Scholar]
- Lohmann U.; Lüönd F.; Mahrt F.. An introduction to clouds: From the microscale to climate; Cambridge University Press, 2016. [Google Scholar]
- Köhler H. The nucleus in and the growth of hygroscopic droplets. Trans. Faraday Soc. 1936, 32, 1152–1161. 10.1039/TF9363201152. [DOI] [Google Scholar]
- Bilde M.; Svenningsson B. Ccn activation of slightly soluble organics: The importance of small amounts of inorganic salt and particle phase. Tellus B Chem. Phys. Meteorol. 2022, 56, 128–134. 10.3402/tellusb.v56i2.16406. [DOI] [Google Scholar]
- Petters M. D.; Kreidenweis S. M. A single parameter representation of hygroscopic growth and cloud condensation nucleus activity. Atmos. Chem. Phys. 2007, 7, 1961–1971. 10.5194/acp-7-1961-2007. [DOI] [Google Scholar]
- Duplissy J.; Gysel M.; Sjogren S.; Meyer N.; Good N.; Kammermann L.; Michaud V.; Weigel R.; Martins dos Santos S.; Gruening C.; et al. Intercomparison study of six htdmas: Results and recommendations. Atmos. Meas. Technol. 2009, 2, 363–378. 10.5194/amt-2-363-2009. [DOI] [Google Scholar]
- Sareen N.; Schwier A. N.; Lathem T. L.; Nenes A.; McNeill V. F. Surfactants from the gas phase may promote cloud droplet formation. Proc. Natl. Acad. Sci. U.S.A. 2013, 110, 2723–2728. 10.1073/pnas.1204838110. [DOI] [PMC free article] [PubMed] [Google Scholar]
- Good N.; Topping D. O.; Allan J. D.; Flynn M.; Fuentes E.; Irwin M.; Williams P. I.; Coe H.; McFiggans G. Consistency between parameterisations of aerosol hygroscopicity and ccn activity during the rhamble discovery cruise. Atmos. Chem. Phys. 2010, 10, 3189–3203. 10.5194/acp-10-3189-2010. [DOI] [Google Scholar]
- Irwin M.; Good N.; Crosier J.; Choularton T. W.; McFiggans G. Reconciliation of measurements of hygroscopic growth and critical supersaturation of aerosol particles in central germany. Atmos. Chem. Phys. 2010, 10, 11737–11752. 10.5194/acp-10-11737-2010. [DOI] [Google Scholar]
- Cai M.; Liang B.; Sun Q.; Liu L.; Yuan B.; Shao M.; Huang S.; Peng Y.; Wang Z.; Tan H.; et al. The important roles of surface tension and growth rate in the contribution of new particle formation (npf) to cloud condensation nuclei (ccn) number concentration: Evidence from field measurements in southern china. Atmos. Chem. Phys. 2021, 21, 8575–8592. 10.5194/acp-21-8575-2021. [DOI] [Google Scholar]
- Horsch M.; Vrabec J.; Hasse H. Modification of the classical nucleation theory based on molecular simulation data for surface tension, critical nucleus size, and nucleation rate. Phys. Rev. E 2008, 78, 011603. 10.1103/PhysRevE.78.011603. [DOI] [PubMed] [Google Scholar]
- Vehkamäki H.; Riipinen I. Thermodynamics and kinetics of atmospheric aerosol particle formation and growth. Chem. Soc. Rev. 2012, 41, 5160–5173. 10.1039/c2cs00002d. [DOI] [PubMed] [Google Scholar]
- Yu H.; McGraw R.; Lee S. H.. Effects of amines on formation of sub-3 nm particles and their subsequent growth. Geophys. Res. Lett. 2012, 39. 10.1029/2011GL050099. [DOI] [Google Scholar]
- Lee S. H.; Gordon H.; Yu H.; Lehtipalo K.; Haley R.; Li Y.; Zhang R. New particle formation in the atmosphere: From molecular clusters to global climate. J. Geophys. Res: Atmos. 2019, 124, 7098–7146. 10.1029/2018JD029356. [DOI] [Google Scholar]
- Smith J. N.; Draper D. C.; Chee S.; Dam M.; Glicker H.; Myers D.; Thomas A. E.; Lawler M. J.; Myllys N. Atmospheric clusters to nanoparticles: Recent progress and challenges in closing the gap in chemical composition. J. Aerosol Sci. 2021, 153, 105733. 10.1016/j.jaerosci.2020.105733. [DOI] [Google Scholar]
- Stolzenburg D.; Cai R.; Blichner S. M.; Kontkanen J.; Zhou P.; Makkonen R.; Kerminen V.-M.; Kulmala M.; Riipinen I.; Kangasluoma J. Atmospheric nanoparticle growth. Rev. Mod. Phys. 2023, 95, 045002. 10.1103/RevModPhys.95.045002. [DOI] [Google Scholar]
- Young L.-H.; Lee S.-H.; Kanawade V.; Hsiao T.-C.; Lee Y.; Hwang B.-F.; Liou Y.-J.; Hsu H.-T.; Tsai P.-J. New particle growth and shrinkage observed in subtropical environments. Atmos. Chem. Phys. 2013, 13, 547–564. 10.5194/acp-13-547-2013. [DOI] [Google Scholar]
- Yu H.; Dai L.; Zhao Y.; Kanawade V. P.; Tripathi S. N.; Ge X.; Chen M.; Lee S. H. Laboratory observations of temperature and humidity dependencies of nucleation and growth rates of sub-3 nm particles. J. Geophys. Res: Atmos. 2017, 122, 1919–1929. 10.1002/2016JD025619. [DOI] [Google Scholar]
- Li X.; Bourg I. C. Phase state, surface tension, water activity, and accommodation coefficient of water-organic clusters near the critical size for atmospheric new particle formation. Environ. Sci. Technol. 2023, 57, 13092–13103. 10.1021/acs.est.2c09627. [DOI] [PMC free article] [PubMed] [Google Scholar]
- Nguyen V.; Schoemaker F.; Blokhuis E.; Schall P. Measurement of the curvature-dependent surface tension in nucleating colloidal liquids. Phys. Rev. Lett. 2018, 121, 246102. 10.1103/PhysRevLett.121.246102. [DOI] [PubMed] [Google Scholar]
- Onischuk A.; Purtov P.; Baklanov A.; Karasev V.; Vosel S.. Evaluation of surface tension and tolman length as a function of droplet radius from experimental nucleation rate and supersaturation ratio: Metal vapor homogeneous nucleation. J. Chem. Phys. 2006, 124. 10.1063/1.2140268. [DOI] [PubMed] [Google Scholar]
- Onischuk A.; Valiulin S.; Vosel S.; Karasev V.; Zelik V.; Baklanov A. Surface tension of sulfur nanoparticles as determined from homogeneous nucleation experiments. J. Aerosol Sci. 2016, 97, 1–21. 10.1016/j.jaerosci.2016.02.008. [DOI] [Google Scholar]
- Huang Y.; Barraza K. M.; Kenseth C. M.; Zhao R.; Wang C.; Beauchamp J. L.; Seinfeld J. H. Probing the oh oxidation of pinonic acid at the air-water interface using field-induced droplet ionization mass spectrometry (fidi-ms). J. Phys. Chem. A 2018, 122, 6445–6456. 10.1021/acs.jpca.8b05353. [DOI] [PubMed] [Google Scholar]
- Faust J. A.; Abbatt J. P. Organic surfactants protect dissolved aerosol components against heterogeneous oxidation. J. Phys. Chem. A 2019, 123, 2114–2124. 10.1021/acs.jpca.9b00167. [DOI] [PubMed] [Google Scholar]
- Nagare B.; Marcolli C.; Welti A.; Stetzer O.; Lohmann U. Comparing contact and immersion freezing from continuous flow diffusion chambers. Atmos. Chem. Phys. 2016, 16, 8899–8914. 10.5194/acp-16-8899-2016. [DOI] [Google Scholar]
- Pruppacher H. R.; Klett J. D.. Microphysics of clouds and precipitation: Reprinted 1980; Springer Science & Business Media, 2012. [Google Scholar]
- Hoose C.; Möhler O. Heterogeneous ice nucleation on atmospheric aerosols: A review of results from laboratory experiments. Atmos. Chem. Phys. 2012, 12, 9817–9854. 10.5194/acp-12-9817-2012. [DOI] [Google Scholar]
- Garnham C. P.; Campbell R. L.; Walker V. K.; Davies P. L. Novel dimeric β-helical model of an ice nucleation protein with bridged active sites. BMC Struct. Biol. 2011, 11, 1–12. 10.1186/1472-6807-11-36. [DOI] [PMC free article] [PubMed] [Google Scholar]
- Gavish M.; Popovitz-Biro R.; Lahav M.; Leiserowitz L. Ice nucleation by alcohols arranged in monolayers at the surface of water drops. Science 1990, 250, 973–975. 10.1126/science.250.4983.973. [DOI] [PubMed] [Google Scholar]
- Popovitz-Biro R.; Wang J.; Majewski J.; Shavit E.; Leiserowitz L.; Lahav M. Induced freezing of supercooled water into ice by self-assembled crystalline monolayers of amphiphilic alcohols at the air-water interface. J. Am. Chem. Soc. 1994, 116, 1179–1191. 10.1021/ja00083a003. [DOI] [Google Scholar]
- Majewski J.; Popovitz-Biro R.; Bouwman W. G.; Kjaer K.; Als-Nielsen J.; Lahav M.; Leiserowitz L. The structural properties of uncompressed crystalline monolayers of alcohols cnh2n+ 1 oh (n= 13–31) on water and their role as ice nucleators. Chem. Eur. J. 1995, 1, 304–311. 10.1002/chem.19950010507. [DOI] [Google Scholar]
- Cantrell W.; Robinson C.. Heterogeneous freezing of ammonium sulfate and sodium chloride solutions by long chain alcohols. Geophys. Res. Lett. 2006, 33. 10.1029/2005GL024945. [DOI] [Google Scholar]
- Ochshorn E.; Cantrell W.. Towards understanding ice nucleation by long chain alcohols. J. Chem. Phys. 2006, 124. 10.1063/1.2166368. [DOI] [PubMed] [Google Scholar]
- Zobrist B.; Koop T.; Luo B.; Marcolli C.; Peter T. Heterogeneous ice nucleation rate coefficient of water droplets coated by a nonadecanol monolayer. J. Phys. Chem. C 2007, 111, 2149–2155. 10.1021/jp066080w. [DOI] [Google Scholar]
- Knopf D. A.; Forrester S. M. Freezing of water and aqueous nacl droplets coated by organic monolayers as a function of surfactant properties and water activity. J. Phys. Chem. A 2011, 115, 5579–5591. 10.1021/jp2014644. [DOI] [PubMed] [Google Scholar]
- Perkins R. J.; Vazquez de Vasquez M. G.; Beasley E. E.; Hill T. C.; Stone E. A.; Allen H. C.; DeMott P. J. Relating structure and ice nucleation of mixed surfactant systems relevant to sea spray aerosol. J. Phys. Chem. A 2020, 124, 8806–8821. 10.1021/acs.jpca.0c05849. [DOI] [PubMed] [Google Scholar]
- Runge J.; Bathiany S.; Bollt E.; Camps-Valls G.; Coumou D.; Deyle E.; Glymour C.; Kretschmer M.; Mahecha M. D.; Muñoz-Marí J.; et al. Inferring causation from time series in earth system sciences. Nat. Commun. 2019, 10, 2553. 10.1038/s41467-019-10105-3. [DOI] [PMC free article] [PubMed] [Google Scholar]
- Keeney M.; Heicklen J. Surface tension and the heat of vaporization: A simple empirical correlation. J. Inorg. Nucl. Chem. 1979, 41, 1755–1758. 10.1016/0022-1902(79)80118-9. [DOI] [Google Scholar]
- Freire M. G.; Carvalho P. J.; Queimada A. J.; Marrucho I. M.; Coutinho J. A. Surface tension of liquid fluorocompounds. J. Chem. Eng. Data 2006, 51, 1820–1824. 10.1021/je060199g. [DOI] [Google Scholar]
- Ault A. P.; Axson J. L. Atmospheric aerosol chemistry: Spectroscopic and microscopic advances. Anal. Chem. 2017, 89, 430–452. 10.1021/acs.analchem.6b04670. [DOI] [PubMed] [Google Scholar]
- Geisler R.; Hormozi M. A.; von Klitzing R. Unveiling the nanoscale world: Exploring surface tension measurements with atomic force nanoindenters. Curr. Opin. Colloid Interface Sci. 2024, 69, 101769. 10.1016/j.cocis.2023.101769. [DOI] [Google Scholar]
- Rafferty A.; Vennes B.; Bain A.; Preston T. C. Optical trapping and light scattering in atmospheric aerosol science. Phys. Chem. Chem. Phys. 2023, 25, 7066–7089. 10.1039/D2CP05301B. [DOI] [PubMed] [Google Scholar]
- Bain A. Recent advances in experimental techniques for investigating aerosol surface tension. Aerosol Sci. Technol. 2024, 1–24. 10.1080/02786826.2024.2373907.38993374 [DOI] [Google Scholar]
- Franses E. I.; Basaran O. A.; Chang C.-H. Techniques to measure dynamic surface tension. Curr. Opin. Colloid Interface Sci. 1996, 1, 296–303. 10.1016/S1359-0294(96)80018-5. [DOI] [Google Scholar]
- Lund Myhre C. E.; D’Anna B.; Nicolaisen F. M.; Nielsen C. J. Properties of aqueous methanesulfonic acid: Complex index of refraction and surface tension. Appl. Opt. 2004, 43, 2500–2509. 10.1364/AO.43.002500. [DOI] [PubMed] [Google Scholar]
- Lee J. Y.; Hildemann L. M. Surface tensions of solutions containing dicarboxylic acid mixtures. Atmos. Environ. 2014, 89, 260–267. 10.1016/j.atmosenv.2014.02.049. [DOI] [Google Scholar]
- Hyvärinen A.-P.; Lihavainen H.; Gaman A.; Vairila L.; Ojala H.; Kulmala M.; Viisanen Y. Surface tensions and densities of oxalic, malonic, succinic, maleic, malic, and cis-pinonic acids. J. Chem. Eng. Data 2006, 51, 255–260. 10.1021/je050366x. [DOI] [Google Scholar]
- Donaldson D. J.; Anderson D. Adsorption of atmospheric gases at the air-water interface. 2. C1-c4 alcohols, acids, and acetone. J. Phys. Chem. A 1999, 103, 871–876. 10.1021/jp983963h. [DOI] [Google Scholar]
- Hoorfar M.; Neumann A. W. Recent progress in axisymmetric drop shape analysis (adsa). Adv. Colloid Interface Sci. 2006, 121, 25–49. 10.1016/j.cis.2006.06.001. [DOI] [PubMed] [Google Scholar]
- Lee B.-B.; Ravindra P.; Chan E.-S. A critical review: Surface and interfacial tension measurement by the drop weight method. Chem. Eng. Commun. 2008, 195, 889–924. 10.1080/00986440801905056. [DOI] [Google Scholar]
- Capel P. D.; Gunde R.; Zuercher F.; Giger W. Carbon speciation and surface tension of fog. Environ. Sci. Technol. 1990, 24, 722–727. 10.1021/es00075a017. [DOI] [Google Scholar]
- Facchini M. C.; Mircea M.; Fuzzi S.; Charlson R. J. Cloud albedo enhancement by surface-active organic solutes in growing droplets. Nature 1999, 401, 257–259. 10.1038/45758. [DOI] [Google Scholar]
- Facchini M. C.; Decesari S.; Mircea M.; Fuzzi S.; Loglio G. Surface tension of atmospheric wet aerosol and cloud/fog droplets in relation to their organic carbon content and chemical composition. Atmos. Environ. 2000, 34, 4853–4857. 10.1016/S1352-2310(00)00237-5. [DOI] [Google Scholar]
- Latif M. T.; Brimblecombe P. Surfactants in atmospheric aerosols. Environ. Sci. Technol. 2004, 38, 6501–6506. 10.1021/es049109n. [DOI] [PubMed] [Google Scholar]
- Decesari S.; Facchini M.; Fuzzi S.; McFiggans G.; Coe H.; Bower K. The water-soluble organic component of size-segregated aerosol, cloud water and wet depositions from jeju island during ace-asia. Atmos. Environ. 2005, 39, 211–222. 10.1016/j.atmosenv.2004.09.049. [DOI] [Google Scholar]
- Mircea M.; Facchini M. C.; Decesari S.; Cavalli F.; Emblico L.; Fuzzi S.; Vestin A.; Rissler J.; Swietlicki E.; Frank G.; et al. Importance of the organic aerosol fraction for modeling aerosol hygroscopic growth and activation: A case study in the amazon basin. Atmos. Chem. Phys. 2005, 5, 3111–3126. 10.5194/acp-5-3111-2005. [DOI] [Google Scholar]
- Latif M. T.; Brimblecombe P.; Ramli N. A.; Sentian J.; Sukhapan J.; Sulaiman N. Surfactants in south east asian aerosols. Environ. Chem. 2005, 2, 198–204. 10.1071/EN05031. [DOI] [Google Scholar]
- Ekström S.; Nozière B.; Hultberg M.; Alsberg T.; Magnér J.; Nilsson E. D.; Artaxo P. A possible role of ground-based microorganisms on cloud formation in the atmosphere. Biogeosci. 2010, 7, 387–394. 10.5194/bg-7-387-2010. [DOI] [Google Scholar]
- Baduel C.; Nozière B.; Jaffrezo J.-L. Summer/winter variability of the surfactants in aerosols from grenoble, france. Atmos. Environ. 2012, 47, 413–420. 10.1016/j.atmosenv.2011.10.040. [DOI] [Google Scholar]
- Gérard V.; Nozière B.; Baduel C.; Fine L.; Frossard A. A.; Cohen R. C. Anionic, cationic, and nonionic surfactants in atmospheric aerosols from the baltic coast at askö, sweden: Implications for cloud droplet activation. Environ. Sci. Technol. 2016, 50, 2974–2982. 10.1021/acs.est.5b05809. [DOI] [PubMed] [Google Scholar]
- Ovadnevaite J.; Zuend A.; Laaksonen A.; Sanchez K. J.; Roberts G.; Ceburnis D.; Decesari S.; Rinaldi M.; Hodas N.; Facchini M. C.; et al. Surface tension prevails over solute effect in organic-influenced cloud droplet activation. Nature 2017, 546, 637–641. 10.1038/nature22806. [DOI] [PubMed] [Google Scholar]
- Gérard V.; Noziere B.; Fine L.; Ferronato C.; Singh D. K.; Frossard A. A.; Cohen R. C.; Asmi E.; Lihavainen H.; Kivekäs N.; et al. Concentrations and adsorption isotherms for amphiphilic surfactants in pm1 aerosols from different regions of europe. Environ. Sci. Technol. 2019, 53, 12379–12388. 10.1021/acs.est.9b03386. [DOI] [PubMed] [Google Scholar]
- Burdette T. C.; Frossard A. A. Characterization of seawater and aerosol particle surfactants using solid phase extraction and mass spectrometry. J. Environ. Sci. 2021, 108, 164–174. 10.1016/j.jes.2021.01.026. [DOI] [PubMed] [Google Scholar]
- Burdette T. C.; Bramblett R. L.; Zimmermann K.; Frossard A. A. Influence of air mass source regions on signatures of surface-active organic molecules in size resolved atmospheric aerosol particles. ACS Earth Space Chem. 2023, 7, 1578–1591. 10.1021/acsearthspacechem.3c00161. [DOI] [PMC free article] [PubMed] [Google Scholar]
- Gen M.; Hibara A.; Phung P. N.; Miyazaki Y.; Mochida M. In situ surface tension measurement of deliquesced aerosol particles. J. Phys. Chem. A 2023, 127, 6100–6108. 10.1021/acs.jpca.3c02681. [DOI] [PubMed] [Google Scholar]
- Berry J. D.; Neeson M. J.; Dagastine R. R.; Chan D. Y.; Tabor R. F. Measurement of surface and interfacial tension using pendant drop tensiometry. J. Colloid Interface Sci. 2015, 454, 226–237. 10.1016/j.jcis.2015.05.012. [DOI] [PubMed] [Google Scholar]
- Stückrad B.; Hiller W.; Kowalewski T. Measurement of dynamic surface tension by the oscillating droplet method. Exp. Fluids 1993, 15, 332–340. 10.1007/BF00223411. [DOI] [Google Scholar]
- Metcalf A. R.; Boyer H. C.; Dutcher C. S. Interfacial tensions of aged organic aerosol particle mimics using a biphasic microfluidic platform. Environ. Sci. Technol. 2016, 50, 1251–1259. 10.1021/acs.est.5b04880. [DOI] [PubMed] [Google Scholar]
- Ishiwata T.; Sakai K. Dynamic surface tension measurement with temporal resolution on microsecond scale. Appl. Phys. Express 2014, 7, 077301. 10.7567/APEX.7.077301. [DOI] [Google Scholar]
- Ashkin A.; Dziedzic J. Optical levitation of liquid drops by radiation pressure. Science 1975, 187, 1073–1075. 10.1126/science.187.4181.1073. [DOI] [PubMed] [Google Scholar]
- Bzdek B. R.; Power R. M.; Simpson S. H.; Reid J. P.; Royall C. P. Precise, contactless measurements of the surface tension of picolitre aerosol droplets. Chem. Sci. 2016, 7, 274–285. 10.1039/C5SC03184B. [DOI] [PMC free article] [PubMed] [Google Scholar]
- Bzdek B. R.; Collard L.; Sprittles J. E.; Hudson A. J.; Reid J. P.. Dynamic measurements and simulations of airborne picolitre-droplet coalescence in holographic optical tweezers. J. Chem. Phys. 2016, 145. 10.1063/1.4959901. [DOI] [PubMed] [Google Scholar]
- Frossard A. A.; Li W.; Gérard V.; Nozière B.; Cohen R. C. Influence of surfactants on growth of individual aqueous coarse mode aerosol particles. Aerosol Sci. Technol. 2018, 52, 459–469. 10.1080/02786826.2018.1424315. [DOI] [Google Scholar]
- Bzdek B. R.; Reid J. P. Perspective: Aerosol microphysics: From molecules to the chemical physics of aerosols. J. Chem. Phys. 2017, 147, 220901. 10.1063/1.5002641. [DOI] [PubMed] [Google Scholar]
- Bzdek B. R.; Reid J. P.; Malila J.; Prisle N. L. The surface tension of surfactant-containing, finite volume droplets. Proc. Natl. Acad. Sci. U.S.A. 2020, 117, 8335. 10.1073/pnas.1915660117. [DOI] [PMC free article] [PubMed] [Google Scholar]
- Swanson B. E.; Frossard A. A. Influence of selected cationic, anionic, and nonionic surfactants on hygroscopic growth of individual aqueous coarse mode aerosol particles. Aerosol Sci. Technol. 2023, 57, 63–76. 10.1080/02786826.2022.2144114. [DOI] [Google Scholar]
- Bain A.; Ghosh K.; Prisle N. L.; Bzdek B. R. Surface-area-to-volume ratio determines surface tensions in microscopic, surfactant-containing droplets. ACS Cent. Sci. 2023, 9, 2076. 10.1021/acscentsci.3c00998. [DOI] [PMC free article] [PubMed] [Google Scholar]
- Tong Y.; Wu Z.; Zhou B.; Hu M.; Ye A. Surface tension of single suspended aerosol microdroplets. Chin. Chem. Lett. 2024, 35, 109062. 10.1016/j.cclet.2023.109062. [DOI] [Google Scholar]
- Endo T.; Ishikawa K.; Fukuyama M.; Uraoka M.; Ishizaka S.; Hibara A. Spherical spontaneous capillary-wave resonance on optically trapped aerosol droplet. J. Phys. Chem. C 2018, 122, 20684–20690. 10.1021/acs.jpcc.8b03784. [DOI] [Google Scholar]
- Morris H. S.; Grassian V. H.; Tivanski A. V. Humidity-dependent surface tension measurements of individual inorganic and organic submicrometre liquid particles. Chem. Sci. 2015, 6, 3242–3247. 10.1039/C4SC03716B. [DOI] [PMC free article] [PubMed] [Google Scholar]
- Lee H. D.; Estillore A. D.; Morris H. S.; Ray K. K.; Alejandro A.; Grassian V. H.; Tivanski A. V. Direct surface tension measurements of individual sub-micrometer particles using atomic force microscopy. J. Phys. Chem. A 2017, 121, 8296–8305. 10.1021/acs.jpca.7b04041. [DOI] [PubMed] [Google Scholar]
- Lee H. D.; Morris H. S.; Laskina O.; Sultana C. M.; Lee C.; Jayarathne T.; Cox J. L.; Wang X.; Hasenecz E. S.; DeMott P. J.; et al. Organic enrichment, physical phase state, and surface tension depression of nascent core-shell sea spray aerosols during two phytoplankton blooms. ACS Earth Space Chem. 2020, 4, 650–660. 10.1021/acsearthspacechem.0c00032. [DOI] [Google Scholar]
- Kaluarachchi C. P.; Lee H. D.; Lan Y.; Lansakara T. I.; Tivanski A. V. Surface tension measurements of aqueous liquid-air interfaces probed with microscopic indentation. Langmuir 2021, 37, 2457–2465. 10.1021/acs.langmuir.0c03507. [DOI] [PubMed] [Google Scholar]
- Madawala C. K.; Lee H. D.; Kaluarachchi C. P.; Tivanski A. V. Probing the water uptake and phase state of individual sucrose nanoparticles using atomic force microscopy. ACS Earth Space Chem. 2021, 5, 2612–2620. 10.1021/acsearthspacechem.1c00101. [DOI] [PMC free article] [PubMed] [Google Scholar]
- Xiong C.; Chen X.; Ding X.; Kuang B.; Pei X.; Xu Z.; Yang S.; Hu H.; Wang Z. Reconsideration of surface tension and phase state effects on cloud condensation nuclei activity based on the atomic force microscopy measurement. Atmos. Chem. Phys. 2022, 22, 16123–16135. 10.5194/acp-22-16123-2022. [DOI] [Google Scholar]
- Sudersan P.; Müller M.; Hormozi M.; Li S.; Butt H.-J. r.; Kappl M. Method to measure surface tension of microdroplets using standard afm cantilever tips. Langmuir 2023, 39, 10367–10374. 10.1021/acs.langmuir.3c00613. [DOI] [PMC free article] [PubMed] [Google Scholar]
- Terlouw J. P.; Vogelaar M. G. R.. Kapteyn package, version 3.4; Kapteyn Astronomical Institute: Groningen, The Netherlands, 2014.
- Noziere B.; Kalberer M.; Claeys M.; Allan J.; D’Anna B.; Decesari S.; Finessi E.; Glasius M.; Grgic I.; Hamilton J. F.; et al. The molecular identification of organic compounds in the atmosphere: State of the art and challenges. Chem. Rev. 2015, 115, 3919–3983. 10.1021/cr5003485. [DOI] [PubMed] [Google Scholar]
- Decesari S.; Fuzzi S.; Facchini M.; Mircea M.; Emblico L.; Cavalli F.; Maenhaut W.; Chi X.; Schkolnik G.; Falkovich A.; et al. Characterization of the organic composition of aerosols from rondônia, brazil, during the lba-smocc 2002 experiment and its representation through model compounds. Atmos. Chem. Phys. 2006, 6, 375–402. 10.5194/acp-6-375-2006. [DOI] [Google Scholar]
- Plewka A.; Gnauk T.; Brüggemann E.; Herrmann H. Biogenic contributions to the chemical composition of airborne particles in a coniferous forest in germany. Atmos. Environ. 2006, 40, 103–115. 10.1016/j.atmosenv.2005.09.090. [DOI] [Google Scholar]
- Kourtchev I.; Copolovici L.; Claeys M.; Maenhaut W. Characterization of atmospheric aerosols at a forested site in central europe. Environ. Sci. Technol. 2009, 43, 4665–4671. 10.1021/es803055w. [DOI] [PubMed] [Google Scholar]
- Gao S.; Surratt J. D.; Knipping E. M.; Edgerton E. S.; Shahgholi M.; Seinfeld J. H.. Characterization of polar organic components in fine aerosols in the southeastern united states: Identity, origin, and evolution. J. Geophys. Res: Atmos. 2006, 111. 10.1029/2005JD006601. [DOI] [Google Scholar]
- Yang H.; Yu J. Z.; Ho S. S. H.; Xu J.; Wu W.-S.; Wan C. H.; Wang X.; Wang X.; Wang L. The chemical composition of inorganic and carbonaceous materials in pm2. 5 in nanjing, china. Atmos. Environ. 2005, 39, 3735–3749. 10.1016/j.atmosenv.2005.03.010. [DOI] [Google Scholar]
- Ho K.; Cao J.; Lee S.; Kawamura K.; Zhang R.; Chow J. C.; Watson J. G.. Dicarboxylic acids, ketocarboxylic acids, and dicarbonyls in the urban atmosphere of china. J. Geophys. Res: Atmos. 2007, 112. 10.1029/2006JD008011. [DOI] [Google Scholar]
- Pavuluri C. M.; Kawamura K.; Swaminathan T.. Water-soluble organic carbon, dicarboxylic acids, ketoacids, and α-dicarbonyls in the tropical indian aerosols. J. Geophys. Res: Atmos. 2010, 115. 10.1029/2009JD012661. [DOI] [Google Scholar]
- Lewandowski M.; Jaoui M.; Kleindienst T. E.; Offenberg J. H.; Edney E. O. Composition of pm2. 5 during the summer of 2003 in research triangle park, north carolina. Atmos. Environ. 2007, 41, 4073–4083. 10.1016/j.atmosenv.2007.01.012. [DOI] [Google Scholar]
- Gray Be A.; Upshur M. A.; Liu P.; Martin S. T.; Geiger F. M.; Thomson R. J. Cloud activation potentials for atmospheric α-pinene and β-caryophyllene ozonolysis products. acs cent. Sci. 2017, 3, 715–725. 10.1021/acscentsci.7b00112. [DOI] [PMC free article] [PubMed] [Google Scholar]
- Somasundaran P.; Healy T. W.; Fuerstenau D. Surfactant adsorption at the solid—liquid interface—dependence of mechanism on chain length. J. Phys. Chem. 1964, 68, 3562–3566. 10.1021/j100794a021. [DOI] [Google Scholar]
- Olkowska E.; Polkowska Z.; Namiesnik J. Analytics of surfactants in the environment: Problems and challenges. Chem. Rev. 2011, 111, 5667–5700. 10.1021/cr100107g. [DOI] [PubMed] [Google Scholar]
- Sukhapan J.; Brimblecombe P. Ionic surface active compounds in atmospheric aerosols. Sci. World J. 2002, 2, 1138–1146. 10.1100/tsw.2002.188. [DOI] [PMC free article] [PubMed] [Google Scholar]
- Radke M. Sterols and anionic surfactants in urban aerosol: Emissions from wastewater treatment plants in relation to background concentrations. Environ. Sci. Technol. 2005, 39, 4391–4397. 10.1021/es048084p. [DOI] [PubMed] [Google Scholar]
- Latif M. T.; Mohamad C. A. R.; Ali M. M.; Othman M. R.; Ramli N. I.; Hanif N. M. Concentration and flux of atmospheric surfactants from costal water. Environ. Monit. Assess. 2008, 105, 175_1Q1. [Google Scholar]
- Hanif N. M.; Latif M. T.; Ali M. M.; Othman M. R. Atmospheric surfactants around lake ecosystems. Eur. J. Sci. Res. 2009, 32, 268–276. [Google Scholar]
- Roslan R. N.; Hanif N. M.; Othman M. R.; Azmi W. N. F. W.; Yan X. X.; Ali M. M.; Mohamed C. A. R.; Latif M. T. Surfactants in the sea-surface microlayer and their contribution to atmospheric aerosols around coastal areas of the malaysian peninsula. Mar. Pollut. Bull. 2010, 60, 1584–1590. 10.1016/j.marpolbul.2010.04.004. [DOI] [PubMed] [Google Scholar]
- Becagli S.; Ghedini C.; Peeters S.; Rottiers A.; Traversi R.; Udisti R.; Chiari M.; Jalba A.; Despiau S.; Dayan U.; et al. Mbas (methylene blue active substances) and las (linear alkylbenzene sulphonates) in mediterranean coastal aerosols: Sources and transport processes. Atmos. Environ. 2011, 45, 6788–6801. 10.1016/j.atmosenv.2011.04.041. [DOI] [Google Scholar]
- Latif M. T.; Anuwar N. Y.; Srithawirat T.; Razak I. S.; Ramli N. A. Composition of levoglucosan and surfactants in atmospheric aerosols from biomass burning. Aerosol Air Qual. Res. 2011, 11, 837–845. 10.4209/aaqr.2010.12.0103. [DOI] [Google Scholar]
- Latif M. T.; Wanfi L.; Hanif N. M.; Roslan R. N.; Ali M. M.; Mushrifah I. Composition and distribution of surfactants around lake chini, malaysia. Environ. Monit. Assess. 2012, 184, 1325–1334. 10.1007/s10661-011-2043-5. [DOI] [PubMed] [Google Scholar]
- Mustaffa N. I. H.; Latif M. T.; Ali M. M. In Distribution of surfactants in sea-surface microlayer and atmospheric aerosols at selected coastal area of peninsular malaysia; AIP Conference Proceedings; American Institute of Physics: 2013; pp 625–631.
- Wahid N. B. A.; Latif M. T.; Suratman S. Composition and source apportionment of surfactants in atmospheric aerosols of urban and semi-urban areas in malaysia. Chemosphere 2013, 91, 1508–1516. 10.1016/j.chemosphere.2012.12.029. [DOI] [PubMed] [Google Scholar]
- Jaafar S. A.; Latif M. T.; Chian C. W.; Han W. S.; Abd Wahid N. B.; Razak I. S.; Khan M. F.; Tahir N. M. Surfactants in the sea-surface microlayer and atmospheric aerosol around the southern region of peninsular malaysia. Mar. Pollut. Bull. 2014, 84, 35–43. 10.1016/j.marpolbul.2014.05.047. [DOI] [PubMed] [Google Scholar]
- Mustaffa N. I. H.; Latif M. T.; Ali M. M.; Khan M. F. Source apportionment of surfactants in marine aerosols at different locations along the malacca straits. Environ. Sci. Pollut. Res. 2014, 21, 6590–6602. 10.1007/s11356-014-2562-z. [DOI] [PubMed] [Google Scholar]
- Razak I. S.; Latif M. T.; Jaafar S. A.; Khan M. F.; Mushrifah I. Surfactants in atmospheric aerosols and rainwater around lake ecosystem. Environ. Sci. Pollut. Res. 2015, 22, 6024–6033. 10.1007/s11356-014-3781-z. [DOI] [PubMed] [Google Scholar]
- Ahmed M.; Guo X.; Zhao X.-M. Determination and analysis of trace metals and surfactant in air particulate matter during biomass burning haze episode in malaysia. Atmos. Environ. 2016, 141, 219–229. 10.1016/j.atmosenv.2016.06.066. [DOI] [Google Scholar]
- Jaafar S. A.; Latif M. T.; Razak I. S.; Shaharudin M. Z.; Khan M. F.; Abd Wahid N. B.; Suratman S. Monsoonal variations in atmospheric surfactants at different coastal areas of the malaysian peninsula. Mar. Pollut. Bull. 2016, 109, 480–489. 10.1016/j.marpolbul.2016.05.017. [DOI] [PubMed] [Google Scholar]
- Wahid N.; Latif M.; Suratman S. Composition and possible sources of anionic surfactants from urban and semi-urban street dust. Air Qual Atmos Health 2017, 10, 1051–1057. 10.1007/s11869-017-0493-9. [DOI] [Google Scholar]
- Jaafar S. A.; Latif M. T.; Razak I. S.; Abd Wahid N. B.; Khan M. F.; Srithawirat T. Composition of carbohydrates, surfactants, major elements and anions in pm2. 5 during the 2013 southeast asia high pollution episode in malaysia. Particuology 2018, 37, 119–126. 10.1016/j.partic.2017.04.012. [DOI] [Google Scholar]
- Shaharom S.; Latif M. T.; Khan M. F.; Yusof S. N. M.; Sulong N. A.; Wahid N. B. A.; Uning R.; Suratman S. Surfactants in the sea surface microlayer, subsurface water and fine marine aerosols in different background coastal areas. Environ. Sci. Pollut. Res. 2018, 25, 27074–27089. 10.1007/s11356-018-2745-0. [DOI] [PubMed] [Google Scholar]
- Uning R.; Latif M. T.; Yu K. L.; Cheng S. Y.; Ahamad F.; Khan M. F.; Bedurus E. A.; Suratman S. Surfactants in the sea surface microlayer, underlying water and atmospheric particles of tropical coastal ecosystems. Water Air Soil Pollut. 2018, 229, 1–11. 10.1007/s11270-018-3961-4. [DOI] [Google Scholar]
- Razak H. A.; Wahid N. B. A.; Latif M. T. Anionic surfactants and traffic related emission from an urban area of perak, malaysia. Arch. Environ. Contam. Toxicol. 2019, 77, 587–593. 10.1007/s00244-019-00656-3. [DOI] [PubMed] [Google Scholar]
- Wahid A.; Bahiyah N.; Razak H. A.; Isa I. I. M.; Latif M. T.; Mohamad N.; Srithawirat T.; Dominick D.; Ramli S.; Abd Hamid N. Z.; et al. Methylene blue active substances (mbas) and linear alkylbenzene sulphonates (las) in urban and suburban atmospheric aerosol. Environ. Ecol. Res. 2021, 9, 159. 10.13189/eer.2021.090403. [DOI] [Google Scholar]
- Zhang Z.; Li H.; Liu H.; Bai Y.; Li J.; Zhi G.; Yu Y.; Li W.; Zhang H.; Meng F. A preliminary study on pollution characteristics of surfactant substances in fine particles in the beibu gulf region of china. J. Environ. Sci. 2021, 102, 363–372. 10.1016/j.jes.2020.08.008. [DOI] [PubMed] [Google Scholar]
- Uning R.; Suratman S.; Latif M. T.; Mustaffa N. I. H. Assessment on the distributions and exchange of anionic surfactants in the coastal environment of peninsular malaysia: A review. Environ. Sci. Pollut. Res. 2022, 29, 15380–15390. 10.1007/s11356-021-18395-1. [DOI] [PubMed] [Google Scholar]
- Frka S.; Dautovic J.; Kozarac Z.; Cosovic B.; Hoffer A.; Kiss G. Surface-active substances in atmospheric aerosol: An electrochemical approach. Tellus Ser. B-Chem. Phys. Meteorol. 2022, 64, 18490. 10.3402/tellusb.v64i0.18490. [DOI] [Google Scholar]
- Kroflič A.; Frka S.; Simmel M.; Wex H.; Grgić I. Size-resolved surface-active substances of atmospheric aerosol: Reconsideration of the impact on cloud droplet formation. Environ. Sci. Technol. 2018, 52, 9179–9187. 10.1021/acs.est.8b02381. [DOI] [PubMed] [Google Scholar]
- Nozière B.; Gérard V.; Baduel C.; Ferronato C. Extraction and characterization of surfactants from atmospheric aerosols. J. Vis. Exp. 2017, e55622 10.3791/55622. [DOI] [PMC free article] [PubMed] [Google Scholar]
- Frossard A. A.; Gérard V.; Duplessis P.; Kinsey J. D.; Lu X.; Zhu Y.; Bisgrove J.; Maben J. R.; Long M. S.; Chang R. Y.-W.; et al. Properties of seawater surfactants associated with primary marine aerosol particles produced by bursting bubbles at a model air-sea interface. Environ. Sci. Technol. 2019, 53, 9407–9417. 10.1021/acs.est.9b02637. [DOI] [PubMed] [Google Scholar]
- Kwaśniewska D.; Kiewlicz J. Spectroscopic and tensiometric considerations on anionic surfactants (sds) and ascorbic acid/ascorbates interactions. J. Saudi Chem. Soc. 2022, 26, 101532. 10.1016/j.jscs.2022.101532. [DOI] [Google Scholar]
- Kwaśniewska D.; Kiewlicz J. Study of interaction between cationic surfactant (ctab) and ascorbic acid/ascorbic acids derivatives by tensiometric and spectroscopic methods. J. Mol. Liq. 2022, 354, 118917. 10.1016/j.molliq.2022.118917. [DOI] [Google Scholar]
- Ruehl C. R.; Chuang P. Y.; Nenes A.; Cappa C. D.; Kolesar K. R.; Goldstein A. H. Strong evidence of surface tension reduction in microscopic aqueous droplets. Geophys. Res. Lett. 2012, 39, L23801. 10.1029/2012GL053706. [DOI] [Google Scholar]
- Ruehl C. R.; Wilson K. R. Surface organic monolayers control the hygroscopic growth of submicrometer particles at high relative humidity. J. Phys. Chem. A 2014, 118, 3952–3966. 10.1021/jp502844g. [DOI] [PubMed] [Google Scholar]
- Forestieri S. D.; Staudt S. M.; Kuborn T. M.; Faber K.; Ruehl C. R.; Bertram T. H.; Cappa C. D. Establishing the impact of model surfactants on cloud condensation nuclei activity of sea spray aerosol mimics. Atmos. Chem. Phys. 2018, 18, 10985–11005. 10.5194/acp-18-10985-2018. [DOI] [Google Scholar]
- Ebben C.; Martinez I.; Shrestha M.; Buchbinder A.; Corrigan A.; Guenther A.; Karl T.; Petäjä T.; Song W.; Zorn S.; et al. Contrasting organic aerosol particles from boreal and tropical forests during humppa-Copec-2010 and amaze-08 using coherent vibrational spectroscopy. Atmos. Chem. Phys. 2011, 11, 10317–10329. 10.5194/acp-11-10317-2011. [DOI] [Google Scholar]
- Wu Y.; Li W.; Xu B.; Li X.; Wang H.; McNeill V. F.; Rao Y.; Dai H.-L. Observation of organic molecules at the aerosol surface. J. Phys. Chem. Lett. 2016, 7, 2294–2297. 10.1021/acs.jpclett.6b00872. [DOI] [PubMed] [Google Scholar]
- Dusek U.; Frank G. P.; Hildebrandt L.; Curtius J.; Schneider J.; Walter S.; Chand D.; Drewnick F.; Hings S.; Jung D.; et al. Size matters more than chemistry for cloud-nucleating ability of aerosol particles. Science 2006, 312, 1375–1378. 10.1126/science.1125261. [DOI] [PubMed] [Google Scholar]
- Prisle N. L.; Asmi A.; Topping D.; Partanen A. I.; Romakkaniemi S.; Dal Maso M.; Kulmala M.; Laaksonen A.; Lehtinen K. E. J.; McFiggans G.; et al. Surfactant effects in global simulations of cloud droplet activation. Geophys. Res. Lett. 2012, 39. 10.1029/2011GL050467. [DOI] [Google Scholar]
- Lowe S. J.; Partridge D. G.; Davies J. F.; Wilson K. R.; Topping D.; Riipinen I. Key drivers of cloud response to surface-active organics. Nat. Commun. 2019, 10, 5214. 10.1038/s41467-019-12982-0. [DOI] [PMC free article] [PubMed] [Google Scholar]
- Davies J. F.; Zuend A.; Wilson K. R. Technical note: The role of evolving surface tension in the formation of cloud droplets. Atmos. Chem. Phys. 2019, 19, 2933–2946. 10.5194/acp-19-2933-2019. [DOI] [Google Scholar]
- Chatre C.Mesure de tension de surface de particules microniques et submicroniques: Application à la formation des nuages. Université de Lyon, 2021. [Google Scholar]
- Maria S. F.; Russell L. M.; Gilles M. K.; Myneni S. C. Organic aerosol growth mechanisms and their climate-forcing implications. Science 2004, 306, 1921–1924. 10.1126/science.1103491. [DOI] [PubMed] [Google Scholar]
- Pöhlker C.; Wiedemann K. T.; Sinha B.; Shiraiwa M.; Gunthe S. S.; Smith M.; Su H.; Artaxo P.; Chen Q.; Cheng Y.; et al. Biogenic potassium salt particles as seeds for secondary organic aerosol in the amazon. Science 2012, 337, 1075–1078. 10.1126/science.1223264. [DOI] [PubMed] [Google Scholar]
- Prisle N. L. Surfaces of atmospheric droplet models probed with synchrotron xps on a liquid microjet. Acc. Chem. Res. 2024, 57, 177–187. 10.1021/acs.accounts.3c00201. [DOI] [PMC free article] [PubMed] [Google Scholar]
- Renard P.; Canet I.; Sancelme M.; Matulova M.; Uhliarikova I.; Eyheraguibel B.; Nauton L.; Devemy J.; Traïkia M.; Malfreyt P. Cloud microorganisms, an interesting source of biosurfactants. Surfactants and detergents 2019, 1–17. 10.5772/intechopen.85621. [DOI] [Google Scholar]
- Vidal Valero M. Mexico is seeding clouds to make rain—scientists aren’t sure it works. Nature 2023, 617, 16–17. 10.1038/d41586-023-01038-5. [DOI] [PubMed] [Google Scholar]
- Quan J.; Zhang Q.; He H.; Liu J.; Huang M.; Jin H. Analysis of the formation of fog and haze in north china plain (ncp). Atmos. Chem. Phys. 2011, 11, 8205–8214. 10.5194/acp-11-8205-2011. [DOI] [Google Scholar]
- Lide D. R.CRC Handbook of Chemistry and Physics; CRC Press: 2004; Vol. 85. [Google Scholar]
- Granados K.; Gracia-Fadrique J.; Amigo A.; Bravo R. Refractive index, surface tension, and density of aqueous mixtures of carboxylic acids at 298.15 k. J. Chem. Eng. Data 2006, 51, 1356–1360. 10.1021/je060084c. [DOI] [Google Scholar]
- Álvarez E.; Vázquez G.; Sánchez-Vilas M.; Sanjurjo B.; Navaza J. M. Surface tension of organic acids+ water binary mixtures from 20 c to 50 c. J. Chem. Eng. Data 1997, 42, 957–960. 10.1021/je970025m. [DOI] [Google Scholar]
- Suárez F.; Romero C. M. Apparent molar volume and surface tension of dilute aqueous solutions of carboxylic acids. J. Chem. Eng. Data 2011, 56, 1778–1786. 10.1021/je1002829. [DOI] [Google Scholar]
- Booth A. M.; Topping D. O.; McFiggans G.; Percival C. J. Surface tension of mixed inorganic and dicarboxylic acid aqueous solutions at 298.15 k and their importance for cloud activation predictions. Phys. Chem. Chem. Phys. 2009, 11, 8021–8028. 10.1039/b906849j. [DOI] [PubMed] [Google Scholar]
- Varga Z.; Kiss G.; Hansson H. C. Modelling the cloud condensation nucleus activity of organic acids on the basis of surface tension and osmolality measurements. Atmos. Chem. Phys. 2007, 7, 4601–4611. 10.5194/acp-7-4601-2007. [DOI] [Google Scholar]
- Mahiuddin S.; Minofar B.; Borah J. M.; Das M. R.; Jungwirth P. Propensities of oxalic, citric, succinic, and maleic acids for the aqueous solution/vapour interface: Surface tension measurements and molecular dynamics simulations. Chem. Phys. Lett. 2008, 462, 217–221. 10.1016/j.cplett.2008.07.085. [DOI] [Google Scholar]
- Allen H. C.; Raymond E. A.; Richmond G. L. Surface structural studies of methanesulfonic acid at air /aqueous solution interfaces using vibrational sum frequency spectroscopy†. J. Phys. Chem. A 2001, 105, 1649–1655. 10.1021/jp0032964. [DOI] [Google Scholar]
- Hoppel W. A. Nucleation in the msa water-vapor system. Atmos. Environ. 1987, 21, 2703–2709. 10.1016/0004-6981(87)90202-2. [DOI] [Google Scholar]
- Lunkenheimer K.; Barzyk W.; Hirte R.; Rudert R. Adsorption properties of soluble, surface-chemically pure n-alkanoic acids at the air/water interface and the relationship to insoluble monolayer and crystal structure properties. Langmuir 2003, 19, 6140–6150. 10.1021/la034379p. [DOI] [Google Scholar]
- Werner J.; Dalirian M.; Walz M. M.; Ekholm V.; Wideqvist U.; Lowe S. J.; Ohrwall G.; Persson I.; Riipinen I.; Bjorneholm O. Surface partitioning in organic-inorganic mixtures contributes to the size-dependence of the phase-state of atmospheric nanoparticles. Environ. Sci. Technol. 2016, 50, 7434–7442. 10.1021/acs.est.6b00789. [DOI] [PubMed] [Google Scholar]
- Gaman A. I.; Kulmala M.; Vehkamäki H.; Napari I.; Mircea M.; Facchini M. C.; Laaksonen A. Binary homogeneous nucleation in water-succinic acid and water-glutaric acid systems. J. Chem. Phys. 2004, 120, 282–291. 10.1063/1.1630564. [DOI] [PubMed] [Google Scholar]
- Dynarowicz P. Surface properties of para-alkylbenzoic acids and para-alkylphenols adsorbed at the water/air interface. Colloids Surf. A Physicochem. Eng. Asp. 1994, 92, 249–253. 10.1016/0927-7757(94)02957-1. [DOI] [Google Scholar]
- Skauge A.; Spitzer J. J. Surface tensions and micellization of co-cyclohexylalkanoic acids and their sodium salts. J. Phys. Chem. 1983 1983, 87, 2398–2401. 10.1021/j100236a031. [DOI] [Google Scholar]
- Glinski J.; Chavepeyer G.; Platten J. K. Adsorption of heptanol, heptanoic acid, and heptanoate anions at water-air interfaces. J. Colloid Interface Sci. 1996, 180, 290–292. 10.1006/jcis.1996.0302. [DOI] [Google Scholar]
- Boyer H. C.; Dutcher C. S. Statistical thermodynamic model for surface tension of aqueous organic acids with consideration of partial dissociation. J. Phys. Chem. A 2016, 120, 4368–4375. 10.1021/acs.jpca.6b01469. [DOI] [PubMed] [Google Scholar]
- Boyer H. C.; Bzdek B. R.; Reid J. P.; Dutcher C. S. Statistical thermodynamic model for surface tension of organic and inorganic aqueous mixtures. J. Phys. Chem. A 2017, 121, 198–205. 10.1021/acs.jpca.6b10057. [DOI] [PubMed] [Google Scholar]
- Riipinen I.; Koponen I. K.; Frank G. P.; Hyvaerinen A. P.; Vanhanen J.; Lihavainen H.; Lehtinen K. E. J.; Bilde M.; Kulmala M. Adipic and malonic acid aqueous solutions: Surface tensions and saturation vapor pressures. J. Phys. Chem. A 2007, 111, 12995–13002. 10.1021/jp073731v. [DOI] [PubMed] [Google Scholar]
- Fu H.; Ciuraru R.; Dupart Y.; Passananti M.; Tinel L.; Rossignol S. p.; Perrier S.; Donaldson D. J.; Chen J.; George C. Photosensitized production of atmospherically reactive organic compounds at the air/aqueous interface. J. Am. Chem. Soc. 2015, 137, 8348–8351. 10.1021/jacs.5b04051. [DOI] [PMC free article] [PubMed] [Google Scholar]
- Badban S.; Hyde A. E.; Phan C. M. Hydrophilicity of nonanoic acid and its conjugate base at the air/water interface. ACS Omega 2017, 2, 5565–5573. 10.1021/acsomega.7b00960. [DOI] [PMC free article] [PubMed] [Google Scholar]
- Casandra A.; Lin Y. C.; Liggieri L.; Ravera F.; Tsay R. Y.; Lin S. Y. Adsorption kinetics of the ionic surfactant decanoic acid. Int. J. Heat Mass Transfer 2016, 102, 36–44. 10.1016/j.ijheatmasstransfer.2016.05.130. [DOI] [Google Scholar]
- Zarska M.; Dzida M.; Apelblat A. Surface tensions and densities of concentrated aqueous solutions of citric acid. J. Mol. Liq. 2017, 228, 91–95. 10.1016/j.molliq.2016.07.019. [DOI] [Google Scholar]
- Prosser A. J.; Retter U.; Lunkenheimer K. On the adsorption kinetics of surface-chemically pure n-dodecanoic acid at the air/water interface. Langmuir 2004, 20, 2720–2725. 10.1021/la035732u. [DOI] [PubMed] [Google Scholar]
- Chumpitaz L. D.; Coutinho L. F.; Meirelles A. J. Surface tension of fatty acids and triglycerides. J. Am. Oil Chem. Soc. 1999, 76, 379–382. 10.1007/s11746-999-0245-6. [DOI] [Google Scholar]
- Kallio T.; Laine J.; Stenius P. Intermolecular interactions and the adhesion of oleic acid. J. Dispers. Sci. Technol. 2009, 30, 222–230. 10.1080/01932690802500719. [DOI] [Google Scholar]
- Theander K.; Pugh R. J. The influence of ph and temperature on the equilibrium and dynamic surface tension of aqueous solutions of sodium oleate. J. Colloid Interface Sci. 2001, 239, 209–216. 10.1006/jcis.2000.7543. [DOI] [PubMed] [Google Scholar]
- Pugh R.; Stenius P. Solution chemistry studies and flotation behaviour of apatite, calcite and fluorite minerals with sodium oleate collector. Int. J. Miner. Process. 1985, 15, 193–218. 10.1016/0301-7516(85)90035-3. [DOI] [Google Scholar]
- Yehia A.; Abd El-Halim S.; Sharada H.; Khalek M. A.; Ammar M. Interactions of cellulase and oleic acid solution mixtures. Tenside Surfactants Deterg. 2016, 53, 176–181. 10.3139/113.110423. [DOI] [Google Scholar]
- Atrafi A.; Pawlik M. Surface tension and gas dispersion properties of fatty acid solutions. Miner. Eng. 2016, 85, 138–147. 10.1016/j.mineng.2015.11.006. [DOI] [Google Scholar]
- Knothe G.; Dunn R. O.; Bagby M. O. Surface tension studies on novel allylic mono and dihydroxy fatty compounds. A method to distinguish erythro/threo diastereomers. JAOCS 1995, 72, 43–47. 10.1007/BF02635777. [DOI] [Google Scholar]
- Yokoyama S.; Obata J.; Jujie T.; Nakagaki M. Effect of temperature on the surface properties of aqueous-solutions of arachidonic-acid. Chem. Pharm. Bull. 1993, 41, 6–11. 10.1248/cpb.41.6. [DOI] [Google Scholar]
- Li Z.; Schwier A. N.; Sareen N.; McNeill V. F. Reactive processing of formaldehyde and acetaldehyde in aqueous aerosol mimics: Surface tension depression and secondary organic products. Atmos. Chem. Phys. 2011, 11, 11617–11629. 10.5194/acp-11-11617-2011. [DOI] [Google Scholar]
- Vazquez G.; Alvarez E.; Navaza J. M. Surface tension of alcohol water+ water from 20 to 50. Degree. C. J. Chem. Eng. Data 1995, 40, 611–614. 10.1021/je00019a016. [DOI] [Google Scholar]
- Gliński J.; Chavepeyer G.; Platten J.-K.; Smet P. Surface properties of diluted aqueous solutions of normal short-chained alcohols. J. Chem. Phys. 1998, 109, 5050–5053. 10.1063/1.477118. [DOI] [Google Scholar]
- Belda Maximino R. Surface tension and density of binary mixtures of monoalcohols, water and acetonitrile: Equation of correlation of the surface tension. Phys. Chem. Liquids 2009, 47, 475–486. 10.1080/00319100802241657. [DOI] [Google Scholar]
- Semenov I. A.; Pokrovskaya M. A.. Estimating the parameters of γ-models for binary mixtures from surface tension data. In Theoretical foundations of chemical engineering; Pleiades Publishing, Ltd., 2014. [Google Scholar]
- Basařová P.; Váchová T.; Bartovská L. Atypical wetting behaviour of alcohol-water mixtures on hydrophobic surfaces. Colloids Surf. A Physicochem. Eng. Asp. 2016, 489, 200–206. 10.1016/j.colsurfa.2015.10.023. [DOI] [Google Scholar]
- Ernst R.; Watkins C.; Ruwe H. The physical properties of the ternary system ethyl alcohol-glycerin-water. J. Phys. Chem. 1936, 40, 627–635. 10.1021/j150374a008. [DOI] [Google Scholar]
- Khattab I. S.; Bandarkar F.; Fakhree M. A. A.; Jouyban A. Density, viscosity, and surface tension of water+ ethanol mixtures from 293 to 323k. Korean J. Chem. Eng. 2012, 29, 812–817. 10.1007/s11814-011-0239-6. [DOI] [Google Scholar]
- Toryanik A. I.; Porebnyak V. G. Surface-tension of aqueous-solutions of acetone. J. Struct. Chem. 1977, 17, 464–465. 10.1007/BF00746671. [DOI] [Google Scholar]
- Enders S.; Kahl H.; Winkelmann J. Surface tension of the ternary system water plus acetone plus toluene. J. Chem. Eng. Data 2007, 52, 1072–1079. 10.1021/je7000182. [DOI] [Google Scholar]
- Howard K. S.; McAllister R. A. Surface tension of acetone-water solutions up to their normal boiling points. AIChE J. 1957, 3, 325–329. 10.1002/aic.690030308. [DOI] [Google Scholar]
- Wu N.; Li X.; Liu S.; Zhang M.; Ouyang S. Effect of hydrogen bonding on the surface tension properties of binary mixture (acetone-water) by raman spectroscopy. Appl. Sci. 2019, 9, 1235. 10.3390/app9061235. [DOI] [Google Scholar]
- Messow U.; Braeuer P.; Schmidt A.; Bilke-Krause C.; Quitzsch K.; Zilles U. Calculation of adsorption isotherms on hard solid surfaces using measurements of surface tensions and contact angles. Adsorption 1998, 4, 257–267. 10.1023/A:1008833700390. [DOI] [Google Scholar]
- Romero C. M.; Paéz M. S. Surface tension of aqueous solutions of alcohol and polyols at 298.15 k. Phys. Chem. Liquids 2006, 44, 61–65. 10.1080/01421590500315360. [DOI] [Google Scholar]
- Nakanishi K.; Matsumoto T.; Hayatsu M. Surface tension of aqueous solutions of some glycols. J. Chem. Eng. Data 1971, 16, 44–45. 10.1021/je60048a010. [DOI] [Google Scholar]
- Hoke B. C. Jr; Patton E. F. Surface tensions of propylene glycol+ water. J. Chem. Eng. Data 1992, 37, 331–333. 10.1021/je00007a016. [DOI] [Google Scholar]
- Romero C. M.; Jiménez E.; Suárez F. Effect of temperature on the behavior of surface properties of alcohols in aqueous solution. J. Chem. Thermodyn. 2009, 41, 513–516. 10.1016/j.jct.2008.11.004. [DOI] [Google Scholar]
- Takamura K.; Fischer H.; Morrow N. R. Physical properties of aqueous glycerol solutions. J. Pet. Sci. Eng. 2012, 98, 50–60. 10.1016/j.petrol.2012.09.003. [DOI] [Google Scholar]
- Le T.; Phan C.; Ang H. M. Influence of hydrophobic tail on the adsorption of isomeric alcohols at air/water interface. Asia-Pacific Journal of Chemical Engineering 2012, 7, 250–255. 10.1002/apj.527. [DOI] [Google Scholar]
- Gliński J.; Chavepeyer G.; Platten J.-K. Untypical surface properties of aqueous solutions of 1, 5-pentanediol. Colloids Surf. A Physicochem. Eng. Asp. 2000, 162, 233–238. 10.1016/S0927-7757(99)00207-1. [DOI] [Google Scholar]
- Romero C.; Páez M. S.; Miranda J. A.; Hernández D. J.; Oviedo L. E. Effect of temperature on the surface tension of diluted aqueous solutions of 1, 2-hexanediol, 1, 5-hexanediol, 1, 6-hexanediol and 2, 5-hexanediol. Fluid Phase Equilib. 2007, 258, 67–72. 10.1016/j.fluid.2007.05.029. [DOI] [Google Scholar]
- Hommelen J. R. The elimination of errors due to evaporation of the solute in the determination of surface tensions. J. Colloid Sci. 1959, 14, 385–400. 10.1016/0095-8522(59)90003-0. [DOI] [Google Scholar]
- Chakraborty G.; Paulchowdhury M.; Bardhan S.; Saha S. K. Surface activity and modifying effects of 1-naphthol, 2-naphthol and 2, 3-dihydroxynaphthalene on self-assembled nanostructures of 1-hexadecyl-3-methylimidazolium chloride. Colloids Surf. A Physicochem. Eng. Asp. 2017, 516, 262–273. 10.1016/j.colsurfa.2016.12.025. [DOI] [Google Scholar]
- Vazquez G.; Alvarez E.; Navaza J. M.; Rendo R.; Romero E. Surface tension of binary mixtures of water plus monoethanolamine and water plus 2-amino-2-methyl-1-propanol and tertiary mixtures of these amines with water from 25 degrees c to 50 degrees c. J. Chem. Eng. Data 1997, 42, 57–59. 10.1021/je960238w. [DOI] [Google Scholar]
- Idris Z.; Han J.; Jayarathna S.; Eimer D. A. Surface tension of alkanolamine solutions: An experimentally based review. Energy Procedia 2017, 114, 1828–1833. 10.1016/j.egypro.2017.03.1310. [DOI] [Google Scholar]
- Jasper J. J. The surface tension of pure liquid compounds. J. Phys. Chem. Ref. Data 1972, 1, 841–1010. 10.1063/1.3253106. [DOI] [Google Scholar]
- Gomez-Diaz D.; Navaza J. M. Surface behavior of aqueous solutions of pyrrolidine and piperidine. J. Chem. Eng. Data 2004, 49, 1406–1409. 10.1021/je049888n. [DOI] [Google Scholar]
- Chandra A.; Patidar V.; Singh M.; Kale R. K. Physicochemical and friccohesity study of glycine, l-alanine and l-phenylalanine with aqueous methyltrioctylammonium and cetylpyridinium chloride from t = (293.15 to 308.15) k. J. Chem. Thermodyn. 2013, 65, 18–28. 10.1016/j.jct.2013.05.037. [DOI] [Google Scholar]
- Rodriguez D. M.; Romero C. M. Surface tension of glycine, alanine, aminobutyric acid, norvaline, and norleucine in water and in aqueous solutions of strong electrolytes at temperatures from (293.15 to 313.15) k. J. Chem. Eng. Data 2017, 62, 3687–3696. 10.1021/acs.jced.7b00433. [DOI] [Google Scholar]
- Alvarez E.; Cancela A.; Maceiras R.; Navaza J. M.; Taboas R. Surface tension of aqueous binary mixtures of 1-amino-2-propanol and 3-amino-1-propanol, and aqueous ternary mixtures of these amines with diethanolamine, triethanolamine, and 2-amino-2-methyl-1-propanol from (298.15 to 323.15) k. J. Chem. Eng. Data 2003, 48, 32–35. 10.1021/je020048n. [DOI] [Google Scholar]
- Alvarez E.; Gomez-Diaz D.; La Rubia M. D.; Navaza J. M. Surface tension of aqueous binary mixtures of 2-(methylamino)ethanol and 2-(ethylamino)ethanol and aqueous ternary mixtures of these amines with triethanolamine or n-methyldiethanolamine from (293.15 to 323.15) k. J. Chem. Eng. Data 2008, 53, 318–321. 10.1021/je700536m. [DOI] [Google Scholar]
- Venkat A.; Kumar G.; Kundu M. Density and surface tension of aqueous solutions of (2-(methylamino)-ethanol+2-amino-2-methyl-1-propanol) and (2-(methylamino)-ethanol plus n-methyl-diethanolamine) from (298.15 to 323.15) k. J. Chem. Eng. Data 2010, 55, 4580–4585. 10.1021/je1002626. [DOI] [Google Scholar]
- Blanco A.; García-Abuín A.; Gómez-Díaz D.; Navaza J. M. Density, speed of sound, viscosity, and surface tension of dimethylethylenediamine+ water and (ethanolamine+ dimethylethanolamine)+ water from t = (293.15 to 323.15) k. J. Chem. Eng. Data 2016, 61, 188–194. 10.1021/acs.jced.5b00447. [DOI] [Google Scholar]
- Cadena J. C.; Romero C. M. Effect of temperature on the surface properties of α, ω-amino acids in dilute aqueous solutions. J. Therm. Anal. Calorim. 2016, 126, 1615–1619. 10.1007/s10973-016-5723-0. [DOI] [Google Scholar]
- Maham Y.; Mather A. E. Surface thermodynamics of aqueous solutions of alkylethanolamines. Fluid Phase Equilib. 2001, 182, 325–336. 10.1016/S0378-3812(01)00391-0. [DOI] [Google Scholar]
- Yokoyama S.; Fujino Y.; Kondo M.; Fujie T. Self-association of cyclohexylamine in water. Chem. Pharm. Bull. 1995, 43, 1055–1056. 10.1248/cpb.43.1055. [DOI] [Google Scholar]
- Wang L. M.; Tian X. F.; Fang C.; Huang H.; Fu D.; Quan Y. H. Analysis of surface thermodynamics for amino acid ionic liquid-1-dimethylannino-2-propanol aqueous blends. J. Chem. Eng. Data 2019, 64, 3661–3667. 10.1021/acs.jced.9b00511. [DOI] [Google Scholar]
- Vazquez G.; Alvarez E.; Rendo R.; Romero E.; Navaza J. M. Surface tension of aqueous solutions of diethanolamine and triethanolamine from 25 degrees c to 50 degrees c. J. Chem. Eng. Data 1996, 41, 806–808. 10.1021/je960012t. [DOI] [Google Scholar]
- Rinker E. B.; Oelschlager D. W.; Colussi A. T.; Henry K. R.; Sandall O. C. Viscosity, density, and surface tension of binary mixtures of water and n-methyldiethanolamine and water and diethanolamine and tertiary mixtures of these amines with water over the temperature range 20–100 ″c. J. Chem. Eng. Data 1994, 39, 392–395. 10.1021/je00014a046. [DOI] [Google Scholar]
- Aguila-Hernandez J.; Trejo A.; Gracia-Fadrique J. Surface tension of aqueous solutions of alkanolamines: Single amines, blended amines and systems with nonionic surfactants. Fluid Phase Equilib. 2001, 185, 165–175. 10.1016/S0378-3812(01)00467-8. [DOI] [Google Scholar]
- Alvarez E.; Rendo R.; Sanjurjo B.; Sanchez-Vilas M.; Navaza J. M. Surface tension of binary mixtures of water plus n-methyldiethanolamine and ternary mixtures of this amine and water with monoethanolamine, diethanolamine, and 2-amino-2-methyl-1-propanol from 25 to 50 degrees c. J. Chem. Eng. Data 1998, 43, 1027–1029. 10.1021/je980106y. [DOI] [Google Scholar]
- Aguila-Hernandez J.; Trejo A.; Garcia-Flores B. E. Surface tension and foam behaviour of aqueous solutions of blends of three alkanolamines, as a function of temperature. Colloids Surf. A Physicochem. Eng. Asp. 2007, 308, 33–46. 10.1016/j.colsurfa.2007.05.026. [DOI] [Google Scholar]
- Yoon S. J.; Lee H. S.; Lee H.; Baek J. I.; Yoon J. H.; Eum H. M. Densities, viscosities, and surface tensions of aqueous 2-amino-2-ethyl-1,3-propanediol solutions. J. Chem. Eng. Data 2002, 47, 30–32. 10.1021/je010196y. [DOI] [Google Scholar]
- Murshid G.; Shariff A. M.; Lau K. K.; Bustam M. A.; Ahmad F. Physical properties and thermal decomposition of aqueous solutions of 2-amino-2-hydroxymethyl-1, 3-propanediol (ahpd). Int. J. Thermophys. 2011, 32, 2040–2049. 10.1007/s10765-011-1065-0. [DOI] [Google Scholar]
- Romero C. M.; Albis A. Influence of polyols and glucose on the surface tension of bovine α-lactalbumin in aqueous solution. J. Sol. Chem. 2010, 39, 1865–1876. 10.1007/s10953-010-9554-5. [DOI] [Google Scholar]
- Glinski J.; Chavepeyer G.; Platten J. K. Surface properties of aqueous solutions of l-leucine. Biophys. Chem. 2000, 84, 99–103. 10.1016/S0301-4622(99)00150-7. [DOI] [PubMed] [Google Scholar]
- Matubayasi N.; Matsuyama S.; Akizuki R. Surface properties of aqueous amino acid solutions - ii. Leucine-leucine hydrochloride and leucine-sodium leucinate mixtures. J. Colloid Interface Sci. 2005, 288, 402–406. 10.1016/j.jcis.2005.03.046. [DOI] [PubMed] [Google Scholar]
- Gómez-Díaz D.; Navaza J. M.; Rumbo A. Density, speed of sound, viscosity, and surface tension of hexamethylenetetramine aqueous solutions from t = (293.15 to 323.15) k. J. Chem. Eng. Data 2018, 63, 3846–3850. 10.1021/acs.jced.8b00492. [DOI] [Google Scholar]
- Lee J. Y.; Hildemann L. M. Surface tension of solutions containing dicarboxylic acids with ammonium sulfate, d-glucose, or humic acid. J. Aerosol Sci. 2013, 64, 94–102. 10.1016/j.jaerosci.2013.06.004. [DOI] [Google Scholar]
- Persson C. M.; Jonsson A. P.; Bergström M.; Eriksson J. C. Testing the gouy-chapman theory by means of surface tension measurements for sds-nacl-h2o mixtures. J. Colloid Interface Sci. 2003, 267, 151–154. 10.1016/S0021-9797(03)00761-6. [DOI] [PubMed] [Google Scholar]
- Zdziennicka A.; Szymczyk K.; Krawczyk J.; Jańczuk B. Activity and thermodynamic parameters of some surfactants adsorption at the water-air interface. Fluid Phase Equilib. 2012, 318, 25–33. 10.1016/j.fluid.2012.01.014. [DOI] [Google Scholar]
- Chauhan S.; Sharma V.; Sharma K. Maltodextrin-sds interactions: Volumetric, viscometric and surface tension study. Fluid Phase Equilib. 2013, 354, 236–244. 10.1016/j.fluid.2013.06.051. [DOI] [Google Scholar]
- Petkova B.; Tcholakova S.; Chenkova M.; Golemanov K.; Denkov N.; Thorley D.; Stoyanov S. Foamability of aqueous solutions: Role of surfactant type and concentration. Adv. Colloid Interface Sci. 2020, 276, 102084. 10.1016/j.cis.2019.102084. [DOI] [PubMed] [Google Scholar]
- Asnacios A.; Langevin D.; Argillier J. Mixed monolayers of cationic surfactants and anionic polymers at the air-water interface: Surface tension and ellipsometry studies. Eur. Phys. J. B 1998, 5, 905–911. 10.1007/s100510050516. [DOI] [Google Scholar]
- Ritacco H.; Kurlat D.; Langevin D. Properties of aqueous solutions of polyelectrolytes and surfactants of opposite charge: Surface tension, surface rheology, and electrical birefringence studies. J. Phys. Chem. B 2003, 107, 9146–9158. 10.1021/jp034033n. [DOI] [Google Scholar]
- Shah S. K.; Chatterjee S. K.; Bhattarai A. The effect of methanol on the micellar properties of dodecyltrimethylammonium bromide (dtab) in aqueous medium at different temperatures. J. Surfactants Deterg. 2016, 19, 201–207. 10.1007/s11743-015-1755-x. [DOI] [Google Scholar]
- Sachin K.; Karpe S.; Singh M.; Bhattarai A. In Physicochemical properties of dodecyltrimethylammonium bromide (dtab) and sodiumdodecyl sulphate (sds) rich surfactants in aqueous medium, at t= 293.15, 298.15, and 303.15 k; Macromolecular Symposia; Wiley Online Library, 2018; p 1700034. [Google Scholar]
- Adamczyk Z.; Para G.; Warszyński P. Influence of ionic strength on surface tension of cetyltrimethylammonium bromide. Langmuir 1999, 15, 8383–8387. 10.1021/la990241o. [DOI] [Google Scholar]
- Lundqvist H.; Eliasson A.-C.; Olofsson G. Binding of hexadecyltrimethylammonium bromide to starch polysaccharides. Part i. Surface tension measurements. Carbohydr. Polym. 2002, 49, 43–55. 10.1016/S0144-8617(01)00299-5. [DOI] [Google Scholar]
- Bhattarai A.; Chatterjee S. K.; Jha K. Density and partial molar volume of cetyltrimethylammonium bromide in the presence and absence of kcl and nacl in aqueous media at room temperature. Phys. Chem. 2015, 5, 1–5. 10.5923/j.pc.20150501.01. [DOI] [Google Scholar]
- Pedrosa A. B.; Briz J. I.; Velázquez M. M. Effect of additives on the adsorption of sodium bis(2-ethyl hexyl sulfosuccinate) at the air-water interface studied by equilibrium and dynamic surface tension measurements. J. Surfactants Deterg. 2002, 5, 397–402. 10.1007/s11743-002-0239-4. [DOI] [Google Scholar]
- Yuan S.; Xu G.; Luan Y.; Liu C. The interaction between polymer and aot or nadehp in aqueous solution: Mesoscopic simulation study and surface tension measurement. Colloids Surf. A Physicochem. Eng. Asp. 2005, 256, 43–50. 10.1016/j.colsurfa.2004.09.038. [DOI] [Google Scholar]
- Xie L.-L. Thermodynamics of aot micelle formation in ethylammonium nitrate. J. Dispers. Sci. Technol. 2009, 30, 100–103. 10.1080/01932690802483536. [DOI] [Google Scholar]
- Krawczyk J.Wetting properties of the sodium bis (2-ethylhexyl) sulfosuccinate (aot) and polyoxyethylene (23) lauryl ether (brij 35) binary mixtures in the poly (tetrafluoroethylene)-solution-air system. Ann. Univ. Mariae Curie-Sklodowska Sect. AA 2015, 70. 10.1515/umcschem-2015-0010. [DOI] [Google Scholar]
- Okamura S.; Aono K.; Yokoyama M.; Shiba H.; Suzuki F.; Okano T.; Iimura K.-i. Influence of dialkyl chains of sulfosuccinate sodium salt surfactant on interfacial tension between hydrophobic material and water. Colloids Surf. A Physicochem. Eng. Asp. 2024, 681, 132770. 10.1016/j.colsurfa.2023.132770. [DOI] [Google Scholar]
- Amararene A.; Gindre M.; Le Huérou J.-Y.; Urbach W.; Valdez D.; Waks M. Adiabatic compressibility of aot [sodium bis (2-ethylhexyl) sulfosuccinate] reverse micelles: Analysis of a simple model based on micellar size and volumetric measurements. Phys. Rev. E 2000, 61, 682. 10.1103/PhysRevE.61.682. [DOI] [PubMed] [Google Scholar]
- Singh M.; Orsenigo J. R.; Shah D. O. Surface tension and contact angle of herbicide solutions affected by surfactants. J. Am. Oil Chem. Soc. 1984, 61, 596–600. 10.1007/BF02677040. [DOI] [Google Scholar]
- Schulze H.-U.; Kannler R.; Junker B. Latency studies on rat liver microsomal glucose-6-phosphatase. Correlation of membrane modification and solubilization by triton x-114 with the enzymatic activity. Biochim. Biophys. Acta Biomembr. 1985, 814, 85–95. 10.1016/0005-2736(85)90422-5. [DOI] [PubMed] [Google Scholar]
- Sidim T. Some physicochemical properties of octylphenol ethoxylate nonionics (triton x-100, triton x-114 and triton x-405) and the temperature effect on these properties. Trak. Univ. J. Nat. Sci. 2016, 13, 101–116. [Google Scholar]
- Guo D.-S.; Li X.-B.; Zhang H.-N.; Li F.-C.; Ming P.-J.; Oishi M.; Oshima M. Experimental study on the characteristics of temperature dependent surface/interfacial properties of a non-ionic surfactant aqueous solution at quasi-thermal equilibrium condition. Int. J. Heat Mass Transfer 2022, 182, 122003. 10.1016/j.ijheatmasstransfer.2021.122003. [DOI] [Google Scholar]
- Tripathi S.; Brown D. G. Effects of linear alkylbenzene sulfonate on the sorption of brij 30 and brij 35 onto aquifer sand. Environ. Sci. Technol. 2008, 42, 1492–1498. 10.1021/es0720964. [DOI] [PubMed] [Google Scholar]
- Pisaev I. V.; Soboleva O. A.; Ivanova N. I. Adsorption of brij 35-dodecylpyridinium bromide mixtures at air-aqueous solution and Teflon-aqueous solution interfaces. Colloid J. 2009, 71, 246–251. 10.1134/S1061933X09020148. [DOI] [Google Scholar]
- Ozan M.; Göktürk S. Effect of ionic liquids as active pharmaceutical ingredients on the micellar binding of an amphiphilic drug trifluopromazine hydrochloride. J. Dispers. Sci. Technol. 2021, 42, 214–222. 10.1080/01932691.2019.1674154. [DOI] [Google Scholar]
- Parra J.; Guinea J.; Manresa M.; Robert M.; Mercade M.; Comelles F.; Bosch M. Chemical characterization and physicochemical behavior of biosurfactants. J. Am. Oil Chem. Soc. 1989, 66, 141–145. 10.1007/BF02661805. [DOI] [Google Scholar]
- Mańko D.; Zdziennicka A.; Jańczuk B. Thermodynamic properties of rhamnolipid micellization and adsorption. Colloids Surf., B 2014, 119, 22–29. 10.1016/j.colsurfb.2014.04.020. [DOI] [PubMed] [Google Scholar]
- Abdel-Mawgoud A. M.; Aboulwafa M. M.; Hassouna N. A.-H. Characterization of surfactin produced by bacillus subtilis isolate bs5. Appl. Biochem. Biotechnol. 2008, 150, 289–303. 10.1007/s12010-008-8153-z. [DOI] [PubMed] [Google Scholar]
- Razafindralambo H.; Thonart P.; Paquox M. Dynamic and equilibrium surface tensions of surfactin aqueous solutions. J. Surfactants Deterg. 2004, 7, 41–46. 10.1007/s11743-004-0286-x. [DOI] [Google Scholar]
- Long X.; He N.; He Y.; Jiang J.; Wu T. Biosurfactant surfactin with ph-regulated emulsification activity for efficient oil separation when used as emulsifier. Bioresour. Technol. 2017, 241, 200–206. 10.1016/j.biortech.2017.05.120. [DOI] [PubMed] [Google Scholar]
- De Bruijn I.; De Kock M. J.; Yang M.; De Waard P.; Van Beek T. A.; Raaijmakers J. M. Genome-based discovery, structure prediction and functional analysis of cyclic lipopeptide antibiotics in pseudomonas species. Mol. Microbiol. 2007, 63, 417–428. 10.1111/j.1365-2958.2006.05525.x. [DOI] [PubMed] [Google Scholar]
- Saini H. S.; Barragán-Huerta B. E.; Lebrón-Paler A.; Pemberton J. E.; Vázquez R. R.; Burns A. M.; Marron M. T.; Seliga C. J.; Gunatilaka A. L.; Maier R. M. Efficient purification of the biosurfactant viscosin from pseudomonas libanensis strain m9–3 and its physicochemical and biological properties. J. Nat. Prod. 2008, 71, 1011–1015. 10.1021/np800069u. [DOI] [PubMed] [Google Scholar]
- Mäkelä J.; Manninen P.. Molecular size distribution and structure investigations of humic substances in groundwater; Working Report 2008-36; Posiva Oy, 2008.
- Klavins M.; Purmalis O. Humic substances as surfactants. Environ. Chem. Lett. 2010, 8, 349–354. 10.1007/s10311-009-0232-z. [DOI] [Google Scholar]
- Rehman Z. U.; Vrouwenvelder J. S.; Saikaly P. E. Physicochemical properties of extracellular polymeric substances produced by three bacterial isolates from biofouled reverse osmosis membranes. Front. Microbiol. 2021, 12, 668761. 10.3389/fmicb.2021.668761. [DOI] [PMC free article] [PubMed] [Google Scholar]
- Hitzenberger R.; Berner A.; Kasper-Giebl A.; Löflund M.; Puxbaum H. Surface tension of rax cloud water and its relation to the concentration of organic material. J. Geophys. Res: Atmos. 2002, 107, AAC 5-1–AAC 5-6. 10.1029/2002JD002506. [DOI] [Google Scholar]
Associated Data
This section collects any data citations, data availability statements, or supplementary materials included in this article.