Abstract
mRNA‐based therapy has emerged as the most promising nucleic acid therapy in the fight against COVID‐19. However, a safe and efficacious systemic delivery remains a challenge for mRNA therapy. Lipid nanoparticles (LNPs) are currently widely used in mRNA delivery vehicles. Here, a series of ionizable LNPs is rationally designed. YK009‐LNP is an optimal delivery platform to carry mRNA. YK009‐LNP exhibits higher mRNA delivery efficiency, a more favorable biodistribution pattern, and better safety than the approved MC3‐LNP. In addition, mRNA encoding severe acute respiratory syndrome coronavirus 2 Omicron receptor binding domain protein is synthesized and intramuscular administration of mice with YK009‐LNP‐Omicron mRNA induces a robust immune response and immune protective effect. A novel mRNA delivery vehicle with more powerful delivery efficiency and better safety than the approved LNPs is provided here.
Keywords: ionizable lipids, lipid nanoparticles, mRNA delivery, mRNA vaccines, SARS‐CoV‐2 Omicron variant
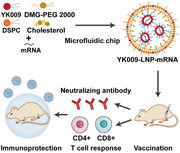
A novel ionizable lipid YK009 is developed for lipid nanoparticles (LNP) formulation. YK009, DSPC, cholesterol, and DMG‐PEG 2000 are mixed with mRNA by a microfluidic‐based procedure to form YK009‐LNP‐mRNA. The YK009‐LNP‐SARS‐CoV‐2 Omicron mRNA vaccine could trigger a robust humoral immune response and cellular immune response and immune protection against the SARS‐CoV‐2 Omicron variant in mice.
1. Introduction
Coronavirus disease 2019 (COVID‐19) is caused by severe acute respiratory syndrome coronavirus 2 (SARS‐CoV‐2).[ 1 ] Since the outbreak in 2019, the ongoing epidemic has thrived throughout the world and caused ≈18.2 million global excess deaths in the past 2 years.[ 2 ] Moreover, with the development of the COVID‐19 pandemic, variants with highly viral transmissibility, infectivity, and immune escapability have appeared and brought new waves of infection, the most severe of which is the Omicron variant. Currently, Omicron is the predominantly circulating strain in the world.[ 3 ] Therefore, there is an urgent need to develop an effective vaccine to prevent SARS‐CoV‐2 Omicron infection. The mRNA vaccines have recently launched a new era in vaccinology. In the race for vaccines against SARS‐CoV‐2, mRNA vaccines have been developed at warp speed and have been rapidly approved for use.[ 4 ] Compared with other types of vaccines, the mRNA vaccine has many advantages, such as biocompatibility, lack of toxicity, and potent immunogenicity.[ 5 ] However, mRNA therapy is still lacking a safe and effective delivery system. Because mRNA is large (104–106 Da) and negatively charged, it cannot pass through the anionic lipid bilayer of cell membranes.[ 6 ] Moreover, mRNA is susceptible to degradation by enzymes in vivo and in vitro. These features limit the application of mRNA. Therefore, in addition to modifying mRNA to increase its stability, it is necessary to develop an efficient and safe vehicle.[ 6a ]
Several innovative delivery systems have been developed, such as lipid nanoparticles (LNPs), liposomes, lipid polycomplexes, polymer materials, micelles, polypeptides, and protamine.[ 6 , 7 ] Among these, lipid nanoparticles have become one of the most appealing and commonly used nucleic acid‐based drug delivery tools.[ 8 ] In 2018, small interference RNAs (siRNAs) formulated in LNPs were approved by the Food and Drug Administration for the treatment of polyneuropathies resulting from the hereditary disease transthyretin‐mediated amyloidosis (hATTR),[ 9 ] and recently, two authorized COVID‐19 vaccines, mRNA‐1273 and BNT162b21, also used LNPs for delivery.[ 10 ] However, adverse reactions caused by LNPs have been reported, such as pain, fever, fatigue, and inflammation.[ 11 ] Thus, developing a novel LNP delivery vehicle with the desired efficacy and better safety is urgently needed.
In addition to the negatively charged mRNA, the LNPs generally have four other components: ionizable phospholipids, neutral auxiliary phospholipids, cholesterol, and polyethylene glycol‐modified phospholipids.[ 6a ] Each component is required for an efficient delivery of the mRNA cargo and the stability of particles. Ionizable lipids are the critical components of LNPs,[ 12 ] determining mRNA delivery, cellular uptake, endosomal escape, toxicity, and reactogenicity.[ 12 , 13 ] Thus, the rational design of ionizable lipids could improve cellular uptake and endosomal escape, thus improving the delivery efficacy of mRNA with little compromise on the safety of LNP‐mRNA.[ 14 ] Herein, we rationally designed a series of novel ionizable lipids (YK001–YK011) and an optimized formulation YK009‐LNP was selected using toxicity and expression in vitro as criteria. The optimized LNP showed high mRNA delivery efficiency, optimal tissue clearance, and good safety and stability in further studies. Next, the mRNA based on the receptor binding domain (RBD) protein of the Omicron variant was designed and synthesized to test the efficacy of the novel ionizable lipid LNP as an mRNA vaccine carrier (Figure 1 ). Comparisons of YK009‐LNP‐mRNA and commercial MC3‐LNP‐mRNA showed that YK009‐LNP‐mRNA vaccines had good biodistribution patterns, favorable tissue clearance, and high delivery efficiency. Furthermore, our study proved that YK009‐LNP‐Omicron mRNA could trigger a robust immune response and immune protection against the SARS‐CoV‐2 Omicron variant.
Figure 1.
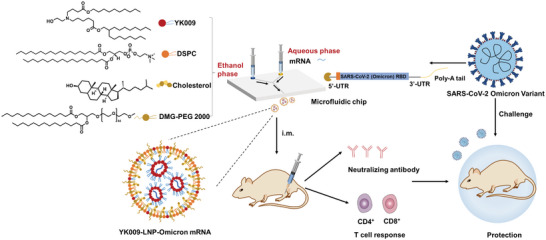
Schematic illustration of YK009‐LNP‐Omicron mRNA vaccine against SARS‐CoV‐2 Omicron variant. A) YK009‐LNP‐Omicron mRNA was prepared by mixing liposoluble alkaline lipids and mRNA acid aqueous solution through a microfluidic system. B) Mice were immunized via intramuscular (i.m.) administration with YK009‐LNP‐Omicron mRNA vaccines. YK009‐LNP‐Omicron mRNA vaccines induce neutralizing antibody and T cell response in mice. C) YK009‐LNP‐Omicron mRNA vaccines provide protection against SARS‐CoV‐2 Omicron variant.
2. Results and Discussion
2.1. Synthesis of Novel Ionizable Lipids and Construction of LNP‐mRNA
In this study, we designed and synthesized 11 novel ionizable lipids with the same tertiary amine headgroups modified with a terminal hydroxyl group, different ester bond position, and two branched saturated tails with different lengths (Figure 2A). The synthesis details of the novel ionizable lipids are provided in Schemes S1–S11 in the Supporting Information. The reaction products were obtained via silica gel column chromatography, and 1H NMR and mass spectrometry confirmed the structures of these ionizable lipids (Figures S1–S11, Supporting Information). LNPs‐mRNA was prepared by mixing liposoluble alkaline lipids and mRNA acid aqueous solution through a microfluidic system. Then, dynamic light scattering (DLS) was used to determine the particle size. The average particle size was about 90–140 nm (Figure 2B).
Figure 2.
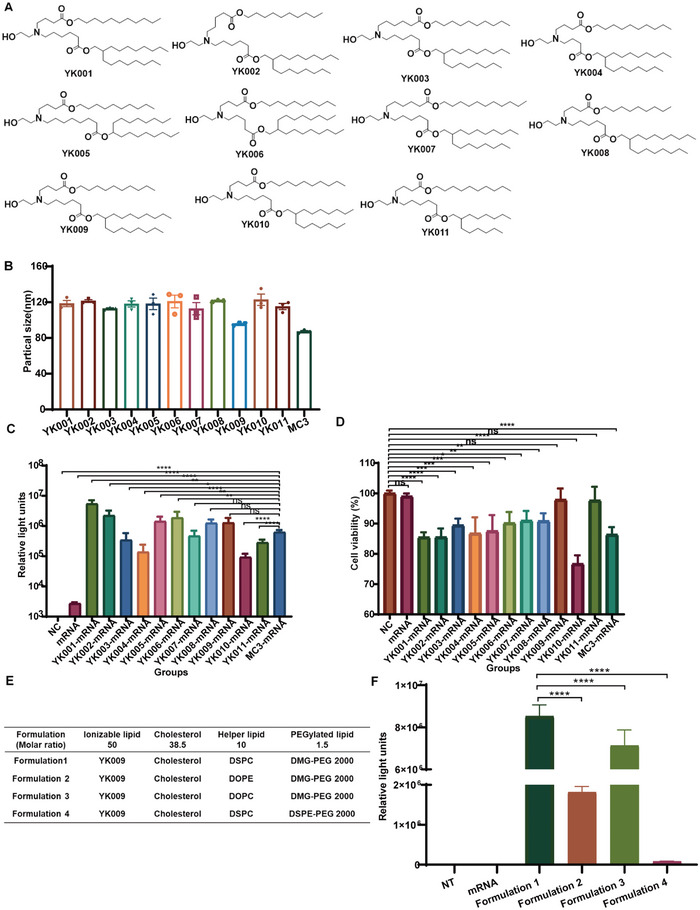
Characterization and formulation screening of LNPs‐mRNA. A) Chemical structure of 11 ionizable lipids. B) Particle size of LNPs‐mRNA. C) Relative luciferase expression of HEK‐293T cells after incubation with LNPs‐Fluc mRNA for 24 h. D) Cell viability of HEK‐293T cells after incubation with LNPs‐Fluc mRNA for 24 h. E) Formulations of LNPs with different helper phospholipids (1,2‐distearoyl‐sn‐glycero‐3‐phosphocholine (DSPC), 1,2‐dioleoyl‐sn‐glycero‐3‐phosphoethanolamine (DOPE), and 1,2‐dioleoyl‐sn‐glycero‐3‐phosphatidylcholine (DOPC)) and PEGylated lipids (1,2‐dimyristoyl‐rac‐glycero‐3‐methoxypolyethylene glycol 2000 (DMG‐PEG 2000) and 1,2‐distearoyl‐sn‐glycero‐3‐phosphoethanolamine‐N‐[methoxy(polyethylene glycol)‐2000] (DSPE‐PEG 2000)). F) Relative luciferase expression of HEK‐293T cells after transfection with different LNP‐Fluc mRNA formulations. Statistical significance was calculated using one‐way ANOVA (Analysis of Variance), and data are shown as mean ± SEM. (ns: no significant difference, *P < 0.05, **P < 0.01, ***P < 0.001, ****P < 0.0001).
2.2. In Vitro LNP‐mRNA Delivery Screening
In the initial screening, we evaluated the in vitro delivery efficacy and cytotoxicity of YK001‐YK011‐LNP formulations, containing YK001‐YK011, DSPC, cholesterol, and DMG‐PEG 2000. MC3‐LNP formulation was used as positive control. In HEK‐293T cells, firefly luciferase mRNA (Fluc‐mRNA) delivery with YK001‐LNP, YK002‐LNP, YK005‐LNP, YK006‐LNP, YK008‐LNP, and YK009‐LNP resulted in more intense bioluminescence as compared with MC3‐LNP (Figure 2C). Furthermore, of the above 11 LNPs, the YK009‐LNP‐mRNA and YK011‐LNP mRNA lipid treatments showed lower cytotoxicity (Figure 2D). Based on the preliminary results, we chose the YK009‐LNP for further research because of its relatively high Fluc‐mRNA delivery efficacy and low cytotoxicity. Next, we further optimized the formulation of YK009‐LNP, including helper phosphocholine and PEGylated lipid, to improve the delivery efficacy (Figure 2E). According to the luminescence intensity (Figure 2F), the Formulation 1 was chosen for further studies.
2.3. In Vivo Delivery and Biodistribution of YK009‐LNP‐Fluc mRNA
The biodistribution and delivery capability of YK009‐LNP mRNA in mice were evaluated by in vivo imaging. First, the YK009‐LNP‐Fluc mRNA (mRNA = 10 µg) was prepared and inoculated in mice via different inoculation routes. After intramuscular injection, robust bioluminescent signals were detected in the injection site of mice at 3 h postinjection, while subcutaneous and intradermal injection led to weaker bioluminescent signals in mice (Figure 3A,B). Then, whole‐body imaging of the intramuscularly immunized mice was performed at different time points using an imaging system. As shown in Figure 3C,D, Fluc‐mRNA delivery in vivo with YK009‐LNP demonstrated superior bioluminescent signals compared with MC3‐LNP and the average photon flux peaked at 3 h postinjection. Remarkably, the bioluminescent signal of mice in the YK009‐LNP groups was still detected 72 h postinoculation, thus guaranteeing the in vivo expression of YK009‐LNP‐mRNA. To more accurately analyze the biodistribution of YK009‐LNP‐Fluc mRNA in major tissues, we isolated tissues of mice after living imaging of scheduled time to ex vivo imaging. As shown in Figure 3E, the bioluminescence accumulated in the liver, spleen, and muscle tissues. Then, we quantified the signals of liver, spleen, and muscle tissues at different times. As in the live imaging, the average photon flux of tissues peaked at 3 h postinjection. Among these, the signal intensity of muscle tissues was the most robust, while that of the liver was the weakest (Figure 3F).
Figure 3.
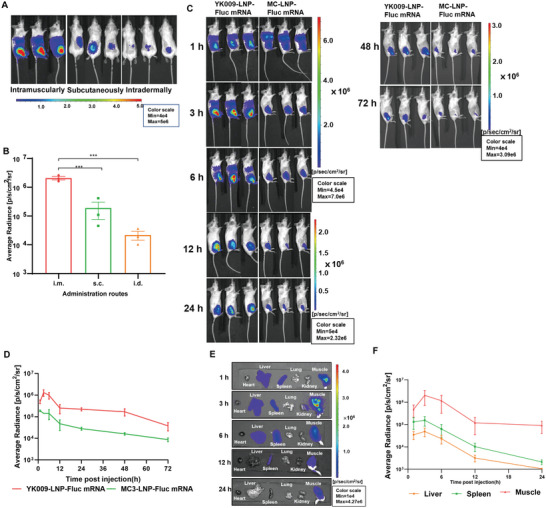
In vivo delivery and biodistribution of YK009‐LNP‐Fluc mRNA. A) Bioluminescent image of female BALB/c mice injected with YK009‐LNP‐Fluc mRNA (mRNA = 10 µg) by different administration routes. B) Quantified average luminescence of injection sites after 3 h. C) Female BALB/c mice were injected with YK009‐LNP‐Fluc mRNA and MC3‐LNP‐Fluc mRNA via an intramuscular route and subjected to bioluminescent imaging at the indicated time points. D) Quantified average luminescence of the muscles site. E) Bioluminescent imaging of representative tissues at scheduled time points. F) Quantified average luminescence of the tissues. Statistical significance was calculated using one‐way ANOVA and error bars is shown as SEM (n = 3, ***P < 0.001).
The liver accumulating effect and low elimination rate of LNP‐mRNA may lead to the activation of liver‐resident cells that subsequently cause tissue damage and inflammation, thus contributing to high reactogenicity.[ 15 ] Remarkably, ex vivo imaging of the YK009‐LNP‐Fluc mRNA group showed that the average photon flux of the liver faded, becoming hardly detectable at 12 h, and the average bioluminescent signal of the muscles and spleen was higher than that of the liver. According to the reported study of commercial MC3‐LNP, signals were largely detected in the liver and still showed high levels of liver expression at 24 h.[ 16 ] In comparison with MC3‐LNP‐mRNA, intramuscular administration of YK009‐LNP‐mRNA revealed a much faster elimination rate for the liver, and YK009‐LNP‐mRNA primarily accumulated at the site of injection and spleen. The skeletal muscle contains abundant dendritic cells, macrophages, and other immune cells and the spleen is the largest secondary lymphoid organ and hosts a wide range of immunologic functions.[ 15 , 17 ] This favorable biodistribution pattern may alleviate the toxicity of the liver and explain the outstanding mRNA vaccine efficacy.
2.4. Synthesis of Omicron mRNA and Characterization of YK009‐LNP‐Omicron mRNA
mRNA based on the RBD protein of the Omicron variant was designed and synthesized and was authenticated by Agilent 2100 bioanalysis (Figure 4A). Then YK009, DSPC, cholesterol, and DMG‐PEG 2000 interacted with Omicron mRNA by a microfluidic‐based procedure to form LNP. According to the DLS data, the YK009‐LNP‐Omicron mRNA showed an average particle size of about 93.2 ± 3.5 nm, with a PDI(Polydispersity Index) of 0.12 ± 0.1. The average surface zeta potential was about 0.9 ± 0.6 mV at neutral pH (Figure 4B). According to the morphologic images (Figure 4C), the YK009‐LNP‐Omicron mRNA showed a spherical shape with a diameter of ≈100 nm. In addition, the encapsulation efficiency was recorded as high as 95%. The pK a value is crucial for efficient nucleic acid delivery and determines nanoparticle ionization behavior, high lipid pK a value (> 5.5) is an important molecular characteristic and is the main factor in the escape behavior of LNP from endosomes in cells.[ 10 , 18 ] The pK a value of YK009‐LNP‐Omicron mRNA was found to be 6.512 (Figure 4D), which is in the optimum range for developing highly efficient nanoparticles for RNA delivery (between 6 and 7).[ 10b ]
Figure 4.
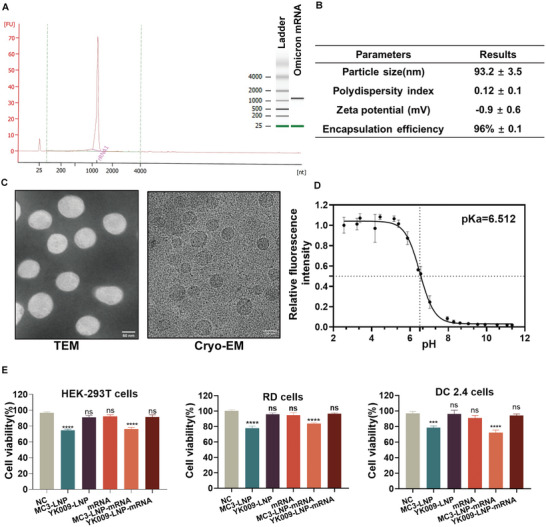
Characterization and cytotoxicity of YK009‐LNP‐Omicron mRNA. A) Bioanalysis of Omicron mRNA. B) Physicochemical parameters of YK009‐LNP‐Omicron mRNA. Physicochemical property characterization includes particle size, polydispersity index, Zeta potential, and encapsulation efficiency. C) Transmission electron microscopy image (scale bar = 50 nm) and cryo‐electron microscopy image (scale bar = 100 nm) of YK009‐LNP‐Omicron mRNA. D) pK a of YK009‐LNP‐Omicron mRNA was determined by TNS assay (n = 3). E) Cell viability of HEK‐293T, RD, and DC 2.4 cells after transfection with MC3‐LNP, YK009‐LNP, mRNA, MC3‐LNP‐Omicron mRNA, and YK009‐LNP‐Omicron mRNA (mRNA = 1 µg) for 24 h. Significance was calculated by one‐way ANOVA and data are presented as mean ± SEM.
2.5. Cytotoxicity of YK009‐LNP‐Omicron mRNA
The cytotoxicity of YK009‐LNP‐Omicron mRNA was evaluated in HEK‐293T, RD, and DC 2.4 cells. As shown in Figure 4E, after the transfection of Omicron mRNA, YK009‐LNP, and YK009‐LNP‐Omicron mRNA, the cell viabilities of the three lines showed no significant difference compared with the untreated cells. By comparison, the cell viability of commercialized MC3‐LNP and MC3‐LNP‐Omicron mRNA showed reductions in cell viability. Therefore, YK009‐based LNP showed a safety advantage in the three distinct cell lines.
2.6. Internalization Behavior and Protein Expression of YK009‐LNP‐Omicron mRNA In Vitro
Achieving high cellular delivery efficiency and endosomal escape is essential for mRNA delivery. Therefore, first, the MFP‐488‐labeled YK009‐LNP‐Omicron mRNA was transfected into HEK‐293T, RD, and DC 2.4 cells to examine the cellular uptake. As shown in Figure 5A, the cellular uptake of the three cell lines increased over time and the cellular uptake of HEK‐293T, DC 2.4, and RD cells peaked respectively at 6, 6, and 3 h post‐transfection. These results indicate that mRNA enter the cytosol successfully. We next compared the cellular uptake efficacy of YK009‐LNP‐Omicron mRNA with MC‐LNP‐Omicron mRNA in HEK‐293T cells. As illustrated in Figure S12 in the Supporting Information, the cellular uptake efficacy of YK009‐LNP‐Omicron mRNA is higher than the MC3‐LNP‐Omicron mRNA treated cells.
Figure 5.
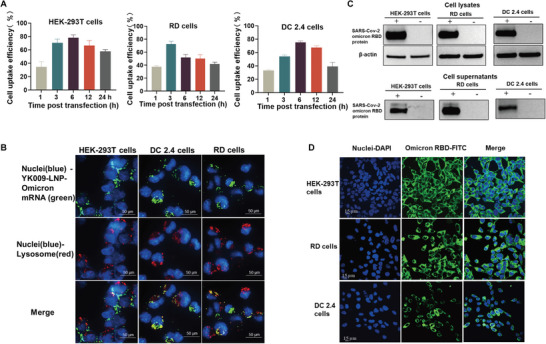
Internalization behavior and protein expression of YK009‐LNP‐Omicron mRNA in vitro. A) Cellular uptake of YK009‐LNP‐MFP488‐labeled Omicron mRNA by HEK‐293T cells, RD cells, and DC 2.4 cells at the indicated time. B) Images of HEK‐293T, RD cells, and DC 2.4 cells after transfection with YK009‐LNP‐Omicron mRNA. C) Western blot assay of the SARS‐CoV‐2 Omicron RBD expression from cell lysates and supernatants. D) Indirect immunofluorescence assay of the SARS‐CoV‐2 Omicron RBD expression. Data are shown as mean ± SEM.
Then, the mechanisms of internalization of YK009‐LNP‐Omicron mRNA were studied by treating cells with several endocytosis pathway inhibitors. The targets and action mechanisms of these inhibitors were detailed in Figure S13A in the Supporting Information. As shown in Figure S13B in the Supporting Information, the cellular uptake of cells treated with Amiloride, Pimozide, and Cytochalasin D did not show inhibition, while different levels of inhibition were observed in cells treated with Genistein, Chlorpromazine, Dynasore, and Nocodazole, which suggested that YK009‐LNP‐Omicron mRNA are internalized probably mainly via clathrin‐ and caveolae‐mediated endocytosis.
Furthermore, to investigate whether the mRNA reached the lysosomes and escaped from lysosomes, the MFP‐488 fluorescently labeled YK009‐LNP‐mRNA was added to the HEK‐293T, DC 2.4, and RD cells, then the cells were cultured for 6 h, and afterwards, the cell lysosome and cell nuclei were stained with Lysotracker red and Hoechst 33342, respectively. The images (Figure 5B) taken by Operetta CLS High Content System showed that the YK009‐LNP encapsulated MFP488‐mRNA (green) was widely distributed in the cytoplasm and coexisted with lysosomes (red), which suggested that the YK009‐LNP‐mRNA could efficiently escape lysosomes. We next quantified the lysosome escape rate of YK009‐LNP‐mRNA and MC3‐LNP‐mRNA in HEK‐293T cells by Pearson colocalization analyses. As shown in Figure S14A,B in the Supporting Information, the Pearson's correlation coefficient of MC3‐LNP‐mRNA is higher than YK‐009‐LNP‐mRNA, which suggested that the lysosomal escape efficiency of YK009‐LNP‐mRNA is better than MC3‐LNP‐mRNA in cells.
Then, we evaluated the YK009‐LNP‐Omicron mRNA expression in vitro. YK009‐LNP‐Omicron mRNA was transfected into HEK‐293T, RD, and DC2.4 cells, and the expression of SARS‐CoV‐2 Omicron RBD protein was detected by Western blot and Immunofluorescence. RBD was successfully expressed on these cells and excreted into cell supernatants (Figure 5C). According to the fluorescent images, the YK009‐LNP‐Omicron mRNA was expressed in the cells (Figure 5D). These results revealed that YK009‐LNP could effectively encapsulate Omicron mRNA and successfully deliver it into the cells to express the antigen protein.
2.7. Stability of YK009‐LNP‐Omicron mRNA
To examine the stability of the YK009‐LNP‐Omicron mRNA formulation, the YK009‐LNP‐Omicron mRNA formulation was stored at 4 °C for 4 weeks to characterize its stability by monitoring several parameters. Particle size, PDI, and encapsulation efficiency remained consistent for 4 weeks (Figure 6A). In addition, the translation efficiency of YK009‐LNP‐Omicron mRNA following storage at 4 °C for 2 and 4 weeks was evaluated. The Omicron RBD was produced effectively and secreted into the supernatant of HEK‐293T cells (Figure 6B,C). These data indicated that the YK009‐LNP‐Omicron mRNA formulation has good stability at 4 °C.
Figure 6.
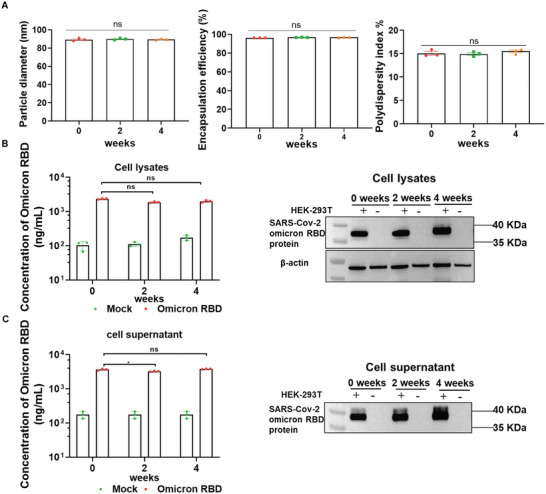
Stability of YK009‐LNP‐mRNA. A) Time‐dependent changes in particles, polydispersity index, and encapsulation efficiency of YK009‐LNP‐Omicron mRNA upon storage at 4 °C. B) Western blot assay and ELISA assay detected the SARS‐CoV‐2 Omicron RBD expression from cell lysates. C) Western blot assay and ELISA assay detected the SARS‐CoV‐2 Omicron RBD expression from cell supernatants. Significance was calculated by two‐way ANOVA and data are presented as mean ± SEM (ns: no significant difference, *P < 0.05).
2.8. Immunogenicity and Immunoprotective Effect of YK009‐LNP‐Omicron mRNA
The immune responses induced by the YK009‐LNP‐Omicron mRNA vaccines were evaluated in female BALB/c mice. Immunocompetent mice were immunized with different doses of YK009‐LNP‐Omicron mRNA (Omicron mRNA = 2 or 10 µg) (Figure 7A). Enzyme‐linked immunosorbent assay (ELISA) and pseudovirus neutralization assay were used to detect the IgG titers and neutralizing antibody titers (NT50) to evaluate the humoral immune response (Figure 7B,C). The vaccine elicited a significant increase in Omicron RBD‐specific IgG antibody levels 10 d after the initial immunization, the IgG antibody titers in mice immunized with 2 or 10 µg of YK009‐LNP‐Omicron mRNA approached ≈1/4960 and ≈1/10 000, respectively. Remarkably, after boost immunization with the same dose, the serum IgG antibody levels rapidly increased and the endpoint titers of high and low doses rose to > 105. Similarly, neutralizing antibody titers also remarkably increased after boost immunization; the NT50 in mice immunized with 2 or 10 µg of YK009‐LNP‐Omicron mRNA approached ≈1/63 648 and ≈1/89 124, respectively. Then we compared the immunogenicity effect of YK009‐LNP‐Omicron mRNA and MC3‐LNP‐Omicron M in high dose (mRNA = 10 µg). As expected, the specific IgG titers and NT50 of groups YK009‐LNP‐Omicron mRNA was higher than that of MC3‐LNP‐Omicron mRNA (Figure S15, Supporting Information). Our results demonstrated that two doses of YK009‐LNP‐Omicron mRNA vaccines had induced a strong humoral immune response in mice.
Figure 7.
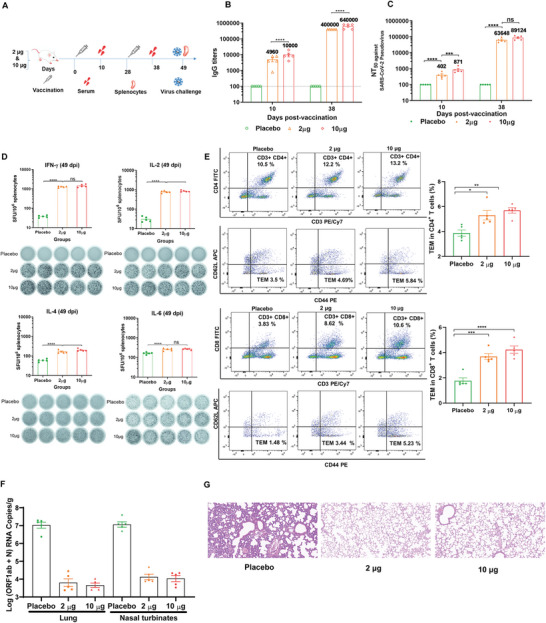
In vivo immunogenicity and immunoprotection efficacy of YK009‐LNP‐Omicron mRNA. A) Schedule diagram of immunization, sera and spleen collection, and virus challenge. B) ELISA measured the SARS‐CoV‐2 Omicron‐RBD‐specific IgG titers. Significance was calculated by two‐way ANOVA and error bars represent the SEM (n = 5, ****P < 0.0001). C) Neutralization antibody was detected by pseudovirus neutralization assay. Significance was calculated by two‐way ANOVA and error bars represent the SEM (n = 5, ns: no significant difference, ***P < 0.001, ****P < 0.0001). D) ELISpot analysis was performed to detect IFN‐γ, IL‐2, IL‐4, and IL‐6 release among splenocytes after in vivo stimulation with SARS‐CoV‐2 peptide pools. One‐way ANOVA was used to calculate significance and error bars represent the SEM (n = 5, ns: no significant difference, ***P < 0.001, ****P < 0.0001). E) Flow cytometry was performed to detect SARS‐CoV‐2 Omicron RBD‐specific CD4+ and CD8+ effector memory T cells in splenocytes. F) RT‐PCR detected viral RNA loads in the lungs and nasal turbinate of challenged mice. Significance was calculated by one‐way ANOVA and error bars represent the SEM (n = 4, ****P < 0.0001). G) Histopathology of lungs in challenged mice (scale bar = 50 µm).
As T cell immunity is crucial for robust antivirus infection, we further studied whether SARS‐CoV‐2 RBD‐specific T cell immune response was evoked by two doses of YK009‐LNP‐Omicron mRNA immunization. Enzyme‐linked immunosorbent spot (ELISpot) assay demonstrated that secretion of interferon gamma (IFN‐γ) and interleukin 2 (IL‐2) from immunized mice was significantly higher than in the placebo group. Meanwhile, there was no remarkable increase in IL‐4 and IL‐6 secretion compared with mice treated with placebo (Figure 7D). Flow cytometry results showed that the specific CD4+ and CD8+ effector memory T cells (Tem) significantly increased in splenocytes from vaccinated mice (Figure 7E). Therefore, our vaccine could successfully induce Omicron RBD‐specific T cells and Th1‐biased specific cellular immune response in mice. This result was consistent with reported research, which was about the type of T cellular responses induced by SARS‐CoV‐2 mRNA vaccines.[ 19 ]
To further evaluate the in vivo immunoprotective effect, mice vaccinated with 2 or 10 µg of YK009‐LNP‐mRNA received SARS‐CoV‐2 Omicron variant challenge. On day 3 after the challenge, viral RNA load and lung lesions were evaluated by real time PCR (RT‐PCR) assay and histopathology examination, respectively. As shown in Figure 7F, only a trace amount of viral RNA was detected in the lungs and nasal turbinate of vaccinated mice, with a 3–4 magnitude reduction than placebo group. And lung tissues of vaccinated mice exhibited no pathological changes. In contrast, a intrapulmonary hemolysis, and diffuse inflammatory cell infiltration were observed in the lungs of the mice in the placebo groups (Figure 7G). These results demonstrated that two doses of YK009‐LNP‐Omicron mRNA vaccination remarkably prevented the SARS‐CoV‐2 Omicron variant replication in the lungs and nasal turbinate and protected mice from Omicron variant.
2.9. Safety of YK009‐LNP‐Omicron mRNA In Vivo
To further evaluate the safety of YK009‐LNP‐Omicron mRNA in mice, we monitored the changes of three biochemical parameters in vaccinated mice, namely, biochemical indexes, cytokines, and tissue histology. First, we evaluated the biochemical blood indexes to determine whether our YK009‐LNP‐Omicron mRNA vaccination caused liver and kidney toxicity and found that all parameters were within the normal level, and there was no observable toxicity (Figure 8A). Then, the major organs, including the heart, liver, spleen, lungs, and kidneys, were collected from the mice treated with placebo, YK009‐LNP, MC3‐LNP, YK009‐LNP‐Omicron mRNA, and MC3‐LNP‐Omicron mRNA, for histopathological examination, and no obvious pathologic changes were observed (Figure 8B). Finally, the level of several important cytokines, including interleukin 1beta (IL 1β), tumor necrosis factor‐alpha, interleukin 6 (IL‐6), interleukin 4 (IL‐4), and IFN‐γ were measured in the vaccinated mice (Figure 8C). At 6 h after injection, in contrast to the placebo‐treated groups, the inflammatory cytokine levels in the empty and Omicron mRNA‐loaded LNP groups were slightly higher. Remarkably, at 48 h after injection, the levels of some inflammatory cytokines of the empty and Omicron mRNA‐loaded YK009‐LNP groups were equal to or lower than that of the placebo group, while the level of cytokines in the empty and Omicron mRNA‐loaded MC3‐LNP groups was still higher than that of in the placebo groups. These data demonstrated the safety of YK009‐LNP‐mRNA in mice.
Figure 8.
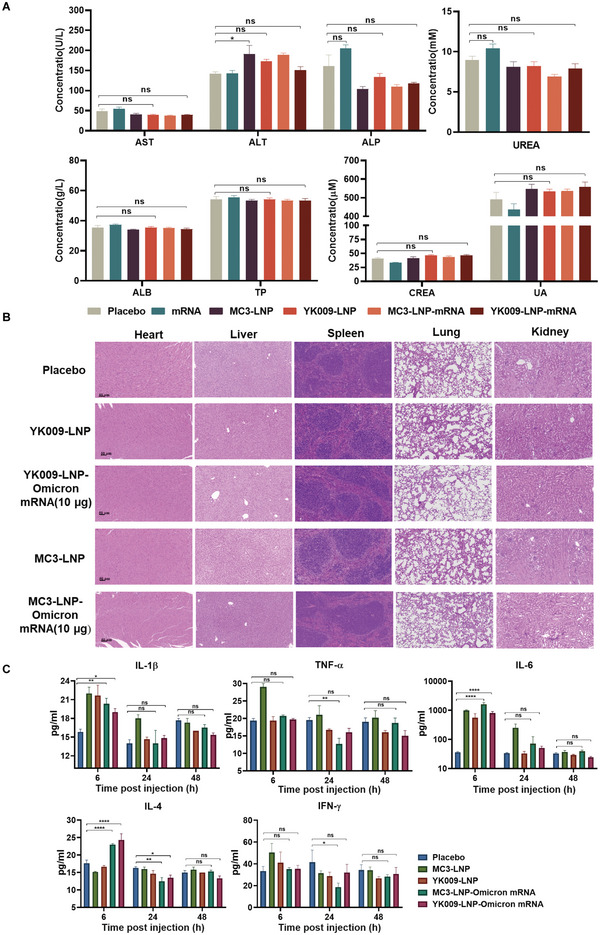
In vivo safety evaluation of LNP formulations. A) Serum level of aspartate transaminase (AST), alanine transaminase (ALT), alkaline phosphatase (ALP), UREA, albumin (ALB), total protein (TP), creatinine (CREA), and uric acid (UA) in female BALB/c mice that were vaccinated with placebo, Omicron mRNA, MC3‐LNP, YK009‐LNP, MC3‐LNP‐Omicron mRNA, or YK009‐LNP‐Omicron mRNA (mRNA = 10 µg) after 24 h. Significance was calculated by one‐way ANOVA and data are presented as mean ± SEM (n = 6, ns: no significant difference, *P < 0.05, **P < 0.01). B) Histopathological examination (H&E) of the heart, liver, spleen, lungs, and kidneys at 48 h postinjection with placebo, MC3‐LNP, YK009‐LNP, MC3‐LNP‐Omicron mRNA, and YK009‐LNP‐Omicron mRNA (mRNA = 10 µg). C) Cytokines in the serum at 6, 24, and 48 h postinjection. Statistical significance was calculated by a two‐way ANOVA analysis followed by Dunnett's multiple comparison tests. Data are shown as mean ± SEM (n = 3, ns: no significant difference, *P < 0.05, **P < 0.01, ***P < 0.001, ****P < 0.0001).
3. Conclusion
In this study, we constructed a novel YK009‐LNP with good safety and high efficiency for mRNA delivery. In vitro, YK009‐LNP delivered Omicron mRNA into multiple cell lines, including HEK‐293T, DC 2.4, and RD cells, to express the antigen protein and the cytotoxicity was lower than that of commercial MC3‐LNPs. Furthermore, the YK009‐LNP also showed a safe profile in vivo. We also demonstrated that the YK009‐LNP‐Omicron mRNA vaccine could induce a potent humoral immune response and a Th1‐biased cellular immune response in mice and that vaccinated mice were protected against the SARS‐CoV‐2 Omicron variant virus. In summary, the rationally designed and screened YK009‐LNP is a safe and efficient delivery system for mRNA therapy.
4. Experimental Section
Synthesis of mRNA
The SARS‐CoV‐2 Omicron RBD mRNA was produced in vitro by T7 RNA polymerase‐based transcription using the T7‐FlashScribe Transcription kit (Cellscript). Cap 1 structure could increase mRNA translation efficiency and the Cap 1 structure was produced by the ScriptCap Cap 1 Capping System kit (Cellscript). The mRNA was precipitated by adding 5 m ammonium acetate (Sigma‐Aldrich), followed by incubation in ice for 15 min. Then, the mRNA was centrifuged at 12000 × g, at 4 °C, for 15 min and precipitated with 70% ethanol overnight. The concentration of purified Omicron mRNA was analyzed with Agilent 2100 Bioanalyzer and Agilent RNA Nano 6000 Assay Kit. The firefly luciferase mRNA (Fluc mRNA) was purchased from Tri‐Link Bio‐Technology.[ 15a ]
Preparation of LNP‐mRNA
Lipid nanoparticle formulation was prepared by mixing lipids and mRNA. Briefly, ionizable lipids, helper lipid, cholesterol, and PEGylated lipid were fully dissolved in ethanol at a molar ratio of 50:10:38.5:1 and the mRNA was dissolved in 20 mm citrate buffer (pH = 4.0). Next, the lipid mixture was combined with mRNA solution (with a volume ratio of 1:3) by a microfluidic chip at a total flow rate of 12 mL min−1. Finally, the formulations were diluted against the 50‐fold volume of DPBS (Dulbecco's Phosphate‐Buffered Saline) buffer (pH = 7.4), concentrated through the 50 KDa PES (polyether sulfone) ultracentrifugal filters (Sartorius) to remove the ethanol, if needed, and filtrated through a 0.22 µm filter.
Cell Lines and Cell Culture
HEK‐293T (human embryonic kidney‐293T) and RD (human malignant embryonal rhabdomyoma) cell lines were cultured in Dulbecco's modified Eagle's medium (Thermo Fisher Scientific) containing 10% fetal bovine serum (FBS, Thermo Fisher Scientific), 100 U mL−1 penicillin, and 100 µg mL−1 streptomycin (Thermo Fisher Scientific) and were cultured in an incubator at 37 °C with 5% CO2. In addition, immortalized DC 2.4 cell line (a murine bone marrow derived dendritic cell line) was cultured in Roswell Park Memorial Institute 1640 complete medium (RPMI‐1640) containing 10% FBS, 100 U mL−1 penicillin, and 100 µg mL−1 streptomycin and was cultured in an incubator at 37 °C with 5% CO2.
Animal Studies
All the animal experiments were reviewed and approved by the Animal Experiment Committee of Laboratory Animal Centre, Academy of Military Medical Sciences (approval number: IACUC‐DWZX‐2022‐576). Female BALB/c mice (6–8‐week‐old and 8‐month‐old) were purchased from Beijing Charles River Animal Technology Co., Ltd. (Beijing, China) and were housed in a ventilated, temperature‐controlled, and illumination‐controlled animal facility without specific pathogen (20 ± 2 °C; 50% ± 10%; illumination, 8:00–20:00; dark, 20:00–8:00).
Activity Comparison of LNP‐mRNA In Vitro
HEK‐293T cells were seeded into a 96‐well plate (1×10⁴ cells per well). After 24 h, 12 LNP‐Fluc mRNA formulations were prepared as described above. Then, the formulations (Fluc mRNA = 0.1 µg) were added to each well and incubated in the incubator at 37 °C with 5% CO2 for 24 h. After incubation, 100 µL luciferase substrate (PerkinElmer) was added to each well, followed by incubation for 2 min in darkness. Then, the lysate was transferred to a white 96‐well plate in 15 min. The luciferase signals were detected/recorded immediately by an I‐control Infinity 200 PRO microplate reader (TECAN).
Cytotoxicity Comparison of LNP‐mRNA In Vitro
HEK‐293T cells were seeded into a 96‐well plate (1×10⁴ cells per well). After 24 h, 12 LNP‐Fluc mRNA formulations were prepared as described above, and then, the formulations (Fluc mRNA = 1 µg) were added to each well and incubated in the incubator at 37 °C with 5% CO2 for 24 h. After incubation, 10 µL CCK‐8(Cell Counting Kit‐8) solution (Dojindo) was added to each well at 37 °C for 45 min. Absorbance was measured at 450 nm by a microplate reader (TECAN). The cell viability was calculated according to the following formula: Cell viability (%) = (ODS − ODB)/ODC − ODB) × 100% (ODS, ODB, and ODC were defined as the absorbance of samples, untreated samples, and blank controls, respectively). The cytotoxicity evaluation assay of RD and DC 2.4 cells is the same as that for the HEK‐293T cell line.
Characterization of YK009‐LNP‐Omicron mRNA
The particle size and zeta potential of YK009‐LNP‐Omicron mRNA formulations were measured using dynamic light scattering on a Litesizer 500 (Anton Paar, Austria). Transmission electron microscopy (TEM, Hitachi H‐7650) and cryo‐electron microscopy (Cryo‐TEM, FEI Talos F200C) were employed to identify the morphology of the YK009‐LNP‐Omicron mRNA. The QuantiT RiboGreen RNA Assay (Thermo Scientific) was performed to determine the encapsulation efficiency of Omicron mRNA in YK009‐LNP. Briefly, the YK009‐LNP‐Omicron mRNA was diluted with TE (Tris‐EDTA) buffer, treated with an equal volume of 2% Triton X‐100, and then incubated at 37 °C for 10 min to release mRNA. Then, 100 µL of Triton X‐100 treated, untreated YK009‐LNP‐Omicron mRNA, and a series of 100 µL mRNA standards were transferred to a 96‐well plate and incubated with 100 µL of diluted RiboGreen reagent at RT for 5 min; the fluorescence intensity of the wells was recorded by an I‐control Infinite 200 PRO microplate reader (TECAN). The curve of fluorescence and concentration was plotted by linear regression, and the total mRNA concentration and free mRNA concentration was calculated for each well. The loading efficacy was calculated according to the total mRNA concentration and free mRNA concentration. The 2‐(p‐toluidine)‐6‐naphthalene sulfonic acid (TNS) was used to measure pK a. First, YK009‐LNP‐Omicron mRNA formulation was diluted with a series of assay buffers with a pH range from 3 to 11.5 containing 1 µm TNS (50 µm TNS was diluted in distilled water), 150 mm sodium chloride, 10 mm sodium phosphate, 10 mm sodium borate, and 10 mm sodium citrate. Next, the fluorescence intensity of each well was measured by an I‐control Infinite 200 PRO microplate reader (TECAN) using an excitation wavelength of 321 nm and an emission wavelength of 445 nm. The pK a was defined as the pH of half‐maximum fluorescence.
In Vivo Expression Efficiency and Biodistribution YK009‐LNP‐Fluc mRNA
To evaluate the expression efficiency and biodistribution of YK009‐LNP‐Fluc mRNA in vivo, 6–8‐week‐old female BALB/c mice were injected with YK009‐LNP‐Fluc mRNA (mRNA = 10 µg) via the intramuscular, subcutaneous, or intradermal routes. After 3 h, the mice were injected intraperitoneally with Xenolight D‐Luciferin Potassium Salt (PerkinElmer), the bioluminescence signals were detected by IVIS Spectrum instrument (PerkinElmer) for 60 s, another batch was intramuscularly inoculated with the same dose of LNP‐Fluc mRNA, and the bioluminescence signals throughout the body were detected at given time points. For ex vivo imaging, one or two animals of each group were killed and dissected at 1, 3, 6, 12, 24 h postinoculation imaging; tissues, including heart, liver, spleen, lung, kidney, and muscle tissues, were isolated and placed in a black paper in the IVIS Spectrum instrument chamber to detect the luminescence signals. The bioluminescence signals of all images were quantified by Living Image 4.0 software.
Cellular Uptake and Intracellular Distribution of YK009‐LNP‐Omicron mRNA
To detect the cellular uptake, Omicron mRNA was labeled with Fluorescein Labeling Kit (Mirus). HEK‐293T cells, DC 2.4 cells, and RD cells were seeded in 12‐well plates (3 × 10⁵ cells per well) and cultured for 24 h in an incubator at 37 °C with 5% CO2. Then, the cells were treated with LNP‐MFP‐488 labeled Omicron mRNA (mRNA = 1 µg per well). At the scheduled timing, the transfected cells were washed with PBS (Phosphate Buffered Saline) and digested with trypsin (0.25%); then, the cells were washed with PBS and fixed in 4% paraformaldehyde. After washing twice, the cells were resuspended in 500 µL of PBS prior to analysis on a flow cytometer (BD FACS Aria II).
To determine the endocytosis mechanism of YK009‐LNP‐Omicron mRNA, HEK‐293T cells were seeded in 12‐well plates (3 × 10⁵ cells per well) and cultured for 24 h in an incubator at 37 °C with 5% CO2. The cells were preincubated with inhibitors Genistein,[ 20 ] Chlorpromazine,[ 21 ] Dynasore,[ 22 ] Nocodazole,[ 23 ] Amiloride,[ 22 ] Pimozide,[ 23 ] Cytochalasin D,[ 24 ] for 30 min before transfection with YK009‐LNP‐MFP‐488 labeled Omicron mRNA (mRNA = 1 µg per well). The used concentrations and mode of action of these inhibitors were detailed in Figure S13A in the Supporting Information. After transfection for 3 h, the cells were washed with PBS and fixed in 4% paraformaldehyde. After washing twice, the cells were resuspended in 500 µL of PBS before analysis on a flow cytometer (BD FACS Aria II).
To investigate the intracellular distribution of LNP‐Omicron mRNA, HEK293T cells, RD cells, and DC 2.4 cells were seeded in a 96‐well, black, transparent, flat bottom plate before transfection. On the second day, the cells were treated with LNP‐MFP‐488 labeled Omicron mRNA and cultured at 37 °C in a 5% CO2 environment. After transfection for 6 h, the cells were washed with PBS, and the cell nuclei and cell lysosomes were stained with Hoechst 33342 and Lysotracker red, respectively. Finally, the cells were washed with PBS and the images were acquired by Operetta CLSTM High Content System (PerkinElmer).
Protein Expression of YK009‐LNP‐Omicron mRNA In Vitro
To evaluate the YK009‐LNP‐Omicron mRNA expression in vitro, HEK‐293T, RD, and DC 2.4 cells were seeded in 12‐well plates (3×10⁵ cells per well) for 24 h; then, YK009‐LNP‐Omicron mRNA was added into wells (1 µg mRNA per well). After 24 h, the cell supernatants were collected and concentrated to 100 µL by 10k MWCO (molecular weight cut off) protein concentrators PES (Thermo Scientific), and the cells were lysed in RIPA (radio immunoprecipitation assay) buffer to detect SARS‐CoV‐2 Omicron RBD protein by western blotting. The protein samples were separated by 4–12% SDS‐PAGE (sodium dodecyl sulfate poly acrylamide gel electrophoresis) (Thermo Scientific), transferred onto the PVDF (polyvinylidene fluoride) membrane, and blocked with non‐fat milk in 1x TBST (Tris‐Buffered Saline Tween‐20) buffer. The SARS‐CoV‐2 Omicron RBD protein was detected by SARS‐CoV‐2 Spike Antibody, Omicron Reactive, mouse Mab (Sino Biologic), and secondary antibody goat antimouse IgG‐HRP (horseradish peroxidase) (Sino Biologic). The blots were imaged by super ECL (enhanced chemiluminescence) detection reagent (Yeasen) on Tanon‐5200 Chemiluminescence imaging system. The intracellular expression and localization of Omicron RBD protein were verified by immunofluorescent staining assay. Briefly, HEK‐293T, RD, and DC2.4 cells (5×10⁵ cells per well) were cultured in 35 mm confocal dishes (BeyoDold) for 24 h; then, the YK009‐LNP‐Omicron mRNA was added to the dishes (1 µg mRNA per dish). After incubation for 24 h, the cells were washed with PBS three times and fixed with 4% paraformaldehyde for 10 min at RT. Then, the cells were washed with PBS, treated with Triton X‐100, washed with PBS thrice, and blocked with blocking buffer for 30 min at RT. After blocking, SARS‐CoV‐2 Spike Antibody, Omicron Reactive, mouse Mab was added and incubated for 2 h at room temperature. Then, the cells were washed thrice and incubated with Goat antimouse IgG, IgM (H+L) Secondary Antibody (FITC, Thermo) for 1 h at room temperature. Finally, the cells were washed thrice and incubated with DAPI for 5 min at room temperature and imaged by Andor Dragonfly 200.
Stability of YK009‐LNP‐Omicron mRNA
For determination of long‐term stability, the YK009‐LNP‐Omicron mRNA formulation was stored at 4 °C for 4 weeks. Particle size, polydispersity index, and encapsulation efficiency at different times were detected. Then, the transfection efficiency was evaluated. The YK009‐LNP‐Omicron mRNA (mRNA = 5 µg) was transfected to HEK‐293T cells at the scheduled time. The cell supernatants were collected 24 h post‐transfection and concentrated to 100 µL by 10K MWCO protein concentrators PES (Thermo Scientific), and the cells were lysed in RIPA buffer. ELISA and Western Blot assays were applied to evaluated the expression of Omicron RBD after transfection. A commercial ELISA plate (Sino Biological) was utilized to quantify the Omicron RBD protein. Briefly, according to the commercial ELISA plate instruction, the 96‐well plate was washed with 1 × washing buffer three times. Protein standard was serially diluted according to plate instruction, and test samples, including cell supernatant and cell lysate, were diluted. Then, 100 µL of each serially diluted protein standard or test samples were added to wells. The plate was incubated for 1 h at room temperature. After washing thrice, the plate was incubated with the detection antibody in working concentration for 1 h at room temperature. Then, the plate was washed three times, 200 µL of substrate solution was added to each well and incubated for 20 min at room temperature in darkness. After 20 min, 50 µL of stop solution was added to the plate, and the optical density was determined using a microplate reader (Sunrise, TECAN, Switzerland) at 450 nm. The optical density and concentration curve was plotted by linear regression, and Omicron RBD protein concentration in each well was calculated.
Mouse Vaccination
First, 6–8‐week‐old female BALB/c mice were randomized to three groups (n = 5) and twice immunized intramuscularly with YK009‐LNP‐Omicron mRNA (2 and 10 µg mRNA per mouse) at an interval of 28 d, and DPBS was used as placebo. Sera were collected after 10 d of every immunization and inactivated at 56 °C for 30 min to detect SARS‐CoV‐2‐specific IgG antibody and neutralizing antibody. In addition, spleen tissues were collected on day 49 postinitial immunization to evaluate the spleen T cell immune responses by enzyme‐linked immune‐spot assay (ELISpot) and flow cytometry as described below.
Evaluation of Serum Antibody
An ELISA assay was used to detect the immune mice sera IgG antibody titers. Commercial ELISA plates (Sino Biological) were purchased to evaluate Omicron antibody titers. According to the instructions, the 96‐well plate was washed five times with 1 × washing buffer. Serum samples were serially diluted (tenfold steps), starting at 1:100, added to the 96‐well plate, and incubated for 1 h at room temperature. After washing five times, the plate was incubated with HRP‐Rabbit antimouse IgG (1:100) for 1 h at room temperature. Then, the plate was washed five times, 200 µL of substrate solution was added to each well, and the plate was incubated for 20 min at room temperature in darkness. After 20 min, 50 µL of stop solution was added to each well, and the optical density was determined using a microplate reader (Sunrise, TECAN, Switzerland). Finally, endpoint titers were determined according to the ELISA plate instruction. Pseudovirus neutralization assay was used to detect the immune mice sera neutralizing antibody titers. In short, serum samples were serially diluted (threefold dilutions) in a 96‐well plate, starting at 1:30. Except for cell control, the virus control and test samples were all incubated with pseudovirus at 37 °C for 1 h; then, Huh‐7 cells (2 × 10⁴ cells/100 µL) were added to the plate and cultured at 37 °C for 24 h. Next, 150 µL of the supernatant was removed, and 100 µL of luciferase substrate (PerkinElmer) was added to each well, followed by incubation for 2 min in darkness. Then, the lysate was transferred to a white 96‐well plate in 15 min. The luciferase activity was detected by an I‐control Infinite 200 PRO microplate reader (TECAN). The 50% neutralization titers (NT 50) were defined as the serum dilution required for 50% neutralization of viral infection.
Evaluation of T Cell Immune Responses
Antigen‐specific T lymphocyte responses were assessed using IFN‐γ, IL‐2, IL‐4, or IL‐6 precoated ELISpot kits (MabTech). Briefly, spleen lymphocytes were collected on day 49 postinitial immunization using a mouse spleen lymphocyte separation solution kit (Solarbio). Then, according to the manufacturer's protocol of ELISpot kits, the plate was washed with sterile PBS four times and incubated with RPMI‐1640 media containing 10% FBS for at least 30 min at room temperature. Next, mouse splenocytes (3×10⁵ cells/100 µL) and SARS‐CoV‐2 Omicron RBD peptide pool (5 µg mL−1 of each peptide) were added to the plates. PMA (phorbol 12‐myristate 13‐acetate) and Ionomycin (Dakewe) were then added as the positive control, and RPMI‐1640 media were added as a negative control. After incubation at 37 °C, 5% CO2 for 24 h, the cells were removed, and the plates were washed five times. Then, biotinylated antimouse IFN‐γ, IL‐2, IL‐4, or IL‐6 antibodies were added to the plates, followed by incubation for 2 h at room temperature. Following washes with PBS, the plates were incubated with streptavidin‐HRP for 1 h at room temperature. Finally, TMB (tetramethylbenzidine) substrate solution was added to each well after five washes. The reaction developed until distinct spots emerged and was stopped by washing extensively in deionized water. An automated VSR07 ELISpot reader (AID) was used to scanned the air‐dried plates and counted the spots.
T cell proliferation in immunized mice was evaluated by surface and intracellular cytokine staining. A total of 1 000 000 isolated splenocytes were added to a 96‐well plate and stimulated by Omicron RBD peptide (5 µg mL−1 of each peptide) for 12 h at 37 °C with 5% CO2. Brefeldin A (5 µg mL−1) was added to cells and incubated for 4 h. The cells were then collected and washed with cell staining buffer, and CD16/CD32 antibodies (BD eBiosciences) were added to block the Fc receptor of cells. Dead cells were stained with eBioscience Fixable Viability Dye eFluor 780 (Thermo Scientific). Then, the cells were washed with cell staining buffer, stained with fluorescently conjugated antibodies to CD3 (PE/Cyanine 7) (BioLegend), CD4/CD8 (FITC) (BioLegend), CD44(PE) (BioLegend), and CD62L(APC) (BioLegend), and incubated in the dark for 30 min at 4 °C. After washing the cells with cell staining buffer, the cells were fixed with 4% paraformaldehyde for 10 min at room temperature. Finally, the stained cells were washed with cell staining buffer and resuspended in cell staining buffer. Data were recorded by a flow cytometer and analyzed with Flow. Jo v10.8.1.
Evaluation of Immunoprotective Effect
First, 8‐month‐old female BALB/c mice were randomized to three groups (n = 5) and twice immunized intramuscularly with YK009‐LNP‐Omicron mRNA (2 and 10 µg mRNA per mouse) at an interval of 28 d, and DPBS was used as placebo. At day 49 postinitial immunization, the mice were intranasally inoculated with 3.0×10³ TCID50 (50% tissue culture infective dose) Omicron BA.1 in a total volume of 50 µL. The mice were killed 3 d following the challenge, lung tissues were collected for virus titration and pathological examination, and nasal turbinate was collected for virus titration examination. The SARS‐CoV‐2 RNA levels were quantified in nasal turbinates and lungs by qRT‐PCR.
Evaluation of the Toxicity of YK009‐LNP‐Omicron mRNA In Vivo
To evaluate the in vivo toxicity of the YK009‐LNP‐mRNA vaccine, the animals were intramuscularly injected with mRNA, LNP, or LNP‐mRNA (mRNA = 10 µg) and DPBS was used as a placebo. Serum was isolated at 6, 24, and 48 h after injection to evaluate the levels of several cytokines with immunoassays based on Bio‐Plex MAGPIX system. Sera were obtained after 24 h and used to analyze the liver and kidney function (Automated Biochemical Analyzer). The major organs, including the heart, liver, lungs, and kidneys, were collected 48 h postadministration to prepare the histopathological sections.
Statistical Analysis
The results were presented as mean plus standard error of the mean (SEM). The statistical differences were analyzed by one‐ or two‐way ANOVAs or t tests. All statistical analyses were performed using GraphPad Prism 8 statistical software.
Conflict of Interest
The authors declare no conflict of interest.
Supporting information
Supporting Information
Acknowledgements
J.L., C.Y., and H.Z. contributed equally to this work. The study was supported by the National Key R&D Program of China (2021YFC2302405) and the National Natural Science Foundation of China (Grant No. 81830101).
Long J., Yu C., Zhang H., Cao Y., Sang Y., Lu H., Zhang Z., Wang X., Wang H., Song G., Yang J., Wang S., Novel Ionizable Lipid Nanoparticles for SARS‐CoV‐2 Omicron mRNA Delivery. Adv. Healthcare Mater. 2023, 12, 2202590. 10.1002/adhm.202202590
Contributor Information
Gengshen Song, Email: songgengshen@youcareyk.com.
Jing Yang, Email: jingyang0511@sina.com.
Shengqi Wang, Email: sqwang@bmi.ac.cn.
Data Availability Statement
The data that support the findings of this study are available from the corresponding author upon reasonable request.
References
- 1.a) Li Q., Guan X., Wu P., Wang X., Zhou L., Tong Y., Ren R., Leung K. S. M., Lau E. H. Y., Wong J. Y., Xing X., Xiang N., Wu Y., Li C., Chen Q., Li D., Liu T., Zhao J., Liu M., Tu W., Chen C., Jin L., Yang R., Wang Q., Zhou S., Wang R., Liu H., Luo Y., Liu Y., Shao G., et al., N. Engl. J. Med. 2020, 382, 1199; [DOI] [PMC free article] [PubMed] [Google Scholar]; b) Wu F., Zhao S., Yu B., Chen Y. M., Wang W., Song Z. G., Hu Y., Tao Z. W., Tian J. H., Pei Y. Y., Yuan M. L., Zhang Y. L., Dai F. H., Liu Y., Wang Q. M., Zheng J. J., Xu L., Holmes E. C., Zhang Y. Z., Nature 2020, 579, 265; [DOI] [PMC free article] [PubMed] [Google Scholar]; c) Zhou P., Yang X. L., Wang X. G., Hu B., Zhang L., Zhang W., Si H. R., Zhu Y., Li B., Huang C. L., Chen H. D., Chen J., Luo Y., Guo H., Jiang R. D., Liu M. Q., Chen Y., Shen X. R., Wang X., Zheng X. S., Zhao K., Chen Q. J., Deng F., Liu L. L., Yan B., Zhan F. X., Wang Y. Y., Xiao G. F., Shi Z. L., Nature 2020, 579, 270. [DOI] [PMC free article] [PubMed] [Google Scholar]
- 2.a) COVID‐19 Excess Mortality Collaborators , Lancet 2022, 399, 1513; [DOI] [PMC free article] [PubMed] [Google Scholar]; b) Adam D., Nature 2022, 603, 562. [DOI] [PubMed] [Google Scholar]
- 3.a) Flemming A., Nat. Rev. Immunol. 2022, 22, 75; [DOI] [PMC free article] [PubMed] [Google Scholar]; b) Karim S. S. A., Karim Q. A., Lancet 2021, 398, 2126. [DOI] [PMC free article] [PubMed] [Google Scholar]
- 4.a) Corbett K. S., Flynn B., Foulds K. E., Francica J. R., Boyoglu‐Barnum S., Werner A. P., Flach B., O'Connell S., Bock K. W., Minai M., Nagata B. M., Andersen H., Martinez D. R., Noe A. T., Douek N., Donaldson M. M., Nji N. N., Alvarado G. S., Edwards D. K., Flebbe D. R., Lamb E., Doria‐Rose N. A., Lin B. C., Louder M. K., O'Dell S., Schmidt S. D., Phung E., Chang L. A., Yap C., Todd J. M., et al., N. Engl. J. Med. 2020, 383, 1544; [DOI] [PMC free article] [PubMed] [Google Scholar]; b) Jackson L. A., Anderson E. J., Rouphael N. G., Roberts P. C., Makhene M., Coler R. N., McCullough M. P., Chappell J. D., Denison M. R., Stevens L. J., Pruijssers A. J., McDermott A., Flach B., Doria‐Rose N. A., Corbett K. S., Morabito K. M., O'Dell S., Schmidt S. D., Swanson P. A. 2nd, Padilla M., Mascola J. R., Neuzil K. M., Bennett H., Sun W., Peters E., Makowski M., Albert J., Cross K., Buchanan W., Pikaart‐Tautges R., et al., N. Engl. J. Med. 2020, 383, 1920; [DOI] [PMC free article] [PubMed] [Google Scholar]; c) Qu L., Yi Z., Shen Y., Lin L., Chen F., Xu Y., Wu Z., Tang H., Zhang X., Tian F., Wang C., Xiao X., Dong X., Guo L., Lu S., Yang C., Tang C., Yang Y., Yu W., Wang J., Zhou Y., Huang Q., Yisimayi A., Liu S., Huang W., Cao Y., Wang Y., Zhou Z., Peng X., Wang J., et al., Cell 2022, 185, 1728. [DOI] [PMC free article] [PubMed] [Google Scholar]
- 5. Sahin U., Karikó K., Türeci Ö., Nat. Rev. Drug Discovery 2014, 13, 759. [DOI] [PubMed] [Google Scholar]
- 6.a) Li M., Li Y., Li S., Jia L., Wang H., Li M., Deng J., Zhu A., Ma L., Li W., Yu P., Zhu T., Eur. J. Med. Chem. 2022, 227, 113910; [DOI] [PMC free article] [PubMed] [Google Scholar]; b) Loughrey D., Dahlman J. E., Acc. Chem. Res. 2022, 55, 13. [DOI] [PubMed] [Google Scholar]
- 7. Rosa S. S., Prazeres D. M. F., Azevedo A. M., Marques M. P. C., Vaccine 2021, 39, 2190. [DOI] [PMC free article] [PubMed] [Google Scholar]
- 8. Aldosari B. N., Alfagih I. M., Almurshedi A. S., Pharmaceutics 2021, 13, 206. [DOI] [PMC free article] [PubMed] [Google Scholar]
- 9. Akinc A., Maier M. A., Manoharan M., Fitzgerald K., Jayaraman M., Barros S., Ansell S., Du X., Hope M. J., Madden T. D., Mui B. L., Semple S. C., Tam Y. K., Ciufolini M., Witzigmann D., Kulkarni J. A., van der Meel R., Cullis P. R., Nat. Nanotechnol. 2019, 14, 1084. [DOI] [PubMed] [Google Scholar]
- 10.a) Hou X., Zaks T., Langer R., Dong Y., Nat. Rev. Mater. 2021, 6, 1078; [DOI] [PMC free article] [PubMed] [Google Scholar]; b) Patel P., Ibrahim N. M., Cheng K., Trends Pharmacol. Sci. 2021, 42, 448. [DOI] [PMC free article] [PubMed] [Google Scholar]
- 11.a) Ndeupen S., Qin Z., Jacobsen S., Bouteau A., Estanbouli H., Igyártó B. Z., iScience 2021, 24, 103479; [DOI] [PMC free article] [PubMed] [Google Scholar]; b) Wadman M., Science (New York, N.Y.) 2020, 370, 1022. [DOI] [PubMed] [Google Scholar]
- 12.a) Chen K., Fan N., Huang H., Jiang X., Qin S., Xiao W., Zheng Q., Zhang Y., Duan X., Qin Z., Liu Y., Zeng J., Wei Y., Song X., Adv. Funct. Mater. 2022, 32, 2204692; [DOI] [PMC free article] [PubMed] [Google Scholar]; b) Sabnis S., Kumarasinghe E. S., Salerno T., Mihai C., Ketova T., Senn J. J., Lynn A., Bulychev A., McFadyen I., Chan J., Almarsson Ö., Stanton M. G., Benenato K. E., Mol. Ther. 2018, 26, 1509. [DOI] [PMC free article] [PubMed] [Google Scholar]
- 13. Buschmann M. D., Carrasco M. J., Alishetty S., Paige M., Alameh M. G., Weissman D., Vaccines 2021, 9, 65. [DOI] [PMC free article] [PubMed] [Google Scholar]
- 14.a) Chaudhary N., Weissman D., Whitehead K. A., Nat. Rev. Drug Discovery 2021, 20, 817; [DOI] [PMC free article] [PubMed] [Google Scholar]; b) Hajj K. A., Melamed J. R., Chaudhary N., Lamson N. G., Ball R. L., Yerneni S. S., Whitehead K. A., Nano Lett. 2020, 20, 5167. [DOI] [PMC free article] [PubMed] [Google Scholar]
- 15.a) Li L., Long J., Sang Y., Wang X., Zhou X., Pan Y., Cao Y., Huang H., Yang Z., Yang J., Wang S., J. Controlled Release 2021, 340, 114; [DOI] [PMC free article] [PubMed] [Google Scholar]; b) Yang R., Deng Y., Huang B., Huang L., Lin A., Li Y., Wang W., Liu J., Lu S., Zhan Z., Wang Y., R. A., Wang W., Niu P., Zhao L., Li S., Ma X., Zhang L., Zhang Y., Yao W., Liang X., Zhao J., Liu Z., Peng X., Li H., Tan W., Signal Transduction Targeted Ther. 2021, 6, 213. [DOI] [PMC free article] [PubMed] [Google Scholar]
- 16.a) Carrasco M. J., Alishetty S., Alameh M. G., Said H., Wright L., Paige M., Soliman O., Weissman D., Cleveland T. E. t., Grishaev A., Buschmann M. D., Commun. Biol. 2021, 4, 956; [DOI] [PMC free article] [PubMed] [Google Scholar]; b) Huang K., Li N., Li Y., Zhu J., Fan Q., Yang J., Gao Y., Liu Y., Hou Q., Gao S., Wei K., Deng C., Zuo C., Sun Z., BioRxiv 2022, 491597.
- 17. Lewis S. M., Williams A., Eisenbarth S. C., Sci. Immunol. 2019, 4, eaau6085. [DOI] [PMC free article] [PubMed] [Google Scholar]
- 18. Semple S. C., Akinc A., Chen J., Sandhu A. P., Mui B. L., Cho C. K., Sah D. W., Stebbing D., Crosley E. J., Yaworski E., Hafez I. M., Dorkin J. R., Qin J., Lam K., Rajeev K. G., Wong K. F., Jeffs L. B., Nechev L., Eisenhardt M. L., Jayaraman M., Kazem M., Maier M. A., Srinivasulu M., Weinstein M. J., Chen Q., Alvarez R., Barros S. A., De S., Klimuk S. K., Borland T., et al., Nat. Biotechnol. 2010, 28, 172. [DOI] [PubMed] [Google Scholar]
- 19. Laczkó D., Hogan M. J., Toulmin S. A., Hicks P., Lederer K., Gaudette B. T., Castaño D., Amanat F., Muramatsu H., Oguin T. H. 3rd, Ojha A., Zhang L., Mu Z., Parks R., Manzoni T. B., Roper B., Strohmeier S., Tombácz I., Arwood L., Nachbagauer R., Karikó K., Greenhouse J., Pessaint L., Porto M., Putman‐Taylor T., Strasbaugh A., Campbell T. A., Lin P. J. C., Tam Y. K., Sempowski G. D., et al., Immunity 2020, 53, 724. [DOI] [PMC free article] [PubMed] [Google Scholar]
- 20. Zhao F., Zhao Y., Liu Y., Chang X., Chen C., Zhao Y., Small 2011, 7, 1322. [DOI] [PubMed] [Google Scholar]
- 21. Manzanares D., Cena V., Pharmaceutics 2020, 12, 371. [DOI] [PMC free article] [PubMed] [Google Scholar]
- 22. Rennick J. J., Johnston A. P. R., Parton R. G., Nat. Nanotechnol. 2021, 16, 266. [DOI] [PubMed] [Google Scholar]
- 23. Coolen A. L., Lacroix C., Mercier‐Gouy P., Delaune E., Monge C., Exposito J. Y., Verrier B., Biomaterials 2019, 195, 23. [DOI] [PubMed] [Google Scholar]
- 24. Khalil I. A., Kogure K., Akita H., Harashima H., Pharmacol. Rev. 2006, 58, 32. [DOI] [PubMed] [Google Scholar]
Associated Data
This section collects any data citations, data availability statements, or supplementary materials included in this article.
Supplementary Materials
Supporting Information
Data Availability Statement
The data that support the findings of this study are available from the corresponding author upon reasonable request.


