

Abstract
Modeling the heterogeneity of the tumor microenvironment (TME) in vitro is essential to investigating fundamental cancer biology and developing novel treatment strategies that holistically address the factors affecting tumor progression and therapeutic response. Thus, the development of new tools for both in vitro modeling, such as patient‐derived organoids (PDOs) and complex 3D in vitro models, and single cell omics analysis, such as single‐cell RNA‐sequencing, represents a new frontier for investigating tumor heterogeneity. Specifically, the integration of PDO‐based 3D in vitro models and single cell analysis offers a unique opportunity to explore the intersecting effects of interpatient, microenvironmental, and tumor cell heterogeneity on cell phenotypes in the TME. In this review, the current use of PDOs in complex 3D in vitro models of the TME is discussed and the emerging directions in the development of these models are highlighted. Next, work that has successfully applied single cell analysis to PDO‐based models is examined and important experimental considerations are identified for this approach. Finally, open questions are highlighted that may be amenable to exploration using the integration of PDO‐based models and single cell analysis. Ultimately, such investigations may facilitate the identification of novel therapeutic targets for cancer that address the significant influence of tumor‐TME interactions.
Keywords: 3D in vitro models, single cell transcriptomics, tissue engineering, tumor heterogeneity, tumor microenvironments
This review explores the integration of patient‐derived organoid (PDO)‐based 3D culture models and single cell analysis for studying tumor heterogeneity. It discusses the current use of PDOs in complex culture models, examines successful applications of single cell analysis in PDO‐based models, and identifies important opportunities and experimental considerations for the future.
![]()
1. Introduction
Over 90% of new drug candidates fail to receive regulatory approval despite massive investment in drug development, typically due to poor therapeutic efficacy in clinical trials.[ 1 ] One of the major barriers to clinical translation is the widespread use of preclinical models that do not effectively capture the complex biology of in vivo disease processes in humans. While animal models offer a complex, dynamic system with parallels to human disease, differences between murine and human biology can hinder clinical translation to humans. Furthermore, it is difficult to dissect the contribution of specific processes in such a complex system.[ 2 , 3 ] Conversely, 2D cell culture approaches often use human cells and can be exploited to isolate the response of a specific cell type. However, these 2D platforms are limited by the lack of critical tissue features, such as the 3D organization of cells in the tissue and the interactions between different cell types.[ 4 ]
In the context of cancer, replicating the biological complexity of the in vivo tumor microenvironment (TME) is essential for investigating, developing, and translating effective therapies. There are various levels of biological variation in the TME that contribute to tumor heterogeneity, which can be broadly categorized into interpatient, intertumor, microenvironmental and tumor cell heterogeneity (Figure 1 ). Interpatient heterogeneity results from differences between patients in their normal genetic background, genetic driver mutations in tumor cells, and other individualized host and tumor factors, such as tumor composition.[ 5 ] Intertumor heterogeneity arises between primary and metastatic tumors in the same patient, driven by differences in the mutational landscape of metastasis founding clones and in the metastatic niche.[ 6 ] Microenvironmental heterogeneity is multifactorial and reflects tumor cell‐extrinsic factors such as tumor location, the presence and composition of stromal cells, and hypoxia in the TME. Lastly, tumor cell heterogeneity arises from the co‐existence of multiple tumor cell clones and phenotypes at a given tumor site.[ 7 ] Previous work has shown that these levels of heterogeneity intersect and contribute to the variation in clinical course and response to therapy observed between patients.[ 8 , 9 , 10 , 11 , 12 , 13 ] While recognition of the significance of interpatient heterogeneity has encouraged efforts to develop personalized approaches to cancer treatment,[ 14 ] strategies for targeting microenvironmental and tumor cell heterogeneity to improve patient outcomes remain largely theoretical.[ 15 ] Creating more representative preclinical models of the TME will offer new tools to identify the mechanisms underpinning the levels of tumor heterogeneity and provide a platform for exploring novel therapeutic strategies that account for this complexity.
Figure 1.
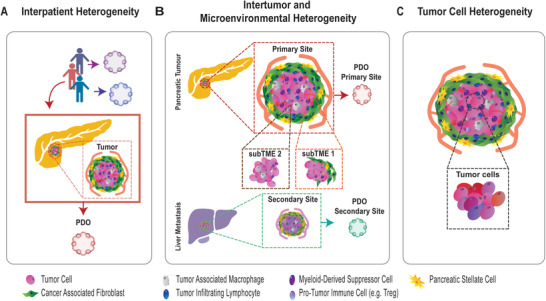
Biological complexity in the tumor microenvironment (TME) arises from the intersection of several levels of heterogeneity, which can be partially captured in vitro with patient‐derived organoids (PDOs). A) Interpatient heterogeneity results from differences between patients in their unique genetics and other host factors. B) Intertumor heterogeneity exists between tumor sites in the same patient and is influenced by factors such as tumor location and the presence of distinct clones in each lesion. Microenvironmental heterogeneity arises due to tumor cell extrinsic factors, such as stromal cell composition and hypoxia in the TME. C) Tumor cell heterogeneity reflects the co‐existence of multiple tumor cell clones and phenotypes in a single tumor.
Critical aspects of the TME that are missing in 2D cultures can be replicated using 3D in vitro models with more control over the local environment than is possible in an animal model. Furthermore, these models can be fabricated with all human cells to mitigate the effects of interspecies variation, such as the differences in gene expression regulation and the immune landscape.[ 16 ] 3D in vitro models range from simple cell aggregates (e.g., spheroids and organoids) and cells cultured in engineered materials (e.g., tunable synthetic hydrogels) to those that incorporate complex tissue features such as perfusion (e.g., microfluidic devices), microenvironmental gradients (e.g., paper‐supported platforms), and tissue organization (e.g., patterned hydrogels). These models are discussed in more detail in Section 2.2. While there are advantages and limitations for each approach, 3D in vitro models generally enable investigations of complex interactions and biological processes in a defined but dynamic way that captures key aspects of in vivo tumors.
Patient‐derived organoids (PDOs) have emerged as an in vitro culture platform that effectively captures interpatient heterogeneity (Figure 1). Organoids are 3D cell aggregates derived from patient tissues that self‐organize into tissue‐relevant structures and contain stem cells capable of self‐renewal. In the cancer context, PDOs capture the key characteristics of the source tumor, including histological features, the mutational landscape and response to therapy, and have been generated from a variety of tumor types.[ 17 , 18 , 19 , 20 , 21 , 22 , 23 , 24 , 25 ] Furthermore, the ability to expand PDOs for extended culture periods in vitro facilitates their use as a source of primary tumor cells where access to conventional primary cells may otherwise be limited, such as in the case of tumors with low cellularity.[ 18 ] However, PDOs typically only retain tumor cells, so microenvironmental heterogeneity is lost in most organoid models. Organoids are also often cultured in a murine basement membrane‐derived extracellular matrix (ECM) (e.g., Matrigel) with conditioned media, which can cause batch‐to‐batch variability. Furthermore, some subpopulations or phenotypes of tumor cells can be lost during PDO establishment and maintenance,[ 20 , 24 ] though modification of the culture conditions, such as media composition, can support restoration of these phenotypes.[ 26 ] The advantages and limitations of tumor PDOs are reviewed in more detail elsewhere.[ 27 , 28 , 29 , 30 ] Using PDOs as a disease‐representative cell source in conjunction with engineered 3D in vitro models to create defined microenvironmental features thus offers a potential new avenue for exploring tumor heterogeneity and tumor‐microenvironment interactions.
In parallel with the development of 3D in vitro models to improve the representative value of preclinical models, the emergence of new experimental techniques has expanded the options for exploring heterogeneity at the single‐cell level. More specifically, advances in sequencing and omics technologies have enabled high‐dimensional profiling of individual cells at the epigenome, genome and transcriptome levels, and tools for single cell proteomics are actively being developed. These single cell technologies critically allow the identification of subpopulations of cells that co‐exist in the TME, which would be obscured in conventional bulk analysis, and thus help clarify factors that contribute to the overall tumor phenotype. Single cell RNA‐sequencing (scRNA‐seq) in particular has significantly improved our understanding of heterogeneity in the TME with regards to both tumor and stromal cell phenotypes, which has implications for tumor growth, metastasis, and response to therapy.[ 31 , 32 ] Furthermore, single cell technologies enable unique analyses that cannot be performed using data from bulk samples, such as unbiased identification of altered cell–cell interactions and the exploration of phenotypic evolution through trajectory analysis, that lay the groundwork for identification of critical biological mechanisms in cancer. However, the application of single cell analysis to 3D in vitro models that capture TME features has been limited to date, despite the potential to explore interpatient, microenvironmental and tumor cell heterogeneity, as well as the interaction between these levels of heterogeneity. Performing such analysis could provide groundwork for identifying novel targetable mechanisms affecting disease progression and response to therapy, with the hope that analysis of human tissue‐based, disease‐relevant models will facilitate a greater success rate in clinical translation of new therapeutic strategies.
This review discusses broad approaches to modeling the TME in vitro, highlights recent examples of 3D in vitro models that have begun to incorporate PDOs to better capture interpatient heterogeneity, and outlines considerations for developing such models in the future. Additionally, we briefly highlight selected single cell analysis technologies, their application to conventional PDO culture models, their emerging application to more complex PDO‐based 3D in vitro models, and future opportunities for the use of these technologies for therapy discovery.
2. Modelling the TME In Vitro
2.1. Components of the TME
The TME in solid tumors is a complex milieu of cellular and non‐cellular factors that substantially influence tumor cell behavior. In addition to tumor cells, the TME is comprised of stromal cells such as fibroblasts, immune cells, and endothelial cells that differ from normal tissue and contribute to disease progression. While these cell types can serve anti‐tumorigenic functions, interactions with tumor cells can polarize stromal cells toward pro‐tumorigenic states—as in the case of cancer associated fibroblasts (CAFs) and some tumor‐associated macrophage (TAM) phenotypes.[ 33 , 34 , 35 ] CAFs in particular can also impact the ECM composition and stiffness in conjunction with tumor cells, to produce both pro‐ and anti‐tumorigenic effect, due to the alteration of tumor‐ECM interactions that impact cell proliferation and adhesion.[ 36 ] Additionally, in conjunction with tumor cells, these stromal cells can promote immune evasion through the exhaustion of tumor‐infiltrating lymphocytes (TILs) with anti‐tumorigenic functions and the recruitment of immunosuppressive cells such as regulatory T cells (Tregs) and myeloid‐derived suppressor cells (MDSCs).[ 37 , 38 , 39 ] The pro‐tumorigenic effects of the stromal cells in the TME are compounded by non‐cellular factors, such as hypoxia and acidosis that arise when uncontrolled tumor cell proliferation exceeds the vascular capacity to deliver oxygen and remove cellular waste. Tumor cells exhibit metabolic and pro‐survival adaptations that allow them to thrive under these harsh environmental conditions, and hypoxia has been shown to promote more invasive, drug resistant and stem cell‐like phenotypes in tumor cells.[ 40 , 41 , 42 ] Furthermore, hypoxia can impact stromal cells by further promoting fibroblast reprogramming to CAFs, enhancing the recruitment and differentiation of immunosuppressive cells, and impairing the function of TILs.[ 40 , 43 ] Thus, while each of the components of the TME provides a unique contribution, there is significant crosstalk in the TME that further influences cellular phenotypes. Collectively, these TME features play an important role in disease initiation, progression, and response to therapy.
2.2. Building Complexity: Recreating Tumor Heterogeneity in PDO‐Based 3D In Vitro Models
Given the complexity of the TME, a variety of approaches have been developed to recapitulate selected microenvironmental features in vitro. These 3D in vitro models include hydrogel‐free strategies, Transwell systems, hydrogels, micropatterned and micromolded gels, microfluidic devices, and paper‐supported cultures (Figure 2 ). However, most have been used with cell lines to date, limiting the cellular heterogeneity captured in these studies.[ 3 , 44 , 45 , 46 , 47 , 48 ] Using PDOs as a source of primary tumor cells in conjunction with these 3D in vitro models offers an opportunity to create models that better reflect interpatient, microenvironmental and tumor cell heterogeneity in culture. Using these models in conjunction with advanced experimental techniques, such as single cell analysis (Section 3) offers an opportunity to better explore the effect of heterogeneous cell–cell interactions, physical, and/or biochemical cues within the microenvironment, or spatial architecture on tumor phenotype. However, many studies of 3D in vitro models have focused on tumor cells alone, or tumor cells in conjunction with one additional microenvironmental factor—whether the presence of another cell type or a hypoxic environment—which neglects the interplay between multiple TME factors. Thus, creating PDO‐based co‐cultures in 3D in vitro models is another avenue to potentially improve the in vitro representation of the TME. Ultimately, integrating PDOs with other 3D in vitro models will facilitate novel investigations of tumor heterogeneity and tumor‐TME interactions that could not be easily explored in PDOs, 3D in vitro models, or animal models alone. Here, we provide a brief description of the most common models, examples of successful organoid integration in each of these platforms, and a discussion of some of the advantages and limitations of each approach.
Figure 2.

PDO‐based 3D in vitro models (left) can integrate multiple sources of tumor heterogeneity and are valuable for exploring various tumor‐microenvironment interactions (right) using single‐cell analysis tools and conventional experimental approaches. A) Schematic representation of hydrogel‐free models, which are well‐suited to investigations of cell–cell interactions. PDO‐derived cells can be cultured independently or with other cell types i) as a monolayer on a plastic substrate, ii) in an ultra‐low attachment (ULA) plates or iii) individual hanging droplets, or iv) using a Transwell insert to form an air‐liquid interface or facilitate indirect interaction between two cell populations. B) Schematic representation of hydrogel‐based models, which adapt conventional PDO culture methods to facilitate investigation of the impact of physical and chemical cues on cell phenotype, including those from stromal cell populations. PDOs can be cultured in 3D within a i) specialized bio‐matrix formulation and can be added to the well to form a ii) hydrogel dome (convex) or hydrogel plug (concave) with iii) defined culture conditions to simulate the tumor microenvironment. C) Schematic representation of spatially‐resolved models that enable investigation of the effect of spatial architecture on cell phenotypes, including the effect of molecular gradients in the TME in select models. i) Patterned hydrogels, such as the GLAnCE model (pictured), allow for live‐imaging of cell invasion at the interface before cell retrieval. ii) Microfluidic devices enable perfusion and real‐time monitoring of cell populations cultured in the device. iii) Paper‐supported models, such as TRACER (pictured), allow patterning of cells in paper scaffolds which can be assembled in single or multi‐layered constructs. In the multi‐layered constructs, cells establish molecular gradients across the layers through consumption; disassembly allows correlation of cell phenotypes with cell location in the microenvironmental gradient. iv) Bioprinted models allow highly customizable tissue architecture and precise fabrication for PDOs in both monoculture and co‐culture with stromal cells.
2.2.1. Hydrogel‐Free Strategies
One of the simplest approaches to creating PDO‐based models of the TME, is the use of hydrogel‐free strategies for PDO culture which include the organoid monolayer approach, specialized culture plates, and Transwell systems (Figure 2A). These models are well suited to investigating the effect of cell–cell interactions where the presence of synthetic ECM components can impact cell phenotypes. The organoid monolayer approach involves dissociating PDOs to single cells and plating them in a 2D monolayer in conventional culture plates. Though not strictly a 3D model, this approach has been used to create T‐cell/PDO co‐cultures that induce a tumor‐reactive T‐cell phenotype.[ 49 , 50 ] Importantly, this approach removes the foreign antigens in Matrigel that can trigger non‐specific reactivity in T‐cells and offers an effective strategy for generating tumor‐reactive T‐cells with a simple workflow. Furthermore, easy cell retrieval from the plate enables downstream analysis of both cell types by a variety of methods. However, given that 3D architecture is a valuable feature of PDOs, the organoid monolayer approach is likely best suited to applications where the tumor cell phenotype is of less experimental interest and the presence of an ECM may have detrimental impacts, as can be the case with some immune cell populations. Furthermore, it is important to note that some patient‐derived specimens are particularly challenging to establish in in vitro culture and thus may not be well‐suited to the formation of 2D monolayers.[ 30 , 50 , 51 ]
Another hydrogel‐free strategy is the use of specialized culture plates, such as ultra‐low attachment (ULA) plates[ 52 , 53 , 54 , 55 ] and hanging drop plates,[ 56 , 57 , 58 , 59 ] which were developed for spheroid cultures to promote cell aggregation into 3D structures. Although hanging drop plates are used infrequently for tumor PDO cultures, they have been adapted for culture of organoids.[ 59 ] Furthermore, ULA plates have been particularly valuable for culturing normal cerebral and glioblastoma (GBM) organoids to explore brain tumor heterogeneity. For example, to demonstrate the potential utility of organoid‐based platforms for chimeric antigen receptor (CAR)‐T cell screening, GBM PDOs were created in an ULA plate and co‐cultured with EGFRvIII‐targeting CAR T‐cells to explore T‐cell response to tumor cells.[ 60 ] In other work exploring tumor cell interactions with normal tissue, models of GBM invasion were created by co‐culturing primary tumor cells and tumor stem cells, respectively, with induced pluripotent stem cell (iPSC)‐derived cerebral organoids.[ 61 , 62 ] Specialized culture plates significantly reduce or eliminate the need for exogenous ECMs and simply replicate cell aggregation in the TME, enabling high throughput studies that rely on imaging and/or soluble assay readouts (e.g., alamarBlue, CellTiter‐Glo) as well as those that require cell retrieval for downstream analysis by other methods. However, these plates are not well‐suited to culturing PDOs as they promote PDOs to aggregate rather than self‐organize and provide a limited model of the TME for most applications.
Another popular hydrogel‐free strategy is Transwell systems that use inserts containing a permeable membrane to divide regular cell culture plates into an upper and a lower compartment. This enables the incorporation of multiple cell types and modeling of basic microenvironmental gradients. For use with PDOs, organoids can be seeded directly in an ECM to retain a 3D environment or dissociated to single cells for plating in either compartment, with the precise configuration dependent on the intended experimental readout.[ 63 , 64 , 65 ] Where appropriate, the Transwell membrane can also be coated with a thin layer of ECM gel to support cell growth in the upper compartment, which may be beneficial for PDO cultures in some contexts. To date, Transwell systems have been used to create air‐liquid interface cultures where tumor samples are seeded in the upper compartment of the Transwell to preserve multiple stromal cell types in addition to the tumor epithelial cells.[ 64 ] This organoid model was used to profile T‐cell receptor clones and explore responses to PD‐1 checkpoint blockade.[ 64 ] Furthermore, Transwell inserts have been used to create co‐culture models that separate the two cell compartments, facilitating the distinction between contact‐dependent and paracrine signaling‐mediated interactions between cell types. For example, a Transwell co‐culture of normal pancreatic fibroblasts (PSCs) and mouse pancreatic ductal adenocarcinoma (PDAC) organoids was used to explore PSC activation to CAFs in the presence of tumor cells. Specifically, indirect Transwell cultures—where the CAFs were seeded on a Transwell insert and tumor organoids were cultured in the lower compartment of the well—were compared to a mixed CAF/tumor organoids co‐culture in Matrigel domes and used to show that different CAF phenotypes were induced by different tumor‐CAF interaction mechanisms.[ 65 ] This approach has been extended by incorporating additional microenvironmental features in the experimental setup, such as hypoxia, which provides further biological complexity in a straightforward workflow.[ 66 ] Beyond the investigations that have been conducted to date with organoids, Transwell‐based assays have also long been used for studying cell migration and invasion in response to stimuli, such as the presence of cytokines in the lower compartment; this would be a valuable area for exploration with PDOs.[ 67 , 68 , 69 , 70 , 71 ] As Transwell systems are compatible with cell retrieval for downstream analysis and in situ imaging, they enable highly customizable exploration into the biological mechanisms at play in various tumor‐TME interactions. Furthermore, they offer a simple approach that is relatively easy to scale. However, this approach is not well‐suited to investigations of cell‐ECM interactions and does not provide the level of physiological relevance with regards to tissue architecture and microenvironmental gradients that can be achieved with other models.
2.2.2. Hydrogel‐Based Models
Hydrogels have been developed to replicate the biochemical and biomechanical cues provided by the ECM that affect cell phenotypes and provide an appropriate environment to support 3D cell culture (Figure 2B). These scaffolds include natural materials, such as basement membrane extract (BME; e.g., Matrigel and equivalents), semi‐synthetic materials, and synthetic materials, such as poly(ethylene glycol) [PEG][ 72 , 73 , 74 ] and synthetic peptide‐based hydrogels.[ 75 , 76 , 77 ] Though BME is already widely used for the culture of PDOs, its murine origins, variable composition, and heterogeneous mechanical properties negatively impact reproducibility and the recapitulation of tissue‐specific human ECM properties, leading to widespread interest in alternatives.[ 75 , 76 ] Alternative gels can be used to obtain greater control over the environment to which PDOs are exposed and enable explorations of tumor‐ECM interactions mediated by specific proteins, tissue stiffnesses, or other ECM characteristics. To this end, Below et al. used a PEG‐based hydrogel designed to recapitulate relevant ECM‐receptor interactions and tissue stiffness for culture of PDAC PDOs, with similar growth curves and cell polarization to those observed in Matrigel.[ 78 ] In a semi‐synthetic approach, Prince et al. developed a tunable gelatin and aldehyde‐modified cellulose nanofibrillar gel (“EKGel”) that supported breast PDO growth and phenotypes equivalent to that in BME and achieved a stiffness range consistent with that observed in the breast TME. Uniquely, EKGel also appeared to reduce the outgrowth of mouse cells in organoids established from patient‐derived xenograft (PDX) models, which can overgrow the human tumor cells in culture and confound results; this property could overcome a significant barrier to using the many organoid models that have been or must be established via a PDX.[ 79 ] Thus, BME‐alternative ECMs are effective for reducing experimental variation and can offer highly tunable, unique properties that can be leveraged for specific experimental setups, such as exploring the effect of ECM properties on PDO phenotypes.
Hydrogels also offer a simple strategy for creating co‐culture models that reflect microenvironmental heterogeneity, as multiple cell types can be cultured in a single gel dome. This approach has been used to create tumor‐fibroblast,[ 65 , 80 , 81 , 82 , 83 ] tumor‐lymphocyte,[ 83 , 84 , 85 ] tumor‐myeloid,[ 86 , 87 , 88 ] and tumor‐fibroblast‐immune[ 78 , 83 , 84 ] co‐cultures. These co‐culture models have been used to show how tumor cells influence stromal cell phenotypes and vice versa, investigate the mechanisms underpinning these effects, and explore strategies for enhancing therapeutic response, among other applications.[ 65 , 80 , 83 , 86 ] Furthermore, hydrogel‐based co‐culture models can accommodate the addition of normal tissue organoids, which may be valuable for some applications, such as assessing off‐target effects of tumor‐targeted treatments. For example, colorectal carcinoma (CRC) PDOs were combined with CAR NK cells and normal colon organoids to assess the efficacy of a novel CAR NK target and evaluate the off‐target toxicity of CAR NK cells.[ 84 ] Synthetic or semi‐synthetic hydrogels may be particularly useful for tumor‐immune co‐cultures as the effect of foreign antigens present in BME can be reduced or eliminated. For example, melanoma organoids were cultured with an autologous lymph node biopsy in HA/collagen gels to create a model that retained antigen‐presenting cells and generated tumor‐reactive T‐cells.[ 87 ] These co‐cultures offer important example platforms for exploring tumor‐stroma interactions as well as the impact of these interactions on response to various therapies. This is particularly the case for immunotherapy, where the opportunity to create a human‐only system is valuable for identifying and evaluating treatment strategies that may differ between murine and human immune systems.
In addition to cellular features of microenvironmental heterogeneity, culturing PDOs alone or with stromal cells in hydrogels under low oxygen conditions may be helpful to replicate this critical aspect of the TME. For example, two recent studies of CRC organoids have shown that culturing PDOs under hypoxic pressure can promote organoid establishment, growth, survival, and ATP metabolism.[ 89 , 90 ] Furthermore, a mixed co‐culture model of murine PSCs and PDAC organoids in hypoxia showed that PSC activation to CAFs is HIF‐dependent.[ 80 ] As the levels of oxygen tension in hypoxia chambers are more static than the cell‐consumption derived gradients present in the TME, newer hydrogels with dynamic systems that better recapitulate gradients present in the TME of stiffness, signaling molecules, oxygen and other features may be of interest for future incorporation of PDOs.[ 91 , 92 , 93 , 94 , 95 , 96 , 97 ]
The versatility and customizability of hydrogels allows them to be used as the basis for more complex 3D in vitro models including layered hydrogel systems and micropatterned/micromolded gels (Figure 2Ci). Layered hydrogel systems involve the stacking of hydrogel layers to create modular combinations of different cell types and tissue architectures. This approach has been used with cell lines to facilitate the study of tumor‐stroma interactions, angiogenesis, and cell migration in the TME.[ 98 , 99 , 100 , 101 ] In the context of PDOs, Luo et al. used this strategy to create a co‐culture of CAFs and CRC PDOs by encapsulating the PDOs in a hyaluronan‐gelatin ECM slab and layering CAFs on the surface of the gel after crosslinking. The co‐culture enhanced PDO growth and drug resistance, highlighting the significance of crosstalk between the two cell types. In addition, the layering strategy allowed CAFs to be removed from the culture without disrupting the tumor cells, facilitating the use of a soluble assay for viability assessment.[ 102 ] Expanding on a simple layered geometry, micropatterned and micromolded hydrogels use a stamp or mold, respectively, to create hydrogels in defined shapes and dimensions. This approach offers precise control over hydrogel architecture, which is useful for organizing cells in precise configurations and investigating how topography affects cell behavior.[ 103 , 104 , 105 , 106 , 107 , 108 , 109 ] Micromolded hydrogels, in particular, have been valuable for enhancing image‐based analysis of PDOs by constraining cells to a single focal plane and reducing the artefacts resulting from imaging of cells in a 3D gel dome. For example, Brandenberg et al. used micromolded PEG‐based hydrogel films to create microwells that contained individual CRC PDOs restricted to a single focal plane. This enabled automation of a high‐content image‐based drug screening assay and allowed individual organoids to be retrieved for downstream analysis to correlate specific phenotypes with gene and protein expression patterns.[ 107 ] In work from our group, Wu et al. used the Gels for Live Analysis of Compartmentalized Environments (GLAnCE) platform to encapsulate PDAC PDOs in a thin collagen gel micromolded in a polystyrene chip. Using this platform, the dynamics of PDO regrowth following treatment with gemcitabine chemotherapy were characterized and regrowth patterns that could not be examined with typical endpoint soluble assays were identified, such as the regrowth of subpopulations of organoid cells.[ 109 ] Wu et al. have also used the GLAnCE platform for mixed co‐culture of PDAC PDOs and CAFs and found that the presence of CAFs enhanced PDO growth and induced changes in PDO morphology that had been previously associated with cancer cell invasion at the tumor‐stroma interface.[ 108 , 109 ] Furthermore, though not yet performed with PDOs, the 24‐GLAnCE platform allows the creation of an interface between 2 cell populations to model tumor cell invasion, which would be an interesting avenue for future study with PDOs.[ 108 ]
In general, hydrogels are simple to use, and many hydrogel‐based systems can be precisely customized, making them attractive for applications where control over specific ECM properties is needed. Furthermore, hydrogels are a versatile platform for 3D cell culture as they can support multiple cell types and are generally compatible with a variety of experimental approaches, including both in situ analysis and techniques that require removal of cells from the gel. However, imaging hydrogels can be challenging when gels are thicker than 200 µm and cell retrieval efficiency after gel digestion varies between hydrogel materials.[ 110 ] Also, mixing multiple cell populations within the gel can make it challenging to dissect the contributions of specific cell populations to a given phenomenon and may necessitate cell sorting before performing bulk assays. Although layered and micromolded hydrogel models have more complex workflows and some restrictions on suitable hydrogel materials, these approaches can be used to overcome some of the limitations of conventional hydrogel geometries, such as gel plugs and gel domes. Specifically, by allowing architectural control, layered and micromolded hydrogels can facilitate resolution of multiple cell populations and improve imaging‐based readouts, respectively; these features may be advantageous for certain experimental designs.
2.2.3. Microfluidic Devices
Microfluidic devices encapsulate cells in small channels, often embedded in hydrogels, while allowing for dynamic fluid flow through the culture system (Figure 2Cii). These devices can be precisely fabricated and use customized designs optimized for a variety of experimental applications, including investigations of drug response, tumor‐stroma interactions, tumor vascularization, and cell migration and invasion.[ 111 , 112 , 113 , 114 , 115 , 116 , 117 , 118 ] Microfluidic devices designed for modeling the TME are reviewed in more detail elsewhere.[ 3 , 47 , 119 , 120 , 121 , 122 , 123 , 124 ] In the context of PDO integration with microfluidic devices, one notable design was developed by Schuster et al., who created a two‐layer microfluidic culture chamber with 200 wells to enable testing of up to 20 independent conditions across 10 PDO lines simultaneously. In this design, the lower layer was a 200‐well array with dimensions optimized for organoid culture and the upper layer provided fluidic channels. An automated perfusion system facilitated high‐throughput image‐based screening of drugs sequentially, in combination, or at predetermined delivery intervals. Furthermore, the unique two‐layer design allowed organoids to be easily extracted for further analysis.[ 111 ] In another example, to address the challenge that variations in organoid sizes can create heterogeneous drug responses in conventional drug screening assays, Jung et al. created a microfluidic device with a design featuring 29 microwells radially arranged around a central channel to facilitate culture of PDOs with more uniform sizes to promote more consistent responses.[ 112 ] Where specialized fabrication tools are not available, alternative microfluidic designs may be advantageous. For example, Mazzocchi et al. used a slide‐based microfluidic device with an adhesive film layer to create a fluidic channel and a circular well in order to establish mesothelioma PDOs and assess patient‐specific variations in drug response.[ 113 ] Other device designs developed using cell lines[ 125 , 126 , 127 ] also offer alternative approaches for drug response characterization and screening that may be amenable to use with PDOs in the future.
Microfluidic devices have also been used to create co‐culture models that support both tumor and stromal cells in culture to gain insight into stromal targeting therapy and immunotherapy. To this end, Haque et al. created a microfluidic device with an upper chamber for co‐culture of PDAC PDOs with PSCs and a monocyte cell line and a lower chamber for medium flow. The device was used to explore the interactions between these cell types and found that co‐culture enhanced PDO growth. Furthermore, they found that treatment of the co‐culture with stromal targeting agents enhanced the efficacy of gemcitabine chemotherapy.[ 114 ] In another example, Jenkins et al. used a simple microfluidic device with a centre gel region for cell culture and two parallel channels for media perfusion to culture PDOs that retain their autologous immune populations to explore factors affecting immunotherapy response.[ 118 ] Compared to other PDO co‐culture models, microfluidic devices are advantageous for studying dynamic processes where perfusion may have an effect, such as response to therapy and cell migration, particularly where live imaging is a desired experimental readout.
Given their ability to accommodate fluid flow, microfluidic devices are also uniquely well‐suited to creating PDO co‐culture models that incorporate endothelial cells and promote the formation of perfusable vessels. For example, Shirure et al. used a three‐chamber microfluidic device with a central microvascular chamber to culture endothelial cells and two side chambers for breast cancer PDO culture to explore the angiogenic potential of PDOs and assess the efficacy of chemotherapy. The compartmentalized nature of the platform also allowed comparison of the angiogenic potential of different cell types and assessment of the efficacy of anti‐angiogenic therapies.[ 115 ] In another example, Lai et al. established tri‐cultures of PDAC PDOs, fibroblasts and endothelial cells using the InVADE platform—a plate‐based device featuring a channel filled with HUVECs and a surrounding chamber filled with a mix of fibroblasts and tumor PDOs.[ 116 ] Notably, perfusion was achieved by gravity‐driven flow from an adjacent well filled with media, eliminating the need for pumps and tubing typically required for use of microfluidic devices. This approach was used to show that PDOs activate fibroblasts to a CAF phenotype that exhibits increased collagen deposition and stiffens the ECM. This phenomenon may contribute to a reduction in small molecule transport through the HUVEC channel and therefore reduce the PDO response to gemcitabine chemotherapy.[ 116 ] Rajasekar et al. used the iFlowPlate platform, which connected three open wells of a 384‐well plate using microchannels and gravity‐driven flow, to explore monocyte migration and differentiation to macrophages in normal colon organoids seeded on top of a microvascular network. This platform would likely be adaptable for investigations of immune cell infiltration and differentiation with tumor PDOs.[ 117 ] The open‐top design of these microfluidic devices is significant as it allows cells to be easily assessed with immunofluorescence and facilitates more efficient cell retrieval for downstream analysis compared to sealed devices. Thus, microfluidic devices are particularly valuable for studying important processes that depend on vascularization and perfusion, such as angiogenesis, drug delivery and cell migration, which are not effectively captured in other 3D in vitro models.
Microenvironmental heterogeneity arising from dynamic gradients of oxygen and nutrients in the TME can also be modeled in microfluidic devices as they enable precise control over the system and can be integrated with sensors for real‐time monitoring.[ 128 , 129 , 130 , 131 , 132 , 133 , 134 , 135 , 136 , 137 , 138 ] For example, Dornhof et al. created a gas‐tight microfluidic device with two gel‐filled cell compartments surrounded by three parallel fluidic channels and integrated lactate, glucose and oxygen sensors that allowed establishment of hypoxia in the device by reducing media perfusion or performing asymmetric perfusion through a side channel. They showed that breast cancer stem cell‐derived spheroids cultured in this device were responsive to environmental conditions and had cancer‐specific metabolic characteristics, such as the production of high amounts of lactate despite normoxic conditions.[ 128 ] Other microfluidic devices predominantly tested with tumor cell lines and tumor spheroids have used diffusion barriers and gas control chambers to establish hypoxia, often in conjunction with hypoxia tracking probes to visualize tumor cells experiencing hypoxia.[ 129 , 130 , 131 , 132 , 133 , 134 , 135 , 136 , 137 ] In one example with PDOs, Geyer et al. used the commercially available OrganoPlate 2‐Lane—a plate‐based microfluidic device with a cell‐gel suspension channel and a parallel perfusion channel with gravity‐driven flow—in a hypoxia chamber to create a hypoxic PDAC PDO and PSC co‐culture model. Using this model, they explored the combined effect of hypoxia and PSCs on the PDO response to gemcitabine and other therapeutic agents.[ 129 ] Accordingly, integration of hypoxia, stromal cells and PDOs using microfluidic devices as a platform may offer a promising opportunity for future investigations of the TME.
As in many of the examples above, microfluidic devices are typically optimized for image‐based readouts, allowing real‐time monitoring of these cultures. Additionally, fluid flow in microfluidic devices makes them uniquely well‐suited to exploring processes associated with angiogenesis and the microenvironmental gradients that arise in a dynamic environment. However, they are limited by the complexity of their manufacturing process and the fact that cell retrieval from closed devices can be challenging, which impacts the ability to perform downstream analysis with other techniques.[ 124 , 139 ] The use of commercially available microfluidic systems that support PDO‐based co‐cultures can be considered to mitigate some of the challenges associated with the complexity of microfabrication.[ 140 ] Finally, it is important to note that Matrigel has poor tolerance of flow‐induced stress and seeding of devices may be challenging due to the low gelation temperature;[ 79 , 141 ] thus, other ECMs may be necessary for culturing PDOs in microfluidic devices.
2.2.4. Paper‐Supported Models
Our group[ 142 , 143 , 144 , 145 , 146 , 147 ] and others[ 148 , 149 , 150 , 151 , 152 , 153 , 154 , 155 ] have created paper‐supported models where thin paper scaffolds infiltrated with cells embedded in hydrogels are assembled to create a tissue construct with one or more layers (Figure 2Ciii). Single‐layer systems offer quick and inexpensive fabrication and a mechanically reinforced platform for applications where low hydrogel volumes are desired to facilitate live imaging but a 3D structure is still required and where repeated media changes could degrade softer hydrogel domes. For example, the Scaffold‐supported Platform for Organoid‐based Tissues (SPOT) developed by Li et al. integrated a 96‐ or 384‐well bottomless plate with a cellulose paper scaffold and a polycarbonate base to culture small numbers of PDOs in a collagen‐Matrigel blend. This system was used for drug screening using both image‐based and soluble assay readouts and to explore the effects of PDO co‐culture with fibroblasts.[ 142 ] Although the SPOT system can be fabricated without specialized equipment, it is also compatible with automated liquid‐handling for fabrication and cell extraction from the scaffold, which enables downstream analysis by various methods.[ 143 ]
When multiple scaffold layers are assembled in stacks, the resulting constructs create 3D in vitro models that feature cell‐consumption defined gradients of oxygen and other molecules across the layers, recapitulating some of the microenvironmental gradients in the TME.[ 144 , 145 , 146 , 147 , 148 , 149 , 150 , 151 , 152 , 153 , 154 , 155 ] This approach can be used to study cell responses to microenvironmental conditions, cell metabolism, tumor cell invasion, drug delivery, and response to therapy.[ 144 , 145 , 146 , 147 , 148 , 149 , 150 , 151 , 152 , 153 , 154 , 155 ] Uniquely, stacked paper‐supported models can be disassembled to allow correlation of cellular properties to specific locations in the engineered tissue construct, which enables spatial analysis that is not possible with most 3D in vitro models. For example, our group recently adapted the Tissue Roll for Analysis of Cellular Environment and Response (TRACER) for use with PDOs.[ 144 , 145 ] TRACER uses a cellulose paper scaffold infiltrated with a cell‐hydrogel suspension that is rolled around an oxygen impermeable aluminum core to create a six‐layer construct with gradients of oxygen and nutrients across the layers.[ 144 , 145 ] Using this approach, we showed that PDAC PDOs cultured in the oxygen‐depleted inner layers of the construct are less responsive to treatment with gemcitabine chemotherapy and can induce functional changes in immune cells.[ 145 ] Notably, the TRACER platform was designed for rapid disassembly by unrolling to enable spatially correlated metabolomic analysis; this has not yet been attempted with PDOs, but would be a particularly interesting area for future investigation.[ 144 ] The modular nature of stacked paper‐supported models also facilitates the fabrication of cocultures with precise configurations, allowing investigations of the synergistic effects of multiple cell types and microenvironmental gradients.[ 146 , 147 , 154 ] To this end, Cadavid & Latour et al. recently reported a modular PSC‐PDO co‐culture in TRACER to explore the effect of tissue architecture on microenvironmental gradients and both PSC and PDO cell phenotypes. They found that phenotypic markers were variably affected by hypoxia and PSC proximity to the PDOs.[ 146 ] Thus, stacked paper‐supported models can be used to answer various unique biological questions related to the effects of microenvironmental heterogeneity on cell phenotypes.
Paper‐supported models are typically compatible with a variety of downstream analytical techniques including both imaging of individual layers and techniques that require cell removal from the construct.[ 144 , 145 , 146 , 147 , 148 , 149 , 150 , 154 , 155 ] Of note, as hydrogels are an integral part of these paper‐supported systems, ECM selection should be optimized to reflect the properties of the tissue being modeled and to allow efficient cell retrieval from the scaffold if desired. Single‐layer systems are well‐suited to studies where live imaging is required or the mechanical properties of the hydrogel may pose challenges for repeated handling; thin films of impermeable material can also be used to create microenvironmental gradients.[ 142 , 151 ] Stacked paper‐supported models are uniquely well suited to spatially correlated analysis of cell responses to microenvironmental heterogeneity, though the labor‐intensive manual workflow limits these models to low throughput studies. Stacked paper‐supported models are also typically restricted to endpoint analysis as disassembly of the construct is often required for analysis, though models with integrated sensors can facilitate dynamic monitoring of some culture conditions.[ 152 , 153 ]
2.3. Emerging Directions and Considerations for the Development of Models of Microenvironmental Heterogeneity
Incorporating other cell types and microenvironmental gradients into PDO‐based models will expand the range of applications for these approaches by creating a more comprehensive representation of microenvironmental heterogeneity. These microenvironment‐inclusive models can be based on a variety of platforms ranging from simple ECM slabs or domes to compartmentalised microfluidic devices and paper‐based systems. Each strategy is best suited to answering different biological questions based on their design advantages and limitations, and thus careful consideration should be used in selecting a platform for these models. Looking to the future, advances in the ability to 3D bioprint organoids and other cell types may open the door to creating more elaborate culture configurations and automating culture manufacturing in some model systems (Figure 2Civ).[ 156 , 157 , 158 , 159 ] Furthermore, the creation of novel co‐culture models that reflect emerging areas of interest, such as the incorporation of microbiome components[ 138 , 160 , 161 , 162 , 163 , 164 , 165 , 166 ] and the representation of inter‐organ communication,[ 63 , 167 , 168 , 169 ] may extend the accuracy and types of questions that can be answered using 3D in vitro models. Such models can complement existing investigations and offer new angles for exploring the effects of microenvironmental heterogeneity on tumorigenesis, disease progression and response to therapy.
When considering PDO‐based models of microenvironmental heterogeneity, there are several important considerations that must be addressed when designing the models and experiments. Firstly, PDO media typically contains many exogenous factors that can adversely affect the survival and phenotype of other cell types, including immune cells and fibroblasts.[ 49 , 65 ] Thus, media composition must be carefully optimized to mitigate these effects without impacting PDO phenotypes. Secondly, the presence of multiple cell types can confound the readouts of bulk assays. Careful experimental design is needed to isolate the contributions of specific cell types and cell retrieval and sorting may be needed prior to some downstream analyses. Alternatively, single‐cell analysis methods can be used to probe the heterogeneity of cell phenotypes in the model; the application of single‐cell technologies to 3D in vitro models is discussed in more detail below. Finally, PDO‐based models of the TME must be appropriately characterized to understand how PDOs impact the phenotypes of the other cell types and ensure the appropriate interactions are being assessed. For example, PDOs can induce expression of heterogeneous CAF phenotypes[ 65 , 81 , 170 ] and promote enrichment of tumor‐reactive subpopulations in co‐cultured immune cells derived from PBMCs.[ 49 , 171 ] Even if exploring these effects is not the intended purpose of the co‐culture model, characterization is necessary to ensure experimental readouts are interpreted appropriately. Similarly, PDO responses to hypoxia or the presence of other cell types must be assessed to ensure expected responses are reliably observed and provide validity to other experimental results. When these considerations are addressed, PDO‐based models of the TME have the potential to offer new insight into important biological mechanisms in the TME and provide platforms for assessing more complex therapeutic strategies.
3. Elucidating Microenvironmental and Tumor Cell Heterogeneity with Single Cell Analysis of PDOs and PDO‐Based Models
3.1. Overview of Single Cell Technologies
In parallel with the rise of novel 3D in vitro culture strategies, the rapid development of high‐dimensional single‐cell analysis technology has expanded the toolkit for exploring tumor biology. Specifically, while bulk omics technologies have broadly facilitated the identification of tumor classification schemes and profiling of interpatient heterogeneity, single‐cell analysis has enabled novel in–depth investigations of both microenvironmental and tumor cell heterogeneity in the TME (Figure 3 ). The most popular of these single cell technologies is single cell RNA‐sequencing (scRNA‐seq), which offers robust gene expression information at the single‐cell level and has been accompanied by the development of several analysis packages intended for easy adoption by a variety of users. Emerging single cell experimental methods—such as single cell thiol‐(SH)‐linked alkylation of RNA for metabolic labeling sequencing (scSLAM‐seq)[ 172 ] and Live‐Seq[ 173 ] —promise to extend the value of this approach by building on scRNA‐seq to offer additional biological information such as signaling pathway activation, transcription factor activity, transcriptional kinetics, and correlations between transcriptomic information and downstream cell phenotypes.[ 172 , 173 , 174 , 175 , 176 ] Furthermore, spatial transcriptomics is becoming increasingly popular to enable correlation between gene expression and a cell's location in the tissue, though mainstream tools have not yet reached single cell resolution.[ 177 ] Currently, PDOs are typically collected and dissociated for single cell analysis, which results in the loss of valuable information related to tissue organization that is carefully considered during the development of complex 3D in vitro models. Emerging work in this area may enable single cell‐level spatial transcriptomic profiling to mitigate this challenge in the near future, though these strategies often have trade‐offs between the number of genes that can be examined and the number of cells that can be profiled in the tissue.[ 178 , 179 , 180 ]
Figure 3.

Bulk and single cell technologies can be used to investigate tumor heterogeneity in vivo and in vitro. A) Both bulk and single cell analysis can be used to effectively characterize interpatient heterogeneity and identify broad differences in tumor phenotypes. Single cell analysis is particularly impactful for exploring (B) microenvironmental and (C) tumor cell heterogeneity. B) Single cell analysis at the microenvironment level can provide insight into tumor composition and variation between patients or sample sites. C) Single cell analysis at the tumor cell level can reveal subpopulations of tumor cells with distinct phenotypes due to the co‐existence of multiple clones and variable exposure to both cellular (e.g., stromal cells) and non‐cellular (e.g., hypoxia) microenvironmental features.
Beyond transcriptomics, several technologies have been developed to enable access to other high‐dimensional biological information at single‐cell resolution. The single cell sequencing assay for transposase accessible chromatin (scATAC‐seq) is a commercially available technique for single cell epigenomics that identifies regions of open chromatin at the single‐cell level and provides insight into transcriptional regulation.[ 181 ] Though less widely used than scRNA‐seq and scATAC‐seq, some groups have also developed workflows for single cell whole genome sequencing (scWGS‐seq).[ 19 , 182 , 183 ] Single cell proteomics has not yet been achieved, as the maximum throughput achieved to date is approximately ≈100 cells per day, though several thousand proteins can be identified per cell.[ 184 , 185 ] In the interim, mass cytometry, also known as cytometry by time of flight (CyTOF), provides higher‐dimensional protein‐level information than flow cytometry by using metal‐conjugated antibodies to profile more than 40 markers per panel at single‐cell resolution.[ 186 , 187 ] Together, these single cell technologies offer a strategy for elucidating important biological information from advanced 3D in vitro models that goes beyond what can be achieved with conventional experimental techniques, such as immunofluorescence and bulk transcriptomics. The section below discusses the application of single cell analysis technologies to PDOs and PDO‐based culture models to gain insight into microenvironmental and tumor cell heterogeneity. Challenges and considerations for the design, implementation and analysis of single cell experiments are well‐reviewed elsewhere.[ 31 , 188 , 189 ]
3.2. Single Cell Analysis of PDOs in Conventional Culture Setups
An increasing number of studies have performed single cell analysis of PDOs cultured with standard techniques in BME domes. This analysis has served both to characterize tumor cell heterogeneity in PDOs and verify that they reflect the features of the source tumor as well as to gain insight into the mechanisms underlying particular cell states. At the DNA level, scWGS‐seq has been used to verify organoids reflect the genomic heterogeneity of the parent tumor. Furthermore, this technique has been used to profile changes in the proportion of different genomic subpopulations over time in culture.[ 19 , 190 ] scRNA‐seq has similarly been used to highlight interpatient heterogeneity, characterize the subpopulations of cells present in PDO cultures, and verify that the PDOs reflect the gene expression patterns of the parent tumor.[ 60 , 191 , 192 , 193 , 194 ] Importantly, these studies have shown that PDOs capture the co‐existence of transcriptional phenotypes seen in parent tumors and that transcriptional heterogeneity is generally maintained over time in culture, though some changes can be observed between early‐ and late‐passage PDOs.[ 60 , 191 , 192 , 193 , 194 ] For example, PDAC PDOs tend to shift from a basal‐like phenotype to a classical phenotype during culture but exhibit a heterogeneous mixture of these phenotypes at the single cell level at later timepoints. Furthermore, single cell analysis has shown that distinct cell fates can emerge during culture in PDAC PDOs.[ 193 ] Thus, single cell analysis enables characterization that would not be achievable with bulk analysis methods that obscure subpopulations of cells in the PDO culture.
Moving beyond characterization, scRNA‐seq has also been used to evaluate the effect of media composition on PDO phenotypes, which has implications both for effective in vitro culture and our understanding of microenvironmental signals that can influence tumor cell heterogeneity. For example, scRNA‐seq analysis by Wang et al. demonstrated that the Wnt and R‐spondin conditioned media commonly used in CRC PDO culture enriched tumor cell growth over normal epithelial cells and promoted the expression of stem/progenitor cell markers. Interestingly, they also found that the media used to derive PDOs from tumor tissue establishes gene expression patterns that could not be fully reversed by changing media composition at later passages.[ 195 ] Similarly, in a study of PDAC PDOs, Raghavan et al. showed that organoids cultured in minimal media without organoid growth factors exhibited increased expression of genes associated with a more aggressive, treatment‐resistant phenotype compared to those cultured in complete organoid media. This effect was found to be functionally significant as cells grown in organoid media were more sensitive to treatment with chemotherapy, likely mediated by the presence of TGF‐β inhibitors in the media.[ 26 ] These studies emphasize the importance of microenvironmental features in determining cell phenotypes and demonstrate the utility of single cell analysis for the characterization of heterogeneous PDO properties under different conditions.
The application of single cell technologies to PDOs also enables unique analyses, such as cell clustering, trajectory analysis, and ligand–receptor interaction analysis, that can be used to explore the mechanisms underlying the development of tumor cell heterogeneity. In an epigenomic approach, Tedesco et al. used single cell genome and epigenome by transposases sequencing (scGET‐seq), a technique that profiles both open and closed chromatin, to profile epigenomic heterogeneity in CRC PDOs. This technique is also compatible with chromatin velocity analysis to explore epigenetic transitions during differentiation and other biological transitions, though this analysis method has only been applied to cell lines thus far.[ 196 ] However, most of these more complex cell state analyses to date have been performed using scRNA‐seq data. For example, Wanigasooriya et al. used clustering and pathway analysis of scRNA‐seq data to explore the effect of radiation treatment on rectal cancer PDOs and identified the enrichment of stem cell marker‐expressing cells and the upregulation of DNA repair and mTOR signaling pathways following radiation treatment.[ 197 ] Krieger et al. used scRNA‐seq to identify a differentiation trajectory for the subpopulations of cells present in PDAC PDOs, which showed that PDO growth was likely sustained by a large pool of cycling cells that differentiated to non‐proliferating secretory cells. They also found that this differentiation trajectory was preserved between primary and metastatic sites, suggesting metastatic lesions share critical and potentially targetable aspects of the primary tumor.[ 198 ] Trajectory analysis has also been used to explore tumorigenesis in genetically engineered murine organoid models featuring driver mutations characteristic of early‐stage tumors.[ 199 ] With regards to exploring cell–cell interactions, Chen et al. investigated the transcriptional heterogeneity between drug‐responsive and drug‐resistant CRC PDOs. Ligand–receptor analysis—a method that infers a list of possible ligand–receptor pairs between two cell populations from single‐cell gene expression data as an indicator of cell–cell interactions—showed enrichment of unique interactions that differed between the drug‐responsive and drug‐resistant PDOs, which may be an interesting basis for future study of resistance.[ 200 ] Finally, Zhao et al. integrated both trajectory and ligand–receptor analyses in a study of hepatobiliary tumor PDOs to identify cells that may sustain PDO growth and highlight interactions between cells along different trajectories that may contribute to drug resistance.[ 201 ] These studies demonstrate how single cell technologies can be used to elucidate biological mechanisms underpinning tumor cell heterogeneity that cannot be efficiently explored with bulk experimental techniques.
High‐dimensional protein‐level single cell analysis, with technologies such as CyTOF, is another valuable approach for characterizing the heterogeneity of tumor cell phenotypes determined by protein markers and for exploring aspects of signaling pathway activation that cannot be assessed with transcriptomics. To this end, Berg et al. used CyTOF to profile the protein expression of endometrial cancer PDOs and identified that diverse tumor subtypes were represented in the PDO cohort, both within and between patients. Single cell analysis allowed quantification of the proportion of distinct cell phenotypes in the PDO cultures and revealed that there were some differences in the expression of hormone receptors between source tumors and PDOs that suggested the presence of subclones of tumor cells. Furthermore, some of these expression patterns evolved over time in culture.[ 202 ] Uhlitz et al. used CyTOF to explore the activation of major signaling pathways and to complement an associated scRNA‐seq analysis. After trajectory analysis of the transcriptomic data showed MAPK target gene activity was correlated with the evolution of cell phenotypes in CRC PDOs, subsequent CyTOF analysis showed that treatment with MAPK pathway inhibitors had variable effects on signaling pathway activation dependent on the mutational status of the PDOs. Follow‐up scRNA‐seq analysis of the treated PDOs demonstrated these signaling changes translated into changes in gene expression.[ 203 ] Similar integration of scRNA‐seq and CyTOF data has also been used for non‐tumor organoids.[ 204 ] These studies demonstrate how CyTOF could be used to effectively characterize PDOs and highlight how multiomics analyses can enable further exploration of processes that cannot be fully assessed at the transcriptome level alone.
3.3. Single Cell Analysis of PDO‐Based 3D In Vitro Models of the TME
The integration of single cell analysis techniques with PDO‐based 3D in vitro models represents an opportunity to explore the intersection of microenvironmental and tumor cell heterogeneity more comprehensively. Several studies have effectively used single cell technologies to profile human iPSC‐derived organoids and murine tumor organoids in complex 3D in vitro models, highlighting the relevance and feasibility of this approach.[ 78 , 158 , 159 , 205 , 206 , 207 , 208 , 209 ] In one notable example, Qin et al. created a co‐culture model of murine CRC organoids with colonic fibroblasts and macrophages in Matrigel domes and used CyTOF to explore the effect of oncogenic mutations and microenvironmental cues on cancer cell signaling mediated by post‐translational modifications.[ 205 ] Thus, extending single cell analysis to complex PDO‐based models will undoubtedly improve our characterization of the heterogeneous cell types present in 3D in vitro systems and our understanding of cell–cell and cell‐TME interactions.
A few studies to date have begun to report work at this exciting technological interface. First, single cell analysis of complex PDO‐based models has been used to profile specific compartments of the TME. For example, Neal et al. created a Transwell‐based air‐liquid interface PDO culture of renal cell carcinoma that preserved endogenous immune cells and conducted single cell T‐cell receptor profiling that highlighted the conservation of T‐cell receptor heterogeneity between the source tumor and the PDO model.[ 64 ] Meng et al. created a co‐culture model of PBMCs and PDAC PDOs to generate organoid primed T‐cells and performed CyTOF on the immune compartment of the co‐culture. This analysis demonstrated heterogeneous proportions of immune cell types within the co‐culture between patient samples and the generation of organoid‐primed subpopulations following co‐culture.[ 171 ] Dekkers et al. used a co‐culture model of breast cancer PDOs and metabolome‐sensing engineered T‐cells to create a multispectral 3D high‐content imaging‐based platform named “BEHAV3D” that enabled automatic live tracking of individual T‐cell and PDO interactions. This approach highlighted behavioral heterogeneity in the T‐cells and interpatient heterogeneity in sensitivity to engineered T‐cell killing. T‐cells were then sorted based on identified behavioral patterns and scRNA‐seq was performed, which revealed significant changes in their transcriptomes after co‐culture with organoids and a potential role for interferon signaling in mediating T‐cell killing efficacy.[ 85 ] These studies highlight that complex PDO‐based models can also be used to study the heterogeneity of non‐tumor cells in a personalized approach, which may be valuable for using these models to develop and screen immunotherapies.
In more comprehensive studies, single cell analysis has been used to concurrently profile multiple cell types in PDO‐based systems, which is particularly valuable for exploring cell–cell interactions and the interplay between microenvironmental features. Choi et al. created a PDAC PDO co‐culture model with HUVECs and autologous immune cells and used scRNA‐seq to probe possible interactions between tumor epithelial cells and endothelial cells. This analysis implicated Notch pathway activation in endothelial cells by tumor cells as an important player in maintaining tumor cell stemness and metastasis.[ 210 ] Schuth et al. characterized a PDAC PDO co‐culture model with patient matched CAFs using scRNA‐seq and showed changes in CAF and PDAC PDO cell phenotypes in co‐culture compared to monoculture. Furthermore, ligand–receptor analysis identified several possible interactions between PDO cells and CAFs that may contribute to the upregulation of EMT gene expression observed in PDOs co‐cultured with CAFs.[ 81 ] Importantly, in another study using scRNA‐seq analysis of a PDAC PDO‐CAF co‐culture model, Kinny‐Koster et al. demonstrated that this co‐culture model could be used to validate interactions identified from scRNA‐seq analysis of patient tumors, reiterating the potential of complex 3D in vitro models as an experimental tool for both biological discovery and validation.[ 170 ] This paradigm extends to exploring the interactions between tumor cells and surrounding normal tissue. Krieger et al. and Pine et al. created models of GBM invasion by co‐culturing primary tumor cells and tumor stem cells, respectively, with iPSC‐derived cerebral organoids and characterized the models with scRNA‐seq. Pine et al. demonstrated that tumor stem cells co‐cultured with normal cerebral organoids featured a more heterogeneous transcriptomic landscape with enriched expression of critical genes related to stemness, invasiveness, and metabolic reprogramming.[ 62 ] Krieger et al. showed that tumor cells co‐cultured with normal cerebral organoids exhibited invasive phenotypes and had increased expression of genes associated with neuronal migration and growth regulation. Furthermore, ligand–receptor analysis revealed several potential interactions between the GBM and neural progenitor cells that were consistently expressed across patients, which may be valuable for targeting tumor invasiveness.[ 61 ] Finally, though most work has focused on tumor‐stroma interactions, single cell analysis can also be valuable for understanding the role of microenvironmental features, such as hypoxia and tissue architecture, in driving heterogeneity. In work by our group, Cadavid & Latour et al. applied CyTOF to a fibroblast‐PDAC PDO co‐culture in the TRACER platform, where the modular layered design allowed specific tissue architectures to be simulated and cell‐defined oxygen gradients to form. They found that tissue architecture impacted tumor cell phenotypes with PDOs predominantly driving oxygen gradients and influencing the expression of phenotypic markers in fibroblasts. Interestingly, there were some notable differences in expression between the cells retrieved from the hypoxic layers of the TRACER co‐culture and those cultured in a hypoxia chamber alone, highlighting the importance of modeling complex relationships between cell types in vitro.[ 146 ] Together, these studies demonstrate how advanced analytical tools and novel disease‐relevant models can be leveraged together to characterize experimental tools, explore cell–cell interactions in the TME, and probe the interactions between the different aspects of heterogeneity in cancer. Selected examples with their experimental considerations and limitations are summarized in Table 1 to provide an overview of the types of studies that have been reported to date.
Table 1.
Selected biological insights, experimental considerations and limitations of studies that have applied single cell analysis to PDO‐based 3D in vitro models of the TME.
| Tumor feature of interest | Model selection | Biological insights from single cell analysis and other key findings | Selected experimental considerations & limitations |
|---|---|---|---|
| Tumor immune microenvironment | Transwell – multiple cancers, air‐liquid interface (ALI) PDO culture to preserve endogenous immune cells[ 64 ] |
Single cell 5′ VDJ and 5′ RNA‐seq: ALI culture preserved immune cell and T‐cell receptor (TCR) heterogeneity of source tumor Most frequent organoid TCR clonotypes were in exhausted T cells Other findings: T‐cells in the PDOs captured response to PD‐1 immune checkpoint blockade |
Exogenous growth factors used to support epithelial cell growth Immune and fibroblast stromal cells decline over time (≈60 days maximum) Organoids from early‐stage tumors (surgical resection samples) |
| Tumor immune microenvironment | PDAC PDOs co‐cultured with autologous PBMCs or organoid‐primed T cells in plates[ 171 ] |
CyTOF: Model enabled ex vivo expansion of organoid‐primed T cells with strong anti‐tumor effects Organoid primed T cells showed differences in checkpoint protein expression between patients Other findings: T‐cell receptors from organoid primed T‐cells can confer tumor recognition |
Co‐culture used T cell media with minimal exogenous factors PDOs and PBMCs were co‐cultured in flat bottom plates without Matrigel – minimal 3D structure in co‐culture but no foreign antigens |
| Tumor immune interactions | Breast cancer PDOs co‐cultured with metabolic sensing engineered T‐cells (TEGs) in well plates with 2.5% BME[ 85 ] |
High content live 3D imaging and scRNA‐seq: TEGs exhibited 9 different behavioral patterns when co‐cultured with PDOs PDOs induced widespread transcriptional changes in TEGs compared to baseline Gene signature for TEGs with strong anti‐tumor activity overlapped with in vivo signature of cytotoxic tumor infiltrating lymphocytes |
Blend of T cell and organoid media used for co‐culture to support both cell populations Minimal BME used to enable imaging, reduced ECM cues and 3D structure |
| Plasticity of cancer initiating cells (CICs) | PDAC PDOs co‐cultured with human umbilical vein endothelial cells (HUVECs) and autologous PBMCs in ULA plates with supplemental Matrigel[ 210 ] |
scRNA‐seq: PDOs co‐cultured with immune and endothelial cells had larger CIC populations Identified possible cell–cell interactions between tumor cells and endothelial cells related to stemness and metastasis |
Basal medium with serum used for co‐culture, minimizing impact of exogenous factors Differentiation factors and selection used to ensure desired tumor cell population Fibroblasts not included in co‐culture model |
| Effect of CAFs on tumor cell response to therapy | PDAC PDOs co‐cultured with patient‐matched CAFs in BME domes[ 81 ] |
scRNA‐seq: CAFs co‐cultured with organoids have increased expression of inflammatory pathways PDOs co‐cultured with CAFs have increased expression of EMT genes, may be driven by CD44 interaction with several CAF ligands Other findings: CAFs increased PDO resistance to several chemotherapy drugs |
Co‐culture model was maintained in a collagen/BME blend and media containing minimal supplemental factors PDO:CAF ratio of 1:1 Validated co‐localization and spatial proximity of potential receptor‐ligand interaction pairs in source tumor samples to support in vivo relevance of the model |
| Tumor cell‐CAF interactions | PDAC PDOs co‐cultured with patient‐matched CAFs in BME domes[ 170 ] |
scRNA‐seq: Significant transcriptional plasticity identified during co‐culture, with changes in tumor cell subtype and CAF phenotype marker gene expression compared to monoculture CAFs proposed to promote inflammatory signaling in PDOs Co‐culture model could be used to validate findings from primary tumor sample scRNA‐seq data |
Organoid media used for co‐culture, exogenous factors may impact cell phenotypes PDO:CAF ratio of 1:10 scRNA‐seq performed after 12 h of co‐culture, gene expression patterns change over time in co‐culture Immune cells not included in this model |
| Tumor cell invasion | Primary GBM cells co‐cultured with iPSC‐derived cerebral organoids in ULA plates[ 61 ] |
scRNA‐seq: GBM cells exhibited broad transcriptomic changes in response to co‐culture with normal cerebral organoids Possible ligand–receptor pairs between neural progenitor cells and GBM cells were enriched for genes involved in neuron projection development and ECM proteins Other findings: GBM cells formed and invaded through organoid surface |
Neural maintenance media used for co‐culture; equally suitable for both cell populations iPSC organoid maturation can take up to 24 days; modified workflow allowed for sufficient maturation in 7 days to improve throughput scRNA‐seq performed after 3 days of co‐culture, other mature cell types absent from cerebral organoids due to 7 day condensed workflow |
| Tumor cell invasion | Primary GBM cells co‐cultured with iPSC‐derived cerebral organoids in plates[ 62 ] |
scRNA‐seq: GBM‐cerebral organoid co‐cultures were more transcriptionally similar to primary cells than PDOs Co‐culture model featured higher proportion of proneural cells and a smaller proportion of hypoxic cells compared to tumor PDOs GBM cell states were a direct consequence of the microenvironment in the co‐culture model |
Co‐culture media is equally suitable for both cell populations Comparable transcriptomic profile to xenograft and primary samples at lower cost, higher throughput workflow iPSC‐derived cerebral organoids require up to 21 days to generate; co‐culture maintenance possible for up to 14 additional days |
| Effect of tissue architecture on cell phenotypes | PDAC PDOs co‐cultured with PSCs in TRACER[ 146 ] |
CyTOF: Graded changes in expression of phenotypic markers observed across layers of TRACER that differ with architecture Balance of hypoxia and other microenvironmental conditions likely contribute to determination of some cell phenotypes in TRACER Changes in cell phenotype are likely affected by both direct cell contact and paracrine signaling |
Media and culture protocol optimized for co‐culture to minimize effect of exogenous factors on PSCs while supporting PDO growth ECM and cell density optimized by cell type, facilitated by modular design of TRACER Careful optimization required to verify formation of expected microenvironmental gradients and ensure reproducible cell responses |
The application of single cell analysis technologies to PDO‐based models will continue to grow as these techniques and tools for their analysis become more accessible. In addition to the tools described above, single cell epigenomics using technologies such as scATAC‐seq remains a largely unexplored frontier for tumor PDOs that may be an interesting area for future work. scATAC‐seq has been used in several studies of iPSC‐derived organoids to assess regulatory networks, often in conjunction with scRNA‐seq.[ 211 , 212 , 213 ] Furthermore, spatial transcriptomics can be used to complement single cell analyses. Though this technology has largely been optimized for fresh‐frozen tissue sections, it is possible to prepare PDOs in hydrogels for spatial transcriptomic investigations where preserving the tissue structure and cellular organization within the hydrogel is desired.[ 214 , 215 , 216 ] However, where spatial transcriptomics is not feasible, models that isolate individual organoids, such as micromolded ECM microwells,[ 107 ] and spatially‐resolved models, such as TRACER and other stacked paper‐supported models,[ 145 , 146 ] may be valuable to ensure analysis of PDOs with phenotypes of interest and minimize the loss of information related to tissue organization. Additionally, though not widely used for analysis of PDOs at present, emerging tools for spatial proteomics such as imaging mass cytometry and matrix‐assisted laser desorption/ionization mass spectrometry (MALDI‐MS) may prove valuable for spatial single cell analysis of complex PDO‐based 3D in vitro models in the future.[ 216 , 217 , 218 ]
Multiomic analyses of PDO‐based 3D in vitro models using both popular and emerging single cell technologies will also likely provide insight not attainable with profiling of primary tumor samples. For example, this approach could expand our capacity for research across the disease spectrum by allowing experimental access to tumor samples that would likely not have sufficient quality for multiple single cell analyses. Additionally, defined TME features can be recreated in PDO‐based 3D in vitro models, allowing multiomic analysis to provide deep insight into biological processes that cannot be isolated in vivo. Accordingly, such integrated multiomic single cell analysis of PDO‐based models promises to expand our understanding of factors contributing to tumor heterogeneity, especially as they pertain to disease progression, microenvironmental adaptation, response to therapy, and potential novel treatment strategies.
4. Conclusions and Outlook
As PDOs are now established as an effective in vitro model for both interpatient and tumor cell heterogeneity, moving toward more complex models that better represent microenvironmental heterogeneity is needed to further explore the critical interactions that occur in the TME. Several strategies for doing so have been established ranging from simple culture of PDOs in synthetic ECMs that reduce the variability associated with Matrigel, to co‐culture models of PDOs with CAFs and immune cells, to engineered microfluidic and paper‐supported devices that facilitate modeling of cell‐consumption derived oxygen and molecular gradients. These models collectively offer in vitro approaches to evaluating the impact of microenvironmental heterogeneity on cell phenotypes, though individual models have varying compatibility with standard experimental techniques and unique advantages, so careful consideration is required to select an appropriate model. By creating well‐considered in vitro models using PDOs as a source of tumor cells, interpatient, microenvironmental, and tumor cell heterogeneity can be effectively recapitulated and enable investigations that are unfeasible in other complex experimental systems.
In parallel, the growth of single cell technologies and their complementary analysis tools has substantially expanded our ability to characterize microenvironmental and tumor cell heterogeneity. Tools such as scRNA‐seq and CyTOF have proven valuable for proposing potential evolutionary trajectories, cell–cell interactions, and signaling pathway activation patterns that may be relevant for disease progression and response to therapy. Other single cell technologies that have not yet been widely applied to tumor PDOs may also prove valuable for identifying important biological mechanisms, such as the use of scATAC‐seq for the identification of transcription regulation mechanisms. Accordingly, applying single cell technologies to the analysis of complex PDO‐based 3D in vitro models is an exciting direction for the future of both fields.
To date, the few studies at the intersection of PDO‐based 3D in vitro models and single cell analysis have profiled the heterogeneity of stromal cell phenotypes in PDO co‐culture models, examined tumor–stroma interactions that could explain important disease phenomena, and provided insight into the effect of tissue architecture and microenvironmental gradients on cell phenotypes. Given the increasing understanding of tumor–TME interactions and their significance in cancer, there is great potential in this area for future work to elucidate the impacts of the TME on tumor heterogeneity. For example, the effect of hypoxia and other microenvironmental pressures on PDO heterogeneity has largely been unexplored. Alternatively, open questions also remain regarding the heterogeneity of tumor–immune interactions in the TME; PDO‐immune co‐cultures are starting to be used to explore these interactions in an all‐human system that overcomes the limitations associated with murine models. In exploring these and other areas, single cell analysis of PDO‐based models is a powerful strategy for unbiased discovery of novel tumor–TME interactions, their effect on tumor and stromal cell phenotypes, and the mechanisms underlying tumor heterogeneity. To maximize the value of this approach (Figure 4 ), the parameters of PDO‐based models—including model selection, media composition, and cell density—should be carefully optimized to ensure reproducibility and recapitulation of relevant tumor features. Following parameter optimization, the model should be benchmarked using conventional experimental techniques to verify disease‐relevant cell phenotypes are reliably captured in the model prior to single cell analysis. It is worth noting that given the time required to develop and validate an appropriate model as well as the cost of single cell analysis, this approach is likely limited to research applications with minimal opportunity for use in clinical treatment optimization in the near term. Nonetheless, looking to the future, the opportunity to explore the interactions between interpatient, microenvironmental, and tumor cell heterogeneity continues to grow as PDOs for an increasing number of tumors become available alongside new 3D in vitro platforms and advanced experimental technologies and analysis methods. By integrating the tools available to model and explore heterogeneity in the TME, this approach could pave the way to the identification and development of treatment strategies that account for TME complexity and improve therapeutic efficacy in cancer.
Figure 4.
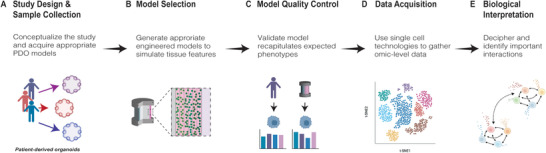
A possible workflow for multiomic single‐cell analysis of PDO‐based models to explore tumor heterogeneity in vitro. Formulation of the biological question (A) guides the appropriate selection of a tissue engineered model system (B). Quality control (C) is essential to ensuring validity of the results. Once established, the PDO‐based model can be used to generate samples for multiomic single cell analysis (D). Data from single cell analysis should be interpreted in the context of model features and known information from in vivo tumors to decipher important aspects of tumor biology (E).
Conflict of Interest
The authors declare no conflict of interest.
Acknowledgements
BioRender was utilized to produce schemata elements. This project was funded by a Canadian Institute of Health Research project grant (PJT‐17528) to A.P.M. and a Vanier Canada Graduate Scholarship to N.L‐B.
Biographies
Natalie Landon‐Brace is an M.D./Ph.D. candidate at the University of Toronto; she completed her Ph.D. at the Institute of Biomedical Engineering. Her research focused on leveraging an organoid‐based 3D in vitro model to explore the impact of microenvironmental conditions on tumour cell heterogeneity.

Nancy T. Li is a Ph.D. candidate in chemical engineering and applied chemistry at the University of Toronto. Her research is focused on the development of a high‐throughput paper scaffold‐based platform for modeling tumour organoid drug response.

Alison P. McGuigan is a professor in Chemical Engineering and Applied Chemistry and the Institute for Biomaterials and Biomedical Engineering at University of Toronto. Her research group is focused on engineering in vitro tissue platforms that can generate physiologically relevant and high‐value data for understanding fundamental tissue biology and identification of novel therapeutics.

Landon‐Brace N., Li N. T., McGuigan A. P., Exploring New Dimensions of Tumor Heterogeneity: The Application of Single Cell Analysis to Organoid‐Based 3D In Vitro Models. Adv. Healthcare Mater. 2023, 12, 2300903. 10.1002/adhm.202300903
References
- 1. Honkala A., Malhotra S. V., Kummar S., Junttila M. R., Nat. Rev. Drug Discovery 2022, 21, 99. [DOI] [PubMed] [Google Scholar]
- 2. Haykal M. M., Nahmias C., Varon C., Martin O. C. B., Front Cell Dev Biol 2020, 8, 606039. [DOI] [PMC free article] [PubMed] [Google Scholar]
- 3. Rodenhizer D., Dean T., D'Arcangelo E., McGuigan A. P., Adv. Healthcare Mater. 2018, 7, 1701174. [DOI] [PubMed] [Google Scholar]
- 4. Breslin S., O'Driscoll L., Drug Discov Today 2013, 18, 240. [DOI] [PubMed] [Google Scholar]
- 5. Jamal‐Hanjani M., Quezada S. A., Larkin J., Swanton C., Clin. Cancer Res. 2015, 21, 1258. [DOI] [PMC free article] [PubMed] [Google Scholar]
- 6. Vogelstein B., Papadopoulos N., Velculescu V. E., Zhou S., Diaz Jr L. A., Kinzler K. W., Science 2013, 339, 1546. [DOI] [PMC free article] [PubMed] [Google Scholar]
- 7. Dagogo‐Jack I., Shaw A. T., Nat. Rev. Clin. Oncol. 2018, 15, 81. [DOI] [PubMed] [Google Scholar]
- 8. Grünwald B. T., Devisme A., Andrieux G., Vyas F., Aliar K., Mccloskey C. W., Macklin A., Jang G. H., Denroche R., Romero J. M., Bavi P., Bronsert P., Notta F., O'kane G., Wilson J., Knox J., Tamblyn L., Udaskin M., Radulovich N., Fischer S. E., Boerries M., Gallinger S., Kislinger T., Khokha R., Cell 2021, 184, 5577. [DOI] [PubMed] [Google Scholar]
- 9. Patel A. P., Tirosh I., Trombetta J. J., Shalek A. K., Gillespie S. M., Wakimoto H., Cahill D. P., Nahed B. V., Curry W. T., Martuza R. L., Louis D. N., Rozenblatt‐Rosen O., Suvà M. L., Regev A., Bernstein B. E., Science 2014, 344, 1396. [DOI] [PMC free article] [PubMed] [Google Scholar]
- 10. Lin Z., Meng X., Wen J., Corral J. M., Andreev D., Kachler K., Schett G., Chen X., Bozec A., Front Oncol 2020, 10, 596493. [DOI] [PMC free article] [PubMed] [Google Scholar]
- 11. Van Dijk E., Van Den Bosch T., Lenos K. J., El Makrini K., Nijman L. E., Van Essen H. F. B., Lansu N., Boekhout M., Hageman J. H., Fitzgerald R. C., Punt C. J. A., Tuynman J. B., Snippert H. J. G., Kops G. J. P. L., Medema J. P., Ylstra B., Vermeulen L., Miedema D. M., Nat. Commun. 2021, 12, 3188. [DOI] [PMC free article] [PubMed] [Google Scholar]
- 12. Mroz E. A., Tward A. D., Pickering C. R., Myers J. N., Ferris R. L., Rocco J. W., Cancer 2013, 119, 3034. [DOI] [PMC free article] [PubMed] [Google Scholar]
- 13. Mcdonald K.‐A., Kawaguchi T., Qi Q., Peng X., Asaoka M., Young J., Opyrchal M., Yan L., Patnaik S., Otsuji E., Takabe K., Ann Surg Oncol 2019, 26, 2191. [DOI] [PMC free article] [PubMed] [Google Scholar]
- 14. Ke X., Shen L., Front. Lab. Med. 2017, 1, 69. [Google Scholar]
- 15. Marusyk A., Janiszewska M., Polyak K., Cancer Cell 2020, 37, 471. [DOI] [PMC free article] [PubMed] [Google Scholar]
- 16. Fischer M., Trends Cancer Res. 2021, 7, 12. [DOI] [PubMed] [Google Scholar]
- 17. Calandrini C., Schutgens F., Oka R., Margaritis T., Candelli T., Mathijsen L., Ammerlaan C., Van Ineveld R. L., Derakhshan S., De Haan S., Dolman E., Lijnzaad P., Custers L., Begthel H., Kerstens H. H. D., Visser L. L., Rookmaaker M., Verhaar M., Tytgat G. A. M., Kemmeren P., De Krijger R. R., Al‐Saadi R., Pritchard‐Jones K., Kool M., Rios A. C., Van Den Heuvel‐Eibrink M. M., Molenaar J. J., Van Boxtel R., Holstege F. C. P., Clevers H., et al., Nat. Commun. 2020, 11, 1310. [DOI] [PMC free article] [PubMed] [Google Scholar]
- 18. Tiriac H., Belleau P., Engle D. D., Plenker D., Deschênes A., Somerville T. D. D., Froeling F. E. M., Burkhart R. A., Denroche R. E., Jang G.‐H., Miyabayashi K., Young C. M., Patel H., Ma M., Lacomb J. F., Palmaira R. L. D., Javed A. A., Huynh J. C., Johnson M., Arora K., Robine N., Shah M., Sanghvi R., Goetz A. B., Lowder C. Y., Martello L., Driehuis E., Lecomte N., Askan G., Iacobuzio‐Donahue C. A., et al., Cancer Discov 2018, 8, 1112. [DOI] [PMC free article] [PubMed] [Google Scholar]
- 19. Kopper O., De Witte C. J., Lõhmussaar K., Valle‐Inclan J. E., Hami N., Kester L., Balgobind A. V., Korving J., Proost N., Begthel H., Van Wijk L. M., Revilla S. A., Theeuwsen R., Van De Ven M., Van Roosmalen M. J., Ponsioen B., Ho V. W. H., Neel B. G., Bosse T., Gaarenstroom K. N., Vrieling H., Vreeswijk M. P. G., Van Diest P. J., Witteveen P. O., Jonges T., Bos J. L., Van Oudenaarden A., Zweemer R. P., Snippert H. J. G., Kloosterman W. P., et al., Nat. Med. 2019, 25, 838. [DOI] [PubMed] [Google Scholar]
- 20. Lee S. H., Hu W., Matulay J. T., Silva M. V., Owczarek T. B., Kim K., Chua C. W., Barlow L. J., Kandoth C., Williams A. B., Bergren S. K., Pietzak E. J., Anderson C. B., Benson M. C., Coleman J. A., Taylor B. S., Abate‐Shen C., Mckiernan J. M., Al‐Ahmadie H., Solit D. B., Shen M. M., Cell 2018, 173, 515. [DOI] [PMC free article] [PubMed] [Google Scholar]
- 21. Boj S. F., Hwang C.‐I., Baker L. A., Chio I. I. C., Engle D. D., Corbo V., Jager M., Ponz‐Sarvise M., Tiriac H., Spector M. S., Gracanin A., Oni T., Yu K. H., Van Boxtel R., Huch M., Rivera K. D., Wilson J. P., Feigin M. E., Öhlund D., Handly‐Santana A., Ardito‐Abraham C. M., Ludwig M., Elyada E., Alagesan B., Biffi G., Yordanov G. N., Delcuze B., Creighton B., Wright K., Park Y., et al., Cell 2015, 160, 324. [DOI] [PMC free article] [PubMed] [Google Scholar]
- 22. Broutier L., Mastrogiovanni G., Verstegen M. M., Francies H. E., Gavarró L. M., Bradshaw C. R., Allen G. E., Arnes‐Benito R., Sidorova O., Gaspersz M. P., Georgakopoulos N., Koo B.‐K., Dietmann S., Davies S. E., Praseedom R. K., Lieshout R., Ijzermans J. N. M., Wigmore S. J., Saeb‐Parsy K., Garnett M. J., Van Der Laan L. J., Huch M., Nat. Med. 2017, 23, 1424. [DOI] [PMC free article] [PubMed] [Google Scholar]
- 23. Sachs N., De Ligt J., Kopper O., Gogola E., Bounova G., Weeber F., Balgobind A. V., Wind K., Gracanin A., Begthel H., Korving J., Van Boxtel R., Duarte A. A., Lelieveld D., Van Hoeck A., Ernst R. F., Blokzijl F., Nijman I. J., Hoogstraat M., Van De Ven M., Egan D. A., Zinzalla V., Moll J., Boj S. F., Voest E. E., Wessels L., Van Diest P. J., Rottenberg S., Vries R. G. J., Cuppen E., et al., Cell 2018, 172, 373. [DOI] [PubMed] [Google Scholar]
- 24. Kim M., Mun H., Sung C. O., Cho E. J., Jeon H.‐J., Chun S.‐M., Jung D. J., Shin T. H., Jeong G. S., Kim D. K., Choi E. K., Jeong S.‐Y., Taylor A. M., Jain S., Meyerson M., Jang S. J., Nat. Commun. 2019, 10, 3991. [DOI] [PMC free article] [PubMed] [Google Scholar]
- 25. Hill S. J., Decker B., Roberts E. A., Horowitz N. S., Muto M. G., Worley M. J., Feltmate C. M., Nucci M. R., Swisher E. M., Nguyen H., Yang C., Morizane R., Kochupurakkal B. S., Do K. T., Konstantinopoulos P. A., Liu J. F., Bonventre J. V., Matulonis U. A., Shapiro G. I., Berkowitz R. S., Crum C. P., D'andrea A. D., Cancer Discov 2018, 8, 1404. [DOI] [PMC free article] [PubMed] [Google Scholar]
- 26. Raghavan S., Winter P. S., Navia A. W., Williams H. L., Denadel A., Lowder K. E., Galvez‐Reyes J., Kalekar R. L., Mulugeta N., Kapner K. S., Raghavan M. S., Borah A. A., Liu N., Väyrynen S. A., Costa A. D., Ng R. W. S., Wang J., Hill E. K., Ragon D. Y., Brais L. K., Jaeger A. M., Spurr L. F., Li Y. Y., Cherniack A. D., Booker M. A., Cohen E. F., Tolstorukov M. Y., Wakiro I., Rotem A., Johnson B. E., et al., Cell 2021, 184, 6119. [DOI] [PMC free article] [PubMed] [Google Scholar]
- 27. Drost J., Clevers H., Nat. Rev. Cancer 2018, 18, 407. [DOI] [PubMed] [Google Scholar]
- 28. LeSavage B. L., Suhar R. A., Broguiere N., Lutolf M. P., Heilshorn S. C., Nat. Mater. 2022, 21, 143. [DOI] [PMC free article] [PubMed] [Google Scholar]
- 29. Lo Y.‐H., Karlsson K., Kuo C. J., Nat Cancer 2020, 1, 761. [DOI] [PMC free article] [PubMed] [Google Scholar]
- 30. Porter R. J., Murray G. I., McLean M. H., Br. J. Cancer 2020, 123, 1209. [DOI] [PMC free article] [PubMed] [Google Scholar]
- 31. Lawson D. A., Kessenbrock K., Davis R. T., Pervolarakis N., Werb Z., Nat. Cell Biol. 2018, 20, 1349. [DOI] [PMC free article] [PubMed] [Google Scholar]
- 32. Longo S. K., Guo M. G., Ji A. L., Khavari P. A., Nat. Rev. Genet. 2021, 22, 627. [DOI] [PMC free article] [PubMed] [Google Scholar]
- 33. D'Arcangelo E., Wu N. C., Cadavid J. L., McGuigan A. P., Br. J. Cancer 2020, 122, 931. [DOI] [PMC free article] [PubMed] [Google Scholar]
- 34. Chen X., Song E., Nat. Rev. Drug Discovery 2019, 18, 99. [DOI] [PubMed] [Google Scholar]
- 35. Pittet M. J., Michielin O., Migliorini D., Nat. Rev. Clin. Oncol. 2022, 19, 402. [DOI] [PubMed] [Google Scholar]
- 36. Winkler J., Abisoye‐Ogunniyan A., Metcalf K. J., Werb Z., Nat. Commun. 2020, 11, 5120. [DOI] [PMC free article] [PubMed] [Google Scholar]
- 37. Huber M., Brehm C. U., Gress T. M., Buchholz M., Alashkar Alhamwe B., von Strandmann E. P., Slater E. P., Bartsch J. W., Bauer C., Lauth M., Int. J. Mol. Sci. 2020, 21, 7307. [DOI] [PMC free article] [PubMed] [Google Scholar]
- 38. Davis R. J., Van Waes C., Allen C. T., Oral Oncol 2016, 58, 59. [DOI] [PMC free article] [PubMed] [Google Scholar]
- 39. Labani‐Motlagh A., Ashja‐Mahdavi M., Loskog A., Front Immunol 2020, 11, 940. [DOI] [PMC free article] [PubMed] [Google Scholar]
- 40. Petrova V., Annicchiarico‐Petruzzelli M., Melino G., Amelio I., Oncogenesis 2018, 7, 10. [DOI] [PMC free article] [PubMed] [Google Scholar]
- 41. Heddleston J. M., Li Z., Lathia J. D., Bao S., Hjelmeland A. B., Rich J. N., Br. J. Cancer 2010, 102, 789. [DOI] [PMC free article] [PubMed] [Google Scholar]
- 42. Emami Nejad A., Najafgholian S., Rostami A., Sistani A., Shojaeifar S., Esparvarinha M., Nedaeinia R., Haghjooy Javanmard S., Taherian M., Ahmadlou M., Salehi R., Sadeghi B., Manian M., Cancer Cell Int. 2021, 21, 62. [DOI] [PMC free article] [PubMed] [Google Scholar]
- 43. Chang W. H., Lai A. G., Cancer Lett 2020, 487, 34. [DOI] [PubMed] [Google Scholar]
- 44. Li N. T., Co I. L., Landon‐Brace N., Latour S., McGuigan A. P., in Biomaterials for 3D Tumour Modeling (Eds: Kundu S. C., Reis R. L.), Elsevier, New York, 2020. [Google Scholar]
- 45. Carter E. P., Roozitalab R., Gibson S. V., Grose R. P., Trends Cancer Res. 2021, 7, 1033. [DOI] [PubMed] [Google Scholar]
- 46. Fernando K., Kwang L. G., Lim J. T. C., Fong E. L. S., Biomater. Sci. 2021, 9, 2362. [DOI] [PubMed] [Google Scholar]
- 47. Mehta P., Rahman Z., Ten Dijke P., Boukany P. E., Trends Cancer Res. 2022, 8, 683. [DOI] [PubMed] [Google Scholar]
- 48. Regmi S., Poudel C., Adhikari R., Luo K. Q., Biosensors 2022, 12, 459. [DOI] [PMC free article] [PubMed] [Google Scholar]
- 49. Dijkstra K. K., Cattaneo C. M., Weeber F., Chalabi M., Van De Haar J., Fanchi L. F., Slagter M., Van Der Velden D. L., Kaing S., Kelderman S., Van Rooij N., Van Leerdam M. E., Depla A., Smit E. F., Hartemink K. J., De Groot R., Wolkers M. C., Sachs N., Snaebjornsson P., Monkhorst K., Haanen J., Clevers H., Schumacher T. N., Voest E. E., Cell 2018, 174, 1586. [DOI] [PMC free article] [PubMed] [Google Scholar]
- 50. Cattaneo C. M., Dijkstra K. K., Fanchi L. F., Kelderman S., Kaing S., van Rooij N., van den Brink S., Schumacher T. N., Voest E. E., Nat. Protoc. 2020, 15, 15. [DOI] [PMC free article] [PubMed] [Google Scholar]
- 51. Navone N. M., Van Weerden W. M., Vessella R. L., Williams E. D., Wang Y., Isaacs J. T., Nguyen H. M., Culig Z., Van Der Pluijm G., Rentsch C. A., Marques R. B., De Ridder C. M. A., Bubendorf L., Thalmann G. N., Brennen W. N., Santer F. R., Moser P. L., Shepherd P., Efstathiou E., Xue H., Lin D., Buijs J., Bosse T., Collins A., Maitland N., Buzza M., Kouspou M., Achtman A., Taylor R. A., Risbridger G., et al., Prostate 2018, 78, 1262. [DOI] [PubMed] [Google Scholar]
- 52. Vinci M., Gowan S., Boxall F., Patterson L., Zimmermann M., Court W., Lomas C., Mendiola M., Hardisson D., Eccles S. A., BMC Biol. 2012, 10, 29. [DOI] [PMC free article] [PubMed] [Google Scholar]
- 53. Close D. A., Camarco D. P., Shan F., Kochanek S. J., Johnston P. A., in High Content Screening: A Powerful Approach to Systems Cell Biology and Phenotypic Drug Discovery (Eds: Johnston P. A., Trask O. J.), Springer, New York, 2018. [Google Scholar]
- 54. Amaral R. L. F., Miranda M., Marcato P. D., Swiech K., Front Physiol 2017, 8, 605. [DOI] [PMC free article] [PubMed] [Google Scholar]
- 55. Zhou Z., Van Der Jeught K., Fang Y., Yu T., Li Y., Ao Z., Liu S., Zhang L., Yang Y., Eyvani H., Cox M. L., Wang X., He X., Ji G., Schneider B. P., Guo F., Wan J., Zhang X., Lu X., Nat. Biomed. Eng. 2021, 5, 1320. [DOI] [PMC free article] [PubMed] [Google Scholar]
- 56. Tung Y.‐C., Hsiao A. Y., Allen S. G., Torisawa Y.‐S., Ho M., Takayama S., Analyst 2011, 136, 473. [DOI] [PMC free article] [PubMed] [Google Scholar]
- 57. Zhao L., Xiu J., Liu Y., Zhang T., Pan W., Zheng X., Zhang X., Sci. Rep. 2019, 9, 19717. [DOI] [PMC free article] [PubMed] [Google Scholar]
- 58. Ganguli A., Mostafa A., Saavedra C., Kim Y., Le P., Faramarzi V., Feathers R. W., Berger J., Ramos‐Cruz K. P., Adeniba O., Diaz G. J. P., Drnevich J., Wright C. L., Hernandez A. G., Lin W., Smith A. M., Kosari F., Vasmatzis G., Anastasiadis P. Z., Bashir R., Sci. Adv. 2021, 7, abc1323. [DOI] [PMC free article] [PubMed] [Google Scholar]
- 59. Djomehri S. I., Burman B., Gonzalez M. E., Takayama S., Kleer C. G., J Cell Commun Signal 2019, 13, 129. [DOI] [PMC free article] [PubMed] [Google Scholar]
- 60. Jacob F., Salinas R. D., Zhang D. Y., Nguyen P. T. T., Schnoll J. G., Wong S. Z. H., Thokala R., Sheikh S., Saxena D., Prokop S., Liu D.‐A., Qian X., Petrov D., Lucas T., Chen H. I., Dorsey J. F., Christian K. M., Binder Z. A., Nasrallah M., Brem S., O'rourke D. M., Ming G.‐L., Song H., Cell 2020, 180, 188. [DOI] [PMC free article] [PubMed] [Google Scholar]
- 61. Krieger T. G., Tirier S. M., Park J., Jechow K., Eisemann T., Peterziel H., Angel P., Eils R., Conrad C., Neuro Oncol 2020, 22, 1138. [DOI] [PMC free article] [PubMed] [Google Scholar]
- 62. Pine A. R., Cirigliano S. M., Nicholson J. G., Hu Y., Linkous A., Miyaguchi K., Edwards L., Singhania R., Schwartz T. H., Ramakrishna R., Pisapia D. J., Snuderl M., Elemento O., Fine H. A., Cancer Discov 2020, 10, 964. [DOI] [PMC free article] [PubMed] [Google Scholar]
- 63. Blutt S. E., Crawford S. E., Bomidi C., Zeng X.‐L., Broughman J. R., Robertson M., Coarfa C., Tessier M. E. M., Savidge T., Hollinger F. B., Curley S. A., Donowitz M., Estes M. K., Am. J. Physiol. 2021, 321, G270. [DOI] [PMC free article] [PubMed] [Google Scholar]
- 64. Neal J. T., Li X., Zhu J., Giangarra V., Grzeskowiak C. L., Ju J., Liu I. H., Chiou S.‐H., Salahudeen A. A., Smith A. R., Deutsch B. C., Liao L., Zemek A. J., Zhao F., Karlsson K., Schultz L. M., Metzner T. J., Nadauld L. D., Tseng Y.‐Y., Alkhairy S., Oh C., Keskula P., Mendoza‐Villanueva D., De La Vega F. M., Kunz P. L., Liao J. C., Leppert J. T., Sunwoo J. B., Sabatti C., Boehm J. S., et al., Cell 2018, 175, 1972. [DOI] [PMC free article] [PubMed] [Google Scholar]
- 65. Öhlund D., Handly‐Santana A., Biffi G., Elyada E., Almeida A. S., Ponz‐Sarvise M., Corbo V., Oni T. E., Hearn S. A., Lee E. J., Chio I. I. C., Hwang C.‐I., Tiriac H., Baker L. A., Engle D. D., Feig C., Kultti A., Egeblad M., Fearon D. T., Crawford J. M., Clevers H., Park Y., Tuveson D. A., J. Exp. Med. 2017, 214, 579. [DOI] [PMC free article] [PubMed] [Google Scholar]
- 66. Mello A. M., Ngodup T., Lee Y., Donahue K. L., Li J., Rao A., Carpenter E. S., Crawford H. C., Pasca di Magliano M., Lee K. E., Oncogenesis 2022, 11, 56. [DOI] [PMC free article] [PubMed] [Google Scholar]
- 67. Patnaik A., Swanson K. D., Csizmadia E., Solanki A., Landon‐Brace N., Gehring M. P., Helenius K., Olson B. M., Pyzer A. R., Wang L. C., Elemento O., Novak J., Thornley T. B., Asara J. M., Montaser L., Timmons J. J., Morgan T. M., Wang Y., Levantini E., Clohessy J. G., Kelly K., Pandolfi P. P., Rosenblatt J. M., Avigan D. E., Ye H., Karp J. M., Signoretti S., Balk S. P., Cantley L. C., Cancer Discov 2017, 7, 750. [DOI] [PMC free article] [PubMed] [Google Scholar]
- 68. Salvatore V., Teti G., Focaroli S., Mazzotti M. C., Mazzotti A., Falconi M., OncoTargets Ther. 2017, 8, 9608. [DOI] [PMC free article] [PubMed] [Google Scholar]
- 69. Liu M., Chen Y., Huang B., Mao S., Cai K., Wang L., Yao X., Int J Oncol 2018, 52, 1923. [DOI] [PMC free article] [PubMed] [Google Scholar]
- 70. Lee H. E., Lee J. Y., Yang G., Kang H. C., Cho Y.‐Y., Lee H. S., Lee J. Y., Sci. Rep. 2019, 9, 12277. [DOI] [PMC free article] [PubMed] [Google Scholar]
- 71. Montes C. L., Chapoval A. I., Nelson J., Orhue V., Zhang X., Schulze D. H., Strome S. E., Gastman B. R., Cancer Res. 2008, 68, 870. [DOI] [PubMed] [Google Scholar]
- 72. Livingston M. K., Morgan M. M., Daly W. T., Murphy W. L., Johnson B. P., Beebe D. J., Virumbrales‐Muñoz M., ACS Biomater. Sci. Eng. 2019, 5, 6089. [DOI] [PMC free article] [PubMed] [Google Scholar]
- 73. Fischbach C., Chen R., Matsumoto T., Schmelzle T., Brugge J. S., Polverini P. J., Mooney D. J., Nat. Methods 2007, 4, 855. [DOI] [PubMed] [Google Scholar]
- 74. Baker A. E. G., Tam R. Y., Shoichet M. S., Biomacromolecules 2017, 18, 4373. [DOI] [PubMed] [Google Scholar]
- 75. Kozlowski M. T., Crook C. J., Ku H. T., Commun Biol 2021, 4, 1387. [DOI] [PMC free article] [PubMed] [Google Scholar]
- 76. Aisenbrey E. A., Murphy W. L., Nat. Rev. Mater. 2020, 5, 539. [DOI] [PMC free article] [PubMed] [Google Scholar]
- 77. Kratochvil M. J., Seymour A. J., Li T. L., Paşca S. P., Kuo C. J., Heilshorn S. C., Nat. Rev. Mater. 2019, 4, 606. [DOI] [PMC free article] [PubMed] [Google Scholar]
- 78. Below C. R., Kelly J., Brown A., Humphries J. D., Hutton C., Xu J., Lee B. Y., Cintas C., Zhang X., Hernandez‐Gordillo V., Stockdale L., Goldsworthy M. A., Geraghty J., Foster L., O'reilly D. A., Schedding B., Askari J., Burns J., Hodson N., Smith D. L., Lally C., Ashton G., Knight D., Mironov A., Banyard A., Eble J. A., Morton J. P., Humphries M. J., Griffith L. G., Jørgensen C., Nat. Mater. 2022, 21, 110. [DOI] [PMC free article] [PubMed] [Google Scholar]
- 79. Prince E., Cruickshank J., Ba‐Alawi W., Hodgson K., Haight J., Tobin C., Wakeman A., Avoulov A., Topolskaia V., Elliott M. J., Mcguigan A. P., Berman H. K., Haibe‐Kains B., Cescon D. W., Kumacheva E., Nat. Commun. 2022, 13, 1466. [DOI] [PMC free article] [PubMed] [Google Scholar]
- 80. Schwörer S., Ros M., Tsanov K. M., Cimino F. V., Lowe S. W., Carmona‐Fontaine C., Thompson C. B., bioRxiv 2022. [DOI] [PMC free article] [PubMed] [Google Scholar]
- 81. Schuth S., Blanc S. Le, Krieger T. G., Jabs J., Schenk M., Giese N. A., Büchler M. W., Eils R., Conrad C., Strobel O., J. Exp. Clin. Cancer Res. 2022, 41, 312. [DOI] [PMC free article] [PubMed] [Google Scholar]
- 82. Shinkawa T., Ohuchida K., Mochida Y., Sakihama K., Iwamoto C., Abe T., Ideno N., Mizuuchi Y., Shindo K., Ikenaga N., Moriyama T., Nakata K., Oda Y., Nakamura M., J Exp Clin Cancer Res 2022, 41, 89. [DOI] [PMC free article] [PubMed] [Google Scholar]
- 83. Tsai S., Mcolash L., Palen K., Johnson B., Duris C., Yang Q., Dwinell M. B., Hunt B., Evans D. B., Gershan J., James M. A., BMC Cancer 2018, 18, 335. [DOI] [PMC free article] [PubMed] [Google Scholar]
- 84. Schnalzger T. E., de Groot M. H., Zhang C., Mosa M. H., Michels B. E., Röder J., Darvishi T., Wels W. S., Farin H. F., EMBO J. 2019, 38, 100928. [DOI] [PMC free article] [PubMed] [Google Scholar]
- 85. Dekkers J. F., Alieva M., Cleven A., Keramati F., Wezenaar A. K. L., Van Vliet E. J., Puschhof J., Brazda P., Johanna I., Meringa A. D., Rebel H. G., Buchholz M.‐B., Barrera Román M., Zeeman A. L., De Blank S., Fasci D., Geurts M. H., Cornel A. M., Driehuis E., Millen R., Straetemans T., Nicolasen M. J. T., Aarts‐Riemens T., Ariese H. C. R., Johnson H. R., Van Ineveld R. L., Karaiskaki F., Kopper O., Bar‐Ephraim Y. E., Kretzschmar K., et al., Nat. Biotechnol. 2023, 41, 60. [DOI] [PMC free article] [PubMed] [Google Scholar]
- 86. Holokai L., Chakrabarti J., Lundy J., Croagh D., Adhikary P., Richards S. S., Woodson C., Steele N., Kuester R., Scott A., Khreiss M., Frankel T., Merchant J., Jenkins B. J., Wang J., Shroff R. T., Ahmad S. A., Zavros Y., Cancers 2020, 12, 3816. [DOI] [PMC free article] [PubMed] [Google Scholar]
- 87. Votanopoulos K. I., Forsythe S., Sivakumar H., Mazzocchi A., Aleman J., Miller L., Levine E., Triozzi P., Skardal A., Ann Surg Oncol 2020, 27, 1956. [DOI] [PMC free article] [PubMed] [Google Scholar]
- 88. Forsythe S. D., Erali R. A., Sasikumar S., Laney P., Shelkey E., D'agostino R., Miller L. D., Shen P., Levine E. A., Soker S., Votanopoulos K. I., Clin. Cancer Res. 2021, 27, 5141. [DOI] [PMC free article] [PubMed] [Google Scholar]
- 89. Fujii M., Shimokawa M., Date S., Takano A., Matano M., Nanki K., Ohta Y., Toshimitsu K., Nakazato Y., Kawasaki K., Uraoka T., Watanabe T., Kanai T., Sato T., Cell Stem Cell 2016, 18, 827. [DOI] [PubMed] [Google Scholar]
- 90. Ng S., Tan W. J., Pek M. M. X., Tan M.‐H., Kurisawa M., Biomaterials 2019, 219, 119400. [DOI] [PubMed] [Google Scholar]
- 91. Chang C.‐Y., Johnson H. C., Babb O., Fishel M. L., Lin C.‐C., Acta Biomater. 2021, 130, 161. [DOI] [PMC free article] [PubMed] [Google Scholar]
- 92. Lee J., Abdeen A. A., Li Y., Goonetilleke S., Kilian K. A., ACS Appl. Bio Mater. 2021, 4, 711. [Google Scholar]
- 93. Dawes C. S., Konig H., Lin C.‐C., J. Biotechnol. 2017, 248, 25. [DOI] [PubMed] [Google Scholar]
- 94. Hudson B. N., Dawes C. S., Liu H.‐Y., DImmitt N., Chen F., Konig H., Lin C.‐C., Emergent Mater. 2019, 2, 263. [DOI] [PMC free article] [PubMed] [Google Scholar]
- 95. Lewis D. M., Blatchley M. R., Park K. M., Gerecht S., Nat. Protoc. 2017, 12, 1620. [DOI] [PMC free article] [PubMed] [Google Scholar]
- 96. Fisher S. A., Tam R. Y., Fokina A., Mahmoodi M. M., Distefano M. D., Shoichet M. S., Biomaterials 2018, 178, 751. [DOI] [PMC free article] [PubMed] [Google Scholar]
- 97. Bahlmann L. C., Fokina A., Shoichet M. S., MRS Commun. 2017, 7, 472. [Google Scholar]
- 98. Roudsari L. C., Jeffs S. E., Witt A. S., Gill B. J., West J. L., Sci. Rep. 2016, 6, 32726. [DOI] [PMC free article] [PubMed] [Google Scholar]
- 99. Lopez J., Ruiz‐Toranzo M., Antich C., Chocarro‐Wrona C., López‐Ruiz E., Jiménez G., Marchal J. A., Biofabrication 2022, 15, 035016. [DOI] [PubMed] [Google Scholar]
- 100. Rape A. D., Kumar S., Biomaterials 2014, 35, 8846. [DOI] [PMC free article] [PubMed] [Google Scholar]
- 101. Szot C. S., Buchanan C. F., Freeman J. W., Rylander M. N., Tissue Eng., Part C 2013, 19, 864. [DOI] [PMC free article] [PubMed] [Google Scholar]
- 102. Luo X., Fong E. L. S., Zhu C., Lin Q. X. X., Xiong M., Li A., Li T., Benoukraf T., Yu H., Liu S., Acta Biomater. 2021, 132, 461. [DOI] [PubMed] [Google Scholar]
- 103. Molley T. G., Wang X., Hung T.‐T., Jayathilaka P. B., Yang J.‐L., Kilian K. A., Adv. Biosyst. 2020, 4, 2000056. [DOI] [PubMed] [Google Scholar]
- 104. Peela N., Sam F. S., Christenson W., Truong D., Watson A. W., Mouneimne G., Ros R., Nikkhah M., Biomaterials 2016, 81, 72. [DOI] [PubMed] [Google Scholar]
- 105. Casey J., Yue X., Nguyen T. D., Acun A., Zellmer V. R., Zhang S., Zorlutuna P., Biomed. Mater. 2017, 12, 025009. [DOI] [PubMed] [Google Scholar]
- 106. Zhu X., Li Y., Yang Y., He Y., Gao M., Peng W., Wu Q., Zhang G., Zhou Y., Chen F., Bao J., Li W., Mater Today Bio 2022, 15, 100274. [DOI] [PMC free article] [PubMed] [Google Scholar]
- 107. Brandenberg N., Hoehnel S., Kuttler F., Homicsko K., Ceroni C., Ringel T., Gjorevski N., Schwank G., Coukos G., Turcatti G., Lutolf M. P., Nat. Biomed. Eng. 2020, 4, 863. [DOI] [PubMed] [Google Scholar]
- 108. D'Arcangelo E., Wu N. C., Chen T., Shahaj A., Cadavid J. L., Huang L., Ailles L., McGuigan A. P., Biomaterials 2020, 228, 119572. [DOI] [PubMed] [Google Scholar]
- 109. Wu N. C., Cadavid J. L., Tan X., Latour S., Scaini S., Makhijani P., McGaha T. L., Ailles L., McGuigan A. P., Biomaterials 2022, 283, 121417. [DOI] [PubMed] [Google Scholar]
- 110. Short A. R., Czeisler C., Stocker B., Cole S., Otero J. J., Winter J. O., Macromol. Biosci. 2017, 17, 1600478. [DOI] [PMC free article] [PubMed] [Google Scholar]
- 111. Schuster B., Junkin M., Kashaf S. S., Romero‐Calvo I., Kirby K., Matthews J., Weber C. R., Rzhetsky A., White K. P., Tay S., Nat. Commun. 2020, 11, 5271. [DOI] [PMC free article] [PubMed] [Google Scholar]
- 112. Jung D. J., Shin T. H., Kim M., Sung C. O., Jang S. J., Jeong G. S., Lab Chip 2019, 19, 2854. [DOI] [PubMed] [Google Scholar]
- 113. Mazzocchi A. R., Rajan S. A. P., Votanopoulos K. I., Hall A. R., Skardal A., Sci. Rep. 2018, 8, 2886. [DOI] [PMC free article] [PubMed] [Google Scholar]
- 114. Haque M. R., Wessel C. R., Leary D. D., Wang C., Bhushan A., Bishehsari F., Microsyst. Nanoeng. 2022, 8, 36. [DOI] [PMC free article] [PubMed] [Google Scholar]
- 115. Shirure V. S., Bi Y., Curtis M. B., Lezia A., Goedegebuure M. M., Goedegebuure S. P., Aft R., Fields R. C., George S. C., Lab Chip 2018, 18, 3687. [DOI] [PMC free article] [PubMed] [Google Scholar]
- 116. Lai Benjamin F. L., Lu Rick X., Hu Y., Davenport H. L., Dou W., Wang E. Y., Radulovich N., Tsao M. S., Sun Y., Radisic M., Adv. Funct. Mater. 2020, 30, 2000545. [DOI] [PMC free article] [PubMed] [Google Scholar]
- 117. Rajasekar S., Lin D. S. Y., Abdul L., Liu A., Sotra A., Zhang F., Zhang B., Adv. Mater. 2020, 32, 2002974. [DOI] [PubMed] [Google Scholar]
- 118. Jenkins R. W., Aref A. R., Lizotte P. H., Ivanova E., Stinson S., Zhou C. W., Bowden M., Deng J., Liu H., Miao D., He M. X., Walker W., Zhang G., Tian T., Cheng C., Wei Z., Palakurthi S., Bittinger M., Vitzthum H., Kim J. W., Merlino A., Quinn M., Venkataramani C., Kaplan J. A., Portell A., Gokhale P. C., Phillips B., Smart A., Rotem A., Jones R. E., et al., Cancer Discov 2018, 8, 196. [DOI] [PMC free article] [PubMed] [Google Scholar]
- 119. Wan L., Neumann C. A., LeDuc P. R., Lab Chip 2020, 20, 873. [DOI] [PMC free article] [PubMed] [Google Scholar]
- 120. Liu X., Fang J., Huang S., Wu X., Xie X., Wang J., Liu F., Zhang M., Peng Z., Hu N., Microsyst. Nanoeng. 2021, 7, 50. [DOI] [PMC free article] [PubMed] [Google Scholar]
- 121. Ma Y.‐H. V., Middleton K., You L., Sun Y., Microsyst. Nanoeng. 2018, 4, 17104. [Google Scholar]
- 122. Shang M., Soon R. H., Lim C. T., Khoo B. L., Han J., Lab Chip 2019, 19, 369. [DOI] [PubMed] [Google Scholar]
- 123. Li Y., Fan H., Ding J., Xu J., Liu C., Wang H., Front Genet 2022, 13, 969723. [DOI] [PMC free article] [PubMed] [Google Scholar]
- 124. Byrne M. B., Leslie M. T., Gaskins H. R., Kenis P. J. A., Trends Biotechnol. 2014, 32, 556. [DOI] [PMC free article] [PubMed] [Google Scholar]
- 125. Pradhan S., Smith A. M., Garson C. J., Hassani I., Seeto W. J., Pant K., Arnold R. D., Prabhakarpandian B., Lipke E. A., Sci. Rep. 2018, 8, 3171. [DOI] [PMC free article] [PubMed] [Google Scholar]
- 126. Eduati F., Utharala R., Madhavan D., Neumann U. P., Longerich T., Cramer T., Saez‐Rodriguez J., Merten C. A., Nat. Commun. 2018, 9, 2434. [DOI] [PMC free article] [PubMed] [Google Scholar]
- 127. Park D., Son K., Hwang Y., Ko J., Lee Y., Doh J., Jeon N. L., Front Immunol 2019, 10, 1133. [DOI] [PMC free article] [PubMed] [Google Scholar]
- 128. Dornhof J., Kieninger J., Muralidharan H., Maurer J., Urban G. A., Weltin A., Lab Chip 2022, 22, 225. [DOI] [PubMed] [Google Scholar]
- 129. Geyer M., Schreyer D., Gaul L.‐M., Pfeffer S., Pilarsky C., Queiroz K., Cell Death Discov 2023, 9, 20. [DOI] [PMC free article] [PubMed] [Google Scholar]
- 130. Ando Y., Siegler E. L., Ta H. P., Cinay G. E., Zhou H., Gorrell K. A., Au H., Jarvis B. M., Wang P., Shen K., Adv. Healthcare Mater. 2019, 8, 1900001. [DOI] [PMC free article] [PubMed] [Google Scholar]
- 131. Grist S. M., Nasseri S. S., Laplatine L., Schmok J. C., Yao D., Hua J., Chrostowski L., Cheung K. C., Sci. Rep. 2019, 9, 17782. [DOI] [PMC free article] [PubMed] [Google Scholar]
- 132. Oh J. M., Begum H. M., Liu Y. L., Ren Y., Shen K., ACS Biomater. Sci. Eng. 2022, 8, 3107. [DOI] [PMC free article] [PubMed] [Google Scholar]
- 133. Barmaki S., Jokinen V., Obermaier D., Blokhina D., Korhonen M., Ras R. H. A., Vuola J., Franssila S., Kankuri E., Acta Biomater. 2018, 73, 167. [DOI] [PubMed] [Google Scholar]
- 134. Wang L., Liu W., Wang Y., Wang J.‐C., Tu Q., Liu R., Wang J., Lab Chip 2013, 13, 695. [DOI] [PubMed] [Google Scholar]
- 135. Ayuso J. M., Virumbrales‐Munoz M., McMinn P. H., Rehman S., Gomez I., Karim M. R., Trusttchel R., Wisinski K. B., Beebe D. J., Skala M. C., Lab Chip 2019, 19, 3461. [DOI] [PMC free article] [PubMed] [Google Scholar]
- 136. Funamoto K., Zervantonakis I. K., Liu Y., Ochs C. J., Kim C., Kamm R. D., Lab Chip 2012, 12, 4855. [DOI] [PMC free article] [PubMed] [Google Scholar]
- 137. Berger Fridman I., Ugolini G. S., VanDelinder V., Cohen S., Konry T., Biofabrication 2021, 13, 035037. [DOI] [PubMed] [Google Scholar]
- 138. Jalili‐Firoozinezhad S., Gazzaniga F. S., Calamari E. L., Camacho D. M., Fadel C. W., Bein A., Swenor B., Nestor B., Cronce M. J., Tovaglieri A., Levy O., Gregory K. E., Breault D. T., Cabral J. M. S., Kasper D. L., Novak R., Ingber D. E., Nat. Biomed. Eng. 2019, 3, 520. [DOI] [PMC free article] [PubMed] [Google Scholar]
- 139. Virumbrales‐Muñoz M., Ayuso J. M., Lacueva A., Randelovic T., Livingston M. K., Beebe D. J., Oliván S., Pereboom D., Doblare M., Fernández L., Ochoa I., Sci. Rep. 2019, 9, 6199. [DOI] [PMC free article] [PubMed] [Google Scholar]
- 140. Geyer M., D'Agosto S., Lanz H., Corbo V., Joore J., Queiroz K. S., Cancer Res. 2022, 82, 3857. [Google Scholar]
- 141. Kane K. I. W., Moreno E. L., Lehr C. M., Hachi S., Dannert R., Sanctuary R., Wagner C., Fleming R. M. T., Baller J., AIP Adv. 2018, 8, 125332. [Google Scholar]
- 142. Li N. T., Wu N. C., Cao R., Cadavid J. L., Latour S., Lu X., Zhu Y., Mijalkovic M., Roozitalab R., Landon‐Brace N., Notta F., Mcguigan A. P., Biomaterials 2022, 291, 121883. [DOI] [PubMed] [Google Scholar]
- 143. Cao R., Li N. T., Latour S., Cadavid J. L., Tan C. M., Forman A., Jackson H. W., McGuigan A. P., Adv Healthcare Mat 2023, 12, 2202422. [DOI] [PMC free article] [PubMed] [Google Scholar]
- 144. Rodenhizer D., Gaude E., Cojocari D., Mahadevan R., Frezza C., Wouters B. G., McGuigan A. P., Nat. Mater. 2016, 15, 227. [DOI] [PMC free article] [PubMed] [Google Scholar]
- 145. Landon‐Brace N., Cadavid J. L., Latour S., Co I. L., Rodenhizer D., Li N. T., Wu N. C., Bugbee E., Chebotarev A., Zhang J., Wouters B. G., Mcguigan A. P., Adv. Funct. Mater. 2021, 31, 2105349. [Google Scholar]
- 146. Cadavid J. L., Latour S., Nowlan F., Co I. L., Landon‐Brace N., Wouters B. G., Grünwald B. T., Nitz M., Jackson H. W., McGuigan A. P., Adv. Healthcare Mater. 2022, 12, 2201846. [DOI] [PubMed] [Google Scholar]
- 147. Young M., Rodenhizer D., Dean T., D'Arcangelo E., Xu B., Ailles L., McGuigan A. P., Biomaterials 2018, 164, 54. [DOI] [PubMed] [Google Scholar]
- 148. Derda R., Laromaine A., Mammoto A., Tang S. K. Y., Mammoto T., Ingber D. E., Whitesides G. M., Proc. Natl. Acad. Sci. USA 2009, 106, 18457. [DOI] [PMC free article] [PubMed] [Google Scholar]
- 149. Derda R., Tang S. K. Y., Laromaine A., Mosadegh B., Hong E., Mwangi M., Mammoto A., Ingber D. E., Whitesides G. M., PLoS One 2011, 6, 18940. [DOI] [PMC free article] [PubMed] [Google Scholar]
- 150. Camci‐Unal G., Newsome D., Eustace B. K., Whitesides G. M., Adv. Healthcare Mater. 2016, 5, 641. [DOI] [PubMed] [Google Scholar]
- 151. Kenney R. M., Boyce M. W., Truong A. S., Bagnell C. R., Lockett M. R., Analyst 2016, 141, 661. [DOI] [PubMed] [Google Scholar]
- 152. Boyce M. W., LaBonia G. J., Hummon A. B., Lockett M. R., Analyst 2017, 142, 2819. [DOI] [PMC free article] [PubMed] [Google Scholar]
- 153. Boyce M. W., Kenney R. M., Truong A. S., Lockett M. R., Anal. Bioanal. Chem. 2016, 408, 2985. [DOI] [PubMed] [Google Scholar]
- 154. Huang C.‐H., Chong K.‐Y., Lei K. F., ACS Appl. Mater. Interfaces 2021, 13, 33885. [DOI] [PubMed] [Google Scholar]
- 155. Larson T. S., Glish G. L., Lockett M. R., Anal. Chim. Acta 2021, 1186, 339091. [DOI] [PMC free article] [PubMed] [Google Scholar]
- 156. Serex L., Sharma K., Rizov V., Bertsch A., McKinney J. D., Renaud P., Biofabrication 2021, 13, 025006. [DOI] [PubMed] [Google Scholar]
- 157. Bernal P. N., Bouwmeester M., Madrid‐Wolff J., Falandt M., Florczak S., Rodriguez N. G., Li Y., Größbacher G., Samsom R.‐A., Van Wolferen M., Van Der Laan L. J. W., Delrot P., Loterie D., Malda J., Moser C., Spee B., Levato R., Adv. Mater. 2022, 34, 2110054. [DOI] [PubMed] [Google Scholar]
- 158. Kim E., Choi S., Kang B., Kong J., Kim Y., Yoon W. H., Lee H.‐R., Kim S., Kim H.‐M., Lee H., Yang C., Lee Y. J., Kang M., Roh T.‐Y., Jung S., Kim S., Ku J. H., Shin K., Nature 2020, 588, 664. [DOI] [PubMed] [Google Scholar]
- 159. Lawlor K. T., Vanslambrouck J. M., Higgins J. W., Chambon A., Bishard K., Arndt D., Er P. X., Wilson S. B., Howden S. E., Tan K. S., Li F., Hale L. J., Shepherd B., Pentoney S., Presnell S. C., Chen A. E., Little M. H., Nat. Mater. 2021, 20, 260. [DOI] [PMC free article] [PubMed] [Google Scholar]
- 160. Noel G., Baetz N. W., Staab J. F., Donowitz M., Kovbasnjuk O., Pasetti M. F., Zachos N. C., Sci. Rep. 2017, 7, 45270. [DOI] [PMC free article] [PubMed] [Google Scholar]
- 161. Puschhof J., Pleguezuelos‐Manzano C., Martinez‐Silgado A., Akkerman N., Saftien A., Boot C., De Waal A., Beumer J., Dutta D., Heo I., Clevers H., Nat. Protoc. 2021, 16, 4633. [DOI] [PubMed] [Google Scholar]
- 162. Pleguezuelos‐Manzano C., Puschhof J., Rosendahl Huber A., Van Hoeck A., Wood H. M., Nomburg J., Gurjao C., Manders F., Dalmasso G., Stege P. B., Paganelli F. L., Geurts M. H., Beumer J., Mizutani T., Miao Y., Van Der Linden R., Van Der Elst S., Ambrose J. C., Arumugam P., Baple E. L., Bleda M., Boardman‐Pretty F., Boissiere J. M., Boustred C. R., Brittain H., Caulfield M. J., Chan G. C., Craig C. E. H., Daugherty L. C., De Burca A., et al., Nature 2020, 580, 269.32106218 [Google Scholar]
- 163. Shelkey E., Oommen D., Stirling E. R., Soto‐Pantoja D. R., Cook K. L., Lu Y., Votanopoulos K. I., Soker S., Sci. Rep. 2022, 12, 9983. [DOI] [PMC free article] [PubMed] [Google Scholar]
- 164. Guo W., Zhang Y., Guo S., Mei Z., Liao H., Dong H., Wu K., Ye H., Zhang Y., Zhu Y., Lang J., Hu L., Jin G., Kong X., Commun Biol 2021, 4, 1019. [DOI] [PMC free article] [PubMed] [Google Scholar]
- 165. Geller L. T., Barzily‐Rokni M., Danino T., Jonas O. H., Shental N., Nejman D., Gavert N., Zwang Y., Cooper Z. A., Shee K., Thaiss C. A., Reuben A., Livny J., Avraham R., Frederick D. T., Ligorio M., Chatman K., Johnston S. E., Mosher C. M., Brandis A., Fuks G., Gurbatri C., Gopalakrishnan V., Kim M., Hurd M. W., Katz M., Fleming J., Maitra A., Smith D. A., Skalak M., et al., Science 2017, 357, 1156. [DOI] [PMC free article] [PubMed] [Google Scholar]
- 166. Spanogiannopoulos P., Kyaw T. S., Guthrie B. G. H., Bradley P. H., Lee J. V., Melamed J., Malig Y. N. A., Lam K. N., Gempis D., Sandy M., Kidder W., Van Blarigan E. L., Atreya C. E., Venook A., Gerona R. R., Goga A., Pollard K. S., Turnbaugh P. J., Nat. Microbiol. 2022, 7, 1605. [DOI] [PMC free article] [PubMed] [Google Scholar]
- 167. Xu Z., Li E., Guo Z., Yu R., Hao H., Xu Y., Sun Z., Li X., Lyu J., Wang Q., ACS Appl. Mater. Interfaces 2016, 8, 25840. [DOI] [PubMed] [Google Scholar]
- 168. Aleman J., Skardal A., Biotechnol. Bioeng. 2019, 116, 936. [DOI] [PMC free article] [PubMed] [Google Scholar]
- 169. Hübner J., Raschke M., Rütschle I., Gräßle S., Hasenberg T., Schirrmann K., Lorenz A., Schnurre S., Lauster R., Maschmeyer I., Steger‐Hartmann T., Marx U., Sci. Rep. 2018, 8, 15010. [DOI] [PMC free article] [PubMed] [Google Scholar]
- 170. Kinny‐Köster B., Guinn S., Tandurella J. A., Mitchell J. T., Sidiropoulos D. N., Loth M., Lyman M. R., Pucsek A. B., Seppälä T. T., Cherry C., et al., bioRxiv 2022. [Google Scholar]
- 171. Meng Q., Xie S., Gray G. K., Dezfulian M. H., Gandarilla O., Li W., Huang L., Akshinthala D., Ferrer E., Conahan C., Perea Del Pino S., Grossman J., Elledge S. J., Hidalgo M., Muthuswamy S. K., J Immunother Cancer 2021, 9, 003213. [DOI] [PMC free article] [PubMed] [Google Scholar]
- 172. Erhard F., Baptista M. A. P., Krammer T., Hennig T., Lange M., Arampatzi P., Jürges C. S., Theis F. J., Saliba A.‐E., Dölken L., Nature 2019, 571, 419. [DOI] [PubMed] [Google Scholar]
- 173. Chen W., Guillaume‐Gentil O., Rainer P. Y., Gäbelein C. G., Saelens W., Gardeux V., Klaeger A., Dainese R., Zachara M., Zambelli T., Vorholt J. A., Deplancke B., Nature 2022, 608, 733. [DOI] [PMC free article] [PubMed] [Google Scholar]
- 174. Rivello F., van Buijtenen E., Matuła K., van Buggenum J. A. G. L., Vink P., van Eenennaam H., Mulder K. W., Huck W. T. S., Cell Rep Methods 2021, 1, 100070. [DOI] [PMC free article] [PubMed] [Google Scholar]
- 175. Chung H., Parkhurst C. N., Magee E. M., Phillips D., Habibi E., Chen F., Yeung B. Z., Waldman J., Artis D., Regev A., Nat. Methods 2021, 18, 1204. [DOI] [PMC free article] [PubMed] [Google Scholar]
- 176. Liu Z., Yuan J., Lasorella A., Iavarone A., Bruce J. N., Canoll P., Sims P. A., Sci. Rep. 2020, 10, 19482. [DOI] [PMC free article] [PubMed] [Google Scholar]
- 177. Rao A., Barkley D., França G. S., Yanai I., Nature 2021, 596, 211. [DOI] [PMC free article] [PubMed] [Google Scholar]
- 178. Borm L. E., Mossi Albiach A., Mannens C. C. A., Janusauskas J., Özgün C., Fernández‐García D., Hodge R., Castillo F., Hedin C. R. H., Villablanca E. J., Uhlén P., Lein E. S., Codeluppi S., Linnarsson S., Nat. Biotechnol. 2022, 41, 222. [DOI] [PMC free article] [PubMed] [Google Scholar]
- 179. Srivatsan S. R., Regier M. C., Barkan E., Franks J. M., Packer J. S., Grosjean P., Duran M., Saxton S., Ladd J. J., Spielmann M., Lois C., Lampe P. D., Shendure J., Stevens K. R., Trapnell C., Science 2021, 373, 111. [DOI] [PMC free article] [PubMed] [Google Scholar]
- 180. Vandereyken K., Sifrim A., Thienpont B., Voet T., Nat. Rev. Genet. 2023, 24, 494. [DOI] [PMC free article] [PubMed] [Google Scholar]
- 181. Yan F., Powell D. R., Curtis D. J., Wong N. C., Genome Biol. 2020, 21, 22. [DOI] [PMC free article] [PubMed] [Google Scholar]
- 182. Gawad C., Koh W., Quake S. R., Nat. Rev. Genet. 2016, 17, 175. [DOI] [PubMed] [Google Scholar]
- 183. Fan X., Yang C., Li W., Bai X., Zhou X., Xie H., Wen L., Tang F., Genome Biol. 2021, 22, 195. [DOI] [PMC free article] [PubMed] [Google Scholar]
- 184. Specht H., Emmott E., Petelski A. A., Huffman R. G., Perlman D. H., Serra M., Kharchenko P., Koller A., Slavov N., Genome Biol. 2021, 22, 50. [DOI] [PMC free article] [PubMed] [Google Scholar]
- 185. Schoof E. M., Furtwängler B., Üresin N., Rapin N., Savickas S., Gentil C., Lechman E., Keller U. A. D., Dick J. E., Porse B. T., Nat. Commun. 2021, 12, 3341. [DOI] [PMC free article] [PubMed] [Google Scholar]
- 186. Iyer A., Hamers A. A. J., Pillai A. B., Front Immunol 2022, 13, 815828. [DOI] [PMC free article] [PubMed] [Google Scholar]
- 187. Spitzer M. H., Nolan G. P., Cell 2016, 165, 780. [DOI] [PMC free article] [PubMed] [Google Scholar]
- 188. Haque A., Engel J., Teichmann S. A., Lönnberg T., Genome Med 2017, 9, 75. [DOI] [PMC free article] [PubMed] [Google Scholar]
- 189. Lähnemann D., Köster J., Szczurek E., McCarthy D. J., Hicks S. C., Robinson M. D., Vallejos C. A., Campbell K. R., Beerenwinkel N., Mahfouz A., et al., Genome Biol. 2020, 21, 31. [DOI] [PMC free article] [PubMed] [Google Scholar]
- 190. Usman O. H., Zhang L., Xie G., Kocher H. M., Hwang C.‐I., Wang Y. J., Mallory X., J. Irianto. npj Genomic Medicine. 2022, 7, 71. [DOI] [PMC free article] [PubMed] [Google Scholar]
- 191. Romero‐Calvo I., Weber C. R., Ray M., Brown M., Kirby K., Nandi R. K., Long T. M., Sparrow S. M., Ugolkov A., Qiang W., Zhang Y., Brunetti T., Kindler H., Segal J. P., Rzhetsky A., Mazar A. P., Buschmann M. M., Weichselbaum R., Roggin K., White K. P., Mol. Cancer Res. 2019, 17, 70. [DOI] [PMC free article] [PubMed] [Google Scholar]
- 192. Juiz N., Elkaoutari A., Bigonnet M., Gayet O., Roques J., Nicolle R., Iovanna J., Dusetti N., FASEB J. 2020, 34, 12214. [DOI] [PubMed] [Google Scholar]
- 193. Monberg M. E., Geiger H., Lee J. J., Sharma R., Semaan A., Bernard V., Wong J., Wang F., Liang S., Swartzlander D. B., Stephens B. M., Katz M. H. G., Chen K., Robine N., Guerrero P. A., Maitra A., Nat. Commun. 2022, 13, 3652. [DOI] [PMC free article] [PubMed] [Google Scholar]
- 194. Ding K., Chen F., Priedigkeit N., Brown D. D., Weiss K., Watters R., Levine K. M., Heim T., Li W., Hooda J., Lucas P. C., Atkinson J. M., Oesterreich S., Lee A. V., Ann. Oncol. 2022, 33, 1085. [DOI] [PMC free article] [PubMed] [Google Scholar]
- 195. Wang R., Mao Y., Wang W., Zhou X., Wang W., Gao S., Li J., Wen L., Fu W., Tang F., Genome Biol. 2022, 23, 106. [DOI] [PMC free article] [PubMed] [Google Scholar]
- 196. Tedesco M., Giannese F., Lazarević D., Giansanti V., Rosano D., Monzani S., Catalano I., Grassi E., Zanella E. R., Botrugno O. A., Morelli L., Panina Bordignon P., Caravagna G., Bertotti A., Martino G., Aldrighetti L., Pasqualato S., Trusolino L., Cittaro D., Tonon G., Nat. Biotechnol. 2022, 40, 235. [DOI] [PubMed] [Google Scholar]
- 197. Wanigasooriya K., Barros‐Silva J. D., Tee L., El‐Asrag M. E., Stodolna A., Pickles O. J., Stockton J., Bryer C., Hoare R., Whalley C. M., Tyler R., Sillo T., Yau C., Ismail T., Beggs A. D., Front Oncol 2022, 12, 920444. [DOI] [PMC free article] [PubMed] [Google Scholar]
- 198. Krieger T. G., Le Blanc S., Jabs J., Ten F. W., Ishaque N., Jechow K., Debnath O., Leonhardt C.‐S., Giri A., Eils R., Strobel O., Conrad C., Nat. Commun. 2021, 12, 5826. [DOI] [PMC free article] [PubMed] [Google Scholar]
- 199. Dost A. F. M., Moye A. L., Vedaie M., Tran L. M., Fung E., Heinze D., Villacorta‐Martin C., Huang J., Hekman R., Kwan J. H., Blum B. C., Louie S. M., Rowbotham S. P., Sainz De Aja J., Piper M. E., Bhetariya P. J., Bronson R. T., Emili A., Mostoslavsky G., Fishbein G. A., Wallace W. D., Krysan K., Dubinett S. M., Yanagawa J., Kotton D. N., Kim C. F., Cell Stem Cell 2020, 27, 663. [DOI] [PMC free article] [PubMed] [Google Scholar]
- 200. Chen G., Gong T., Wang Z., Wang Z., Lin X., Chen S., Sun C., Zhao W., Kong Y., Ai H., Yang H., Liu Y., Wu F., Kang J., Zhao S., Xiao X., Sun J., He A., Li Z., Cell. Oncol. 2022, 45, 1155. [DOI] [PMC free article] [PubMed] [Google Scholar]
- 201. Zhao Y., Li Z.‐X., Zhu Y.‐J., Fu J., Zhao X.‐F., Zhang Y.‐N., Wang S., Wu J.‐M., Wang K.‐T., Wu R., Sui C.‐J., Shen S.‐Y., Wu X., Wang H.‐Y., Gao D., Chen L., Adv. Sci. 2021, 8, 2003897. [Google Scholar]
- 202. Berg H. F., Hjelmeland M. E., Lien H., Espedal H., Fonnes T., Srivastava A., Stokowy T., Strand E., Bozickovic O., Stefansson I. M., Bjørge L., Trovik J., Haldorsen I. S., Hoivik E. A., Krakstad C., Commun Med 2021, 1, 20. [DOI] [PMC free article] [PubMed] [Google Scholar]
- 203. Uhlitz F., Bischoff P., Peidli S., Sieber A., Trinks A., Lüthen M., Obermayer B., Blanc E., Ruchiy Y., Sell T., Mamlouk S., Arsie R., Wei T.‐T., Klotz‐Noack K., Schwarz R. F., Sawitzki B., Kamphues C., Beule D., Landthaler M., Sers C., Horst D., Blüthgen N., Morkel M., EMBO Mol. Med. 2021, 13, 14123. [DOI] [PMC free article] [PubMed] [Google Scholar]
- 204. Guan Y., Enejder A., Wang M., Fang Z., Cui L., Chen S.‐Y., Wang J., Tan Y., Wu M., Chen X., Johansson P. K., Osman I., Kunimoto K., Russo P., Heilshorn S. C., Peltz G., Nat. Commun. 2021, 12, 6138. [DOI] [PMC free article] [PubMed] [Google Scholar]
- 205. Qin X., Sufi J., Vlckova P., Kyriakidou P., Acton S. E., Li V. S. W., Nitz M., Tape C. J., Nat. Methods 2020, 17, 335. [DOI] [PMC free article] [PubMed] [Google Scholar]
- 206. Park S. E., Kang S., Paek J., Georgescu A., Chang J., Yi A. Y., Wilkins B. J., Karakasheva T. A., Hamilton K. E., Huh D. D., Nat. Methods 2022, 19, 1449. [DOI] [PMC free article] [PubMed] [Google Scholar]
- 207. Nayler S., Agarwal D., Curion F., Bowden R., Becker E. B. E., Sci. Rep. 2021, 11, 12959. [DOI] [PMC free article] [PubMed] [Google Scholar]
- 208. Treacy N. J., Clerkin S., Davis J. L., Kennedy C., Miller A. F., Saiani A., Wychowaniec J. K., Brougham D. F., Crean J., Bioact Mater 2023, 21, 142. [DOI] [PMC free article] [PubMed] [Google Scholar]
- 209. Shi Y., Sun L., Wang M., Liu J., Zhong S., Li R., Li P., Guo L., Fang A., Chen R., Ge W.‐P., Wu Q., Wang X., PLoS Biol. 2020, 18, 3000705. [DOI] [PMC free article] [PubMed] [Google Scholar]
- 210. Choi J.‐I., Rim J. H., Jang S. I., Park J. S., Park H., Cho J. H., Lim J.‐B., Theranostics 2022, 12, 4431. [DOI] [PMC free article] [PubMed] [Google Scholar]
- 211. Fleck J. S., Jansen S. M. J., Wollny D., Zenk F., Seimiya M., Jain A., Okamoto R., Santel M., He Z., Camp J. G., Treutlein B., Nature 2022, 10.1038/s41586-022-05279-8. [DOI] [PMC free article] [PubMed] [Google Scholar]
- 212. Ziffra R. S., Kim C. N., Ross J. M., Wilfert A., Turner T. N., Haeussler M., Casella A. M., Przytycki P. F., Keough K. C., Shin D., Bogdanoff D., Kreimer A., Pollard K. S., Ament S. A., Eichler E. E., Ahituv N., Nowakowski T. J., Nature 2021, 598, 205. [DOI] [PMC free article] [PubMed] [Google Scholar]
- 213. Finkbeiner C., Ortuño‐Lizarán I., Sridhar A., Hooper M., Petter S., Reh T. A., Cell Rep. 2022, 38, 110294. [DOI] [PubMed] [Google Scholar]
- 214. Uzquiano A., Kedaigle A. J., Pigoni M., Paulsen B., Adiconis X., Kim K., Faits T., Nagaraja S., Antón‐Bolaños N., Gerhardinger C., Tucewicz A., Murray E., Jin X., Buenrostro J., Chen F., Velasco S., Regev A., Levin J. Z., Arlotta P., Cell 2022, 185, 3770. [DOI] [PMC free article] [PubMed] [Google Scholar]
- 215. Smirnov A., Melino G., Candi E., Biol. Direct 2023, 18, 11. [DOI] [PMC free article] [PubMed] [Google Scholar]
- 216. Williams C. G., Lee H. J., Asatsuma T., Vento‐Tormo R., Haque A., Genome Med 2022, 14, 68. [DOI] [PMC free article] [PubMed] [Google Scholar]
- 217. Mund A., Brunner A.‐D., Mann M., Mol. Cell 2022, 82, 2335. [DOI] [PubMed] [Google Scholar]
- 218. Liu X., Flinders C., Mumenthaler S. M., Hummon A. B., J. Am. Soc. Mass Spectrom. 2018, 29, 516. [DOI] [PMC free article] [PubMed] [Google Scholar]