

Abstract
Key to the widespread and secure application of genome editing tools is the safe and effective delivery of multiple components of ribonucleoproteins (RNPs) into single cells, which remains a biological barrier to their clinical application. To overcome this issue, a robust RNP delivery platform based on a biocompatible sponge‐like silica nanoconstruct (SN) for storing and directly delivering therapeutic RNPs, including Cas9 nuclease RNP (Cas9‐RNP) and base editor RNP (BE‐RNP) is designed. Compared with commercialized material such as lipid‐based methods, up to 50‐fold gene deletion and 10‐fold base substitution efficiency is obtained with a low off‐target efficiency by targeting various cells and genes. In particular, gene correction is successfully induced by SN‐based delivery through intravenous injection in an in vivo solid‐tumor model and through subretinal injection in mouse eye. Moreover, because of its low toxicity and high biodegradability, SN has negligible effect on cellular function of organs. As the engineered SN can overcome practical challenges associated with therapeutic RNP application, it is strongly expected this platform to be a modular RNPs delivery system, facilitating in vivo gene deletion and editing.
Keywords: base editing, gene editing, porous nanoparticles, ribonucleoproteins delivery, targeted tumor therapy
A novel ribonucleoprotein (RNP) delivery platform is developed. Sponge‐like structured nanomaterials are designed to increase the packaging and delivery efficacy of RNPs, including Cas9 nucleases and base editors, in various cells and genes, and specific organs such as tumors and eyes. This platform can provide a unique and modular means of delivering RNPs in vivo for therapeutic purposes.
1. Introduction
Taking advantage of the recent advances in genome editing tools, researchers have modified gene sequences in living cells and tissues via deletion and insertion of specific sequence, and alteration of bases.[ 1 ] Genome editing is a potential therapeutic strategy to correct genetic defects and cure inherent diseases;[ 2 ] ≈25 clustered regularly interspaced short palindromic repeat (CRISPR)‐based therapeutics are currently undergoing clinical trials.[ 2 , 3 ] In addition, recent DNA base editing technology, including a cytosine base editor (CBE) and an adenine base editor (ABE), have been applied for in vivo therapeutics because they exhibit higher base conversion activities than the CRISPR‐mediated gene correction and do not generate DNA double‐stranded breaks; therefore, undesired insertion and deletion mutations are reduced to a considerable extent.[ 1 , 4 ]
To achieve therapeutic outcomes in diseases, genome editing agents, such as Cas9 nuclease protein with single guide RNA (sgRNA) complexes should be delivered into the specific target organs, tissues, or cells. Although viral vector‐based DNA systems have been mostly used for in vivo genome editing, the system has faced potential safety issues. Viral vectors frequently cause insertional mutagenesis and immunogenicity in transferred cells.[ 4 , 5 ] Moreover, viral vectors remain in the target cells for a long time, resulting in the accumulation of off‐target effects both in DNA and RNA.[ 6 ] To overcome these limitations, the delivery of DNA‐free ribonucleoprotein (RNP) genome editing agents may ensure no insertional mutagenesis and minimize the off‐target effects because of the short lifetime of RNPs in cells.[ 7 ] Despite the benefits of RNPs, their application remains limited mainly because of the low stability due to enzymatic degradation in cells, low cell permeability with strong negative charges, large molecular size of RNP complexes, and the lack of an effective in vivo delivery system.[ 8 ] Thus, developing a biocompatible, stable and effective delivery method for various RNPs would be a key strategy for expanding the scope of therapeutic genome editing.
Previous studies have demonstrated in vivo genome editing through the delivery of Cas9 nuclease RNPs (Cas9‐RNPs) or base editor RNPs (BE‐RNPs) via nonviral vehicles such as lipid‐, polymer‐, and carbon‐based particles, as well as protein‐based nanoparticles.[ 9 ] However, these approaches are not easy to control the uniformity and the stability of the RNP formulation with the delivery carriers, resulting in the decrease of gene editing outcomes. Difficulties in the preparation and synthesis of RNP complexes owing to complicated assembly processes have hindered their versatile utility with various RNP complexes. In addition, RNP delivery through hydrodynamic injection or amphiphilic molecule‐encapsulation showed toxicity and low transduction efficiency in vivo.[ 6 , 10 ] Recently, the Liu group developed engineered DNA‐free virus‐like particles for BE‐RNP delivery;[ 11 ] they also emphasized the importance of challengeable RNP delivery and showed meaningful gene editing results in an in vivo model. In coincidence with the purpose of this study, it is highly demanded to develop a versatile delivery system of different forms of RNPs (e.g., Cas9‐RNP, CBE‐RNP, and ABE‐RNP) into various cell types and tissues.
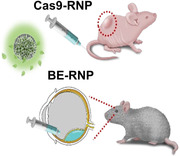
Here, we aimed to develop an easy‐to‐use and robust RNP delivery platform based on a sponge‐like silica nanoconstruct (SN) as a biocompatible carrier for delivering therapeutic Cas9‐RNPs, CBE‐RNPs, and ABE‐RNPs. Due to its sponge‐like structure and surface functionality, the SN could provide modularity, rapid packaging, controllable delivery of multiple cargos, and sustained release—these were major advantages over other delivery methods. We demonstrated that the SN‐based delivery platform could be used not only for the delivery of Cas9‐RNP, but also for the delivery of ABE‐RNP and CBE‐RNP to various human and mouse cells. In addition, the SN platform could be applied for in vivo systemic delivery via intravenous injection and direct subretinal injection in mouse eyes, with negligible toxicity and functional effects on retinal function (Figure 1a).
Figure 1.
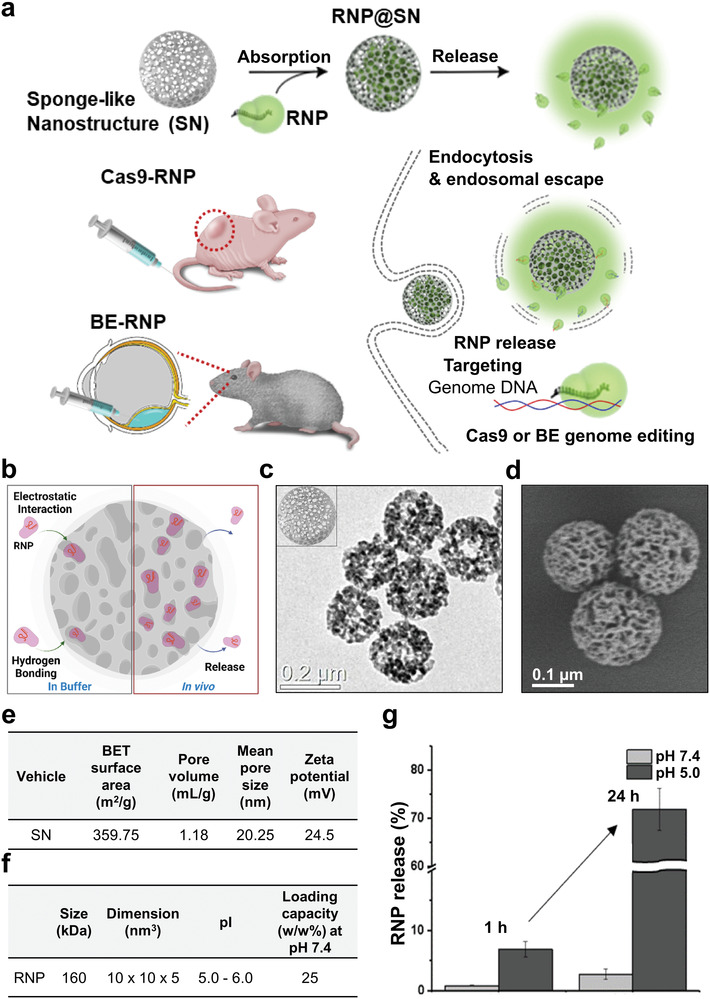
Preparation of the RNP delivery platform. a) An RNP delivery platform is proposed for targeting multiple genes that are highly relevant to the fusion gene of cancer and genes involved in functions of the eye. b) Schematic of SN‐RNPs. c) Transmission electron microscopy and d) scanning electron microscopy image showing absorptive surface structures and morphology of SN. e) Nitrogen absorption/desorption analysis of SN for BET surface area, pore volume, and mean pore size. f) The RNP loading capacity of SN was evaluated using a bicinchoninic acid assay, showing a 25% w/w loading capacity. g) Compared to pH 7.4, the maximum release of RNP was observed at pH 5 within 24 h. The schematic image was drawn using the online tool BioRender.
Our results demonstrate that SN as a biocompatible carrier and SN‐mediated RNP delivery mitigated off‐target editing both in vitro and in vivo, strongly suggesting that SN can overcome the practical challenges involved in therapeutic RNP application, such as packaging, systemic delivery, targeted delivery, off‐target effects, and safety.
2. Results and Discussion
We first designed and optimized SN structures as a biocompatible carrier for the following purposes: i) to load different types of RNPs with higher capacity, ii) to apply them to various cell types, and iii) to enable the systemic introduction of RNPs in vivo system (Figure 1b). The SNs possess well‐defined absorptive surface structures with high surface‐to‐volume ratios, and cavities with large mean pore sizes, allowing cargo encapsulation with a high payload. Moreover, the high surface area and silanol groups on the SN surface enable rapid and modular construction through surface functionalization, leading to better control of the loading capacity, intracellular uptake efficacy, and cargo release rate. In particular, amorphous silica is generally recognized as safe by the US Food and Drug Administration (FDA), and its therapeutic and diagnostic uses are becoming increasingly important.[ 12 ] Transmission electron microscopy (TEM) and scanning electron microscopy (SEM) images showed the particle morphology of the 200 nm SNs (Figure 1c,d; and Figure S1a, Supporting Information). The results of nitrogen sorption and zeta potential analysis showed that the prepared SNs possessed a large mean pore size (20.25 nm) and positive surface charge (24.5 ± 1.2 mV at pH 7.4) (Figure 1e; and Figure S1b,c, Supporting Information), which may have enabled the loading of RNPs inside the cavities (Figure S2, Supporting Information).[ 9b ] The final construct, Cas9‐RNP@SN, showed slightly decreased the surface charge, but they were still positive surface charge (Figure S1d, Supporting Information). The Cas9‐RNP‐loaded SN complex (Cas9‐RNP@SN) was obtained by simple mixing Cas9‐RNPs and SN in phosphate‐buffered saline (PBS, pH 7.4) at room temperature (RT) for 30 min. The Cas9‐RNP‐loading capacity of the SN was evaluated using a bicinchoninic acid assay; the results showed a 25% w/w loading capacity (Figure 1f), which was larger than those of previously reported porous structured nanoparticle‐based RNP delivery systems (zeolitic nanoparticles, porous silica nanoparticles, hydrogel, etc.).[ 13 ] Subsequently, we characterized Cas9‐RNP release from the SN under various pH conditions using absorption spectroscopy by monitoring for 24 h. Under physiological conditions at pH 7.4, less than 5% of RNP was released, whereas 30% and 70% were released in 12 h at pH 6 and pH 5, respectively (Figure 1g; and Figure S1e, Supporting Information), indicating that RNP release was more favorable under acidic conditions, which is close to the endosomal environment.[ 13a ] Notably, this pH dependent sustained‐release phenomenon of the SN would be beneficial for maintaining Cas9 protein activity with high stability in vivo, by protecting Cas9‐RNPs outside of cells and effectively releasing them in cells.
To examine the stability of Cas9‐RNPs inside the SN and the protective effect of SNs under physiological conditions, Cas9‐RNP@SN and Cas9‐RNP were dispersed in PBS containing proteases. We assumed that Cas9‐RNPs without any protection would be degraded by proteases, losing their DNA cleavage activity. As expected, gel images showed that the Cas9‐RNP@SN group maintained in vitro DNA cleavage activity, whereas no significant cleaved band was observed in the Cas9‐RNP group (Figure S3, Supporting Information), indicating the remarkable protective ability of the SN structure in the proteolytic environment, and demonstrating that the released Cas9‐RNPs were still active. Next, we evaluated the biocompatibility of the materials on HeLa cells (human cervical cancer cells) by increasing the concentration of SN from 0 to 1 mg mL−1; we observed that more than 90% cells were alive at all concentrations of SN (Figure S4, Supporting Information). Taken together, the advantageous properties of SNs, including pH‐dependent release, protective effects, and biocompatibility, could provide a potential genome editing platform for RNP delivery.
To evaluate the intracellular uptake of Cas9‐RNP@SN, Cas9 protein, and SN were labeled with Cy5 (Cy5‐Cas9‐RNP; red color) and FAM (FAM‐SN; green color), respectively, before the formation of Cas9‐RNP@SN. Then, HeLa cells were treated with the Cas9‐RNP@SN constructs and the constructs were visualized using fluorescence microscopy. Fluorescence signals corresponding to Cas9‐RNPs and SNs were observed in the nucleus or cytoplasm 24 h after treatment, indicating the successful delivery and release of Cas9‐RNPs from the SN inside the cells (Figure 2a; and Figure S5a, Supporting Information). Moreover, green (SN) or red (Cas9‐RNP) fluorescence was separated from the merged yellowish color with the endosomes, suggesting the Cas9‐RNPs were released into the cytoplasm over time (Figure 2b; and Figure S5b, Supporting Information). This result implied that SNs can escape the endocytic pathway owing to the buffering capacity of their surface functional groups. In addition, the changes in pH and ionic strength as progress of the endocytosis from endosome to lysosome enabled the release of Cas9‐RNP from the SN by reducing electrostatic and hydrogen bonding interactions. Thus, the released Cas9‐RNP can enter the nucleus to initiate site‐specific gene editing.[ 14 ]
Figure 2.
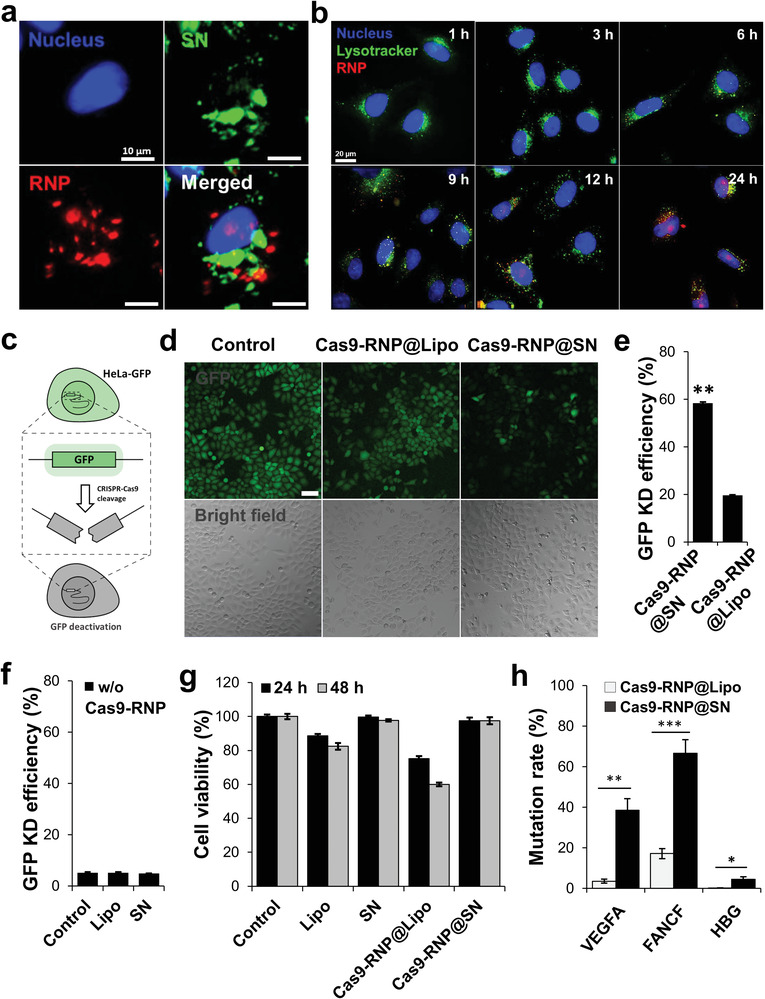
Intracellular localization and in vitro genome editing using the model. a) Fluorescence corresponding to Cas9‐RNP (red) and SN (green) in the cytoplasm or nucleus independently for 48 h indicated delivery and release of Cas9‐RNP by SN inside the cells. b) Red fluorescence of RNP was separated from the merged yellowish color and shifted to the nucleus of the cells, suggesting the endosomal escape of the complex to the cytoplasm over time. c) Rapid evaluation of model gene editing efficacy using quantification of GFP expression level. d) Substantial decrease in green fluorescence was observed in the cells treated with Cas9‐RNP@SN compared to those treated with Cas9‐RNP@SN. Scale bar is 100 µm. e) Bar‐graph presenting the GFP knockout efficiency showed that the GFP‐negative cell population significantly increased in the cells treated with Cas9‐RNP@SN to 59.0% relative to those with Cas9‐RNP@Lipo (19.1%). **p < 0.01. f) Bar‐graph presenting the GFP knockout efficiency in control groups (no treat, Lipo only, and SN only) of the treated cells. Scale bar is 100 µm. g) The viability of the treated cells for 24 and 48 h. h) Cas9‐RNP@SN showed an average of 10 times higher mutation rate in three target genes of VEGFA, FANCF, and HBG than Cas9‐RNP@Lipo. ***p < 0.001, **p < 0.01, *p < 0.05.
Next, we evaluated the efficacy of Cas9‐RNP@SN‐mediated gene editing in live cells. To quantitatively measure the knockout of gene expression, we prepared green fluorescent protein (GFP)‐expressing HeLa (GFP‐HeLa) cells to rapidly visualize the mutation rate in cells and designed sgRNAs targeting the GFP encoded gene in GFP‐HeLa cells (Figure 2c). GFP‐HeLa cells were treated with Cas9‐RNP@SN (Cas9 protein:sgRNA = 2:1, w/w) in a 24‐well plate for 4 h in serum‐free media, which are suitable conditions for further in vitro and ex vivo applications;[ 15 ] this was followed by replacement with fresh serum‐containing media. The commercial lipid‐based reagent Lipofectamine (Lipo), was used as a control. The relative GFP expression levels were estimated by measuring the fluorescence signals of the cells using fluorescence microscopy and flow cytometry. A substantial decrease in green fluorescence was observed in cells treated with Cas9‐RNP@SN compared with that in cells treated with Cas9‐RNP@Lipo, Lipo, and SN alone (Figure 2d; and Figure S6a, Supporting Information). The GFP‐negative cell population was also significantly increased in the cells treated with Cas9‐RNP@SN to 59.0% relative to the untreated control, compared to the treatment with Cas9‐RNP@Lipo (19.1%), Lipo (5.19%), and SN (4.9%) (Figure 2e,f; and Figure S6b, Supporting Information). This result showed a higher GFP knockout effect of SN‐mediated Cas9‐RNP delivery than Lipo‐mediated one. SN‐mediated Cas9‐RNP delivery resulted in higher gene knockout than Lipo as well as higher cell viability (99.5%) than Cas9‐RNP@Lipo (59.5%) and Lipo (81.3%) alone for 48 h (Figure 2g), suggesting that SN was an effective RNP delivery vehicle with low cytotoxicity. In addition, we further tested Cas9‐RNP@SN in three endogenous genes, VEGFA, FANCF, and HBG, using three corresponding sgRNAs, respectively. Two days after the introduction of Cas9‐RNP@SN targeting each gene, genomic DNA was prepared from the bulk cell populations and subjected to targeted deep sequencing using Illumina MiniSeq (Tables S1 and S2, Supporting Information). The results showed that mutation rates were 38.5%, 66.6%, and 4.43% for the VEGFA, FANCF, and HBG genes, respectively, which were 5–20 fold higher that the mutation rates obtained by Cas9‐RNP@Lipo (Figure 2h).
Next, we investigated the multiplexing capability of Cas9‐RNP@SN with two sgRNAs in cells. As a model system, we focused on targeting FGFR3 and TACC3 on chromosome 4. In normal cells, both genes show low expression levels, but cell proliferation can be activated when both proteins are overexpressed by FGFR3–TACC3 (F‐T) fusion,[ 16 ] leading to cancer.[ 16 , 17 , 18 ] Studies have identified fusion genes as attractive therapeutic targets across many tumor types. Thus, to inhibit cancer, it is required to target both genes at once to disrupt the F‐T fusion gene (Figure 3a). Moreover, several cancers have targetable F‐T fusion genes, including cervical cancer.[ 16 , 19 ] As an example, HeLa, a representative cell of cervical cancer, also has F‐T.[ 16b ]
Figure 3.
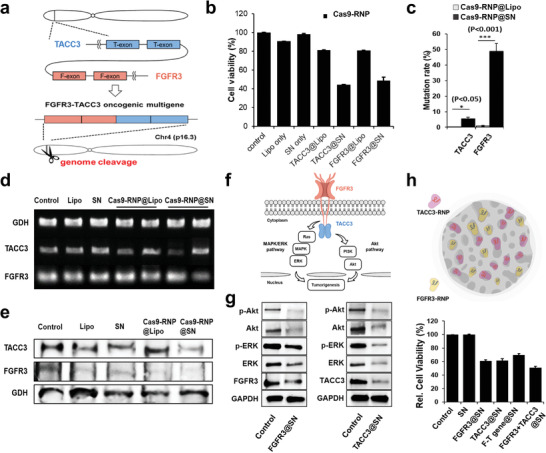
Multiple genome editing efficacy in human cells. a) F‐T fusion genes encoded on chromosome 4. b) The relative cell proliferation was analyzed after treatment of FGFR3‐ or TACC3‐targeting Cas9‐RNP via the MTS assay. Cell viability in the Lipo‐mediated Cas9‐RNP complex group remained over 80% for both FGFR3 and TACC3, whereas the Cas9‐RNP@SN‐treated groups showed a viability of below 45%. c) Analysis of the mutation frequency of targets of Cas9‐RNP by NGS. The mutation rate for TACC3 was over 5.46%, while Lipo showed a negligible mutation rate. Importantly, the case of FGFR3 showed over 48.9% rate that was over 50‐fold enhancement compared with the result of Lipo. Targeting FGFR3 and TACC3 resulted in gene expression by gene editing up to 45% and 40% of RT‐PCR d), and protein level less than 20% of western blotting e), but treatment with the vehicle alone or the untreated controls did not result in a knockout. f) Mechanism of tumorigenesis via MARK/ERK and Akt pathways. g) Signal transduction mechanism of multiple gene editing. Knockout of FGFR3 and TACC3 inhibited the activation of both the ERK and Akt signal pathways, which consequentially decreased the protein levels of phosphorylated ERK (p‐ERK) and phosphorylated Akt (p‐Akt). h) Relative cell viability showing the remarkable gene editing efficacy of target genes by coediting multiple genes by delivering Cas9‐RNPs on a single nanoparticle. The schematic image was drawn using the online tool BioRender.
To this end, we designed sgRNAs targeting FGFR3 and TACC3 genes, and treated HeLa cells with the Cas9‐RNP@SN containing both sgRNAs. Two Cas9‐RNP were independently prepared using the same ratio of cas9/sgRNA (2:1, w/w) and loaded to SN with a total cas9 wt% per SN mg (25%, w/w). Lipo‐mediated assays were systematically optimized prior to experiments to compare Cas9‐RNP delivery systems (Figure S7, Supporting Information), where 8× Lipo allowed the highest gene editing efficiency but with slight toxicity; × means the arbitrary concentration of the suggested volume of Lipo corresponding to the treated amount of sgRNA based on the manufacturer's protocol. Considering its efficacy and safety, 4× Lipo was used in subsequent studies.
The relative cell proliferation was analyzed after treating the cells with FGFR3‐ or TACC3‐ targeting Cas9‐RNP via an MTS (3‐(4,5‐dimethylthiazol‐2‐yl)‐5‐(3‐carboxymethoxyphenyl)‐2‐(4‐sulfophenyl)‐2H‐tetrazolium) assay. The viability of Cas9‐RNP@SN‐treated cells was <45% for both FGFR3 and TACC3 (Figure 3b). The relative caspase 3/7 activity in the SN‐mediated RNP‐treated group was ten times higher than that in the vehicle alone or control groups (Figure S8a, Supporting Information). Targeted deep sequencing analysis for bulk cell populations revealed that the mutation rates were ≈51.9% and 5.9% for FGFR3 and TACC3, respectively, indicating the multiplexing capability of Cas9‐RNP@SN (Figure 3c; and Figure S8b and Tables S1 and S2, Supporting Information). The efficacy was further evaluated at the mRNA and protein levels using RT‐PCR and western blotting, respectively. As expected, targeting FGFR3 and TACC3 decreased the gene expression levels by up to 45% and 40%, respectively, and protein levels by less than 20%, compared to vehicle alone or untreated controls (Figure 3d,e; and Figure S8c,d, Supporting Information).
Since the F‐T fusion gene activates oncogenic pathways, such as MAPK/ERK and PI3K/Akt signaling (Figure 3f),[ 16 , 18 , 20 ] we investigated the effect of multiple gene edits on these signal transduction mechanisms. Knockout of FGFR3 and TACC3 induced the down‐regulation of both ERK and Akt, which reduced the protein levels of phosphorylated ERK (p‐ERK) and phosphorylated Akt (p‐Akt), consistent with previous results (Figure 3g).[ 16 , 18 , 20 ] These results indicate that SN enables multigene engineering with high specificity and the disruption of FGFR3 and TACC3 genes could suppress cervical cancer growth by inhibiting the ERK and Akt signaling pathways.
More importantly, the simultaneous delivery of each sgRNA targeting multiple genes with half amount in a single SN was able to generate an effective gene deletion. We observed knockout of the fusion gene with high efficiency, deactivation of the oncogenic pathways of MAPK/ERK and PI3K/Akt signaling, and the corresponding practical cell death effect (over 50%) with a high mutation efficiency (46.9%) (Figure 3h; and Figure S8e–g, Supporting Information). These results demonstrate the multiplexing capability of Cas9‐RNP@SN and suggest new alternative approaches for coediting multiple genes to obtain a potential inhibitor of fusion genes.
Given the effectiveness of multigene disruption (i.e., the F‐T fusion gene) with Cas9‐RNP@SN in HeLa cells, we further expanded the application of Cas9‐RNP@SN delivery in a xenograft mouse model bearing HeLa cells for cancer therapy. A tumor‐bearing mouse model was prepared by subcutaneously injecting a suspension of HeLa cells (6 × 10⁶ cells) in 100 µL of sterilized PBS into BALB/c male nude mice (5‐week‐old). To monitor the distribution of Cas9‐RNP@SN after systemic injection in the xenograft mouse model, Cas9 protein, and SN were labeled with Cy5 (Cy5‐Cas9‐RNP) and Cy7 (Cy7‐SN), respectively, to minimize the autofluorescence signals. Fluorescence was monitored by whole‐body imaging after intravenous injection of Cas9‐RNP@SN with two sgRNAs targeting FGFR3 and TACC3, and the major organs were excised from the mice. The Cas9‐RNP delivery system took advantage of the enhanced permeability and retention (EPR) effect owing to the well‐suited size distribution in the subnanometer range of the complex.[ 21 ] Moreover, the surface properties of the functional groups and the consequential pK a range of RNP@SN (7–9) could contribute to circumventing the accumulation in the spleen (2–6), liver (6–6.4), and lung (over 9).[ 22 ] We found that the fluorescence signals of the Cas9 protein and SN were strongly observed in the tumors and were slightly detected in the liver and lung (Figure 4a; and Figure S9a–d, Supporting Information). While the fluorescence signals from the free Cas9‐RNP‐treated tumor disappeared due to the degradation and removal of the Cas9 protein, the fluorescence signals in the Cas9‐RNP@SN‐treated tumor persisted for over 2 days, indicating that SN enabled the sustained release of Cas9‐RNP and maintained Cas9 protein activity with high stability. In addition, TEM images showed the intracellular localization of Cas9‐RNP@SN in the cytoplasm (Figure 4b). Collectively, these results demonstrated the tumor‐specific intracellular delivery of Cas9‐RNP with relatively long‐lasting activity and circumventing accumulation in major organs, suggesting that this approach could minimize undesired side effects and maximize the gene editing efficacy.
Figure 4.
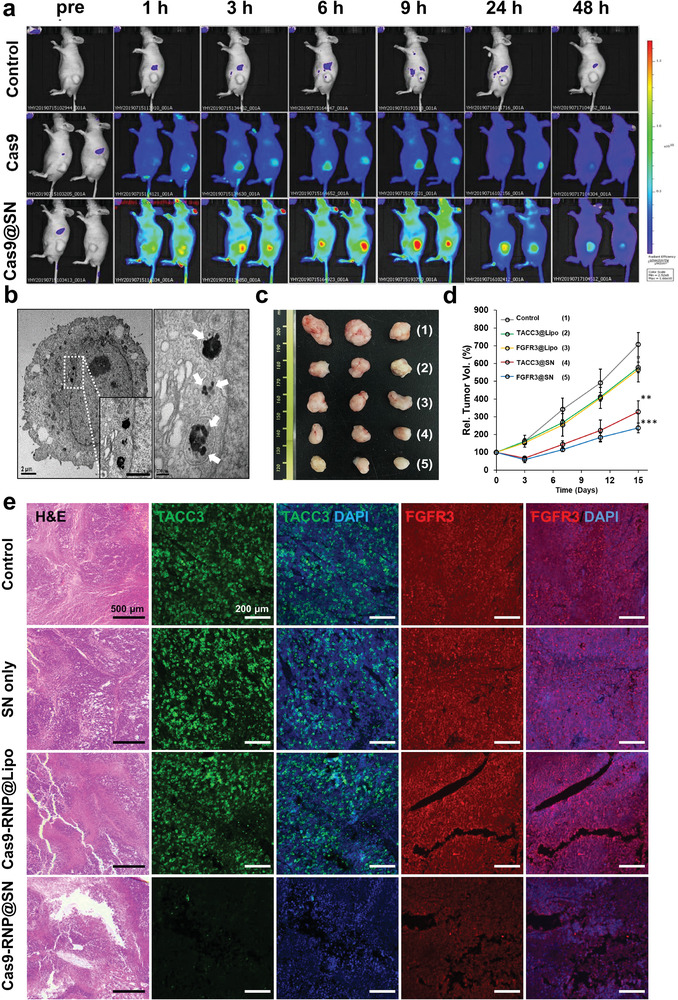
In vivo evaluation of Cas9‐RNP@SN‐mediated gene therapy. a) Real‐time whole‐body image after intravenous injection of Cas9‐RNP or Cas9‐RNP@SN. The fluorescence signals of the Cas9 protein were strongly observed in tumors treated with Cas9‐RNP@SN and remained over 2 days (n = 3). b) The transmission electron microscopy image of cancer cells from tumors shows the intracellular localization of the Cas9‐RNP@SN in the cytoplasm. The white arrow indicated the SNs colored black with round shapes in the images. c,d) Antitumor activity of Cas9‐RNP by genome editing in multiple genes (FGFR3 and TACC3) in a human cancer xenograft mouse model (n = 3). Tumor growth in the mice treated with Cas9‐RNP@SN targeting FGFR3 (FGFR3@SN) and TACC3 (TACC3@SN) was significantly suppressed compared to that in other groups treated with Cas9‐RNP@Lipo (FGFR3@Lipo and TACC3@Lipo), **p < 0.01, ***p < 0.001. e) Hematoxylin and eosin staining showing intensive apoptosis only in tumors treated with Cas9‐RNP@SN. The fluorescence images show a notable decrease in fluorescence of both FGFR3 (green) and TACC3 (red) in sectioned tissue treated with Cas9‐RNP@SN, which was confirmed using fluorescence conjugated‐antibody by immunohistochemistry.
Next, we investigated the antitumor activity of Cas9‐RNP in a xenograft mouse model. Each tumor was grown to 100 mm3 in volume and then treated with Cas9‐RNP@Lipo, Cas9‐RNP@SN (6 mg mL−1, Cas9‐RNP, 100 µL), or PBS by intravenous injection. Changes in tumor volume in each group were monitored for 15 days. Notably, tumor growth in mice treated with Cas9‐RNP@SN targeting FGFR3 (FGFR3@SN) and TACC3 (TACC3@SN) was significantly suppressed. However, mice in the other groups treated with Cas9‐RNP@Lipo (FGFR3@Lipo and TACC3@Lipo) showed negligible differences in the tumor volume compared with the control groups (Figure 4c,d). Based on the significant differences in tumors from the various groups, hematoxylin and eosin staining of tumor sections was performed 15 days after treatment. Histological images showed extensive apoptosis only in tumors treated with Cas9‐RNP@SN, which was significantly higher than that observed in the Cas9‐RNP@Lipo‐, SN alone‐, and 1× PBS‐treated groups (Figure 4e). Moreover, no remarkable systemic toxicity was observed in the histological sections of the major organs of mice treated with the Cas9‐RNP@SN (Figure S9e, Supporting Information). Together, these results indicate that SN enables the safe delivery of Cas9‐RNP and promotes site‐specific gene modification while mitigating any potential undesirable side effects in normal tissues.
Sectioned tissue excised from each mouse was evaluated by immunohistochemistry to investigate the knockout of multiple genes by Cas9‐RNP@SN. Fluorescence images showed a notable decrease in the fluorescence of both FGFR3 (green) and TACC3 (red) in tissues treated with the Cas9‐RNP@SN complex compared to that in tissues treated with Cas9‐RNP@Lipo, SN alone, and 1× PBS only, suggesting the successful knockout of target gene expression via SN‐mediated gene editing in a mouse xenograft model (Figure 4e). Collectively, these results demonstrated that Cas9‐RNP@SN effectively induced cell death and inhibited tumor growth by target‐specific genome editing in vivo without systemic toxicity.
Based on the successful delivery of Cas9‐RNP via the SN, we next investigated whether base editing could be achieved by delivery of ABE‐RNP or CBE‐RNP via the SN in various human or mouse cell lines. The validation of Cas9‐RNP and BE‐RNP delivery is essential for developing a universal RNP delivery platform. To this end, we purified the ABEmax and AncBE4max proteins for ABE and CBE, respectively, and designed four sgRNAs for an A‐to‐G substitution and two sgRNAs for a C‐to‐T substitution in the endogenous locus of human or mouse cells (Table S1, Supporting Information). After treatment of ABE‐RNP@SN or CBE‐RNP@SN, the base conversion rates were assessed by targeted deep sequencing from bulk cells (Table S2, Supporting Information). ABE‐RNP@SN or CBE‐RNP@SN‐mediated base editing efficiencies at the target sites were found to be at an average of 9.49 ± 2.5% across the four genes (VEGFA, ABEsite8, HEKsite2, and FANCF) in HeLa cells (Figure 5a), 8.65 ± 2.1% (HEKsite2) in HEK293 cells (Figure 5b), 2.86 ± 1.2% across the three genes (VEGFA, ABEsite8, and HEKsite2) in hMSC (Figure 5c), and 9.79 ± 5.9% across the three genes (Nr2e3, Ar‐2, and Fah) in NIH3T3 mouse cells (Figure 5d). Compared to commercialized Lipo‐based methods, the average base substitution efficiency was more than 10‐fold in different types of genes (Figure S10, Supporting Information). This result demonstrates the broad applicability of SN‐mediated RNP delivery to cells.
Figure 5.
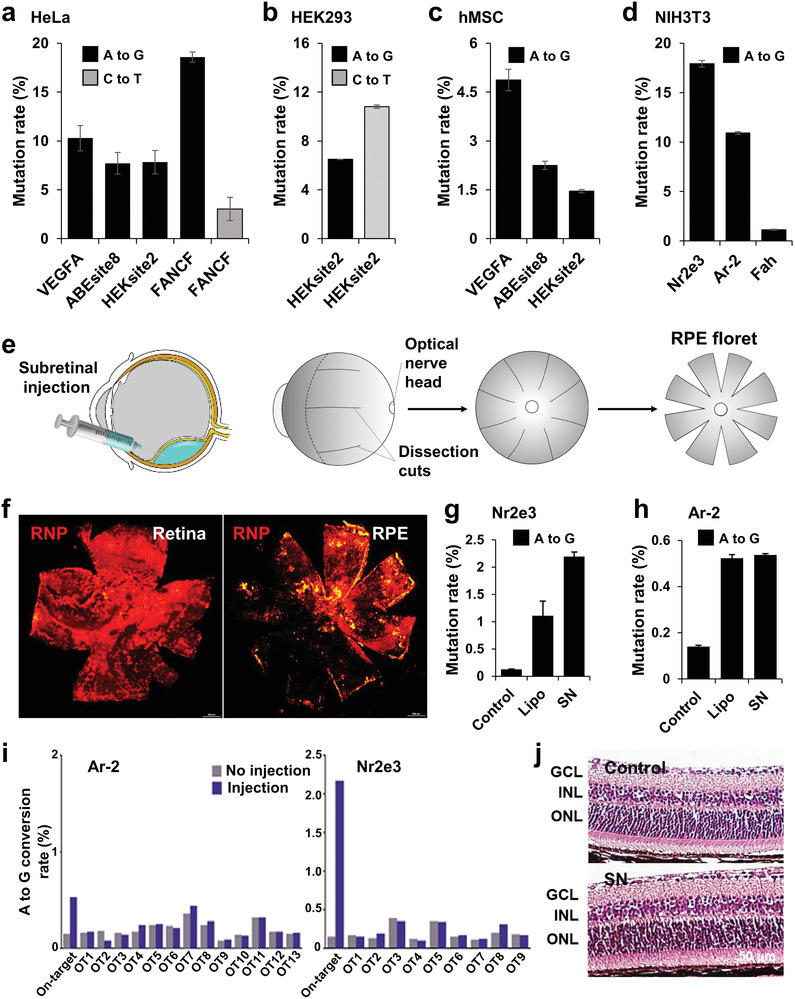
SN‐mediated cytosine and adenine base editing. a–d) Base editing efficiency following SN‐mediated BE‐RNP delivery to various cultured cells: a) HeLa, b) HEK293, c) hMSC, and d) NIH3T3. e) Schematic diagram of the RNP subretinal injection and tissue preparation. f) Biodistribution of RNP in the retinal pigment epithelium and retinal whole mounts after SN‐mediated subretinal delivery. g and h) SN‐mediated adenine base editing in mice after subretinal injection (n = 3). In all cases, the bars represent the mean ± S.D. i) Adenosine editing frequency at the 13 potential off‐target (OT) sites (Ar‐2) and 9 potential OT sites (Nr2e3) for the used sgRNA with SN in one representative mouse eye tissue. j) Retinal morphology and thickness from the mice at six weeks after injection. ONL; outer nuclear layer, GCL; ganglion cell layer, INL; inner nuclear layer. Data are mean ± S.D. n = 4 mice.
Considering the advantages of convenient and rapid ocular experiments, and several genetic retinal diseases that could potentially be cured by genome editing,[ 2 , 10 , 23 ] we explored the in vivo base editing efficiency in the retina of adult mice. Viral vector‐based gene expression is not the best strategy for inducing semipermanent gene editing, and the possibility of long‐term toxicity cannot be avoided.[ 6 , 24 ] Instead, it is necessary to develop a technology that can effectively disperse and deliver therapeutic agents to the retina. In this experiment, the Cas9 protein and SN were labeled with Cy3 (Cy3‐Cas9‐RNP; red) and Cy5 (Cy5‐SN; pseudogreen) to monitor the distribution of Cas9‐RNP@SN before construction of ABE‐RNP@SN. We then delivered the Cas9‐RNP@SN directly into the subretinal space, and Cas9‐RNP@Lipo was also used as a control. Six hours later, the eyes were harvested, and whole mount of both the retina and retinal pigment epithelium (RPE) were prepared to examine the distribution of RNP and SN (Figure 5e). Fluorescence microscopy data showed intense and broad fluorescence of RNP and SN in the retina and RPE treated with RNP@SN (Figure 5f; and Figure S11a, Supporting Information). However, relatively weak fluorescence signals were observed in the cells treated with RNP@Lipo (Figure S11b, Supporting Information). These experiments suggest that SN efficiently delivers RNP in vivo and exhibits broad distribution compared with Lipo‐mediated RNP delivery; thus, it can be used for RPE cell‐specific expression.
As a proof‐of‐concept study of base editing in vivo, we selected sgRNAs for the Nr2e3 and Ar‐2 genes because these sgRNAs showed relatively high editing efficiencies (17.93% and 10.93%) in NIH3T3 cells (Figure 5d; and Tables S1 and S2, Supporting Information). Notably, editing these genes is not expected to affect the viability or function of retinal cells. Two days after a single subretinal injection, the mice were euthanized, and the RPE was collected for targeted deep sequencing. Our analysis data showed that the average editing efficiency of ABE‐RNP@SN was 2.2 ± 0.25% in Nr2e3 (higher than that of Lipo, 1.11 ± 0.46%) (Figure 5g) and 0.53 ± 0.06% in Ar‐2 (similar to that of Lipo, 0.52 ± 0.02%) (Figure 5h). Collectively, these results demonstrate that BE‐RNP@SN is as effective for in vivo base editing as Cas9‐RNP@SN. We expect that additional experiments and optimization of these conditions will improve the genome editing efficiency in the near future.
Next, we examined the toxicity of the SN‐mediated delivery in mice. First, we examined off‐target effects in the genome. Potential off‐target (OT) sites were determined using the Cas‐OFFinder software,[ 25 ] in which up to three mismatches were involved compared to the on‐target sequences (Tables S3 and S4, Supporting Information). Ultimately, targeted deep sequencing was conducted with 13 OT sites for sgRNA targeting Ar‐2 and with 9 OT sites for sgRNA targeting Nr2e3. However, no detectable off‐target substitutions were observed, indicating the superior specificity of the BE‐RNP@SN approach (Figure 5i; and Figure S12, Supporting Information).
To further investigate retinal function after treatment with ABE‐RNP@SN, we performed electroretinography (ERG) and measured the optomotor response 6 weeks after subretinal injection. ERG responses were maintained, with no significant difference between the control and ABE‐RNP@SN‐treated groups after the initial injection (Figure S13a–d, Supporting Information). Similarly, the spatial threshold for the virtual rotation stimulus did not differ between the two groups in optomotor response measurements (Figure S13e, Supporting Information). Moreover, no retinal anatomical changes were observed after injection of ABE‐RNP@SN (Figure 5j); the vehicle was degraded or excreted, leaving no residues in the mice and cultured cells (Figure S14, Supporting Information), which eliminated the concerns regarding the unintended potential systemic toxicity of vehicles. We also empathize that colloidal silica is generally recognized as safe by the US FDA, which can ensure the high biocompatibility of SN.[ 12 ] Taken together, these results imply that SN‐mediated base editing technology in mouse RPE is substantially applicable, with excellent biocompatibility.
3. Conclusion
We report an easy‐to‐load and robust SN‐based RNP delivery platform that leverages the SN to load variable‐sized cargo, such as Cas9‐RNP, CBE‐RNP, and ABE‐RNP. The SN exhibited characteristics such as a high packing ability of multiple components of RNPs per single nanoparticle, protection of nuclease enzymatic activity, efficient cellular permeability, endosomal escape, and pH‐dependent effective release of RNP from the SN to the cytoplasm.
Compared with lipid‐based methods for direct cytosolic delivery of Cas9‐RNP, our system showed an improved genome editing ability for various target genes in vitro, including multiple genes that are highly relevant for the fusion gene of cancer development and cancer. Importantly, the editing efficiency was not significantly reduced with the simultaneous delivery of two different Cas9‐RNPs, which allowed the monitoring of synergistic effects when a single‐vehicle SN was used. We found that systemic delivery of the SN platform via intravenous injection mainly targeted cancer cells with less delivery to the liver, lung, and spleen. Although the detailed mechanism was not revealed in this study, the subnanometer size distribution and the engineered surface properties of the SN might allow us to circumvent the accumulation in major organs, which could be used for cancer therapy. Furthermore, the SN‐mediated RNP delivery system showed robust genome editing outcomes, tumor‐specific accumulation, and high stability and retained enzyme activity, indicating efficacy and safety in a xenograft mouse model.
Despite the challenging delivery application, the BE‐RNP delivery system showed relatively low genome editing efficiency (averaged over 10% base substitution efficiency) compared to the Cas9‐RNP system; the base editing degree with SN is promising compared with that reported previously. The biocompatible SN achieved a low OT efficiency by targeting various cells and genes. In particular, SN showed twice the base editing efficiency compared to the lipid‐based carrier following subretinal injection of SN into mouse eyes. More importantly, SN showed good distribution in the RPE and retina, low toxicity, and high biodegradability, and did not affect retinal function in vivo.
Because of its sponge‐like structure and surface functionality, SN can provide modularity, rapid encapsulation, controllable delivery of multicargo, sustained release, and diversity of administration routes, which is a major benefit over conventional methods that show complexity and less pliability. If the target ligand is adequately conjugated on the outer surface of SN or if diverse functional groups are engineered according to the pK a range of organs, tissue‐specific therapeutics are expected, and in‐depth studies for applying various sizes of SN and cells a required in the future to increase the editing efficiency. In addition, we confirmed that SN is excreted or degraded after the delivery of RNPs; however, the exact half‐life of the RNP@SN complex needs to be evaluated in mice or animals. We expect this platform to be promising as a unique and modular RNP delivery system for in vivo genome editing and other editing systems such as homology‐directed repair[ 26 ] and prime editing.[ 27 ]
4. Experimental Section
Materials
Cetyl trimethyl ammonium bromide (CTAB) was purchased from Acros Organics (Waltham, MA). 3‐Aminopropyltriethoxysilane (APTES), tetraethyl orthosilicate (TEOS), triethylamine (TEA), toluene, dimethyl sulfoxide (DMSO), and mesitylene (trimethyl benzene, TMB) were purchased from Sigma‐Aldrich (St. Louis, MO). Phosphate‐buffered saline (PBS, 10×), Dulbecco's modified Eagle's medium (DMEM), fetal bovine serum (FBS), and Penicillin/streptomycin (P/S, 100×) were purchased from WELGENE (Korea). Lipofectamine CRISPRMAX Cas9 transfection reagent was purchased from Thermo Fisher Scientific. TRIzol regent for total RNA isolation and Superscript II reverse transcriptase were purchased from Life Technologies. Primers were purchased from Bioneer (Korea). Cas9 protein was purchased from ToolGen (Korea). sgRNAs for animal studies were purchased from Integrated DNA Technologies Inc. (Korea), and sgRNAs for cell studies were transcribed in vitro.
Preparation and Characterization of the SN
TEOS solution was added to the solution using a tube connected syringe‐pump at 0.5 mL h−1 into 2 g of CTAB and 0.18 g of TEA dissolved in a weak basic solution, followed by stirring for 1 h at RT and further aging for 24 h at 60 °C to prepare the monodisperse SN. The product was dissolved in the 5 mL of TMB in 50% ethanol and autoclaved at 140 °C for 24 h in a furnace. The resulting product was calcinated in a furnace at 550 °C for 1 h to remove CTAB and organic residue. The SN was suspended in APTES solution for surface modification, and the suspension was refluxed at 120 °C overnight. The pore size, surface area, and pore volume of SN were analyzed using nitrogen sorption experiments. Nitrogen sorption isotherms were obtained using NOVA surface area analyzer (Nova 2200e, Quantachrome Instruments). Prior to the measurements, the sample was degassed for 12 h at 573 K. A morphological study was carried out using TEM (JEM1010, JEOL, Japan) and SEM (GEMINI560, ZEISS, Germany), and the zeta potential was measured using a Zetasizer NS90 (Malvern Panalytical Ltd, Malvern, UK).
Cell Culture
HeLa cells (passage 2) were obtained from the American Tissue Culture Collection (ATCC). The cells were incubated in DMEM (LM001‐05, WELGENE) containing 10% FBS (S001‐01, WELGENE) and 1% P/S (LS202‐02, WELGENE) in the presence of 5% CO2 at 37 °C. The HeLa cells were isolated from the cell culture plates using a 0.05% trypsin‐EDTA (LS015‐01, WELGENE). Ten microliters of the cell solution were stained with the same amount of tryptophan blue (0.4%), spread on an EVETM cell counter slide (EVS‐050), and counted using a EVETM automated cell counter (NanoEnTek). HEK293 (immortalized human embryonic kidney cells), hMSC (human mesenchymal stem cells), and NIH3T3 (embryonic fibroblasts) cells were cultured and maintained according to the method described above. Mycoplasma contamination was not observed in any of the cells.
In Vitro Transcription of Single‐Guide RNAs
Template oligonucleotides containing the T7 RNA polymerase promoter and sgRNA sequences were synthesized by Macrogen (Korea), (Table S1, Supporting Information) and extended by Phusion polymerase (Thermo Fisher Scientific). After template extension, the resulting DNA was purified using a PCR Purification Kit (GeneAll, Korea). The template DNA was transcribed using T7 RNA polymerase (New England Biolabs) in a mixture containing 100 mm MgCl2, 100 nm NTPs, 10× T7 RNA buffer, DEPC‐treated water, and 100U RNase inhibitor (New England Biolabs). After overnight incubation at 37 °C, the DNA templates were destroyed with DNase I (New England Biolabs) and the RNA products were purified with an RNeasy MinElute Cleanup Kit (QIAGEN).
Base Editor Expression and Purification
Adenine base editors and cytosine base editors were purified according to the previous study.[ 6a ] HEK293E cells were cultured as described previously, in suspension in DMEM with glucose (4 500 mg L−1) without calcium (WELGENE, Korea) and supplemented with 5% FBS. For overexpression of ABEs and CBEs, HEK293E cells were transiently transfected with pEX‐FlagR‐ABEmax or pEX‐FlagR‐AncBE4max plasmids, which were designed in t previous study. DMSO (Amresco) was added immediately after the transfection to a final concentration of 1%, and the temperature was lowered to 33 °C. Two days after transfection, tryptone (Amresco) was added at a final concentration of 0.5%. Four days after transfection, cells were harvested and resuspended in lysis buffer (20 mm Tris‐HCl [pH 7.5], 1 m NaCl, and 2 mm β‐mercaptoethanol) supplemented with 20% glycerol. The resulting solution was centrifuged, and the supernatant was loaded onto a Ni‐NTA column (Qiagen). The eluted proteins were treated overnight with tobacco etch virus protease and human rhinovirus 3C protease. The sample was mixed with α‐FLAG M1 agarose resin (Millipore Sigma) in the presence of 5 mm CaCl2 and slowly rotated at 4 °C for 1 h. Bound proteins were eluted with buffer A (20 mm Tris‐HCl [pH 7.5], 500 mm NaCl, 2 mm β‐mercaptoethanol, and 20% glycerol) supplemented with 5 mm EGTA. The eluted FLAG‐ABEmax (or FLAG‐CBEmax) was concentrated and further purified using a HiLoad 16/600 Superdex 200‐pg column equilibrated with buffer containing 20 mm Tris‐HCl (pH 7.5), 500 mm NaCl, 1 mm β‐mercaptoethanol, and 20% glycerol (storage buffer). The peak fraction was concentrated to ≈10 mg mL−1, flash‐frozen in liquid nitrogen, and stored at −80 °C.
Preparation of Cas9‐RNP@SN
Cas9‐RNPs were formed by mixing the Cas9 protein and sgRNA for 5 min at RT, and the Cas9‐RNPs were added into the SN‐dissolved PBS (pH 7.4) condition and then smoothly mixed using a pipet and incubated for 30 min.
Release of Cas9‐RNP and Protection Study
To monitor the release of Cas9‐RNP from SN, aliquots of hydrochloric acid were added to Cas9‐RNP@SN in PBS to reach pH of 5 and 6. The release of Cas9‐RNP was measured by using a BCA assay. To examine the stability of Cas9‐RNPs inside the SN and the protective effect of SNs under physiological conditions, Cas9‐RNP@SN and Cas9‐RNP were dispersed in PBS containing proteases. Then the supernatant was collected by centrifuge, and replaced the PBS solution with low pH to measure the protection effect and Cas9‐RNP activity.
Cell Proliferation Assay
A cell proliferation test was conducted using the CellTiter96 aqueous one‐solution cell proliferation assay (MTS, G5440) purchased from Promega, USA. A 96‐well plate was used for cell culture, and the cells were seeded at a density of 10 000 cells per well. After the cells were washed twice with PBS, the same amount of PBS was injected with increasing concentrations of particles ranging from 0 to 1 mg mL−1. The MTS assay was performed according to the manufacturer's instructions. After incubation for 30 min at 37 °C, the fluorescence intensity was measured using an Infinite F200 Pro (TECAN, Männedorf, Switzerland).
Flow Cytometry
GFP‐HeLa cells (3 ×10⁴ cells well−1, 24‐well plate) were treated with the complex (2 µg mL−1, Cas9‐RNP) in serum‐free media for 4 h to measure the GFP knockout efficiency. The cell medium was then replaced with serum‐containing fresh medium, and the cells were incubated for 44 h. After washing with 1× PBS, the cells were collected after treatment with trypsin‐EDTA for 3 min, and 10% FBS was added to the collected cells. After centrifugation (1200 rpm, 3 min), the cells were washed with PBS, and the fluorescence of the cells (1 × 10⁴ cells) was measured using a flow cytometer (FACS Canto, Beckton Dickinson).
Cellular Imaging
To verify whether the SN penetrated the cells and the inner contents of the SN spread out without forming lysosomes, FAM‐labeled SN and Cy5‐labeled Cas9 protein were prepared, and HeLa cells (2 ×10⁴ cells well−1, 24‐well plate) were treated with the complex (2 µg mL−1, Cas9‐RNP) in serum‐free medium for 4 h. The cell medium was replaced with serum‐containing fresh medium and incubated for 24 and 48 h for time‐dependent monitoring. At a certain time‐point, the cells were fixed with 4% paraformaldehyde (HP2031, Biosesang, Korea) and mounted for DAPI staining (H‐1200, Vector Laboratories). To monitor the colocalization of SN and early endosome, the SN‐treated cells were incubated with antibody to EEA‐1 (abcam, #ab2900, Rabbit polyclonal to EEA1) and sequentially incubated with Alexa Fluor 647‐conjugated goat antirabbit IgG (Life Technologies, #A21245). Fluorescence images were acquired using a confocal microscope (Zeiss) and analyzed using the ImageJ software.
RT‐PCR
Total RNA was isolated from each sample using TRIZOL reagent, followed by cDNA synthesis using Superscript reverse transcriptase, according to the manufacturer's instructions. For target gene amplification, each primer was designed with a GC content of less than 50% and overlapping between two exons of the target genes. The PCR products were separated by gel electrophoresis on 1% agarose gel, and the bands were monitored. The primer sequences were as follows:
TACC3 TCCACAGACGCACAGGATTC / AGACCGGGTGTGAGTTTTCC;
FGFR3 ATGCCACTGACAAGGACCTG / GCCCAGCAGGTTGATGATGT;
F‐T AGGAGTACCTGGACCTGTCGG / TGCGTCTGGACTCGTGGG;
GDH TTGTTGCCATCAATGACCCCTTCATTGACC /
CTTCCCGTTCTCAGCCTTGACGGTG
Western Blotting
Samples were lysed with RIPA buffer (AKR‐190, Koma) containing a 100× protease inhibitor cocktail and incubated for 1 h on ice. The samples were then centrifuged at 12 000 rpm at 37 °C for 15 min. The supernatant of the solution was transferred to a 1.5 mL ep‐tube and stored at −80 °C. For protein quantification, the PierceTM BCA assay kit (#23225, ThermoFisher Scientific) was used according to the manufacturer's instructions. Equal amounts of protein (30 µg) were diluted in water containing 5× loading buffer (S2002, Biosesang, Korea) and loaded onto an SDS‐PAGE gel (Bio‐Rad). The proteins were separated by electrophoresis in Tris‐glycine SDS buffer at 80 V for 120 min. The proteins in the SDS‐PAGE gel were transferred to a 0.45 µm nitrocellulose membrane (#1620145, Bio‐Rad) in 1× Tris‐glycine Native Buffer (HT2028, GenDepot, Korea) with 10% methanol at 50 V and 4 °C for 120 min under stirring conditions. The membrane was blocked with 3% BSA to inhibit nonspecific binding and incubated overnight at 4 °C with the following primary antibodies: GAPDH (ab9485, Abcam, 1:2500), TACC3 (sc‐376883, Santa Cruz, 1:1000), FGFR3 (90313‐T48, Sino, 1:1000), Akt (9272, Cell Signalling, 1:1000), p‐Akt (9271, Cell Signalling, 1:1000), ERK (9102, Cell Signalling, 1:1000), and p‐ERK (9101, Cell Signalling, 1:1000). Horseradish peroxidase (HRP)‐conjugated antibodies, reactive with rabbit (ab6721, Abcam, 1:5000) and mouse (ab6789, Abcam, 1:5000), were used as secondary antibodies, and the membranes were incubated with these antibodies at RT for 1 h. After reacting with the detection agent EzWestLumi plus (WSE‐7120L, ATTO Corporation), protein bands were monitored using ImageQuant LAS 4000 mini (GE Healthcare).
Targeted Deep Sequencing
For analysis of mutation on endogenous on‐target and OT sites, genomic DNA was extracted from cultured cells or mouse RPE tissues using the AccuPrep Genomic DNA Extraction Kit (Bioneer, Korea) according to the manufacturer's instructions. Potential OT sites were identified using Cas‐OFFinder (http://www.rgenome.net/cas‐offinder/),[ 25 ] those with 1–3 mismatches were chosen for off‐target analysis (Tables S3 and S4, Supporting Information). The extracted genomic DNA was amplified using an SUN‐PCR blend (SUN GENETICS) for sequencing library generation. Libraries were sequenced using MiniSeq with a TruSeq HT dual index system (Illumina). The results were analyzed using the Cas‐Analyzer (http://www.rgenome.net/cas‐analyzer/#!)[ 28 ] and BE‐Analyzer (http://www.rgenome.net/be‐analyzer/#!).[ 29 ] The primers used are listed in Table S2 (Supporting Information).
Animal Study
All animal experiments were performed in compliance with the Institutional Animal Care and Use Committee of the Korea Institute of Science and Technology (Approval No. KIST‐2021‐07‐084). Cy5‐Cas9‐RNP and Cy7‐SN were prepared for in vivo monitoring. Mice (6‐week‐old, BALB/c nude, male) were inoculated subcutaneously with HeLa cells in the right flank and randomly divided into three groups. After 2 week incubation, mice in each group were intravenously administered 6 mg mL−1 of Cas9‐RNP@SN into the tail vein. Bright‐field and fluorescence images of the mice were obtained periodically using in vivo fluorescence microscopy (IVIS Spectrum In Vivo Imaging System, PerkinElmer) using wavelength for Cy5 (640/700 nm) and Cy7 (745/800 nm) for the a fair comparison. All acquired images were a for pseudocoloring with fluorescence intensity.
A xenograft mouse model was prepared by implanting 1 × 10⁶ HeLa cancer cells into BALB/c nude male mice with a subcutaneous injection after 1 week of breeding to investigate the antitumor therapeutic effect. The antitumor efficacy was evaluated by measuring the changes in the tumor volume before and after injection of free SN, free TACC3@Lipo, FGFR3@Lipo, TACC@SN, FGFR3@SN (6 mg mL−1), or 1× PBS for 15 days (n = 3). All entities was intravenously injected every 3 days. Tumor volumes were calculated using the following equation: tumor volume = length × (width)2 ×½, where the length and width are the longest and shortest diameters (mm) of the tumor, respectively. Tumor volumes were calculated relative to the initial volumes (100 mm3).
All animal study protocols relevant to the mouse eye‐related experiments were approved by the Institutional Animal Care and Use Committee of the Seoul National University and Seoul National University Hospital. Subretinal injection was performed on the right eye of C57BL/6 mice. RNP@Lipo or RNP@SN in PBS (total volume, 3 µL; BE:gRNA = 2:1, w/w) was injected into the subretinal space of mice under an operating microscope (Leica). A customized Nanofil syringe with a 33G blunt needle (World Precision Instrument) was used for all injections. The mice were maintained under a 12:12 h dark:light cycle.
Histology
Tumor tissues and eyeballs were extracted from euthanized mice using 0.5% avertin and incubated in 4% paraformaldehyde solution at 4 °C for fixation. The tissues were embedded in paraffin blocks and sliced into 5 µm thick sections using a Leica microtome. Tissue sections were histologically visualized. The paraffin‐embedded sections were soaked in xylene three times for deparaffinization and hydrated with decreasing amounts of ethyl alcohol. For hematoxylin and eosin staining, the sections were soaked in hematoxylin solution and subsequently in eosin solution. The sections were sandwiched between the mounting buffer and coverslips and observed under an optical microscope (Leica). For immunofluorescence staining, primary and secondary antibodies were used to monitor the target proteins. First, to increase the specificity and reactivity of the antigen, the deparaffinized and hydrated sections were blocked with 0.3% H2O2 in methanol for 30 min and soaked in citrate buffer for 20 min at 95 °C. The sections were blocked with 3% BSA for 1 h under static conditions to prevent nonspecific binding. The sections were then incubated overnight at 4 °C with the following primary antibodies: anti‐TACC3 (202326‐T10, Sino, 1:500) and anti‐FGFR3 (90313‐T48, Sino, 1:500). The sections were then incubated with the Alexa Fluor 488 goat anti‐rabbit IgG (H+L) secondary antibody (A‐11008, Invitrogen, 1:5000) for 1 h. Sections were mounted with Vectashield mounting medium containing DAPI (H‐1200, Vector Laboratories) and observed using an LSM 700 confocal microscope (Zeiss, Germany).
ERG
Before ERG, the mice were kept in the dark overnight. Deep anesthesia was induced and a Tropherin ophthalmic solution containing phenylephrine hydrochloride (5 mg mL−1) and tropicamide (5 mg mL−1) was administered topically to dilate the pupils. A universal testing and electrophysiologic system 2000 (UTAS E‐2000, LKC) was used for full‐field ERG. The light‐induced responses to a 0 dB xenon flash were recorded at a gain of 2k using a notch filter at 60 Hz; responses were bandpass filtered between 0.1 and 1500 Hz. Graphs were plotted and the amplitudes were estimated using GraphPad Prism 9 software. The a‐wave amplitudes were determined from the baseline to the lowest negative‐going voltage and the b‐wave amplitudes were measured from the a‐wave trough to the highest peak of the positive b‐wave.
Optomotor Response
A virtual reality optokinetic system (OptoMotry HD, CerebralMechanics) was used to measure the grating acuity visual thresholds according to the manufacturer's instructions. Briefly, the mice were placed on a platform where they were exposed to views of a virtual rotating cylinder on monitors surrounding the enclosure, and the grating was tracked with head movements. The visual thresholds were determined using a staircase procedure to produce the maximum spatial frequency (cycles/degree) above which the mice did not respond to rotating stimuli.
Biodegradability of the SN
The amount of Si was analyzed using inductively coupled plasma‐optical emission spectrometry (ICP‐OES) at Seoul National University and KIST Advanced Analysis and Data Center. Harvested cells in the cultured well plate and injected tissue were analyzed at the specific time point.
Statistics and Data Analysis
All images were obtained from at least three independent experiments with similar results. Also, all data were shown mean corrected values ± S.D. of at least three independent experiments unless otherwise stated. Graphing of the data was conducted using Microsoft Office Excel and PowerPoint 2016. All statistical analyses were performed using an unpaired t‐test and GraphPad Prism 9 software. p < 0.05 was considered significant (*p < 0.05, **p < 0.01, ***p < 0.001, and ****p < 0.0001; n.s., not significant). All results are presented as the mean ±standard deviation (S.D.).
Conflict of Interest
The authors declare competing financial interests: S.K., Y.J., and H.L. have filed patent applications based on this work through KIST.
Supporting information
Supporting Information
Acknowledgements
S.K. and Y.K.J. contributed equally to this work. This research was supported by a National Research Foundation of Korea (NRF) grant funded by the Korean government (MSIT) (Grant Nos. 2020M3A9I4038197 to Y.J. and H.L., 2020M3A9I4036072 to S.B., 2022R1C1C2007247 to S.K., and 2022R1A2C1003768 to D.H.J.), the Ministry of Education (Grant No. 2020R1A6A3A01098476 to S.K.), and the KIST project (Grant No. 2E31641 to H.L.). The authors thank Seung Hoe Kim and Kyungwoo Lee at KIST for experimental assistance and graphic design of Figures; Dr. Hong Yeol Yoon at KIST for technical support regarding in vivo mouse whole‐body imaging; Dong‐Jun Koo at Seoul National University for 3D rendering of volume images; and Prof. Jae‐Sung Woo at Korea University for providing highly purified ABE and CBE proteins (AncBE4max and ABEmax).
Kim S., Jeong Y. K., Cho C. S., Lee S., Sohn C. H., Kim J. H., Jeong Y., Jo D. H., Bae S., Lee H., Enhancement of Gene Editing and Base Editing with Therapeutic Ribonucleoproteins through In Vivo Delivery Based on Absorptive Silica Nanoconstruct. Adv. Healthcare Mater. 2023, 12, 2201825. 10.1002/adhm.202201825
Contributor Information
Dong Hyun Jo, Email: lawrenc2@snu.ac.kr.
Sangsu Bae, Email: sbae7@snu.ac.kr.
Hyojin Lee, Email: hyojinlee@kist.re.kr.
Data Availability Statement
The data that support the findings of this study are available from the corresponding author upon reasonable request.
References
- 1.a) Doudna J. A., Charpentier E., Science 2014, 346, 1077; [DOI] [PubMed] [Google Scholar]; b) Shivram H., Cress B. F., Knott G. J., Doudna J. A., Nat. Chem. Biol. 2021, 17, 10; [DOI] [PMC free article] [PubMed] [Google Scholar]; c) Jeong Y. K., Song B., Bae S., Mol. Ther. 2020, 28, 1938; [DOI] [PMC free article] [PubMed] [Google Scholar]; d) Koonin E. V., Makarova K. S., Zhang F., Curr. Opin. Microbiol. 2017, 37, 67; [DOI] [PMC free article] [PubMed] [Google Scholar]; e) Pickar‐Oliver A., Gersbach C. A., Nat. Rev. Mol. Cell Biol. 2019, 20, 490; [DOI] [PMC free article] [PubMed] [Google Scholar]; f) Sander J. D., Joung J. K., Nat. Biotechnol. 2014, 32, 347; [DOI] [PMC free article] [PubMed] [Google Scholar]; g) Kim H., Kim J. S., Nat. Rev. Genet. 2014, 15, 321; [DOI] [PubMed] [Google Scholar]; h) Mali P., Esvelt K. M., Church G. M., Nat. Methods 2013, 10, 957. [DOI] [PMC free article] [PubMed] [Google Scholar]
- 2.a) Cheng H., Zhang F., Ding Y., Pharmaceutics 2021, 13, 1649; [DOI] [PMC free article] [PubMed] [Google Scholar]; b) Levy J. M., Yeh W. H., Pendse N., Davis J. R., Hennessey E., Butcher R., Koblan L. W., Comander J., Liu Q., Liu D. R., Nat. Biomed. Eng. 2020, 4, 97; [DOI] [PMC free article] [PubMed] [Google Scholar]; c) Koblan L. W., Erdos M. R., Wilson C., Cabral W. A., Levy J. M., Xiong Z. M., Tavarez U. L., Davison L. M., Gete Y. G., Mao X., Newby G. A., Doherty S. P., Narisu N., Sheng Q., Krilow C., Lin C. Y., Gordon L. B., Cao K., Collins F. S., Brown J. D., Liu D. R., Nature 2021, 589, 608. [DOI] [PMC free article] [PubMed] [Google Scholar]
- 3. Sharma G., Sharma A. R., Bhattacharya M., Lee S. S., Chakraborty C., Mol. Ther. 2021, 29, 571. [DOI] [PMC free article] [PubMed] [Google Scholar]
- 4.a) Gaudelli N. M., Komor A. C., Rees H. A., Packer M. S., Badran A. H., Bryson D. I., Liu D. R., Nature 2017, 551, 464; [DOI] [PMC free article] [PubMed] [Google Scholar]; b) Komor A. C., Kim Y. B., Packer M. S., Zuris J. A., Liu D. R., Nature 2016, 533, 420; [DOI] [PMC free article] [PubMed] [Google Scholar]; c) Nishida K., Arazoe T., Yachie N., Banno S., Kakimoto M., Tabata M., Mochizuki M., Miyabe A., Araki M., Hara K. Y., Shimatani Z., Kondo A., Science 2016, 353, aaf8729. [DOI] [PubMed] [Google Scholar]
- 5. Chandler R. J., Sands M. S., Venditti C. P., Hum. Gene Ther. 2017, 28, 314. [DOI] [PMC free article] [PubMed] [Google Scholar]
- 6.a) Jang H. K., Jo D. H., Lee S. N., Cho C. S., Jeong Y. K., Jung Y., Yu J., Kim J. H., Woo J. S., Bae S., Sci. Adv. 2021, 7, eabg2661; [DOI] [PMC free article] [PubMed] [Google Scholar]; b) Zuris J. A., Thompson D. B., Shu Y., Guilinger J. P., Bessen J. L., Hu J. H., Maeder M. L., Joung J. K., Chen Z. Y., Liu D. R., Nat. Biotechnol. 2015, 33, 73; [DOI] [PMC free article] [PubMed] [Google Scholar]; c) Wang D., Zhang F., Gao G. P., Cell 2020, 181, 136; [DOI] [PMC free article] [PubMed] [Google Scholar]; d) Rees H. A., Komor A. C., Yeh W. H., Caetano‐Lopes J., Warman M., Edge A. S. B., Liu D. R., Nat. Commun. 2017, 8, 15790. [DOI] [PMC free article] [PubMed] [Google Scholar]
- 7.a) Zhang S., Shen J., Li D., Cheng Y., Theranostics 2021, 11, 614; [DOI] [PMC free article] [PubMed] [Google Scholar]; b) Kim S., Kim D., Cho S. W., Kim J., Kim J. S., Genome Res. 2014, 24, 1012. [DOI] [PMC free article] [PubMed] [Google Scholar]
- 8. Mout R., Ray M., Lee Y. W., Scaletti F., Rotello V. M., Bioconjug. Chem. 2017, 28, 880. [DOI] [PMC free article] [PubMed] [Google Scholar]
- 9.a) Alghuthaymi M. A., Ahmad A., Khan Z., Khan S. H., Ahmed F. K., Faiz S., Nepovimova E., Kuca K., Abd‐Elsalam K. A., Int. J. Mol. Sci. 2021, 22, 7456; [DOI] [PMC free article] [PubMed] [Google Scholar]; b) Chen G., Abdeen A. A., Wang Y., Shahi P. K., Robertson S., Xie R., Suzuki M., Pattnaik B. R., Saha K., Gong S., Nat. Nanotechnol. 2019, 14, 974; [DOI] [PMC free article] [PubMed] [Google Scholar]; c) Lan T., Que H., Luo M., Zhao X., Wei X., Mol. Cancer 2022, 21, 71; [DOI] [PMC free article] [PubMed] [Google Scholar]; d) Pan Y., Yang J., Luan X., Liu X., Li X., Yang J., Huang T., Sun L., Wang Y., Lin Y., Song Y., Sci. Adv. 2019, 5, eaav7199; [DOI] [PMC free article] [PubMed] [Google Scholar]; e) Rosenblum D., Gutkin A., Kedmi R., Ramishetti S., Veiga N., Jacobi A. M., Schubert M. S., Friedmann‐Morvinski D., Cohen Z. R., Behlke M. A., Lieberman J., Peer D., Sci. Adv. 2020, 6, eabc9450; [DOI] [PMC free article] [PubMed] [Google Scholar]; f) Wan T., Chen Y., Pan Q., Xu X., Kang Y., Gao X., Huang F., Wu C., Ping Y., J. Controlled Release 2020, 322, 236. [DOI] [PubMed] [Google Scholar]
- 10.a) Jang H., Jo D. H., Cho C. S., Shin J. H., Seo J. H., Yu G., Gopalappa R., Kim D., Cho S. R., Kim J. H., Kim H. H., Nat. Biomed. Eng. 2022, 6, 181; [DOI] [PubMed] [Google Scholar]; b) Song C.‐Q., Jiang T., Richter M., Rhym L. H., Koblan L. W., Zafra M. P., Schatoff E. M., Doman J. L., Cao Y., Dow L. E., Zhu L. J., Anderson D. G., Liu D. R., Yin H., Xue W., Nat. Biomed. Eng. 2020, 4, 125; [DOI] [PMC free article] [PubMed] [Google Scholar]; c) Zafra M. P., Schatoff E. M., Katti A., Foronda M., Breinig M., Schweitzer A. Y., Simon A., Han T., Goswami S., Montgomery E., Thibado J., Kastenhuber E. R., Sanchez‐Rivera F. J., Shi J., Vakoc C. R., Lowe S. W., Tschaharganeh D. F., Dow L. E., Nat. Biotechnol. 2018, 36, 888. [DOI] [PMC free article] [PubMed] [Google Scholar]
- 11. Banskota S., Raguram A., Suh S., Du S. W., Davis J. R., Choi E. H., Wang X., Nielsen S. C., Newby G. A., Randolph P. B., Osborn M. J., Musunuru K., Palczewski K., Liu D. R., Cell 2022, 185, 250. [DOI] [PMC free article] [PubMed] [Google Scholar]
- 12. Janjua T. I., Cao Y., Yu C., Popat A., Nat. Rev. Mater. 2021, 6, 1072. [DOI] [PMC free article] [PubMed] [Google Scholar]
- 13.a) Alsaiari S. K., Patil S., Alyami M., Alamoudi K. O., Aleisa F. A., Merzaban J. S., Li M., Khashab N. M., J. Am. Chem. Soc. 2018, 140, 143; [DOI] [PubMed] [Google Scholar]; b) Liu B., Ejaz W., Gong S., Kurbanov M., Canakci M., Anson F., Thayumanavan S., Nano Lett. 2020, 20, 4014; [DOI] [PMC free article] [PubMed] [Google Scholar]; c) Chae S. Y., Jeong E., Kang S., Yim Y., Kim J. S., Min D. H., J. Controlled Release 2022, 345, 108; [DOI] [PubMed] [Google Scholar]; d) Chen Z., Liu F., Chen Y., Liu J., Wang X., Chen A. T., Deng G., Zhang H., Liu J., Hong Z., Zhou J., Adv. Funct. Mater. 2017, 27, 1703036. [DOI] [PMC free article] [PubMed] [Google Scholar]
- 14.a) Ekkapongpisit M., Giovia A., Follo C., Caputo G., Isidoro C., Int. J. Nanomed. 2012, 7, 4147; [DOI] [PMC free article] [PubMed] [Google Scholar]; b) Barattin M., Mattarei A., Balasso A., Paradisi C., Cantu L., Del Favero E., Viitala T., Mastrotto F., Caliceti P., Salmaso S., ACS Appl. Mater. Interfaces 2018, 10, 17646. [DOI] [PubMed] [Google Scholar]
- 15. Mout R., Ray M., Yesilbag Tonga G., Lee Y. W., Tay T., Sasaki K., Rotello V. M., ACS Nano 2017, 11, 2452. [DOI] [PMC free article] [PubMed] [Google Scholar]
- 16.a) Rosty C., Aubriot M. H., Cappellen D., Bourdin J., Cartier I., Thiery J. P., Sastre‐Garau X., Radvanyi F., Mol. Cancer 2005, 4, 15; [DOI] [PMC free article] [PubMed] [Google Scholar]; b) Tamura R., Yoshihara K., Saito T., Ishimura R., Martinez‐Ledesma J. E., Xin H., Ishiguro T., Mori Y., Yamawaki K., Suda K., Sato S., Itamochi H., Motoyama T., Aoki Y., Okuda S., Casingal C. R., Nakaoka H., Inoue I., Verhaak R. G. W., Komatsu M., Enomoto T., Oncogenesis 2018, 7, 4; [DOI] [PMC free article] [PubMed] [Google Scholar]; c) Ha G. H., Kim J. L., Breuer E. K. Y., PLoS One 2013, 8, e70353. [DOI] [PMC free article] [PubMed] [Google Scholar]
- 17. Parker B. C., Zhang W., Chin. J. Cancer 2013, 32, 594. [DOI] [PMC free article] [PubMed] [Google Scholar]
- 18. Frattini V., Pagnotta S. M., Tala, J. J. F. , Russo M. V., Lee S. B., Garofano L., Zhang J., Shi P., Lewis G., Sanson H., Frederick V., Castano A. M., Cerulo L., Rolland D. C. M., Mall R., Mokhtari K., Elenitoba‐Johnson K. S. J., Sanson M., Huang X., Ceccarelli M., Lasorella A., Iavarone A., Nature 2018, 553, 222. [DOI] [PMC free article] [PubMed] [Google Scholar]
- 19. Yoshihara K., Wang Q., Torres‐Garcia W., Zheng S., Vegesna R., Kim H., Verhaak R. G., Oncogene 2015, 34, 4845. [DOI] [PMC free article] [PubMed] [Google Scholar]
- 20.a) Zhou T., Yang Z., Chen Y., Chen Y., Huang Z., You B., Peng Y., Chen J., Cell. Physiol. Biochem. 2016, 38, 959; [DOI] [PubMed] [Google Scholar]; b) Kannan K., Coarfa C., Chao P. W., Luo L., Wang Y., Brinegar A. E., Hawkins S. M., Milosavljevic A., Matzuk M. M., Yen L., Proc. Natl. Acad. Sci. USA 2015, 112, E1272; [DOI] [PMC free article] [PubMed] [Google Scholar]; c) Huang S. Z., Wei M. N., Huang J. R., Zhang Z. J., Zhang W. J., Jiang Q. W., Yang Y., Wang H. Y., Jin H. L., Wang K., Xing Z. H., Yuan M. L., Li Y., He X. S., Shi Z., Zhou Q., Front. Oncol. 2019, 9, 150. [DOI] [PMC free article] [PubMed] [Google Scholar]
- 21.a) Almeida J. P., Chen A. L., Foster A., Drezek R., Nanomedicine 2011, 6, 815; [DOI] [PubMed] [Google Scholar]; b) Blanco E., Shen H., Ferrari M., Nat. Biotechnol. 2015, 33, 941; [DOI] [PMC free article] [PubMed] [Google Scholar]; c) Koo D. J., Choi J., Ahn M., Ahn B. H., Min D. H., Kim S. Y., Bioconjug. Chem. 2020, 31, 1784. [DOI] [PubMed] [Google Scholar]
- 22. Dilliard S. A., Cheng Q., Siegwart D. J., Proc. Natl. Acad. Sci. USA 2021, 118, e2109256118. [DOI] [PMC free article] [PubMed] [Google Scholar]
- 23.a) Jo D. H., Song D. W., Cho C. S., Kim U. G., Lee K. J., Lee K., Park S. W., Kim D., Kim J. H., Kim J. S., Kim S., Kim J. H., Lee J. M., Sci. Adv. 2019, 5, eaax1210; [DOI] [PMC free article] [PubMed] [Google Scholar]; b) Ling S., Yang S., Hu X., Yin D., Dai Y., Qian X., Wang D., Pan X., Hong J., Sun X., Yang H., Paludan S. R., Cai Y., Nat. Biomed. Eng. 2021, 5, 144; [DOI] [PubMed] [Google Scholar]; c) Yu W. H., Mookherjee S., Chaitankar V., Hiriyanna S., Kim J. W., Brooks M., Ataeijannati Y., Sun X., Dong L. J., Li T. S., Swaroop A., Wu Z. J., Nat. Commun. 2017, 8, 14716; [DOI] [PMC free article] [PubMed] [Google Scholar]; d) Yin D., Ling S., Wang D., Dai Y., Jiang H., Zhou X., Paludan S. R., Hong J., Cai Y., Nat. Biotechnol. 2021, 39, 567. [DOI] [PMC free article] [PubMed] [Google Scholar]
- 24.a) Kim K., Park S. W., Kim J. H., Lee S. H., Kim D., Koo T., Kim K. E., Kim J. H., Kim J. S., Genome Res. 2017, 27, 419; [DOI] [PMC free article] [PubMed] [Google Scholar]; b) Jo D. H., Koo T., Cho C. S., Kim J. H., Kim J. S., Kim J. H., Mol. Ther. 2019, 27, 130. [DOI] [PMC free article] [PubMed] [Google Scholar]
- 25. Bae S., Park J., Kim J. S., Bioinformatics 2014, 30, 1473. [DOI] [PMC free article] [PubMed] [Google Scholar]
- 26.a) Gratz S. J., Ukken F. P., Rubinstein C. D., Thiede G., Donohue L. K., Cummings A. M., O'Connor‐Giles K. M., Genetics 2014, 196, 961; [DOI] [PMC free article] [PubMed] [Google Scholar]; b) Lin S., Staahl B. T., Alla R. K., Doudna J. A., Elife 2014, 3, e04766; [DOI] [PMC free article] [PubMed] [Google Scholar]; c) Farbiak L., Cheng Q., Wei T., Álvarez‐Benedicto E., Johnson L. T., Lee S., Siegwart D. J., Adv. Mater. 2021, 33, 2006619. [DOI] [PMC free article] [PubMed] [Google Scholar]
- 27. Anzalone A. V., Randolph P. B., Davis J. R., Sousa A. A., Koblan L. W., Levy J. M., Chen P. J., Wilson C., Newby G. A., Raguram A., Liu D. R., Nature 2019, 576, 149. [DOI] [PMC free article] [PubMed] [Google Scholar]
- 28. Park J., Lim K., Kim J. S., Bae S., Bioinformatics 2017, 33, 286. [DOI] [PMC free article] [PubMed] [Google Scholar]
- 29. Hwang G. H., Park J., Lim K., Kim S., Yu J., Yu E., Kim S. T., Eils R., Kim J. S., Bae S., BMC Bioinformatics 2018, 19, 542. [DOI] [PMC free article] [PubMed] [Google Scholar]
Associated Data
This section collects any data citations, data availability statements, or supplementary materials included in this article.
Supplementary Materials
Supporting Information
Data Availability Statement
The data that support the findings of this study are available from the corresponding author upon reasonable request.