

Abstract
3D cell culture is becoming increasingly important for mimicking physiological tissue structures in areas such as drug discovery and personalized medicine. To enable reproducibility on a large scale, automation technologies for standardized handling are still a challenge. Here, a novel method for fully automated size classification and handling of cell aggregates like spheroids and organoids is presented. Using microfluidic flow generated by a piezoelectric droplet generator, aggregates are aspirated from a reservoir on one side of a thin capillary and deposited on the other side, encapsulated in free‐flying nanoliter droplets to a target. The platform has aggregate aspiration and plating efficiencies of 98.1% and 98.4%, respectively, at a processing throughput of up to 21 aggregates per minute. Cytocompatibility of the method is thoroughly assessed with MCF7, LNCaP, A549 spheroids and colon organoids, revealing no adverse effects on cell aggregates as shear stress is reduced compared to manual pipetting. Further, generic size‐selective handling of heterogeneous organoid samples, single‐aggregate‐dispensing efficiencies of up to 100% and the successful embedding of spheroids or organoids in a hydrogel with subsequent proliferation is demonstrated. This platform is a powerful tool for standardized 3D in vitro research.
Keywords: automation, high‐throughput, microfluidics, organoids, spheroids
The novel Pick‐Flow‐Drop method for controlled 3D cell aggregate manipulation is presented. Selective single spheroid or organoid aspiration and deposition is enabled as a generic and fully automated handling procedure. As the method is highly efficient in terms of sample recovery and throughput, it can be applied to standardize and automatize 3D cell culture, for example, for personalized therapy.

1. Introduction
3D in vitro models are useful tools to mimic in vivo behavior under physiological conditions, for example, for drug screening or personalized therapy approaches.[ 1 ] In particular, multicellular aggregates such as spheroids or organoids are candidates to bridge the gap between standard 2D cell culture and complex, expensive, ethically debatable, and time‐consuming xenografts.[ 2 , 3 ] Research using 3D cell culture models typically involves many manual steps.[ 3 ] The increased complexity of the models introduces a wide range of inter‐ as well as intra‐sample heterogeneity with respect to variations in size, shape, cell composition, and architecture of individual cell aggregates. This heterogeneity challenges the interpretation of study results involving assessments such as proliferation, growth, and invasion behavior.[ 4 ] In addition, different handling steps, variations due to different operators, low levels of automation or low throughput reduce the comparability of results and limit the potential of 3D in vitro studies.[ 5 ]
Only a few techniques focus on the controlled handling and placement of 3D cell aggregates, which is essential to establish standardized and user‐controlled conditions for different tasks and applications in 3D cell culture.
One established technique for automated positioning of cell aggregates is the Pick‐and‐Place method.[ 6 ] The spheroids are partially or completely drawn into a pipette tip or thin capillary by negative pressure. To place the spheroids to the desired target position, the pressure is simply reversed. This method has been widely used for example to study spheroid sprouting, to establish assays with patient‐derived organoids or to investigate efficacy of anticancer agents.[ 7 , 8 ] However, the method typically results in low throughput rates of only two to four spheroids per minute, large transferred volumes of liquid (several microliters) with each pick, and high mechanical stress on the spheroids.[ 7 , 9 ] In addition, there is no solution for picking closely spaced spheroids individually. This means that the spheroid concentration and their distribution in the reservoir must be optimized for each application to minimize sample loss and avoid unspecific or unintended picks.
Noncontact dispensing respectively Drop‐on‐Demand methods provide an alternative option for automated deposition of spheroids or organoids. As previously shown by Gutzweiler and Kartmann et al. and Dornhof and Zieger et al., it is possible to deliver cell aggregates encapsulated in small free‐flying droplets to a desired target position.[ 10 , 11 ] Common to all reported Drop‐on‐Demand systems is that sorting for specific markers, such as spheroid size, can only be done by detecting spheroid properties in the nozzle region of the dispenser and placing spheroids with different properties to different positions.[ 12 ] The efficiency of the approach is therefore highly dependent on the proportion of the desired fraction in the sample. Furthermore, technical challenges such as nozzle clogging are common with impure and highly concentrated samples.[ 13 ]
Other reported methods for the individual transfer of cell aggregates either rely on exploitation of mechanical or fluid‐driven spheroid manipulation, magnetic collection of spheroids or acoustic bioprinting.[ 14 ] However, these techniques are typically limited to specific samples or culture conditions, custom consumables, complex setups, and low throughput. To improve standardization and automation in 3D cell culture, we see a clear need for a technology that can provide a generic, sample‐independent way to handle spheroids or organoids with sufficient selectivity, throughput, accuracy and efficiency, with the option to handle heterogeneous samples in a user‐configurable manner.
To address this need, we developed a new approach for well‐controlled and selective single spheroid or organoid deposition. Our novel Pick‐Flow‐Drop principle combines elements of both, the Pick‐and‐Place and the Drop‐on‐Demand method to optimize processing efficiency, sample recovery and (selective) control over transferred cell aggregates. Cell aggregates are aspirated from a reservoir and guided through a thin capillary at the end of which a Drop‐on‐Demand dispenser deposits them to a desired target location. We investigated the necessary measures to provide reliable and targeted aspiration and precise single aggregate deposition. Further, we demonstrated the size‐selective and high‐throughput handling of heterogeneous cell aggregate samples, their fully automated deposition into hydrogel substrates and evaluated the cytocompatibility of the process with different aggregate types. The platform can be used in a variety of areas within the 3D in vitro field, from basic research, tissue engineering, drug discovery and screening, to personalized therapy in clinical settings.
2. Results and Discussion
2.1. Pick‐Flow‐Drop principle for Handling of Cell Aggregates
The Pick‐Flow‐Drop principle for selective handling of cell aggregates is shown in Figure 1a. The procedure is integrated in our in‐house developed prototype of a spheroid and organoid processing platform to enable a fully automated process (Figure 1b). One end of a disposable polyimide capillary, with an inner diameter of 250 µm and a length of 110 mm, is immersed in a reservoir, e.g., a 35 mm Petri dish, containing the sample in culture medium (aspirating end). The other end of the capillary (dispensing end) is clamped into a Drop‐on‐Demand dispenser (PipeJet, P9 dispenser, BioFluidix GmbH, Germany).
Figure 1.

Pick‐Flow‐Drop method for controlled handling of 3D cell aggregates. a) Schematic representation of the Pick‐Flow‐Drop principle: The sample reservoir containing 3D cell aggregates in suspension is monitored by a camera. A motorized xy‐stage moves the reservoir to place detected aggregates for aspiration underneath the aspirating end of the capillary. Aspirated aggregates are transported in a train of previously aspirated aggregates through the capillary to the droplet dispenser at the dispensing capillary end. Once an aggregate is detected by a second camera system at the dispensing nozzle, it can be deposited at a specific target position with a second motorized xy‐stage. b) Photo of the Pick‐Flow‐Drop module implemented into the in‐house developed prototype of a spheroid and organoid processing platform. c) Exemplary image taken with the reservoir monitoring camera of MCF7 spheroids at the bottom of the reservoir. The dark spot in the center shows the aspirating capillary end. On the right side: Magnification of the aspirating capillary end right before and right after aspiration of a spheroid. Scale bars: 250 µm. d) Side view of the aspirating capillary end showing the lowering and raising of the capillary in the reservoir to aspirate a polymer microsphere. Scale bar: 200 µm. e) Images of the dispensing capillary end showing a MCF7 spheroid approaching the orifice of the capillary. The blue region marks the volume that will be ejected with the next droplet. Once a spheroid is detected within this volume, the target plate is moved to deliver the spheroid to the desired location. Scale bar: 200 µm.
The piezoelectric dispenser squeezes the capillary tube by adjustable parameters in the range of 10 to 25 µm at a frequency of 5 to12 Hz, resulting in the ejection of droplets ranging from 8 to 22 nL. According to the so‐called PipeJet principle the continuous droplet ejection leads to an associated capillary refilling due to capillary forces.[ 15 ] Therefore, each droplet ejection generates a suction pulse at the aspirating end, which can be used to aspirate targeted 3D cell aggregates from the reservoir into the capillary. Prior to droplet ejection associated with aspiration in the reservoir, the cell aggregates in the reservoir are allowed to sediment to the bottom of the reservoir, where they can be monitored by a camera system (Figure 1c). Object detection in the reservoir is performed using a threshold‐based image segmentation algorithm. The capillary opening in the reservoir near the bottom of the Petri dish is detected as a dark circle of known size in the image. All other detected objects are potential aspiration candidates. Their position, area, circularity and distance to the nearest neighbor are measured. When a cell aggregate is selected for aspiration based on matching preset characteristics such as size and shape, the xy‐stage on which the reservoir is mounted moves the selected aggregate below the opening of the aspirating capillary end. The capillary is lowered onto the object to close proximity to the bottom of the reservoir and remains there for the duration of one droplet ejection, ≈130 ms, so that the object is sucked into the capillary (Figure 1d). Then, the capillary is raised again and the reservoir stage moves the next object under the aspirating capillary end. The lowering and raising of the capillary to aspirate an object is hereafter referred to as the aspiration motion. Throughout the entire process, including the lowering and lifting of the capillary, there is constant droplet ejection at the dispensing end so that aspirated cell aggregates are efficiently transferred through the capillary with each pressure pulse. A single spheroid or organoid travels through the capillary to the dispensing end in ≈1 min. Typically, several aggregates are aspirated one after another and are transported simultaneously in a train‐like manner with the unidirectional flow through the capillary. Whenever an aggregate reaches the dispensing end, it is individually dispensed in a nanoliter droplet. Therefore, a second camera system detects and tracks aggregates in the nozzle region of the dispensing end (Figure 1e).[ 10 , 11 ] Most ejected droplets will not contain any aggregate and will be directed to a waste compartment. Droplets that are predicted by the software to contain an aggregate are deposited at a specific target position by moving the target plate below the capillary orifice with a second motorized xy‐stage.
The droplet impact position on the target substrate varies only within a radius of 55 µm around the target, as previously reported.[ 10 ] As a result, a predefined number of spheroids and organoids can be plated in individual wells of all standard microplate formats and even in wells of 1,536 microwell high‐throughput screening plates as shown exemplarily in Figure S1 (Supporting Information) for a MCF7 tumor cell line spheroid. Since cell aggregates are delivered in nanoliter droplets, dilution of the target volume is minimized. The target substrate is mounted on a heat‐dissipating cold plate connected to a recirculating chiller so that the target substrate can be cooled as needed. All components in contact with the sample, namely the reservoir (Petri dish), the capillary and the target plate (microwell plate), are disposable and can be easily replaced after each run. In addition, the platform itself could fit under a sterile bench.
Typically, organoids and spheroids are harvested and resuspended in cell culture medium prior to being processed with the platform. However, the spheroid and organoid processing platform can also aspirate single cell aggregates directly from polymerized hydrogels, such as from hydrogel domes in a 24‐well plate, and deliver them to a desired target location, as shown in Figure S2 (Supporting Information). To minimize the shear forces on the cell aggregates, the following work was performed with spheroids or organoids in liquid suspension, e.g., standard cell culture media or PBS, if not denoted otherwise. In addition, also capillaries with a larger inner diameter, e.g. 500 µm, can be used, to process larger cell aggregates.
2.2. Enabling Targeted Aspiration of Cell Aggregates
In contrast to Drop‐on‐Demand approaches, the Pick‐Flow‐Drop principle offers the advantage of processing only specific spheroids or organoids. It allows for precise aspiration of targeted spheroids or organoids while leaving all unwanted sample components in the reservoir. This means that only the target object should be aspirated during the aspiration movement of the capillary. However, the aspiration flow in the reservoir affects not only objects directly below the aspirating capillary end, but also nearby objects, as shown schematically by the simulated flow velocity profile in Figure 2a. Two criteria must be met during the aspiration process to allow targeted aspiration of a single aggregate:
Figure 2.

Investigation of the aspiration height and aspiration radius to enable robust selective aspiration. a) Simulated flow velocity field in the capillary and near the capillary opening in the reservoir. The flow field was simulated with an average flow rate of 96 nL s−1 and a capillary height of 150 µm above the reservoir bottom. b) Critical aspiration height from which spheroids in the order of 60–180 µm are aspirated into the capillary within 2 s. c) Microscopic images showing the effect of the aspirating capillary end 100 µm above the reservoir bottom on nearby MCF7 spheroids. Scale bar: 200 µm. d) Generated time‐dependent aspiration radius for different stationary heights h a of the capillary opening above the reservoir bottom. Each dot marks the time point when a MCF7 spheroid with a certain initial distance from the center of the capillary opening was drawn into the lumen of the capillary. During the measurements, droplets of a volume of 12 nL were continuously ejected with a frequency of 8 Hz at the dispensing capillary end. e) Aspiration radius generated by a total aspiration motion. Each bar shows the calculated size of the aspiration radius that would be generated due to different minimum capillary aspiration heights h min approached during the aspiration motion. The upper x‐axis shows the dwell time t d,a of the capillary opening within the aspiration regime calculated with Equation (2) for the approached minimum capillary height.
First, when the reservoir stage is moving or when cell aggregate aspiration is not desired, the capillary opening must be sufficiently far from the reservoir bottom to prevent unintentional aspiration of sedimented objects. However, the opening must remain submerged in the liquid to avoid air bubble aspiration. The maximum height of the capillary above the bottom, where a sufficient aspiration force is present is termed critical height h crit. If the capillary is below h crit, it is within the aspiration regime for sedimented aggregates.
To determine h crit, the capillary opening was slowly lowered over a MCF7 spheroid from a height of 1 mm above the bottom. Within a spheroid diameter range of 55 µm to 180 µm, there was no dependency between h crit and the spheroid size. The average critical height was found to be h crit = (280 ± 42) µm (Figure 2b). Given the potential presence of objects larger than 280 µm in more heterogeneous samples, for all subsequent experiments the capillary is raised 500 µm above the bottom of the reservoir to avoid accidental aggregate aspiration during stage movement and is only lowered when intending to aspirate an aggregate.
The second criterion that must be met is to ensure that only the target object is aspirated, respectively the unintentional aspiration of objects near the target must be avoided. The area from which objects are aspirated after a given period of aspiration time is defined by the aspiration radius R a. We first measured R a with a stationary aspirating capillary opening in the x, y, and z directions in the reservoir, so that no aspiration motion was performed (Figure 2c,d). In this way, we were able to study the influence of different aspiration heights h a of the capillary opening above the bottom on the aspiration radius. Due to the increased flow velocities around the capillary opening at small h a, the aspiration radius increases more rapidly. We did not observe a spheroid size‐dependent effect on the aspiration radius within the considered spheroid diameter range of 30 to 140 µm (Figure S3, Supporting Information).
The data presented in Figure 2d has a logarithmic trend and the following curve was fitted n times to n − 1 data points of each h a condition
| (1) |
The parameters A, B, C and D vary with the set stationary aspiration height h a of the capillary.
Next, we approximated the aspiration radius generated during the automated aspiration motion. As mentioned above, the aspiration motion consists of lowering the capillary from outside of the aspiration regime to a preset minimum aspiration height h min, waiting at h min for exactly one droplet ejection to aspirate the object, and raising the capillary again. Droplets are continuously ejected during the lowering and lifting. For each set minimum aspiration height h min to which the capillary is lowered, we calculated the total dwell time t d,a of the capillary opening within the aspiration regime, which increases as h min decreases
| (2) |
whereas v d = 1 mm s−1 and v u = 2 mm s−1 are the velocities at which the capillary is lowered and raised again, respectively, and f d = 8 Hz is the droplet dispensing frequency. Shortening the dwell time by increasing the speed of the capillary movement is only possible to a limited extent since diving down too quickly would possibly displace the target objects. With the calculated dwell times t d,a and the fit parameters found for the data in Figure 2e with Equation (1), we estimated the aspiration radius Ra (t d,a (h min)) generated by a complete aspiration motion. The increased capillary opening dwell time in the aspiration regime due to decreased h min during an aspiration motion prolongs the time in which cell aggregate aspiration occurs. This results in larger aspiration radii as shown in Figure 2e.
In contrast, for large minimum aspiration heights h min, the aspiration radius generated during the aspiration motion would be zero. This means that a single pressure pulse would not be sufficient to successfully aspirate a targeted aggregate. In general, we found a minimum aspiration height h min of 150 µm of the capillary during the aspiration motion to be a good compromise. It allows robust cell aggregate aspiration with a single pressure pulse, short dwell times in the aspiration regime and a sufficiently small aspiration radius of (226.1 ± 2.5) μm. In all subsequent experiments, the preset minimum aspiration height was 150 µm, requiring spheroids or organoids to be at least 226.1 µm apart to ensure targeted aspiration without accidental intake of neighboring aggregates. To accommodate potential aspiration radius deviations from uneven reservoir mounting or capillary stage errors, only objects with a minimum safety distance of 270 µm from their closest neighbors are chosen for targeted aspiration. This is illustrated in Figure S4 (Supporting Information) and referred to as safety clearance condition (SCC) for targeted object aspiration. This is the basis for efficient and reliable selective organoid or spheroid handling and a high process quality.
To avoid that the sample recovery during targeted aspiration depends on the sample density in the reservoir, the platform features an implemented mixing function. Once all detected objects satisfying the SCC have been aspirated, droplet ejection is paused and the reservoir is vigorously moved in a cross‐like reciprocal pattern in the x and y direction to randomly redistribute the remaining objects. Then, another round of targeted aspiration is performed (for more details, see Supplementary Text and Figure S5, Supporting Information). This allows aspirating all cell aggregates in a targeted and controlled manner over time until the entire reservoir is completely depleted from aggregates.
2.3. Aspiration Rate and Single Aggregate Aspiration Efficiency
To evaluate aspiration rate and efficiency, the targeted aspiration process with the SCC described above was investigated for various spheroid densities in the reservoir. The aspiration rate was determined as the total number of aspiration motions of the capillary per minute. Single aggregate aspiration efficiency was calculated as the ratio of aspiration motions resulting in a single spheroid aspiration to the total number of aspiration motions. We first investigated the effect of the aggregate density on the aspiration rate and efficiency. We measured aspiration rate and single spheroid aspiration efficiency for MCF7 spheroid densities in the range of 0.5 spheroids mm−2 to 10.4 spheroids mm−2, corresponding to 500 to 10,000 spheroids in a 35 mm Petri dish. At spheroid densities ≥2.1 spheroids mm−2, the platform performed (21.8 ± 0.9) aspiration motions per minute with a single spheroid aspiration efficiency of (98.4 ± 3.1)%. This results in an average spheroid aspiration rate of (21.5 ± 1.5) spheroids per minute. For spheroid densities ≥2.1 spheroids mm−2, we did not observe any significant effects on the aspiration rate or aspiration efficiency depending on the number of spheroids in the reservoir (see also Table S1 in the Supporting Information).
At a low spheroid density of 0.5 spheroids mm−2 in the reservoir, which corresponds to 500 spheroids in a 35 mm Petri dish, we observed a slight decrease in the aspiration rate to (18.3 ± 1.2) aspiration movements per minute. This is due to the larger distances between the spheroids in the reservoir and thus longer travel times of the reservoir stage. In addition, single spheroid aspiration efficiency and spheroid aspiration rate decreased to (96.5 ± 2.5)% and (17.7 ± 0.9) spheroids per minute, respectively. The slightly lower aspiration efficiency was due to false positive detection in all cases. As described above, the image segmentation for object detection in the reservoir used in this study was threshold based. Therefore, sparsely populated reservoirs were more likely to produce false positives due to misinterpretation of shadows or dirt.
Next, we measured the aspiration rate and single aggregate aspiration efficiency for different spheroid sample types, namely MCF7 spheroids and A549 spheroids. In addition, we tested automated aspiration with heterogeneous murine colorectal cancer (CRC) organoids, the characteristics of which have been described in detail in the literature.[ 16 ] For all sample types, the density of cell aggregates in the reservoir ranged from 0.5 spheroids mm−2 to 2.1 spheroids mm−2, corresponding to 500 to 2000 cell aggregates in a 35 mm Petri dish. In general, high aggregate aspiration efficiencies of over 95% were achieved with an aspiration rate of 19.4 aggregates per minute, which was independent of the sample type (see Table 1 ). We did not observe multiple aggregates aspirated within a single aspiration motion, demonstrating an appropriately defined SCC for targeted single aggregate aspiration. Overall, the aspiration process proved to be highly efficient, independent of the sample type and largely independent of sample density in the reservoir.
Table 1.
Aspiration rate, aggregate aspiration rate and aspiration efficiency for different sample types. The aspiration rate describes the number of aspiration motions per minute, the aggregate aspiration rate describes the number of single aggregate aspiration events per minute. For each sample type, aspiration rate and efficiency were measured three times over the course of at least one minute. Cell aggregate density in the reservoir was in all cases between 0.5 spheroids mm−2 and 2.1 spheroids mm−2.
| Sample type | Aspiration rate [min−1] | Aggregate aspiration rate [min−1] | Aspiration efficiency [%] |
|---|---|---|---|
| MCF7 spheroids | 19.8 ± 1.9 | 19.2 ± 1.9 | 96.6 ± 2.4 |
| A549 spheroids | 19.7 ± 0.3 | 19.4 ± 0.7 | 98.4 ± 2.2 |
| CRC organoids | 20.2 ± 0.2 | 19.9 ± 0.4 | 98.5 ± 2.1 |
2.4. Accurate Control of the Number of Deposited Aggregates Via Single Aggregate Dispensing
Next, we examined the deposition characteristics of the spheroid and organoid processing platform. As mentioned above, a second camera system observing the dispensing end of the capillary is used to count the number of spheroids or organoids that pass through and are dispensed (Figure 1a,e). As in the reservoir, detection of objects in the nozzle region is threshold based. We verified the reliability of the automatic object detection for three different sample types (MCF7 spheroids, A549 spheroids, and CRC organoids) by comparing the detection of passing aggregates with aggregates observed by an experienced researcher by reviewing the recorded image series. We also evaluated the plating efficiency for the three different sample types by comparing the number of aggregates passing through the capillary with the number of aggregates successfully plated in individual wells of a 384 MWP. Table 2 summarizes the results. In general, detection errors can occur when two aggregates overlap and are not detected as two individuals, or when the aggregate is very translucent and therefore produces weak signals in the threshold image. In addition, gas bubbles in the capillary can cause false detection or even dispensing failure. However, the dispensing parameters and the arrangement of the capillary inlet and outlet are optimized so that no gas bubbles were observed during dispensing. Unsuccessful aggregate deposition can occur if the dispensed droplets are deflected during droplet ejection, for example, due to electrostatic effects or unfavorable aggregate position within the drop during detachment from the nozzle. Overall, a very high detection accuracy and plating efficiency of over 95% is achieved, regardless of the sample type. This demonstrates a high reliability of the controlled deposition of cell aggregates.
Table 2.
Detection accuracy and plating efficiency with PFD for MCF7 spheroids (diameter range 80–180 µm), A549 spheroids (diameter range 100–180 µm) and CRC organoids (diameter range 50–100 µm). Detection accuracy describes the ratio of aggregates passing the capillary detected by the software algorithm to aggregates as observed by a researcher (N ≥ 3, n ≥ 384 for each sample type). Plating efficiency describes the ratio of aggregates passing the capillary to aggregates deposited in individual wells of a 384 MWP (N ≥ 3, n ≥ 96 for each sample type).
| Sample type | Detection accuracy [%] | Plating efficiency [%] |
|---|---|---|
| MCF7 spheroids | 100 ± 0 | 99.8 ± 0.8 |
| A549 spheroids | 97.6 ± 2.5 | 97.7 ± 1.7 |
| CRC organoids | 97.4 ± 2.6 | 98.8 ± 0.9 |
In addition to good detection accuracy and plating efficiency, we investigated single aggregate dispensing efficiency. Single aggregate dispensing occurs when only one aggregate is encapsulated in an ejected droplet. Single aggregate dispensing provides maximum control over the number of aggregates plated, while still plating each passing cell aggregate for highly efficient sample handling. Although only one aggregate is aspirated at a time, aggregates of different sizes and shape travel through the capillary at different velocities. If the time between two successive aspirations is too short, multiple spheroids or organoids may reach the ejection area of the dispenser at the same time and cannot be individually plated on a target position (Figure 3a).
Figure 3.

Single aggregate dispensing efficiency. a) Different types of ejected droplets: “void” dispensing (droplet without cell aggregate), single aggregate dispensing and multi aggregate dispensing. Single aggregate dispensing occurs when only one cell aggregate passes through the blue area in the dispensing capillary end corresponding to the next ejected droplet. Multiaggregate ejection occurs when more than one cell aggregate is present in the area marked in blue. Scale bar: 200 µm. b) Single aggregate dispensing efficiencies for different sample types and varying throughputs. Dispensing rates greater than 21 aggregates per minute correspond to the nontargeted aspiration mode (N = 3, n ≥ 96).
Single aggregate dispensing efficiency is defined as the ratio of single aggregate dispensing events (exactly one aggregate within the ejection area in the dispensing capillary end) to total aggregate dispensing events (at least one aggregate within the ejection area in the dispensing capillary end).
We determined the single aggregate dispensing efficiency for different aggregate dispensing rates. These were achieved by adding pauses before initiating the aspiration movements, thus slowing the aspiration rate and increasing the distance between two cell aggregates within the capillary. Single aggregate dispensing efficiencies for different sample types and dispensing rates are shown in Figure 3b. The lower the aggregate throughput, the higher the success rate of dispensing a maximum of one aggregate in a droplet. The greater the size and shape heterogeneity of a sample, the more the throughput must be reduced to achieve 100% single aggregate dispensing efficiency. For MCF7 spheroids, which are very uniform in size and shape, a single aggregate dispensing efficiency of 100% was achieved at spheroid dispensing rates of ≤16 spheroids per minute. A549 spheroids are uniform in size, but varied in shape in the form of various protrusions or buds. Here, a consistent single spheroid dispensing efficiency of 100% was achieved at dispensing rates ≤10 spheroids per minute. For the highly heterogeneous CRC organoid sample, a high single organoid dispensing efficiency of (98.4 ± 1.1)% was observed at a throughput of less than 9 organoids per minute.
However, even at high throughput rates of 21 aggregates per minute, the Pick‐Flow‐Drop principle achieves on average very high single aggregate dispensing efficiencies of ≥94%, independent of the sample type. In addition, the highest sample throughput can be achieved with a nontargeted aspiration mode. In this mode, the SCC is ignored and no aspiration motion is performed, so that the capillary remains at minimum aspiration height at all times. This resulted in a spheroid dispensing rate of 30 spheroids per minute, for which we still measured a single spheroid dispensing efficiency of over 90%.
We can therefore conclude that the Pick‐Flow‐Drop approach is well suited for controlled cell aggregate handling and dispensing, offers various modes of operation and provides a high degree of tracking, documentation and control of the number of cell aggregates delivered to a desired target location. Depending on the requirements of a specific application in terms of throughput or accuracy of the number of aggregates plated, different parameters can be easily selected without changing the handling method or protocol.
2.5. Cytocompatibility of PFD Process
To investigate whether the described Pick‐Flow‐Drop process has detrimental effects on 3D cell aggregates, we performed viability, apoptosis and necrosis assays on four different sample types, namely MCF7 spheroids, A549 spheroids, LNCaP spheroids and CRC organoids. LNCaP spheroids were selected as a sensitive sample because they had already grown for more than 14 days and had reached their proliferation limit with diameters of 180–260 µm at the time of PFD processing.
We placed the sample suspended in complete spheroid or organoid culture medium in the reservoir and processed it with the platform prototype, including multiple random redistributions in the reservoir via the mixing function, targeted aspiration, transport through the capillary, and delivery to a microwell plate. The wells of the microwell plate were preloaded with basement membrane extract (BME) matrix. Throughout the process, the MWP was maintained at 4 °C using the platform's cooling module to allow for complete immersion of spheroids or organoids when dispensing into the hydrogel.
For comparison, we also prepared cell aggregates via manual pipetting (MP) by resuspending them in the BME hydrogel before plating them into wells, as is commonly done for organoid seeding, propagation and screening. We ensured that the aggregate concentration in each well was comparable to the number of aggregates deposited with the platform. After plating, the MWPs were transferred to the incubator. After 30 min, complete culture medium was added to the wells. Immediately after plating, differences were evident as wells filled by manual pipetting contained loose cells and cell debris. In contrast, wells filled by PFD contained visibly less cell debris and loose cells, as droplets without cell aggregates are placed in waste wells (Figure 4a,b).
Figure 4.
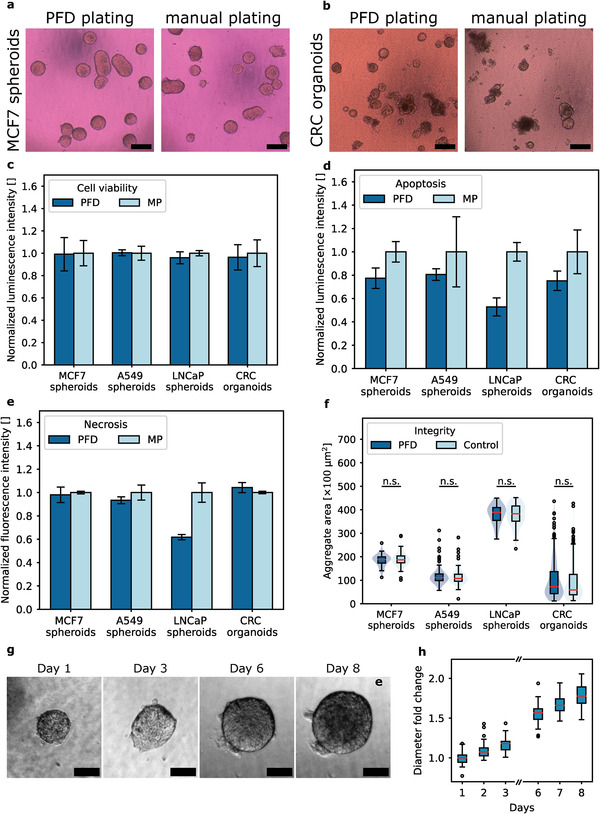
Cytocompatibility of PFD. a) Exemplary image of MCF7 spheroids embedded in basement membrane extract (BME) with PFD and by manual pipetting one hour after plating. Scale bar: 200 µm. b) Exemplary image of CRC organoids embedded in BME with PFD and by manual pipetting one hour after plating. Scale bar: 200 µm. c) Cell viability 4 h after plating either via PFD or via manual pipetting (MP). Three technical replicates, n ≥ 60 for each sample type and each condition. d) Measured luminescence signal due to Annexin V binding to exposed phosphatidylserine on the cell surface as an indicator of apoptosis 24 h post plating. Three technical replicates, n ≥ 60 for each sample type and each condition. e) Measured loss of membrane integrity as indicator of secondary necrosis 24 h post plating. Three technical replicates, n≥60 for each sample type and each condition. f) Normalized area of unprocessed cell aggregates and aggregates that were processed with the spheroid and organoid processing platform. Each condition shows data of n ≥ 60. Aggregates with diameters larger than 240 µm were not considered for aspiration and are therefore excluded from the data set. g) Exemplary proliferation of an MCF7 spheroid that was automatically embedded in BME over the course of several days. Day 1 was the day of embedding. Scale bar: 100 µm. h) Fold change in diameter of MCF7 spheroids after they were embedded in basal membrane extract with the platform. n = 34. Spheroids were automatically delivered into the hydrogel on day 1. Data was tested for normal distribution and the two‐tailed t‐test was performed. P‐values ≥ 0.05 were considered nonsignificant (n.s.).
Four hours after plating, viability was assessed by the quantification of present ATP. Compared to cell aggregates seeded by manual pipetting, we did not observe a significant immediate effect on the viability of cell aggregates after automated handling with the platform, regardless of sample type (Figure 4c). Apoptosis and necrosis were assessed 24 h after plating (Figure 4d,e). Apoptosis was measured by detecting the luminescence signal associated with Annexin V binding to phosphatidylserine exposed on the cell surface. Necrosis was detected as a fluorescence signal corresponding to loss of membrane integrity. In general, cell aggregates processed by PFD tended to result in weaker signals associated with apoptosis or necrosis compared to samples subjected to manual resuspension in hydrogel. We believe that this is partly due to the presence of cell debris and loose cells in the manually plated test wells (Figure 4a,b). These loose cells are most likely undergoing apoptosis or necrosis and may contribute to a higher signal. In addition, during pipetting and resuspension in the hydrogel, cell aggregates are exposed to very high shear stress for a short time, which significantly exceeds the shear stress present during PFD (see Supporting Information). Increased fluid shear stress is known to induce apoptosis.[ 17 ] In addition, the high shear stress may cause fragmentation of large aggregates, potentially exposing a necrotic core, which we hypothesize to be the reason for the increased necrotic signal measured for LNCaP spheroids subjected to manual pipetting.
We also measured the sizes as 2D areas of unprocessed cell aggregates in the reservoir and compared them to those of processed aggregates (Figure 4f). Again, we did not observe any significant effects or fragmentation of cell aggregates and conclude that there are no measurable effects on aggregate integrity. We also investigated whether a change in medium could have a negative effect on cytocompatibility, as serum components of complete culture media provide protection against shear stress. Therefore, we checked integrity, viability, apoptosis and necrosis for MCF7 spheroids and LNCaP spheroids that were kept in PBS instead of complete culture medium during processing with the platform. The results are shown in Figure S6 (Supporting Information). In general, cytocompatibility does not seem to be negatively affected compared to manually pipetted cell aggregates. In addition, we have included in Figure S6 (Supporting Information) the results of the measured H2O2 level as an indicator of ROS generation of MCF7 spheroids two hours after plating with the platform. We saw no significant difference in H2O2 levels between spheroids handled with the platform and those handled by pipetting alone. To assess whether there are any long‐term negative effects on proliferation, we observed MCF7 spheroids embedded with the platform in BME for several days. We found overall good proliferation and growth (Figure 4g,h). The growth rate was in the same range as reported in the literature.[ 18 ]
Taken together, we conclude that for all sample types tested, there were no measurable negative effects on cytocompatibility as a result of processing with the platform. Instead, cell debris and loose cells in test wells were visibly avoided through controlled deposition, potentially leading to reduced apoptosis and necrosis signals. This can be beneficial for standardized, highly controlled assessment of drug response by reducing unwanted background noise from nonviable aggregate fragments.
2.6. Size‐Selective Handling of Heterogeneous 3D Cell Aggregate Samples
The controlled aspiration motion in combination with the SCC allows for targeted aspiration of cell aggregates and enables automated selective handling. By monitoring the reservoir, it is possible to detect characteristics such as size and shape of cell aggregates and select only those cell aggregates that meet pre‐set parameters for targeted aspiration. This is particularly important in heterogeneous samples where many different sizes and shapes of cell aggregates are present and only a specific fraction is eligible, for example, for drug screening, culture propagation or other downstream analyses. Therefore, we tested automated size‐selective handling of the heterogeneous murine CRC organoid sample using the spheroid and organoid processing platform. Organoids were cultured in domes of BME matrix and exhibited different sizes and shapes just before harvesting (Figure 5a). A pre‐scan of the harvested sample in the platform reservoir also showed this wide size distribution (Figure 5b). We set different size limits for selective organoid aspiration in three consecutive runs. Within a size fraction run, all aspirated organoids were to be plated into a single well of a 96‐well plate. The sizes of the delivered organoids in these wells were then analyzed (Figure 5c–f). We found that the delivered organoids conformed well to the preset size limits and that cellular debris in the target wells was visibly minimized compared to the source reservoir. User‐defined size limits should be considered as soft limits, since organoids and spheroids may appear to be of different sizes in 2D images from different perspectives. Outliers may occur due to the threshold based aggregate detection and a misinterpretation of the size depending on the set exposure levels or image distortions such as shadows. The effects of such distortions will be reduced by applying deep learning‐based image segmentation algorithms in the future.
Figure 5.

Size‐selective aspiration and delivery of CRC organoids. a) CRC organoids in basal membrane extract dome before harvesting. Scale bar: 1000 µm. b) Initial size distribution of the organoids in the reservoir before selective aspiration started. c) Size distribution of the delivered organoids. For selective aspiration, three different size limits (indicated by the gray dashed boxes) were defined within which the size of the aspirated organoids should fall. All organoids aspirated within a size‐specific aspiration run were delivered into the well of a 96‐well plate. The box shows the size distribution of the delivered organoids for each size limit. d–f) Microscopic stitched images of the organoids delivered to the individual wells within the three size‐specific aspiration runs. Scale bar: 1000 µm, inlet scale bar: 200 µm.
The platform is capable of accurately and exclusively recovering even minor present size‐specific subfractions with high efficiency > 90% from the reservoir (Figure S7, Supporting Information). All aspirated cell aggregates were delivered to the target well without any loss. Further, we did not observe a size‐dependent effect on the detection accuracy in the nozzle or the plating efficiency. We conclude that the platform is able to provide reliable delivery of different size fractions of heterogeneous samples with high sample recovery. With the PFD process, efficient and specific handling does not require a minimum number of cell aggregates present in a sample to be processed. In contrast, we can even filter out minor present fractions of the sample with a very high recovery. Thus, we provide a generic handling method for many different samples as well as downstream workflows and protocols.
3. Conclusion
We have developed a generically applicable selective handling platform for 3D cell aggregates based on the Pick‐Flow‐Drop principle. Cell aggregates such as spheroids or organoids are selectively aspirated from a reservoir, transported by a microfluidic flow through a thin capillary and deposited at a target position within a nanoliter droplet. We evaluated the characteristics of the microfluidic aspiration that allowed us to establish a generalized, highly controlled and targeted particle aspiration. No further tweaks or adjustments were required to maintain a highly efficient and reliable process as sample concentration, sample homogeneity, aggregate sizes, desired throughput, sample type and culture conditions varied. We demonstrated the capabilities of the system by testing the fully automated deposition of spheroids and organoids in an extracellular matrix mimicking hydrogel. Based on the embedded cell aggregates, we then evaluated the cytocompatibility of the PFD process using cell viability, apoptosis, necrosis, and H2O2 assays. No detrimental effects of the process were observed in all assays for different aggregate types, and there is even evidence of an advantage over manual pipetting. Shear stress is reduced compared to manual pipetting, and cell debris in test wells was visibly minimized, which can be beneficial for clear drug response assessment. The PFD process appears to be a genuinely gentle method for handling various cell aggregates such as spheroids and organoids.
Further, we showed the robust handling of highly heterogeneous organoid samples and the accurate extraction of only size‐specific subfractions of a sample. Until now, this has typically involved manual filtering steps, resulting in sample loss and time‐intensive procedures. The automated selective aspiration is a very useful tool, as it allows to tackle the cellular heterogeneity of organoids with increased hands‐off time. Applications include the separation of tumor cell organoids from nontumor cell organoids, which is typically accomplished by costly and time‐consuming growth factor deprivation.[ 19 ] Detecting fluorescence‐based markers can be easily implemented in the future. Notably, the mixing function of the reservoir allows targeted aspiration of the entire sample, resulting in high sample recovery efficiencies even when only size‐specific subfractions of a sample are extracted. This demonstrates the suitability of the spheroid and organoid processing platform for automated and generic handling of impure samples or samples containing only small numbers of tissue fragments or organoids as found in clinical settings.[ 20 ]
The spheroid and organoid processing platform addresses current shortcomings in 3D cell culture research that arise from the complexity of establishing and expanding organoid cultures, achieving sufficient reproducibility, and minimizing time and resource consumption.[ 21 , 22 , 23 ] As remarkable studies have already shown, patient derived organoids can be used to predict the response to various cancer therapeutics in the treatment of patients.[ 21 , 22 , 24 ] However, the high heterogeneity of samples, as well as the variety of sample‐specific requirements for handling, cultivation, or downstream drug efficacy assessment, has limited the high‐throughput exploitation of 3D in vitro studies and the understanding of underlying biological mechanisms. Our platform helps take advantage of the heterogeneity in organoid samples that reflects the complex carcinogenesis. The platform reduces the manual workload while increasing the analytical assessment options through the detection of multiple sorting markers and selective organoid handling. This simplifies and standardizes the functional analysis of organoid models in order to make reliable statements about the precision of therapy in personalized oncology. Due to their self‐assembly and self‐organization capabilities, it is also feasible to use the platform for precise positioning of spheroids or organoids as building blocks for tissue engineering and 3D bioprinting. Deposition of spheroids of different cell types could enable easy cocultivation and realization of spatial heterogeneity of the printed tissue in order to mimic in vivo tissue more closely. The Pick‐Flow‐Drop principle is compatible with a wide variety of samples and culture conditions, as well as downstream workflows such as drug screening, sample propagation, or specific research questions involving size, sample number, type, or morphology‐dependent effects. We see its great potential for personalized medicine in the clinical setting, for accelerating drug discovery and screening in the preclinical setting, and for contributing to a fundamental understanding of disease pathways.
4. Experimental Section
Platform Design and Components
Custom parts of the spheroid and organoid processing platform were 3D printed in PETG on a Prusa MK3S (Prusa Research, Czech Republic). The capillary for aspiration and droplet delivery was a thin polyimide tube with an inner diameter of 250 µm and a length of 11 cm (Zeus Industrial Products, USA). The capillary holder for inserting the capillary into the reservoir was a 4 mm thick laser‐cut PMMA plate.
Multiple motorized stages were used to provide automated movement of specific parts. The reservoir was moved with two linear stages with a travel range of 50 mm and 100 mm, respectively (Zaber Technologies, Canada). The target substrate was moved with a motorized aperture xy‐stage with a travel range of 100 mm × 120 mm (Zaber Technologies, Canada). The movement of the capillary was controlled by a translation stage with a range of 30 mm, the adjustment of the focal plane of the reservoir camera by a stage with a range of 50 mm (both from Standa LTD, Lithuania).
A 12MP CMOS camera (Imaging Development Systems, Germany) with a 6.5× zoom lens system (Thorlabs, Inc., USA) was used to monitor the sample in the reservoir. A 5MP CMOS camera (Imaging Development Systems, Germany) with a second 6.5× zoom lens system was integrated into the setup to image the nozzle at the dispensing end of the capillary as well as ejected droplets.
A membrane pump and a pneumatic cylinder enabled automated prefilling of the capillary with liquid from the reservoir.
Droplet generation was performed using a noncontact dispenser (PipeJet P9, Biofluidix, Germany). The capillary was clamped to the dispenser and the piezo stack actuator of the PipeJet squeezed the tube in a periodic motion to dispense droplets. The capillary forces caused continuous refilling of the tube. To determine the volume of the ejected droplets and to adjust the PipeJet parameters if necessary, a computer‐based image analysis algorithm was used as previously described in literature.[ 10 , 25 ] Briefly, captured images of ejected droplets were analyzed using an image segmentation algorithm. The background was subtracted and the drop contour was detected. The drop was assumed to be a stack of multiple cylinders. All cylinders have a height equal to the pixel size, and the diameters were given by the length of each detected pixel row. To obtain the ejected drop volume, the sum of all cylinder volumes was calculated. Unless otherwise stated, the PipeJet parameters were set to dispense droplets with a volume in the range of 10–12 nL at a frequency in the range of 7–8 Hz.
Substrate cooling was provided by a recirculating chiller (Fryka GmbH, Germany) connected to a heat‐dissipating cold plate and a custom‐designed aluminum microplate holder.
In order to control all the moving parts and functions of the platform, a software based on C++ has been developed in‐house. A detailed scheme with all components is shown in Figure 6 .
Figure 6.

Detailed scheme of the spheroid and organoid processing platform prototype. 1. xy‐stage for reservoir, 2. reservoir (Petri dish), 3. reservoir illumination light, 4. mirror to guide reservoir image light to reservoir camera, 5. reservoir camera, 6. capillary holder attached to capillary z‐stage, 7. aspiration capillary, 8. capillary z‐stage, 9. PipeJet, 10. manual fine‐alignment xyz‐stage for PipeJet, 11. dispenser illumination light, 12. dispenser camera, 13. microwell plate on substrate cooling block, 14. xy‐stage for microwell plate, 15. connection for recirculating chiller.
Cell Culture and Spheroid Generation
The benchmarking of the developed platform was performed with multicellular tumor spheroids. For this purpose, the breast cancer cell line MCF7, the human prostate cancer cell line LNCaP, and the human lung cancer cell line A549 were used (all obtained from BIOSS Center for Biological Signaling Studies, Freiburg, Germany). MCF7 and A549 cells were cultured at 37 °C and 5% CO2 in Dulbecco's modified Eagle's medium (DMEM), high glucose, GlutaMAX supplement, pyruvate (Thermo Fisher Scientific, USA) supplemented with 10% fetal bovine serum (FBS, Thermo Fisher Scientific, USA) and 1% penicillin/streptomycin (Thermo Fisher Scientific, USA). LNCaP cells were cultivated in RPMI‐1640 medium (Sigma‐Aldrich, USA) supplemented with 10% FBS, 2 × 10⁻³ m Glutamine and 1% penicillin/streptomycin.
To prepare large numbers of spheroids for our experiments, we used Corning Elplasia 12K flasks (Corning, USA) according to the manufacturer's instructions. Briefly, cells were harvested and resuspended in 25 mL DMEM or RPMI medium supplemented with 10% FBS and 1% penicillin/streptomycin. The cell concentration was adjusted to provide a specific number of cells per cavity in the flasks to generate spheroids of different sizes. We worked in a range of 50–100 cells per cavity. This resulted in spheroid diameters ranging from ≈50 to 260 µm. The spheroid flasks remained in the incubator for at least three days. Mature spheroids were then harvested by rinsing the flasks with PBS.
Suspensions containing harvested spheroids were centrifuged at 150 g for 5 minutes. The supernatant was removed and the spheroids were resuspended in 4–5 mL of DMEM or RPMI medium supplemented with 10% FBS and 1% penicillin/streptomycin (complete spheroid culture medium).
Organoid Culture
To assess the automated selective handling of the platform, we worked with heterogeneous colorectal cancer (CRC) mouse organoids kindly provided by Prof. Tilman Brummer (Institute of Molecular Medicine and Cell Research, University of Freiburg, Germany). Tissue isolation, colony formation and organoid generation are described in detail by Reischmann et al. and were approved by the German Government Commission for animal protection and the local ethics committee (X‐15/09H; X‐18/06C; X‐19/05C).[ 16 ] Organoids were propagated with minor modifications compared to[ 16 ]. Briefly, organoids were cultivated in domes of 4 mg mL−1 basement membrane extract BME (Cultrex Reduced Growth Factor Basement Membrane Extract, Type 2, Pathclear, R&D Systems, Inc., USA). Organoids were harvested by disrupting the matrix dome by pipetting up and down and rinsing the sample container with ice‐cold 0.1% BSA‐PBS solution. The sample was collected in a 15 mL tube coated with 1% BSA. Organoids were mechanically disrupted by pipetting up and down several times and passed through a 30 µm cell strainer. Organoids were washed out from the strainer and collected in a centrifuge tube. The sample was centrifuged at 200 × g for 5 min at 4 °C, the supernatant was removed and the organoids were resuspended in 4 mg mL−1 BME matrix. The organoid‐hydrogel mixture was seeded in 30 µL domes onto a 24‐well plate and placed into the incubator at 37 °C. After polymerization of the hydrogel, the domes were covered with 500 µL of complete organoid culture medium (3D Tumorsphere Medium XF, supplemented with 10% FBS, 1% penicillin/streptomycin and 8 ng mL−1 bFGF, Thermo Fisher Scientific, USA). Medium was changed twice a week and organoids were passaged once a week.
To gently harvest CRC organoids to benchmark the platform, the medium was removed and 300 µL Cultrex Organoid Harvesting Solution (R&D Systems, Inc., USA) was added. After 30 min at 4 °C, the hydrogel was dissolved. The sample was passed through a 30 µm cell strainer. Organoids were washed out from the filter, collected in a 1% BSA‐coated tube and centrifuged at 200 × g for 4 min. The supernatant was removed and the organoids were resuspended in 4–5 mL complete organoids culture medium.
Cytocompatibility Assays
To determine cell viability of the spheroids or organoids, the viability assay CellTiterGlo 3D (Promega, USA) was performed according to the manufacturer's instructions. The background signal of noncell containing wells was subtracted and the received signal was divided by the number of cell aggregates present in each well. Apoptosis and necrosis were assessed using the RealTime‐Glo Annexin V Apoptosis and Necrosis Assay (Promega, USA) according to the manufacturer's instructions. Signals were normalized with the signal obtained for manually pipetted cell aggregates. ROS generation was assessed using the ROS‐Glo H2O2 Assay (Promega, USA). All signals were read using a Tecan Spark20M plate reader.
Computational Fluid Dynamics Simulation
Computational fluid dynamics (CFD) simulations were performed using the Fluid Flow module of Comsol version 5.4.[ 26 ] We approximated the pulsed flow due to droplet ejection as a steady‐state laminar flow with the mean flow rate
| (4) |
where V Drop is the average volume of dispensed droplets and f Drop is the droplet ejection frequency.
Data and Image Analysis
Deposited spheroids or organoids were imaged either with the reservoir camera module of the platform or with 4× or 10× magnification of an inverted light microscope (CKX41, Olympus K.K., Japan). The area A of cell aggregates was measured either with ImageJ or with custom written Python scripts using the scikit‐image packages.[ 27 ] The diameter d of the cell aggregates was calculated as
| (5) |
Statistical Analysis
For data visualized in box plots, the boxes extend from the first to the third quartile of the data, and the whiskers extend from the edges of each box to the last data point in the 1.5 × interquartile range. The center line of the box marks the median, and circles indicate outliers. For data visualized in bar plots, the height of each bar represents the mean of the data with error bars as ± standard deviation (s.d.). Error bar plots show means ± s.d. Means are expressed with ± s.d.
Statistical tests were carried out with the python SciPy module “scipy.stats.”[ 28 ] After normal distribution was tested with the D'Agostino‐Pearson test for normality, the statistical evaluation of the data was performed with the two‐tailed t‐test, unless otherwise stated. P‐values ≥ 0.05 were considered nonsignificant (n.s.), while significant P‐values were categorized as *P < 0.05, **P < 0.01 and ***P < 0.001.
Conflict of Interest
V.Z., S.K., D.F. have submitted the basic concept of the Pick‐Flow‐Drop principle for patent.
Supporting information
Supporting Information
Acknowledgements
The authors thank Jasmin Traichel and Prof. Dr. Tilman Brummer for providing us with CRC mouse organoids and valuable handling instructions and cultivation protocols. Further, the authors thank Ellen Woehr for her assistance with organoid culture. The authors thank our ADAPT / ADAPT‐2 partner 2cureX GmbH for their valuable contributions to initial device specifications and usability testing. Funding: German Federal Ministry of Education and Research, research grant ADAPT (161L0235A/161L0235B/161L0235C, SK/PK/2cureX GmbH). German Federal Ministry of Education and Research, research grant ADAPT‐2 (16LW0335K/16LW0336/16LW0337, SK/SZ/2cureX GmbH).
Open access funding enabled and organized by Projekt DEAL.
Zieger V., Frejek D., Zimmermann S., Miotto G. A. A., Koltay P., Zengerle R., Kartmann S., Towards Automation in 3D Cell Culture: Selective and Gentle High‐Throughput Handling of Spheroids and Organoids via Novel Pick‐Flow‐Drop Principle. Adv. Healthcare Mater. 2024, 13, 2303350. 10.1002/adhm.202303350
Data Availability Statement
The data that support the findings of this study are available from the corresponding author upon reasonable request.
References
- 1.a) Duval K., Grover H., Han L.‐H., Mou Y., Pegoraro A. F., Fredberg J., Chen Z., Physiology 2017, 32, 266. [DOI] [PMC free article] [PubMed] [Google Scholar] [Research Misconduct Found]; b) Fontoura J. C., Viezzer C., dos Santos F. G., Ligabue R. A., Weinlich R., Puga R. D., Antonow D., Severino P., Bonorino C., Mater. Sci. Eng., C: Mater. Biol. Appl. 2020, 107, 110264. [DOI] [PubMed] [Google Scholar]
- 2. Jubelin C., Muñoz‐Garcia J., Griscom L., Cochonneau D., Ollivier E., Heymann M.‐F., Vallette F. M., Oliver L., Heymann D., Cell Biosci. 2022, 12, 155. [DOI] [PMC free article] [PubMed] [Google Scholar]
- 3. Jensen C., Teng Y., Front. Mol. Biosci. 2020, 7, 33. [DOI] [PMC free article] [PubMed] [Google Scholar]
- 4.a) Kim S., Choung S., Sun R. X., Ung N., Hashemi N., Fong E. J., Lau R., Spiller E., Gasho J., Foo J., Mumenthaler S. M., SLAS Discovery 2020, 25, 744. [DOI] [PMC free article] [PubMed] [Google Scholar]; b) Walsh A. J., Castellanos J. A., Nagathihalli N. S., Merchant N. B., Skala M. C., Pancreas 2016, 45, 863. [DOI] [PMC free article] [PubMed] [Google Scholar]
- 5. Kapałczyńska M., Kolenda T., Przybyła W., Zajączkowska M., Teresiak A., Filas V., Ibbs M., Bliźniak R., Łuczewski Ł., Lamperska K., Arch. Med. Sci. 2018, 14, 910. [DOI] [PMC free article] [PubMed] [Google Scholar]
- 6.a) Kretzschmar K., Clevers H., Dev. Cell 2016, 38, 590. [DOI] [PubMed] [Google Scholar]; b) Yamaha Motor Co., Ltd. , The Cell Picking and Imaging System. CELL HANDLER | Yamaha Motor Co., Ltd. 25.12.2023, https://global.yamaha‐motor.com/business/hc/;; c) MIMETAS B.V , Flyer: Automated versus manual placement of spheroids in OrganoPlate Graft. 25.12.2023, https://www.mimetas.com/files/products/OrganoPlate%20Graft/2021MIMETAS‐Yamaha‐manual‐vs‐automated‐cell‐placement_Flyer.pdf.
- 7. Ayan B., Heo D. N., Zhang Z., Dey M., Povilianskas A., Drapaca C., Ozbolat I. T., Sci. Adv. 2020, 6, eaaw5111. [DOI] [PMC free article] [PubMed] [Google Scholar]
- 8.a) Higa A., Takahashi N., Hiyama G., Tamura H., Hoshi H., Shimomura K., Watanabe S., Takagi M., J. Visual. Exp. 2021, 172, e62668; [DOI] [PubMed] [Google Scholar]; b) Takahashi N., Higa A., Hiyama G., Tamura H., Hoshi H., Dobashi Y., Katahira K., Ishihara H., Takagi K., Goda K., Okabe N., Muto S., Suzuki H., Shimomura K., Watanabe S., Takagi M., Oncol. Lett. 2021, 21, 406,; [DOI] [PMC free article] [PubMed] [Google Scholar]; c) Kondo J., Ekawa T., Endo H., Yamazaki K., Tanaka N., Kukita Y., Okuyama H., Okami J., Imamura F., Ohue M., Kato K., Nomura T., Kohara A., Mori S., Dan S., Inoue M., Cancer Sci. 2019, 110, 345. [DOI] [PMC free article] [PubMed] [Google Scholar]
- 9.a) Ayan B., Wu Y., Karuppagounder V., Kamal F., Ozbolat I. T., Sci. Rep. 2020, 10, 13148. [DOI] [PMC free article] [PubMed] [Google Scholar]; b) Grexa I., Diosdi A., Harmati M., Kriston A., Moshkov N., Buzas K., Pietiäinen V., Koos K., Horvath P., Sci. Rep. 2021, 11, 14813; [DOI] [PMC free article] [PubMed] [Google Scholar]; c) Sartorius Lab Instruments GmbH & Co. KG. , Cell Selection and Retrieval | CellCelector | Sartorius. 25.12.2023. https://www.sartorius.com/en/products/cell‐selection‐and‐retrieval?utm_source=google&utm_medium=cpc&utm_campaign=CellCelector&utm_term=dynamic_ads&utm_content=search&gad_source=1&gclid=Cj0KCQiA7aSsBhCiARIsALFvovxeQqcSIWJkp6dNnM_uihA32dAVqdzsW1Obx24DAjZ6SWmnftnoDhwaAlytEALw_wcB.
- 10. Dornhof J., Zieger V., Kieninger J., Frejek D., Zengerle R., Urban G. A., Kartmann S., Weltin A., Lab Chip 2022, 22, 4369. [DOI] [PubMed] [Google Scholar]
- 11. Gutzweiler L., Kartmann S., Troendle K., Benning L., Finkenzeller G., Zengerle R., Koltay P., Stark G. B., Zimmermann S., Biofabrication 2017, 9, 25027. [DOI] [PubMed] [Google Scholar]
- 12.a) Cosson S., Bennet M., Krispin O., Kollhof P., Horn M., Clerc S., Tourniaire G., Bolster your confidence with your 3D cellular aggregates assay with automated bulk spheroids and organoids isolation and sorting. 31.08.2023. https://www.cellenion.com/wp‐content/uploads/2022/02/Cellenion_Poster_SLAS2022_02022022‐1.pdf;; b) Cosson S., Ruiz S., Beurton F., Bennet M., Tourniaire G., Automated 3D spheroids sorting, isolation and dispense. 27.11.2023. https://www.cellenion.com/wp‐content/uploads/2023/06/26‐AppNote‐Automated‐3D‐spheroids‐sorting‐isolation‐and‐dispense.pdf.
- 13. Mironov V., Visconti R. P., Kasyanov V., Forgacs G., Drake C. J., Markwald R. R., Biomaterials 2009, 30, 2164. [DOI] [PMC free article] [PubMed] [Google Scholar]
- 14.a) Blakely A. M., Manning K. L., Tripathi A., Morgan J. R., Tissue Eng., Part C: Methods 2015, 21, 737; [DOI] [PMC free article] [PubMed] [Google Scholar]; b) Ip B. C., Cui F., Tripathi A., Morgan J. R., Biofabrication 2016, 8, 25015. [DOI] [PubMed] [Google Scholar]; c) Stern A., Thompson B., Williams K., McClellan R., Gebhart S., Hartman J., SLAS Discovery 2022, 27, 201. [DOI] [PMC free article] [PubMed] [Google Scholar]; d) Roth J. G., Brunel L. G., Huang M. S., Liu Y., Cai B., Sinha S., Yang F., Pașca S. P., Shin S., Heilshorn S. C., Nat. Commun. 2023, 14, 4346. [DOI] [PMC free article] [PubMed] [Google Scholar]; e) Lang M., Wang W., Chen X., Woodfield T., in IEEE Int. Conf. on Automation Science and Engineering , IEEE, Piscataway, NJ: 2010; [Google Scholar]; f) Chen H., Wu Z., Gong Z., Xia Y., Li J., Du L., Zhang Y., Gao X., Fan Z., Hu H., Qian Q., Ding Z., Guo S., Adv. Healthcare Mater. 2022, 11, e2102784. [DOI] [PubMed] [Google Scholar]
- 15. Streule W., Lindemann T., Birkle G., Zengerle R., Koltay P., JALA Charlottesv. Va 2004, 9, 300. [Google Scholar]
- 16. Reischmann N., Andrieux G., Griffin R., Reinheckel T., Boerries M., Brummer T., Oncogene 2020, 39, 6053. [DOI] [PMC free article] [PubMed] [Google Scholar]
- 17.a) Mitchell M. J., King M. R., New J. Phys. 2013, 15, 15008. [Google Scholar]; b) Yin J., Sunuwar L., Kasendra M., Yu H., Tse C.‐M., Talbot C. C., Boronina T., Cole R., Karalis K., Donowitz M., Am. J. Physiol. Gastrointest. Liver Physiol. 2021, 320, G258. [DOI] [PMC free article] [PubMed] [Google Scholar]
- 18.a) Pengnam S., Plianwong S., Patrojanasophon P., Radchatawedchakoon W., Yingyongnarongkul B., Opanasopit P., Charoensuksai P., Pharmaceutics 2021, 13, 550. [DOI] [PMC free article] [PubMed] [Google Scholar]; b) Di Donato M., Giovannelli P., Migliaccio A., Bilancio A., Int. J. Mol. Sci. 2022, 23, 9008. [DOI] [PMC free article] [PubMed] [Google Scholar]
- 19. Zhao Z., Chen X., Dowbaj A. M., Sljukic A., Bratlie K., Lin L., Fong E. L. S., Balachander G. M., Chen Z., Soragni A., Huch M., Zeng Y. A., Wang Q., Yu H., Nat. Rev. Methods Primers 2022, 2, 94. [DOI] [PMC free article] [PubMed] [Google Scholar]
- 20.a) Hu Y., Sui X., Song F., Li Y., Li K., Chen Z., Yang F., Chen X., Zhang Y., Wang X., Liu Q., Li C., Zou B., Chen X., Wang J., Liu P., Nat. Commun. 2021, 12, 2581,; [DOI] [PMC free article] [PubMed] [Google Scholar]; b) Zhou C., Wu Y., Wang Z., Liu Y., Yu J., Wang W., Chen S., Wu W., Wang J., Qian G., He A., Cancer Med. 2023, 12, 14375. [DOI] [PMC free article] [PubMed] [Google Scholar]
- 21. van de Wetering M., Francies H. E., Francis J. M., Bounova G., Iorio F., Pronk A., van Houdt W., van Gorp J., Taylor‐Weiner A., Kester L., McLaren‐Douglas A., Blokker J., Jaksani S., Bartfeld S., Volckman R., van Sluis P., Li V. S. W., Seepo S., Sekhar Pedamallu C., Cibulskis K., Carter S. L., McKenna A., Lawrence M. S., Lichtenstein L., Stewart C., Koster J., Versteeg R., van Oudenaarden A., Saez‐Rodriguez J., Vries R. G. J., et al., Cell 2015, 161, 933. [DOI] [PMC free article] [PubMed] [Google Scholar]
- 22. Foo M. A., You M., Chan S. L., Sethi G., Bonney G. K., Yong W.‐P., Chow E. K.‐H., Fong E. L. S., Wang L., Goh B.‐C., Biomark Res. 2022, 10, 10. [DOI] [PMC free article] [PubMed] [Google Scholar]
- 23. Fang Z., Li P., Du F., Shang L., Li L., Exp. Hematol. Oncol. 2023, 12, 69. [DOI] [PMC free article] [PubMed] [Google Scholar]
- 24. Vlachogiannis G., Hedayat S., Vatsiou A., Jamin Y., Fernández‐Mateos J., Khan K., Lampis A., Eason K., Huntingford I., Burke R., Rata M., Koh D.‐M., Tunariu N., Collins D., Hulkki‐Wilson S., Ragulan C., Spiteri I., Moorcraft S. Y., Chau I., Rao S., Watkins D., Fotiadis N., Bali M., Darvish‐Damavandi M., Lote H., Eltahir Z., Smyth E. C., Begum R., Clarke P. A., Hahne J. C., et al., Science 2018, 359, 920. [DOI] [PMC free article] [PubMed] [Google Scholar]
- 25.a) Liang D., Muniyogeshbabu T. G., Tanguy L., Ernst A., Zengerle R., Koltay P., in 1st International Conference on Micro Fluidic Handling Systems, 2012, p. 95 ff.;; b) ISO , ISO 23783‐2:2022 Automated liquid handling systems Part 2: Measurement procedures for the determination of volumetric performance. 25.12.2023. https://www.iso.org/standard/76958.html.
- 26. COMSOL Multiphysics , COMSOL 5.4 Documentation CFD Module User's Guide. 25.12.2023, https://doc.comsol.com/5.4/docserver/#!/com.comsol.help.cfd/html_CFDModuleManual.html.
- 27. van der Walt S., Schönberger J. L., Nunez‐Iglesias J., Boulogne F., Warner J. D., Yager N., Gouillart E., Yu T., Peer J. 2014, 2, e453. [DOI] [PMC free article] [PubMed] [Google Scholar]
- 28. Virtanen P., Gommers R., Oliphant T. E., Haberland M., Reddy T., Cournapeau D., Burovski E., Peterson P., Weckesser W., Bright J., van der Walt S. J., Brett M., Wilson J., Millman K. J., Mayorov N., Nelson A. R. J., Jones E., Kern R., Larson E., Carey C. J., Polat İ., VanderPlas J., Laxalde D., Perktold J., Cimrman R., Henriksen I., Quintero E. A., Harris C. R., Archibald A. M., SciPy 1.0 Contributors , et al., Nat. Methods 2020, 17, 261. [DOI] [PMC free article] [PubMed] [Google Scholar]
- 29. Sekimoto A., Kanemaru Y., Okano Y., Kanie K., Kato R., Kino‐oka M., Regener. Ther. 2019, 12, 83. [DOI] [PMC free article] [PubMed] [Google Scholar]
- 30. Poon C., J. Mech. Behav. Biomed. Mater. 2022, 126, 105024. [DOI] [PubMed] [Google Scholar]
- 31. Koch F., Tröndle K., Finkenzeller G., Zengerle R., Zimmermann S., Koltay P., Int. J. Bio print. 2020, 20, e00094. [Google Scholar]
- 32. Kane K. I. W., Lucumi Moreno E., Lehr C. M., Hachi S., Dannert R., Sanctuary R., Wagner C., Fleming R. M. T., Baller J., AIP Adv. 2018, 8, 10.1063/1.5067382. [DOI] [Google Scholar]
Associated Data
This section collects any data citations, data availability statements, or supplementary materials included in this article.
Supplementary Materials
Supporting Information
Data Availability Statement
The data that support the findings of this study are available from the corresponding author upon reasonable request.