

Abstract
In brachytherapy (BT), or internal radiation therapy, cancer is treated by radioactive implants. For instance, episcleral plaques (EPs) for the treatment of uveal melanoma, are designed according to generic population approximations. However, more personalized implants can enhance treatment precision through better adjustment of dose profiles to the contours of cancerous tissues. An original approach integrating biomedical imaging, 3D printing, radioactivity painting, and biomedical imaging, is developed as a workflow for the development of tumor shape‐specific BT implants. First, computer‐aided design plans of EP are prepared according to guidelines prescribed by the Collaborative Ocular Melanoma Study protocol. Polyetheretherketone (PEEK), a high‐performance polymer suitable for permanent implants, is used to 3D‐print plaques and the geometrical accuracy of the printed design is evaluated by imaging. The possibility to modulate the dose distribution in a tridimensional manner is demonstrated by painting the inner surfaces of the EPs with radioactive 103Pd, followed by dose profile measurements. The possibility to modulate dose distributions generated by these 3D‐printed plaques through radioactivity painting is therefore confirmed. Ex vivo surgical tests on human eyeballs are performed as an assessment of manipulation ease. Overall, this work provides a solution for the fabrication of tumor‐specific radioactive implants requiring higher dose precision.
Keywords: 3D printing metrology, additive manufacturing of polymers, brachytherapy, brachytherapy dosimetry, episcleral plaques, polyetheretherketone (PEEK), uveal melanoma
Additive manufacturing of a hard and biocompatible polymer such as polyetheretherketone allows the fabrication of anatomically relevant applicators for brachytherapy (internal radiotherapy), and the application of radioactivity on these implants according to different patterns allows to modulate the energy dose profiles delivered to tumors.

1. Introduction
Polymeric biomedical objects produced by additive manufacturing (AM), more commonly referred to as “3D printing” have now entered several fields of medicine. This highly flexible processing technique is currently expanding from a method for rapid prototyping to a mature fabrication means adapted to several high‐end medical applications: patient‐specific surgical models, bone implants,[ 1 ] dental molds and implants,[ 2 ] scaffolds for tissue engineering,[ 3 ] etc. In radiotherapy and medical physics, AM also allows the fabrication of personalized tools: beam modifiers to accommodate irregular patient surfaces, wedge filters to modify the isodose distribution, electron beam cut‐outs for beam shaping, anthropomorphic radiotherapy phantoms to validate the overall deliverability of treatment plans involving imaging and dosimetry, etc.[ 3 , 4 ] According to the concept of personalized medicine, implants should be designed based on the needs of each patient.[ 5 ] However, the two main challenges faced by AM in the development of personalized biomedical polymer objects, are design accuracy—the 3D‐printed parts usually lack precision and conformity with respect to the initial computer‐assisted design (CAD) prints—and the respect of physical and mechanical properties of the functional object designed according to the patient's anatomy.[ 6 ]
In recent years, polyetheretherketone (PEEK) has stood out as a high‐performance material for the fabrication of patient‐specific long‐term implants.[ 7 ] PEEK is a semicrystalline, polycyclic, aromatic thermoplastic belonging to the family of linear aromatic polymers. It was introduced in the late 1990s for the replacement of metal implants in orthopedics applications and, since then, it has been used in a variety of applications due to its excellent properties of chemical resistance, high‐temperature performance, high yield strength, lightweight, durability, stiffness, and fatigue resistance.[ 8 ] PEEK is a linear poly(aryl‐ether‐ketone) and is a melt processable aromatic polymer; the melting point T m lies between 330 and 385 °C, depending on the relative proportion of ether–ketone groups linking the phenylene rings.[ 9 ] PEEK is of good resistance to most organic solvents except concentrated sulfuric acid (95–98%) and methyl sulfonic acid (CH3SO3H).[ 9 , 10 ] The density of PEEK polymer is 1.30 g cm−3, with an expected tensile strength hovering around 3.8 GPa.[ 11 ]
Patient‐specific surgical implants made of 3D‐printed PEEK were recently reported.[ 5 ] PEEK was also recently introduced as an encapsulation material for brachytherapy (BT) seed spacers, with metal ions for “positive” magnetic resonance imaging contrast.[ 12 ] The radiolucency of PEEK, its chemical inertness (e.g., resistance to sterilization and to biological fluids), high mechanical strength, and now the possibility to reach sub‐millimetric dimensions with a high degree of geometrical conformity, figure among the main advantages of this polymer for the development of novel medical physics technologies, including for BT applications.
BT, or internal radiation therapy, is an area of medical practice where 3D printing could open several opportunities for more personalized medical implants and devices.[ 4 , 13 ] Tailoring applicators, needle guides, or BT implants to the needs of individuals can be impractical with conventional manufacturing techniques. For this reason, over the years BT treatment delivery approaches were developed mainly based on standard applicators and implants whose geometries were designed to conform to population‐based approximations. However, some patients have unique anatomies that require customized approaches: varying body habitus, surgical sequelae, challenging tumor configurations, etc.[ 13 ] At the moment, AM is being explored with very promising results for the production of patient‐specific BT applicators for 1) plesiobrachytherapy (i.e., the radioactive source positioned close to the tumor but not into it), mainly for nonstandard superficial, scalp, and penile procedures, 2) vaginal intracavitary BT, in particular when the patient's vaginal cuff does not conform to a hemispherical dome geometry, and 3) adjuvant radiotherapy following nasopharyngeal carcinoma, a surgical procedure that often deeply alters the anatomy of the patient.[ 13 ] In interstitial BT, AM can be used to fabricate needle templates and guides featuring oblique needle trajectories, which in several cases could help sparing adjacent normal tissues or sensitive organs (e.g., in head and neck, orbital, breast, and transvaginal cervical cancers).[ 13 ] Each one of these applications requires sub‐millimetric precision as well as mechanical strength, chemical resistance (e.g., to sterilization), and biocompatibility. Unfortunately, the achievement of an adequate level of compliance with this whole set of characteristics has always been problematic when relying on conventional polymer 3D‐printing methods.
Intracular melanoma, also called uveal melanoma, accounts for 83% of ocular melanomas[ 14 ] and accounts for more than 3–5% of all cases of melanoma. In 90% of the cases, uveal melanoma is located in the choroid (iris = 4%, body = 6%).[ 15 ] In fact, it is the second most common type of melanoma after skin cancer.[ 16 ] In the US only, 3400 new cases are diagnosed annually (incidence of 5.1 per million), and an estimated 390 persons die of the disease (estimates for 2020).[ 16 , 17 ] Up to 50% of patients with uveal melanoma develop distant metastasis.[ 18 ] In 1986, the Collaborative Ocular Melanoma Study (COMS) proposed a standardized geometrical model for episcleral plaques (EP) which was accepted in several countries and which still represents the gold standard in the conservative treatment of uveal melanoma (Figure 1e,f).[ 19 ] EPs are hemisphere‐shaped, circular‐rimmed circular metal objects of a diameter ranging from 10 to 22 mm, onto which radioactive seeds (either 125I, 106Ru, 103Pd, or 131Cs) are attached according to predefined and standardized patterns (Figure 1, for a geometrical representation). The plaques are implanted by surgery at the surface of the eye (diameter of an eyeball: 25 to 30 mm on average; Figure 1d).[ 20 ] The seeds are held in place by a silicon‐containing material (known as silastic insert). The outer surface is lined with a heavy metal (e.g., gold or alloy of gold) that shields up to 99% of the back‐projected radiation thus sparing the eyelids and other healthy tissues in the periphery of the treated volume (Figure 1e).[ 20 ] The standard plans provided by the American association of Physicists in Medicine (AAPM) and the American Brachytherapy Society (ABS) Task Group 129 describe the position of all radioactive seeds according to each one of the seed geometries.[ 20 ] Episcleral plaque brachytherapy (EPB) is an efficient treatment, with a local recurrence rate around 10.3%. By ensuring correct plaque position, intraoperative ultrasound confirmation can reduce to 1.5% the treatment failure rate.[ 21 ]
Figure 1.

a) Picture of a conventional COMS plaque (in metal), taken from the inside, with the radioactive seeds visible under the silastic layer; b,c) schematic representations of the standard radioactive seeds positioning with respect to the plaque; d) schematic representation of plaque surgical fixation on the sclera; e) dimensions of a typical COMS plaque (18 mm diameter) and illustration of the geometry of a tumor to be irradiated with the radioactive load (typical 85 Gy prescription dose at the apex); f) cross‐section and dimensions of a 14 mm diameter EP extracted from the COMS protocol, and exploited in the design of .stl files for polymer 3D printing in the present study (dimensions and schematic representations are adapted from ref. [20b]).
Unfortunately, EPB is also associated with significant side effects. First, a large proportion of patients are susceptible to develop glaucoma (2% to 45%) from 2 to 58 months after being treated. Then, between 8% and 68% of patients are susceptible to develop radiation‐induced cataracts within 5 years. Finally, radiation retinopathy occurs for 10% to 63% of the patients with a median follow‐up time of 3 years.[ 22 ] Multivariate analysis has shown that these effects are mainly due to high radiation doses received by critical structures such as the lens, the fovea, and the optic nerve. Among these, complications related to overexposure of the optic nerve are of primary concern.[ 20b ]
In fact, many of these side effects are induced by the many limitations of the COMS plaque protocol, specifically with respect to tumor cases that require higher geometrical precision. In fact, as a general requirement in EP BT, the tumor volume must be contoured as closely as possible by the isodose lines (i.e., the “dose pattern”). However, the conventional COMS plaque design and related protocol produces a generic isodose contour profile which is the result of studies mainly based on dome‐shaped tumors, which correspond to about 75% of all uveal melanoma cases. For the treatment of oblong tumors, a few high‐activity seeds are attached to conventional COMS plaques, and this type of treatment is far from being precise. Lateral modulations to the dose profile are limited by the current technology. A second type of tumor is problematic: tumors growing deep inside the eye, often referred to as “mushroom‐shaped,” occur in ≈20% of cases.[ 23 ] Such tumors, currently treated by the generic COMS protocol, would require more precise modulations to isodose lines in order to better delineate the tumor while sparing the healthy tissues located laterally. In fact, conventional COMS plaque produces a lot of lateral photon diffusion, with impact on the healthy tissues (sclera, optic nerve). Because mushroom‐shaped tumors are usually deeper than dome‐shaped ones, their treatment requires to load higher amounts of radioactivity. Therefore, the plaques are loaded with seeds that have typically higher activities, without any modulation between each seed. The resulting isodose contours are relatively broad and produce a lot of laterally scattered photons. For the mushroom‐shaped tumors, using a higher radioactivity concentration at the focal point corresponding to the center of the median of the tumor volume projected on the sclera could provide more precise, more forward‐projected isodose lines, and thus better therapeutic results. Finally, tumors located very close to healthy and crucial tissues (e.g., optic nerve, fovea, retina) necessarily require more precise dose contour patterns compared with the current possibilities offered by the COMS protocol.[ 24 ]
The design of EP has not changed in the last 20 years, even if slight modifications have been proposed.[ 25 ] Nevertheless, new designs are regularly proposed and studied to reduce the dose absorbed by healthy tissue. The eye physics plaque model 917 stands out, reducing the dose absorbed by the optic nerve and fovea by an average of 42% and 49%, respectively, compared to a COMS plaque, while delivering 85 Gy prescription dose at the apex.[ 24 , 26 ] However, this design is an improved version of the one proposed by COMS (e.g., stacking the same sources), so it suffers from the same limitations.
This study describes a novel procedure allowing the fabrication of EPB by polymer 3D printing. Numeric plans based on the geometry of the COMS EPs (10, 14, or 22 mm diameter) were generated (e.g., Figure 1f), with adaptations to enable their production by AM. A fused‐filament‐fabrication (FFF) printer was used to fabricate, for the first time, 3D‐printed EPs using PEEK, which is a rigid, chemically resistant, and biocompatible polymer adapted for BT applications. The 3D‐printed plaques were scanned by X‐ray computed microtomography (µCT) imaging, which allowed a direct geometrical accuracy evaluation with the initial computer‐aided design (CAD) plans used to generate the EP volume. The inner surface of the printed plaques’ cupolas was painted with radioactive 103Pd in four different patterns and radiation dose distribution measurements were performed. Isodose contours were revealed, thus confirming the possibility to modulate the geometry of dose profiles generated by the 3D‐printed plaques through a radioactivity painting approach. Lastly, ex vivo surgical suturing tests were performed on human eyeballs by an experienced ocular oncologist surgeon and using an established clinical surgery procedure, to demonstrate the functionality of the 3D‐printed plaques for manipulation in the operating room.
2. Results
CAD drawings of EPs described in the COMS protocol[ 20b ] were adapted to the particularities and requirements of 3D printing (Figure 1f and Supporting Information, Figure S1). For instance, suture lugs were drawn as filled protrusions parallel to the bed, with rounded joints linking them to the main ring of the plaque. These minor adaptations of the COMS plaque geometry to the requirements of 3D printing were necessary to reduce stress otherwise generated by right angles printed on the frame. Overall, these modifications did not change the geometry of the main functional part of the plaque.
2.1. CAD Models and 3D Printing
Each one of the CAD drawings was converted into .stl files using the finest meshing parameters. Stl files are 3D shapes defined by surfaces composed of triangles (“meshes”). The generation of rounded shapes, such as that for the hemisphere‐shaped EPs, requires fine meshing to reach the highest geometrical resolution for polymer FFF. The 3D models (.stl) were then imported in a slicer software to generate a gcode file. Each CAD model (10, 14, or 22 mm diameter EPs) was printed in at least three batches, each one of them containing six EPs as well as a “sacrificial tower” (Figure 2a). The “sacrificial tower” is an object inserted between each one of the printed layers, serving as a time adjustment for allowing the PEEK to cool between each pass of the nozzle. Brims, or excess layers of printed material extending at critical contours of the object, were added to the procedure to enhance the contact between the impression bed and the printed object.[ 27 ] Overall, this strategy allows a good printing quality in particular in convex areas, as demonstrated in the resulting printed plaques (Figure 2b).
Figure 2.

a) Schematic representation of the printing layout for a series of replicates of 14 mm diameter EPs. Image generated from the slicer software. b) High‐quality hemisphere‐shaped 3D‐printed PEEK plaques (10, 14, or 22 mm diameter EPs), at the post‐printing processing step.
Figure 2b shows the high‐quality hemisphere‐shaped 3D‐printed PEEK plaques generated for three different diameters typical of EPB. Figure 3 recapitulates each one of the steps of the 3D printing of PEEK EPs from 1,2) the development of a 3D‐suitable plan CAD from an original numeric shape; 3) the slicing and parametrization procedure allowing to program each layer of material deposited (color codes: supports = gray; brim = purple; internal extrusion (infill) = green; external extrusion (outskirts) = blue; see details in the Experimental Section); 4) the 3D printing of replicas (with the “sacrificial tower”); 5) post‐processing steps (brim and printing supports removal, gentle sandblasting, cleaning); 6–8) imaging and dimensional analysis procedures. Further details are provided in the Experimental Section of this article. Overall, both the convex and the concave parts of the EPs had, for most of the prints, a surface quality amenable to the post‐processing steps. More information on this can be found in the statistical analysis section of the Experimental Section. From Figure 1e,f, one can appreciate that the concave surface of the EPs is not in direct contact with the sclera of the eye; only the surface of rim is. Therefore, a certain level of irregularity at the inner surface of the EP would not be critical for the treatment, and no irritation of the sclera would occur.
Figure 3.

Steps of the design, printing process, and geometrical accuracy evaluation of the EPs produced by PEEK 3D printing: 1) Drawing of a 3D CAD model conforms to the COMS protocol; 2) adaptation of the 3D model to suit the requirements of FFF AM; 3) slicing process to generate .gcode files (gray = supports; purple = brim; green = infill; blue = perimeter (outskirts); 4) 3D printing of plaques; 5) post‐processing; 6) CT scanning; 7) 3D image segmentation; 8) comparative geometrical analysis (CT scans vs CAD files).
2.2. Imaging of 3D‐Printed Plaques and Comparative Geometrical Analysis with Initial CAD Files
The CT scans of six (n = 6), five (n = 5), and four (n = 4) 3D‐printed plaques of the 10, 14, and 22 mm diameter models, respectively, were selected for geometrical analysis. The images were reconstructed, contours of the scanned EPs were rendered and exported into .stl files for comparative analysis with the initial CAD plans. These .stl files of initial CAD plans (reference design) and the ones extracted from the 3D‐printed EPs after CT scan and segmentation (extracted design) were imported into an open‐source software (CloudCompare) for comparative analysis.[ 28 ] The reference design and the extracted design were initially superposed for a coarse fit using the “translate/rotate” tool of CloudCompare. Later, the “fine cloud registration” tool was used for precise registration of both CAD models. After the registration process, 3D geometrical deviation maps (reported in Figure 4a,c,e) and corresponding histograms (reported in Figure 4b,d,f) were estimated by calculating the distance between each point on the reference CAD model and the CAD model extracted from the segmented CT scan images of the 3D‐printed EPs using the “cloud/mesh distance” tool. These deviation histograms have a resolution of 2 µm (−1 to +1 mm; 1000 bins).
Figure 4.

3D geometrical deviation maps for a) 10, c) 14, and e) 22 mm diameter plaques. Warm colors represent the areas associated with the strongest deviations from the original CAD numeric prints. Corresponding histograms (b, d, f) are also represented, suggesting different populations of “deviations.”
In the 3D geometrical deviation maps (Figure 4a,c,e), warm colors indicate an excess of material, while cold colors indicate a lack of material compared with the initial CAD plans. Green indicates perfect agreement between both 3D models. Likewise, the deviation histograms reported in Figure 4b,d,f reveal three main deviation indicators. The black‐dotted vertical line shows the mean deviation for the 3D‐printed design, compared with the CAD model taken as a geometrical reference. Furthermore, the red‐dotted vertical line is a boundary at the right of which the material can be considered as “in excess,” whereas the blue‐dotted vertical line shows the boundary at the left of which the voxels as considered with a lack of material in comparison with the reference CAD design. The mean deviation was found in the range of 120–140 µm for all the 3D‐printed plaques with respect to the reference CAD designs (see Figure 4b–d). In comparison with the thickness of the standard COMS plaque (Figure 4f: 2.7 mm), this deviation of 120–140 µm corresponds to a divergence of ≈5.2% compared with the expected plaque thickness value. This dimension is very close to the PEEK printing resolution obtained with a 400 µm nozzle. In fact, PEEK is a highly viscous polymer and the optimal resolution reachable in 3D printing is in the 100 µm range. By making slight adjustments to the CAD designs, either in 2D planes or in all directions (in 3D), further improvements in the geometrical precision could be achieved (e.g., ≈5.2% to compensate for the dimensional shrinkage).
To further analyze the geometrical conformity of the implants, the 3D geometrical deviation maps and the corresponding deviation histograms were dissected between 1) the cupola and 2) the ring and suture lugs (Figure 5 ). The divergence observed for the ring and the suture lugs designs compared with the CAD plans is reported in Figure 5a,c,e. Figure 5b,d,f reports the divergence observed for the cupola of 3D‐printed plaques with respect to the reference COMS plaque design (CAD plans). Furthermore, Table S1 in the Supporting Information details the mean and standard deviation data, the surface areas, as well as the values of Gaussian fits performed over the series of plaques for these two volumes (cupola, and ring and suture lugs). For the cupolas, which represent the most important part of the plaque in terms of radiation function, the divergence of the 3D‐printed design from the reference was in the range of 50–130 µm (see Figure 5b,d,f). For the smaller diameter plaques (10 and 14 mm), this deviation was less than 100 µm (70 and 90 µm for 10 and 14 mm diameter plaques, respectively). The highest mean deviation (120 µm) was observed for the 22 mm diameter plaques (see Table S1, Supporting Information). As discussed above, this minor divergence in 3D‐printed plaque design with respect to the reference CAD plans is probably due to the intrinsic resolution of the PEEK printing process, which is associated with the nozzle dimensions and the intrinsic PEEK viscosity.
Figure 5.

3D geometrical deviation maps dissected between a) the ring and lugs region, and b) the cupola region, for a,b) 10, c,d) 14, and e,f) 22 mm diameter plaques. Warm colors represent the areas associated with the strongest deviations from the original CAD numeric prints. Corresponding histograms are also represented, revealing the different populations of geometrical “deviations.”
For the part of the plaque that corresponds to the ring and to the suture lugs, the mean deviation was larger, in the range of 150–180 µm (see Figure 5a,c,e). This geometrical deviation is associated with a slight shrinkage of the PEEK rink upon cooling. This shrinkage could also possibly be linked to the slight materials expansion seen at the surface of the cupola, since a constriction of the rink could induce a force perpendicular to the curvilinear surface of the cupola, that eventually decreases its radius of curvature upon cooling (e.g., the value 12.3 mm, in Figure 1f). Figure 6 provides a close‐up on the intersection between the cupola, the ring, and the suture lug parts. The black line represents the reference CAD design (abbreviated as “3D model”), and the superposed shaded areas are representations of the corresponding cross‐sections of the 3D‐printed plaque design (abbreviated as “original plan”). Overall, an almost perfect geometrical fit is revealed for the cupola, and this representation also confirms a slight expansion of the PEEK material upon cooling, with respect to the initial 3D printing CAD plans. An expansion of the PEEK material after cooling with respect to the 3D model was detected in the original plan design. This slight expansion (≈5%) in cupola thickness could certainly be considered and compensated for in the CAD design step, which could in turn improve the geometrical conformity of the object. The possibility to correct these slight dimensional defects by adjusting the CAD plan designs is currently being explored in a specific study by our research team.
Figure 6.

Radial cross‐sections of each plaque model: close‐up on the intersection between the cupola, the ring, and the suture lug parts. The black line represents the initial CAD drawing contours, whereas the superposed shaded areas represent the corresponding cross‐sections of the 3D‐printed volumes after printing, imaging, and numeric comparison.
Finally, one last “deviation” population can be observed in the area of 250–500 µm (see Figures 4b,d,f and 5a,c,e), and this corresponds to the voxels of the suture lugs. In fact, these features are thin compared with the cupola. Therefore, they are more affected by the resolution of the nozzle. They are also printed in direct contact with the print bed, and thus they are also more affected by the post‐processing step. However, the deviation is observed along the plane of the print bed, and this deviation, being also in the plane of the surface of the sclera, would not affect the geometrical precision of the EP placement and surgical suturing. Elongated suture lugs would simply provide a more robust attachment feature for the surgical sutures. The mean and standard deviation data, the surface areas, as well as the values of Gaussian fits performed over the series of plaques are available in the Supporting Information (Table S1).
2.3. Dose Patterns Generation from Plaques using Radioactivity Painting
The 3D‐printed plaques with cupolas showing a level of geometrical compliance within 100 µm (i.e., <70 and <90 µm for the 10 and 14 mm diameter plaques, respectively) were selected. The inner surface of each PEEK‐printed cupola was painted with radioactive patterns to generate both symmetric and asymmetric dose distributions. This part of the study aimed at demonstrating the possibility, by using a radioactivity painting approach, to achieve the level of dose profile precision required to finely delineate the contours of the tumors in uveal melanoma treatments. The experimental setup used to produce the different variants of dose patterns on a stacking of ten gafchromic dosimetric films (0.278 mm thick each) is represented in Figure 7 .
Figure 7.

Dose patterns radioactivity painting: a) four patterns of radioactivity prints encapsulated in the polymer liner of the plaques. b) Schematic representation of the experimental setup used to perform the dose distribution study.
The inner surface of the cupola of the PEEK‐printed plaques having 10 and 14 mm diameter (geometrical compliance within 100 µm with respect to the initial CAD designs) were painted with droplets (≈2 µL and 0.6 mCi ≈ 22.2 MBq each) of the radioisotope 103Pd—widely used in BT—to form four different dose patterns. For “case 1,” the five droplets (equivalent to 3 mCi of 103Pd per plaque) were placed at the center of the plaque. The geometrical setup of “case 2” was identical to “case 1” (five radioactive drops were placed at the middle) and a small, pierced foil of thick gold was placed on top of the radioactive droplets with an aim to “harden” the contours of the dose profile. For “case 3” and “case 4,” the radioactivity droplets were placed in the form of a crescent, each made with five radioisotope drops (see Figure 7a). Patterns consisting of either one or five drops centered in the middle of a plaque were deposited on the 10 mm diameter plaques, whereas crescent‐shaped patterns made with five drops each were deposited on the 14 mm diameter plaques.
Figure 8 reveals the dose profiles, obtained with the gafchromic dosimetric films after exposure to each one of the four patterns (“case 1” to “case 4”). The dosimetric films with isodose lines corresponding to 25% (pink), 60% (yellow), and 90% (red) of the highest dose achieved on the films are shown in Figure 8a,b,d,e. The 2D dose profiles for films located at 3.9, 4.1, 4.4, 4.7 mm (1st, 2nd, 3rd, and 4th) from the inner surface of the 10 mm diameter plaque are reported in Figure 8c. Figure 8f reports for films located at 4.5, 4.8, 5.1, 5.4 mm from the inner surface of the 14 mm diameter plaque. The maximum value (100%) is attributed to the highest absorbed dose and the lowest value (0%) is attributed to the background (see the Experimental Section for a detailed description).
Figure 8.

Dose distribution after radiation exposure of the first four dosimetric films stacked on EPs corresponding to cases a) 1, b) 2, d) 3, and e) 4 (from left to right); 0 corresponds to the minimum intensity and 1 corresponds to the maximum intensity. Isodoses corresponding to 25% (pink), 60% (yellow), and 90% (red) are added to allow a better visualization of the dose profile shape. For each one of the four cases, cross‐sections of the dose distributions are provided (c, f) which were taken from the axes represented by the dashed lines on the dosimetric films.
In the dose distribution acquired for cases 1 and 2 (depicted in Figure 8a,b), the dashed black and green lines are the cross‐sections taken from the middle of the dose profiles, and the corresponding dose profiles are represented in Figure 8c. The dose profiles appeared almost perfectly superposed. This indicates that the presence of a small ring of gold does not contribute to “hardening” the dose profile, i.e., it does not lead to more abrupt dose edges. For the crescent‐shaped drop patterns (Figure 8f; cases 3 and 4), much different profiles are revealed. In Figure 8d,e, the dashed blue and red lines correspond to the middle trajectory of the cross‐sections of the crescent‐shaped dose prints. For case 3 (Figure 8d), the radioactive drops followed the perimeter of the circular plaque according to a crescent shape. For case 4, however, (Figure 8e), the radioactive crescent made a certain angle with respect to the perimeter of the cupola. Hence, for both cases, the dose profiles did not superpose one another (Figure 8f). Here, the curvature of the plaque and the respective position of the radioactive crescent on the cupola resulted in different dose profiles. Case 3 resulted in a narrower dose profile, while case 4 resulted in a flared dose profile. Overall, these results confirm the possibility to shape dose profiles by painting radioactivity patterns of precise shapes and adequate positioning at the curved surface of the plaque.
2.4. Ex Vivo Surgical Evaluation of 3D‐Printed EPs on Human Eyeballs
The conventional COMS plaques are made of metal, and therefore the manipulation of 3D‐printed polymer plaques might be affected by this change of material. Hence, ex vivo surgical tests were performed with the 3D‐printed PEEK plaques (Figure 9 ). These tests were performed on human cadaveric donor eyeballs by an ocular oncologist surgeon (Dr. Claudine Bellerive, CHU de Québec) according to the best surgical procedures in the field. The scores of each manipulation are reported in Table S2 of the Supporting Information, with detailed information on the evaluation protocol and criteria.
Figure 9.

Manipulation of 3D‐printed polymer EPs: surgical tests on human donor eyeballs: a) 14 mm diameter 3D‐printed plaques; b) surgical instruments used: 1) sterile gauze, 2) eyeball support, 3) suture film, 4) sterile irrigation solution, and 5) tweezers; c) plaque positioning at the surface of the eyeball; d) position marking of the suture lugs on the sclera; e) sewing of intrascleral suturing points; f) cutting excess threads after knotting.
Both PEEK‐printed EPs having flexible suture eyelets obtained the highest scores, higher than for the conventional COMS plaques currently used in clinical BT procedures. Specifically, the mechanical properties of the 3D‐printed PEEK plaques were found of superior quality by the surgeon. The surgeon was able to hold the printed plaques easily with the tweezers throughout the process of suturing and removal (score = 5). In terms of ease of needle passing through the eyelets, the 3D prints were found to be equivalent to the COMS plaques. Also, the eyelets must be rigid enough to withstand the tension exerted by the suture threads after implantation of the plaques. In this, the 3D‐printed plaques were found equivalent to the COMS plaques. Finally, placement and fitting of the plaque on the sclera were found much better than for the COMS plaques, as well as considering the integrity of the eyelets at the time of knot cutting from the sutures. Overall, for all seven evaluation criteria, the 3D‐printed plaques were found better or at least equivalent to the COMS plaques currently used in the clinic for the treatment of uveal melanoma by EPB.
3. Discussion
With the remarkable advances made in technological capacities achieved in the field of additive manufacturing, the recent years have seen a surge in the number of papers describing BT procedures enhanced by the use of patient‐specific devices such as applicators and vaginal templates for intracavitary‐interstitial applicators,[ 29 ] even patient‐specific shielded nasopharynx applicator,[ 30 ] patient‐specific molds for treating patients with hard palate carcinoma with high‐dose‐rate interventional radiotherapy (HDR‐IR),[ 31 ] patient‐specific applicators for HDR BT, boluses for photon and electron radiotherapy for patients with basal cell carcinoma and recurrent squamous cell carcinoma,[ 32 ] personalized elastic skin applicators for HDR BT,[ 33 ] as well as patient‐specific templates for multicatheter interstitial BT for the treatment of breast cancer patients.[ 34 ] In all of these applications effectively implemented in the clinic, the authors reported that the templates and applicators developed by 3D printing provided an easy and effective way to deliver personalized radiotherapy treatments to cancer patients. Because the objects were precisely tailored to the anatomy of each patient, the precision of the treatment was greatly enhanced, and achieved better concurrence between the planned and delivered radiation doses, which improved the quality of treatments.
BT‐specific objects (applicator, implant, bolus…) more personalized to the anatomy of the patient's organs, and also to the specific contours of a tumor, are necessary at this step of the development of internal radiotherapy treatments. The present study is the first to demonstrate the possibility to 3D‐print a small‐dimension BT device, an EP, at such a high geometrical level of resolution that it complies with the requirements of an existing BT protocol—here the COMS protocol. Until now, the precision of BT plaques has been largely limited by the standard shape of the COMS plaques, which conforms to population‐based approximations. The 3D printing method described in the present study provides a more anatomically relevant approach which could increase the level of precision in dose delivery and planning. The production of radioactive implants with a biocompatible material such as PEEK, facilitating the forming of anatomically relevant shapes, could be a transformative innovation particularly in the field of ocular BT.
4. Conclusion
This study provides the first proof of concept to fabricate radioactive BT implants by an approach combining polymer (PEEK) 3D printing, biomedical imaging for geometrical conformity assessment, and radioactivity painting. In terms of geometrical accuracy, the 3D‐printed plaques were found to be in very good agreement with the initial CAD plans, in a tolerance of less than 100 mm in the functional region of the device (i.e., the cupola). The level of precision could be further enhanced by adjusting the CAD plans prior to 3D printing in order to compensate for the observed polymer shrinkage effects. Biomedical imaging, and more precisely µCT imaging, has demonstrated a high level of metrological precision for correlating the initial CAD plans to the ultimate forms of the 3D‐printed objects. The dose profiles measured by radiochromic films applied at the surface of 3D‐printed plaques revealed the possibility to modulate dose contours by changing the radioactivity pattern applied on the inner part of the plaques. Finally, the ease of handling during surgical procedures was carefully assessed by an experienced surgeon, and these experiments confirmed that PEEK 3D‐printed plaques are at least equivalent and, in some instance, better than the COMS plaques used in clinic in terms of manipulation. Anatomically relevant EPs generated by this technique could be particularly promising in challenging cases such as highly elliptic eye contours, nonisotropic tumor contours, and tumors located close to the optic nerve. The methodology described in this research article could also be adapted to a range of different BT applications to fabricate devices and inserts based on patient's requirements with respect to the geometry of the tumor and radiation sensitive organs, with an overall positive impact on the quality of radiotherapy treatments.
5. Experimental Section
Figure 3 recapitulates the steps followed to produce 3D‐printed EPs, from the design of the part to the 3D printing process, to imaging, and to the comparison for geometric accuracy with the COMS plaque. These procedures are discussed in detail in the following sections.
EP CAD Model
A base EP model was designed, following the dimensions prescribed by the COMS protocol 9 (Figure 1f). The standard plans provided by the AAPM/ABS Task Group 129 also described the position of all radioactive seeds according to each one of the seed geometries (Figure 1e).[ 20b ] The hemisphere‐shaped plaque featured a 12.3 mm radius of curvature. This radius was assumed to correspond to the average eyeball radius of the adult population.[ 35 ] The plaque was mounted on a ring (2.7 mm high), and several ring diameters were available for matching approximately with the size of the tumors (10–22 mm). CAD drawings of EPs adapted from the COMS geometry (Figure 1) were thus adapted to the particularities and requirements of 3D printing. CAD models were designed (software CREO Parametric Student edition, Version: 6.0, Boston, USA) with 10, 14, or 22 mm diameters and thicknesses of 0.5 mm (Figure 2). Suture lugs were drawn as filled protrusions parallel to the bed, with rounded joints linking them to the main ring of the plaque. These minor adaptations of the COMS plaque geometry to the requirements of 3D printing were necessary to eliminate the stress otherwise generated by right angles printed on the frame. Overall, these changes did not alter the geometry of the main functional part of the plaque.
Adaptation of the CAD Models to 3D Printing Plans (.stl Files)
Each one of the CAD models was converted into .stl files (CREO software) and using the finest meshing parameters. The 3D models (.stl) were then imported in a slicer software (Simplyfy3D, Version: 4.1.2, Simplify3D Inc.; Ohio, USA) to generate a gcode file. Each one of the print batches included six EP replicates as well as a “sacrificial tower” (Figure 2a). Brims, or excess layers of printed material extending at critical contours of the object were added to the procedure to enhance the contact between the impression bed and the printed object.[ 27 ]
3D Printing of EPs
The EP replicates were printed with a PEEK FFF printer (P220, Apium Additive technologies GmbH, Karlsruhe, Germany). A 0.4 mm diameter printing nozzle was used, thoroughly cleaned using a wire brush before each experiment. The printing was performed at a 0.1 mm layer thickness, with nozzle and printbed temperatures of 485 and 130 °C, respectively. Throughout the printing process, the filament was kept at a temperature of 60 °C. No infill was used considering the geometry of the plaques. Filaments of medical‐grade PEEK (450 Natural 1.75 mm; Apium Additive technologies GmbH, Karlsruhe, Germany; Manufacturer: Evonik Industries AG, Germany) were used throughout the study. Before printing, a fixative (DimaFix, DIMA 3D, Valladolid, Spain) was applied on the printbed to ensure first layer adhesion during the process. Prior to printing, the PEEK filaments were dried at 80 °C for 3 h using a dedicated tool (FD1, Apium Additive technologies GmbH, Karlsruhe, Germany). Each CAD model (10, 14, and 22 mm diameter EPs) was printed in at least three batches, each one of them containing six EPs.
EP Post‐Printing Steps
The post‐processing of 3D‐printed EPs was performed in a series of steps (see Figure 3). Initially, the brims were removed using a knife (#1 with blade #11; X‐ACTO, USA), and printing supports were removed by shear cutters (1 mm, model 170, PLATO, Techspray, USA). The remaining support material in the convex part was removed by rotary drill (Stylo 1050, Dremel). Lastly, the plaques were sandblasted with cushioned sanding pads (2″ × 2″ aluminum oxide abrasive; McMaster‐Carr, from 400 grit up to 12 000 grit; 4 min each step) and were carefully rinsed with nanopure water (17.9 MΩ cm; Barnstead ultrapure system).
Imaging of 3D‐Printed EPs
The 3D‐printed EPs were imaged in a micro X‐ray computed tomography system (CT, eXplore Locus 80, E Healthcare, Milwaukee, USA). The µCT scan was performed using the following exposure parameters: applied voltage = 80 keV, tube current = 450 mA, and detector exposure time = 100 ms. In order to obtain high‐quality X‐ray images, detector binning = 2 × 2, voxel resolution = 45 µm, and three frames averaging setting were used. The images were reconstructed using Parallax Innovations Reconstruction tool (Parallax Innovations, Ilderton, ON, Canada). The EP contours on the reconstructed images were delineated and visualized by manual adjustment of grayscale threshold values, using the Isosurface tool in MicroView (Parallax Innovations version: 2.5.0, Ilderton, ON, Canada). Image segmentation was performed by setting a surface quality factor to 100% (maximum) and surface smoothing option enabled. These segmented images were saved in .stl format and used for comparative analysis to evaluate the geometrical accuracy of the 3D‐printed EPs.
Comparative Geometrical Analysis between Initial CAD Plans and the Numeric Contours of 3D‐Printed EPs
An open‐source software, CloudCompare (version 2.10.2), was used to compare the .stl files of the initial CAD plans (in the text referred as “reference”) and the .stl files of the 3D‐printed EPs—extracted after CT scan and segmentation procedure (referred as “extracted” in the text). Both reference and extracted .stl files were imported into CloudCompare. A first fit of both 3D models was performed using the “translate/rotate” tool of the software, by manually superposing them. Then, the “fine cloud registration” tool was used for a more precise fitting. This tool automatically and precisely registered the reference and extracted 3D models (see Figure 3, 4, 5, 6, 7, 8). More information on the algorithm used by CloudCompare for automatic fine registration of 3D objects can be found elsewhere.[ 28 ] One iteration consisted in comparing for a thousand points over the two matching surfaces (reference CAD and the image from the CT‐scanned 3D‐printed object) the mean distance between the closest matching points in each numeric object. The iterative process was stopped when a difference of 10−6 mm was reached between two successive alignment iterations. This estimated distance between the two closest points represented the deviation of the 3D‐printed model from the reference CAD models. The data are presented in the form of histograms in Figures 4 and 5.
Radioactivity Painting of 3D‐Printed EPs
Droplets of a radioactive 103Pd chloride solution (BWX Technologies Inc., VA, USA; ≈2 µL and 0.6 mCi each) were placed to form four different dose patterns (Figure 7a). The radioactive droplets were deposited on small circular pieces of microporous tape (Paramedic‐Canada, Laval, Canada) precisely laid at the inner surface of the plaques and allowing liquid absorption (Figure 10 ). “Case 1” corresponded to five radioactive 103Pd droplets placed at the center of the cupola. “Case 2” was identical to “Case 1,” except with a pierced gold foil to harden the radiation profile emitted by the 103Pd droplets. “Case 3” consisted of radioactive 103Pd droplets aligned with the cupola contour in the form of a crescent. “Case 4” consisted of a radioactive 103Pd droplet crescent off‐center with the cupola contour. For cases 1 and 2, 10 mm diameter plaques were used, whereas for cases 3 and 4, 14 mm diameter plaques were used. The droplets were left to dry for ≈1 h, followed by the application of a sealing layer of polymer.
Figure 10.
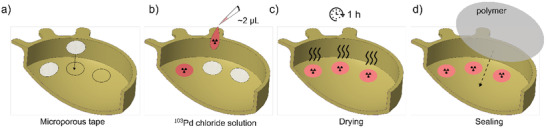
Schematic representation of the radioactivity painting procedure inside of the 3D‐printed plaques. First, a) coupons of adhesive microporous tape are placed on the plaque; b) radioactive drops are placed on the microporous liners, and left to dry for 1 h; c,d) finally, a hermetic polymer membrane is applied to seal the radioactive pattern.
Dose Profiles Produced by 3D‐Printed EPs Painted with 103Pd Radioactivity
The 103Pd‐painted PEEK plaques were produced in triplet and were placed in separate lead shielded containers in order to isolate them from the neighboring plaques (see Figure 8b). A 0.05 mm thick gold foil 99.95% (Alfa Aesar, MA, USA) was placed at the bottom of each container. The gold back liner of the conventional COMS plaque was reproduced by placing the concave face of the 103Pd‐painted EPs on these gold foils, such that the convex face was toward the foil (Figure 8b). The concave volume of the plaques was filled with gelatin (12% w/w; from porcine skin, type A; Sigma‐Aldrich, USA), a material showing materials‐to‐radiation properties similar to the eye sclera and to the vitreous body. Lastly, ten layers of gafchromic EBT3 dosimetry films (2 × 2 cm each; 0.278 mm thick; Ashland Advanced Materials, NJ, USA, Lot # 04191601) were stacked on the top of the gelatin layer and were exposed to 103Pd radiation for 4 h. After exposure, the dosimetry films were collected, digitized, and transformed into relative dose contours using maximal and minimal pixel values.
Calibration of Gafchromic Films and Dose Profile Estimation
Dosimetry study was performed following standard procedure based on the report of AAPM task group 235 radiochromic film dosimetry.[ 36 ] The dosimetry films were scanned using an Epson numerizer (EPSON H70217A, 72 dpi, 48‐bit Color) within 24 h of radiation exposure. The films were digitized and transformed into relative dose contours using maximal and minimal pixel values. The highest value pixels (i.e., highest transparency, “whiter” pixels) were set to correspond to the background and the minimal pixel values were set to correspond to the maximum absorbed dose (i.e., highest film irradiation). The background signal was found to vary across the films due to intrinsic properties of each film and to their respective distance from the radioactive EP. Therefore, to obtain the relative dose contour values for each radioactivity painting “case,” a correction factor specific to each gafchromic film used in the study, and taking into account the relative distance between each film and the radioactive EP, had to be applied from a set of calibration curves. These calibration curves are detailed in the Supporting Information (Figure S2). In brief, for each irradiated film, the values of 40 pixels corresponding to the background were extracted and their median value was calculated. Then, for each specific EP‐film distance, and for each one of the radioactivity painting “cases” (see Figure 7), the mean value of the three median values for each one of the three gafchromic films corresponding to each case and specific position was calculated and plotted in graphs providing grayscale values (y‐axis) in function of the specific EP‐film position (x‐axis) (with error bars corresponding to the standard deviation on these three median values; Figure S2, Supporting Information). An exponential fit was applied on each one of these profiles (see Figure S2 in the Supporting Information). The correction factors were obtained by subtracting each individual film median pixel value from the value of the fitted profile at each specific EP‐film distance (x‐axis value). Finally, these corrected grayscale films were converted to relative dose values using the maximal and minimal values contained in the thus‐corrected numeric matrices. The relative dose to the first film (i.e., the film closest to the radiation source) was estimated by using the median of the 20 minimal grayscale pixel values (i.e., the “darkest” values) as the maximum dose received by the film. Isodose contours extracted from these procedures are shown in Figure 8.
Ex Vivo Surgical Evaluation of 3D‐Printed EPs with Human Eyeballs
Summarize here are the steps followed to evaluate the 3D‐printed EPs by surgical manipulations. Human enucleated eyes were obtained from the Banque d'Yeux du Centre Universitaire d'Ophtalmologie (Québec, QC). The eyeballs were extracted and handled according to the rules and guidelines of the ethical committee at the CR‐CHU de Québec‐Université Laval (with approval from this ethical committee, number 128861). Surgical tweezers (0.3 and 0.5 mm diameter), suture film (black ethilon monofilament; Ethicon, Somerville, NJ), an eyeball support, sterile gauze, and sterile irrigation solution were used (see Figure 9b). The manipulation and suturing procedures were performed with the 10 and 14 mm diameter 3D‐printed plaques (see Figure 9a), following a procedure inspired from the EP‐BT insertion and extraction procedure.[ 37 ] Each eyeball was placed on a dedicated gauzed‐lined support which blocked the risks of sliding during the surgical procedure. An intravitreous injection of BSS sterile irrigating solution was performed until a normal intraocular pressure of 12–22 mmHg was obtained (Glaucoma Research Foundation, 2020). This verification was performed by palpation, as usual in conventional surgical procedures. Later, the plaque was placed at the surface of the eyeball (see Figure 9c) and the position of suture lugs was marked on the sclera using a permanent marker (see Figure 9d). An intrascleral suturing point was sewn on each one of the marks with extreme care to avoid perforation of the eyeball (see Figure 9e). The plaque was placed back on the sclera, and threads were passed through the lugs for knotting, and excess threads were cut (see Figure 9f). Plaque removal procedures were also performed by cutting the knots, and by visualizing any sign of degradation of the sclera in the vicinity of the suturing points.
Criteria Considered to Evaluate the Ease of Manipulation of 3D‐Printed EPs in the Surgery Room
A qualitative evaluation chart was filled‐out in order to assess the overall ease of handling of the 3D‐printed EPs in the context of surgical manipulation (Supporting Information Tables S2 and S3). The main seven evaluation criteria were: 1) mechanical properties of the plaques allowing easy manipulation and positioning on the sclera; 2) quality of plaque grasping with tweezers; 3) ease of insertion of the plaque through the Tenon capsule; 4) ease of needle passing through the eyelets; 5) ease of thread insertion in eyelets; 6) general positioning, placement, and fitting of the plaque over the sclera; 7) ease of knot cutting at the eyelets. This quantitative evaluation chart was used to compare the 3D‐printed EPs, in the context of surgical manipulation, against the currently used COMS plaques. For the comparison, a scale of five points was used for scoring each criterion, 1 = minimum quality, 5 = maximum quality, 3 = quality equivalent to the COMS plaque, 2 and 4 = intermediaries to COMS plaque. For the COMS plaque, three points per criterion were considered, totaling to 21 points.
Statistics
For the 3D printing of EPs, each CAD model (10, 14, and 22 mm diameter) was printed in at least three batches, each one of them containing six EPs. Each one of the EPs was qualitatively evaluated based on the following criteria: i) no defect larger than 0.3 mm visually detected at the surface of the PEEK plaques; ii) no discontinuity observed between the superposed PEEK layers; iii) no macroscopic evidence of shrinkage, or distortion in the printed EP. Any sample presenting one of these defects was treated as an outlier and discarded from the study. This procedure allowed to identify groups of EPs amenable to quantitative geometrical assays (CT‐scans): six (n = 6) for 10 mm diameter EPs, five (n = 5) for 14 mm diameter EPs, and four (n = 4) for 22 mm diameter EPs 3D‐printed plaques. The geometrical assessment procedure was performed on each one of these samples, and average values were calculated and reported in the histograms. The 103Pd‐painted PEEK plaques were produced in triplicate, and gafchromic film irradiations were also performed in triplicate. At all steps when required, average values were calculated as mean ± standard deviation (SD). Due to the nature of these studies (geometrical measurements), because of the small size of the groups, and because of the high degree of similarity between the 3D‐printed EP in each group, no specific statistical test nor statistics software was used in this study.
Conflict of Interest
The authors declare no conflict of interest.
Supporting information
Supporting Information
Acknowledgements
This study was financed by a Project Grant from the Canadian Institutes of Health Research (CIHR, grant number 173408), by the Natural Sciences and Engineering Research Council of Canada (NSERC)‐Discovery Grants (individual) program (M.A.F.—RGPIN‐2017‐06173; L.B.—RGPIN‐2019‐05038), and by the program “Concert pour la vie” from the Fondation du CR‐CHU de Québec‐ULaval. The procurement of human eyeballs was possible thanks to the Eye Tissue Bank, which was financially supported by the Vision Health Research Network (VHRN), a thematic network supported by the Fonds de recherche du Québec – Santé (FRQS). S.L. is a Junior 2 Research Scholar of the FRQS. P.G.‐L. was a recipient of a Master Recruitment Scholarship from the Fonds Wilbrod‐Bhérer de l'Université Laval.
Lescot T., Lebel‐Cormier M.‐A., Seniwal B., Gros‐Louis P., Bellerive C., Landreville S., Beaulieu L., Fortin M.‐A., Tumor Shape‐Specific Brachytherapy Implants by 3D‐Printing, Precision Radioactivity Painting, and Biomedical Imaging. Adv. Healthcare Mater. 2023, 12, 2300528. 10.1002/adhm.202300528
Data Availability Statement
The data that support the findings of this study are available from the corresponding author upon reasonable request.
References
- 1.a) Pei X., Zhang B., Fan Y., Zhu X., Sun Y., Wang Q., Zhang X., Zhou C., Mater. Lett. 2017, 208, 133; [Google Scholar]; b) de Moraes P. H., Olate S., Cantín M., Assis A. F., Santos E., Silva F. d. O., Silva L. d. O., Int. J. Morphol. 2015, 33, 826; [Google Scholar]; c) Murr L. E., Gaytan S. M., Medina F., Lopez H., Martinez E., Machado B. I., Hernandez D. H., Martinez L., Lopez M. I., Wicker R. B., Bracke J., Philos. Trans. R. Soc., A 2010, 368, 1999; [DOI] [PubMed] [Google Scholar]; d) Ryan G., Pandit A., Apatsidis D. P., Biomaterials 2006, 27, 2651. [DOI] [PubMed] [Google Scholar]
- 2.a) Bhargav A., Sanjairaj V., Rosa V., Feng L. W., Fuh Yh J., J. Biomed. Mater. Res., Part B 2018, 106, 2058; [DOI] [PubMed] [Google Scholar]; b) Bibb R., Eggbeer D., Williams R., Rapid Prototyping J. 2006, 12, 95. [Google Scholar]
- 3.a) Leong K. F., Cheah C. M., Chua C. K., Biomaterials 2003, 24, 2363; [DOI] [PubMed] [Google Scholar]; b) Leong K. F., Chua C. K., Sudarmadji N., Yeong W. Y., J. Mech. Behav. Biomed. Mater. 2008, 1, 140; [DOI] [PubMed] [Google Scholar]; c) Melchels F. P. W., Bertoldi K., Gabbrielli R., Velders A., Feijen J., Grijpma D. W., Biomaterials 2010, 31, 6909; [DOI] [PubMed] [Google Scholar]; d) Zein I., Hutmacher D. W., Tan K. C., Teoh S. H., Biomaterials 2002, 23, 1169; [DOI] [PubMed] [Google Scholar]; e) Shi J., Zhu L., Li L., Li Z., Yang J., Wang X., Sci. Rep. 2018, 8, 7395; [DOI] [PMC free article] [PubMed] [Google Scholar]; f) Tino R. B., Leary M., Yeo A. U., Kyriakou E., Kron T., Brandt M., Int. J. Extreme Manuf. 2020, 2, 012003; [Google Scholar]; g) Poomathi N., Singh S., Prakash C., Subramanian A., Sahay R., Cinappan A., Ramakrishna S., Rapid Prototyping J. 2020, 26, 1313; [Google Scholar]; h) Bose S., Ke D., Sahasrabudhe H., Bandyopadhyay A., Prog. Mater. Sci. 2018, 93, 45; [DOI] [PMC free article] [PubMed] [Google Scholar]; i) Li J. H., Wu C. T., Chu P. K., Gelinsky M., Mater. Sci. Eng., R 2020, 140, 100543; [Google Scholar]; j) Vijayavenkataraman S., Yan W. C., Lu W. F., Wang C. H., Fuh J. Y. H., Adv. Drug Delivery Rev. 2018, 132, 296. [DOI] [PubMed] [Google Scholar]
- 4.a) Song W. Y., Tanderup K., Pieters B., Emerging Technologies in Brachytherapy, CRC Press, Taylor & Francis Group, Boca Raton, FL: 2017; [Google Scholar]; b) Tino R., Leary M., Yeo A., Kyriakou E., Kron T., Brandt M., Int. J. Extreme Manuf. 2020, 2, 012003. [Google Scholar]
- 5. Honigmann P., Sharma N., Okolo B., Popp U., Msallem B., Thieringer F. M., Biomed Res. Int. 2018, 2018, 4520636. [DOI] [PMC free article] [PubMed] [Google Scholar]
- 6. Arefin A. M. E., Khatri N. R., Kulkarni N., Egan P. F., Polymers 2021, 13, 1499. [DOI] [PMC free article] [PubMed] [Google Scholar]
- 7.a) Kurtz S. M., Devine J. N., Biomaterials 2007, 28, 4845; [DOI] [PMC free article] [PubMed] [Google Scholar]; b) Rinaldi M., Ghidini T., Cecchini F., Brandao A., Nanni F., Composites, Part B 2018, 145, 162; [Google Scholar]; c) Kurtz S. M., Andrew W., PEEK Biomaterials Handbook, William Andrew, Oxford: 2019. [Google Scholar]
- 8.a) Alonso‐Rodriguez E., Cebrián J. L., Nieto M. J., Del Castillo J. L., Hernández‐Godoy J., Burgueño M., J. Craniomaxillofac. Surg. 2015, 43, 1232; [DOI] [PubMed] [Google Scholar]; b) Rammos C. K., Cayci C., Castro‐Garcia J. A., Feiz‐Erfan I., Lettieri S. C., J. Craniofac. Surg. 2015, 26, 631; [DOI] [PubMed] [Google Scholar]; c) Fernandez‐Yague M. A., Abbah S. A., Zeugolis D. I., Pandit A., Biggs M. J., McNamara L., Adv. Drug Delivery Rev. 2015, 84, 1; [DOI] [PubMed] [Google Scholar]; d) Kasliwal M. K., O'Toole J. E., J. Clin. Neurosci. 2014, 21, 217; [DOI] [PubMed] [Google Scholar]; e) Pokorny D., Fulin P., Slouf M., Jahoda D., Landor I., Sosna A., Acta Chir. Orthop. Traumatol. Cech. 2010, 77, 470; [PubMed] [Google Scholar]; f) Panayotov I. V., Orti V., Cuisinier F., Yachouh J., J. Mater. Sci.: Mater. Med. 2016, 27, 118; [DOI] [PubMed] [Google Scholar]; g) Singh S., Prakash C., Ramakrishna S., Eur. Polym. J. 2019, 114, 234. [Google Scholar]
- 9. Attwood T., Dawson P., Freeman J., Hoy L., Rose J., Staniland P., Polymer 1981, 22, 1096. [Google Scholar]
- 10. Wijers M., Jin M., Wessling M., Strathmann H., J. Membr. Sci. 1998, 147, 117. [Google Scholar]
- 11.a) Kuo M. C., Tsai C. M., Huang J. C., Chen M., Mater. Chem. Phys. 2005, 90, 185; [Google Scholar]; b) Rae P., Brown E., Orler E., Polymer 2007, 48, 598; [Google Scholar]; c) Díez‐Pascual A. M., Naffakh M., Marco C., Ellis G., Gómez‐Fatou M. A., Prog. Mater. Sci. 2012, 57, 1106. [Google Scholar]
- 12.a) Frank S. J., Johansen M. J., Martirosyan K. S., Gagea M., Van Pelt C. S., Borne A., Carmazzi Y., Madden T., Int. J. Radiat. Oncol., Biol., Phys. 2013, 85, 1024; [DOI] [PMC free article] [PubMed] [Google Scholar]; b) Frank S. J., Stafford R. J., Bankson J. A., Li C., Swanson D. A., Kudchadker R. J., Martirosyan K. S., Int. J. Radiat. Oncol., Biol., Phys. 2008, 71, 5. [DOI] [PubMed] [Google Scholar]
- 13. Ravi A., Dubnitzky L., Easton H., in Emerging Technologies in Brachytherapy (Eds: Song W. Y., Tanderup K., Pieters B.), CRC Press, Taylor & Francis Group, Boca Raton, FL: 2017, p. 11. [Google Scholar]
- 14. Chang A. E., Karnell L. H., Menck H. R., Cancer 1998, 83, 1664. [DOI] [PubMed] [Google Scholar]
- 15. Shields C. L., Furuta M., Thangappan A., Nagori S., Mashayekhi A., Lally D. R., Kelly C. C., Rudich D. S., Nagori A. V., Wakade O. A., Arch. Ophthalmol. 2009, 127, 989. [DOI] [PubMed] [Google Scholar]
- 16.a) American Cancer Society , Official website of the american cancer society, a nationwide coluntary health organization dedicated to eliminating cancer www.cancer.org (accessed: December 2019);; b) Kaprealian T., Mishra K. K., Wang‐Chesebro A., Quivey J. M., in Handbook of Edidence‐Based Radiation Oncology (Eds: Hansen E. K., Roach M.), Springer‐Verlag, New York: 2010. [Google Scholar]
- 17. Singh A. D., Turell M. E., Topham A. K., Ophthalmology 2011, 118, 1881. [DOI] [PubMed] [Google Scholar]
- 18. Spagnolo F., Caltabiano G., Queirolo P., Cancer Treat. Rev. 2012, 38, 549. [DOI] [PubMed] [Google Scholar]
- 19. Aronow M. E., Topham A. K., Singh A. D., Ocul. Oncol. Pathol. 2018, 4, 145. [DOI] [PMC free article] [PubMed] [Google Scholar]
- 20.a) Laube T., Flühs D., Kessler C., Bornfeld N., Ophthalmology 2000, 107, 366; [DOI] [PubMed] [Google Scholar]; b) Chiu‐Tsao S. T., Astrahan M. A., Finger P. T., Followill D. S., Meigooni A. S., Melhus C. S., Mourtada F., Napolitano M. E., Nath R., Rivard M. J., Rogers D. W. O., Thomson R. M., Med. Phys. 2012, 39, 6161. [DOI] [PubMed] [Google Scholar]
- 21.a) Jampol L. M., Moy C. S., Murray T. G., Reynolds S. M., Albert D. M., Schachat A. P., Diddie K. R., R. E. Engstrom, Jr. , Finger P. T., Hovland K. R., Joffe L., Olsen K. R., Wells C. G., Ophthalmology 2002, 109, 2197; [DOI] [PubMed] [Google Scholar]; b) Jampol L., Moy C., Murray T., Reynolds S., Albert D., Schachat A., Diddie K., Engstrom R., Ophthalmology 2004, 111, 1514; [Google Scholar]; c) Aziz H. A., Al Zahrani Y. A., Bena J., Lorek B., Wilkinson A., Suh J., Singh A. D., Brit. J. Ophthalmol. 2017, 101, 747. [DOI] [PubMed] [Google Scholar]
- 22.a) Detorakis E. T., R. E. Engstrom, Jr. , Wallace R., Straatsma B. R., Ophthalmology 2005, 112, 505; [DOI] [PubMed] [Google Scholar]; b) Lumbroso‐Le Rouic L., Charif Chefchaouni M., Levy C., Plancher C., Dendale R., Asselain B., Solignac S., Mazai A., Desjardins L., Eye 2004, 18, 911; [DOI] [PubMed] [Google Scholar]; c) Puusaari I., Heikkonen J., Kivelä T., Ophthalmology 2004, 111, 1768; [DOI] [PubMed] [Google Scholar]; d) Wen J. C., Oliver S. C., McCannel T. A., Eye 2009, 23, 1254. [DOI] [PubMed] [Google Scholar]
- 23. Singh M., Durairaj P., Yeung J., Oncol. Ther. 2018, 6, 87. [DOI] [PMC free article] [PubMed] [Google Scholar]
- 24.a) Le B. H. A., Kim J. W., Deng H., Rayess N., Jennelle R. L., Zhou S. Y., Astrahan M. A., Berry J. L., Brachytherapy 2018, 17, 981; [DOI] [PMC free article] [PubMed] [Google Scholar]; b) Brewington B. Y., Shao Y. F., Davidorf F. H., Cebulla C. M., Clin. Ophthalmol. 2018, 12, 925. [DOI] [PMC free article] [PubMed] [Google Scholar]
- 25.a) Hashemi S., Aghamiri M. R., Kahani M., Jaberi R., Int. J. Nanomed. 2019, 14, 4157; [DOI] [PMC free article] [PubMed] [Google Scholar]; b) Cutsinger S. M., Forsman R., Corner S., Deufel C. L., Brachytherapy 2019, 18, 890; [DOI] [PubMed] [Google Scholar]; c) Pereira P. R., Odashiro A. N., Lim L. A., Miyamoto C., Blanco P. L., Odashiro M., Maloney S., De Souza D. F., Burnier M. N., Clin. Ophthalmol. 2013, 7, 1669. [DOI] [PMC free article] [PubMed] [Google Scholar]
- 26. Dean M. K., Studenski M. T., Paez‐Escamilla M. A., Walter S. D., Kwon D., Markoe A. M., Harbour J. W., Samuels S. E., Brachytherapy 2019, 18, 404. [DOI] [PubMed] [Google Scholar]
- 27. Chavan A., https://all3dp.com/2/3d‐printing‐brim‐when‐should‐you‐use‐it/ (accessed: August 2021).
- 28.Official website of the CloudCompare project, https://www.cloudcompare.org/ (accessed: May 2022).
- 29. Lindegaard J. C., Madsen M. L., Traberg A., Meisner B., Nielsen S. K., Tanderup K., Spejlborg H., Fokdal L. U., Nørrevang O., Radiother. Oncol. 2016, 118, 173. [DOI] [PubMed] [Google Scholar]
- 30. Insley B., Goldberg K., Beaulieu L., Ma Y., McKinley S., Hsu I. C., Cunha J. A., Brachytherapy 2022, 21, 229. [DOI] [PubMed] [Google Scholar]
- 31. Lancellotta V., Pagano S., Tagliaferri L., Piergentini M., Ricci A., Montecchiani S., Saldi S., Chierchini S., Cianetti S., Valentini V., J. Prosthet. Dent. 2019, 121, 690. [DOI] [PubMed] [Google Scholar]
- 32. Zhao Y., Moran K., Yewondwossen M., Allan J., Clarke S., Rajaraman M., Wilke D., Joseph P., Robar J. L., Med. Dosim. 2017, 42, 150. [DOI] [PubMed] [Google Scholar]
- 33. Park S. Y., Kang S., Park J. M., An H. J., Oh D. H., Kim J. I., Brachytherapy 2019, 18, 224. [DOI] [PubMed] [Google Scholar]
- 34. Aristei C., Lancellotta V., Piergentini M., Costantini G., Saldi S., Chierchini S., Cavalli A., Di Renzo L., Fiorucci O., Guasticchi M., Bini V., Ricci A., Brachytherapy 2019, 18, 57. [DOI] [PubMed] [Google Scholar]
- 35. Bekerman I., Gottlieb P., Vaiman M., J. Ophthalmol. 2014, 2014, 503645. [DOI] [PMC free article] [PubMed] [Google Scholar]
- 36. Niroomand‐Rad A., Chiu‐Tsao S. T., Grams M. P., Lewis D. F., Soares C. G., Van Battum L. J., Das I. J., Trichter S., Kissick M. W., Massillon‐JL G., Med. Phys. 2020, 47, 5986. [DOI] [PubMed] [Google Scholar]
- 37. Yoshioka Y., Itami J., Oguchi M., Nakano T., Brachytherapy Techniques and Evidences, Springer Singapore, Singapore: 2019. [Google Scholar]
Associated Data
This section collects any data citations, data availability statements, or supplementary materials included in this article.
Supplementary Materials
Supporting Information
Data Availability Statement
The data that support the findings of this study are available from the corresponding author upon reasonable request.