Abstract
The chemical bond is one of the most powerful, yet much debated concepts in chemistry, explaining property trends in solids. Recently, a novel type of chemical bonding was identified in several higher chalcogenides, characterized by a unique property portfolio, unconventional bond breaking, and sharing of about one electron between adjacent atoms. This metavalent bond is a fundamental type of bonding in solids, besides covalent, ionic, and metallic bonding, raising the pertinent question as to whether there is a well‐defined transition between metavalent and covalent bonds. Here, three different pseudo‐binary lines, namely, GeTe1− x Se x , Sb2Te3(1− x )Se3 x , and Bi2−2 x Sb2 x Se3, are studied, and a sudden change in several properties, including optical absorption ε2(ω), optical dielectric constant ε∞, Born effective charge Z*, electrical conductivity, as well as bond breaking behavior for a critical Se or Sb concentration, is evidenced. These findings provide a blueprint to experimentally explore the influence of metavalent bonding on attractive properties of phase‐change materials and thermoelectrics. Particularly important is its impact on optical properties, which can be tailored by the amount of electrons shared between adjacent atoms. This correlation can be used to design optoelectronic materials and to explore systematic changes in chemical bonding with stoichiometry and atomic arrangement.
Keywords: atom probe tomography, bond breaking, materials by design, metavalent bonding, phase‐change materials, property maps, thermoelectrics, topological insulators
Metavalent bonding in solids is shown to differ significantly from covalent bonding, as demonstrated by pronounced property changes for optical, vibrational, electronic, and structural properties upon the transition from covalent to metavalent bonding. This insight and the resulting map showing trends in chemical bonding and material properties can be used to design and tailor materials.
1. Introduction
The development of the periodic table of the elements by Mendeleev and Meyer more than 150 years ago revealed characteristic property trends if the elements are sorted accordingly.[ 1 , 2 ] Moving down a column in the periodic table frequently leads to a transition from a non‐metal to a metal. This can be nicely seen in the carbon group 14 of the periodic table, where the movement from C, Si (covalently bonded) to Ge, Sn, and Pb leads to a transition to a metallic ground state (Pb). Interestingly, a similar transition is also observed for the group 15 elements, i.e., the pnictogens, where P is covalently bonded, but Sb and Bi are (semi)‐metals. This raises questions concerning the nature of the transition from covalent (CB) to metallic bonding (MB). With this work we contribute to answering these questions by discussing the transition from the recently defined “metavalent bond”[ 3 ] to the covalent bond. The former is located between the metallic and the covalent bond, but has a portfolio of properties that differs significantly from both, which makes it rather unconventional. The groundwork for defining and understanding metavalent bonding (MVB) has already been laid.[ 3 ] It has been demonstrated that metavalently bonded solids are characterized by a unique combination of properties, including a pronounced anharmonicity (i.e., a large mode‐specific Grüneisen parameter (γi) of the optical phonons), moderate electrical conductivities (σ), effective coordination numbers (ECoN) incompatible with the traditional “8‐N” view of covalent bonding, a large chemical bond polarizability, leading to high values of the Born effective charge (Z*) as well as a large optical dielectric constant (ε∞).[ 4 ] Indeed, the idea of metavalent solids characterized by a unique set of properties has recently found further support from a quantum‐chemical bond analysis in conjunction with machine learning. Based on this approach, it was possible to discriminate between covalent, metavalent, and metallically bonded solids.[ 5 ] Metavalent materials are also characterized by an unusual bond rupture observed by atom probe tomography.[ 6 ] So far, experimental findings and arguments in favor of MVB have been reported for several sesquichalcogenides including Bi2Te3, Bi2Se3, and Sb2Te3, whereas Sb2Se3, Sb2Se3, and Bi2S3 were shown not to use MVB.[ 7 ] Similarly, monochalcogenides based on Ge, Sn, and Pb have been studied.[ 4 , 8 ] All three tellurides were identified as metavalent solids, while among the selenides and sulfides only PbSe and PbS showed MVB.[ 8 ] Furthermore, AgSbTe2 reveals MVB as can be seen from the position in the map, its bond rupture and the high Born effective charge and the large value of ε∞.[ 9 ] Upon applying pressure or temperature, several solids apparently show a transition to a denser, metavalently bonded phase, as shown explicitly for As2Se3.[ 10 ] It seems reasonable to assume that all monochalcogenides (i.e., SnSe, SnS, GeSe, and GeS) as well as all sesquichalcogenides, which did not show MVB at ambient conditions (Bi2S3, Sb2Se3, Sb2S3, As2S3) should show MVB at sufficiently large pressures. At the same time, it has also been demonstrated that for some compounds which possess MVB at ambient conditions, high pressures can destroy it.[ 11 ] In general, MVB should be possible, whenever two atoms are held together by a σ‐bond created by a single p‐electron. Such a situation is encountered also for halide perovskites, where the Sn—I and Pb—I bonds, respectively, also show the characteristic features of metavalent bonds.[ 12 ]
Quantum chemical calculations confirm the presence and stability of an unconventional type of bonding in solids, where about one electron is shared between adjacent atoms, leading to a bond order of about ½, which is in striking contrast to ordinary covalent bonding, where the bond order is about 1 and two electrons are shared between adjacent atoms.[ 9 ] All of these findings suggest a distinct nature of metavalent bonding. Nevertheless, it is critical to verify or refute this hypothesis through carefully designed experiments. Such experiments are not only needed to further substantiate the claims of a novel, fundamental type of bonding but also important to understand the relationship between applications of chalcogenides and similar solids in phase‐change memories, thermoelectrics, and photovoltaics and the prevailing bonding mechanism. Very recently, for example, it has been argued[ 13 ] that rhombohedral GeSe, which shows favorable thermoelectric properties use metavalent bonding, while the orthorhombic phase of GeSe does not. Such findings call for a systematic exploration of the transition between metavalent and covalent bonding. If metavalent bonding is a fundamental bonding mechanism in solids, distinctively different from covalent bonding, then one expects to find representative properties, where the transition between metavalent and covalent bonding is characterized by an abrupt property change. If metavalent bonding is instead a variant of covalent bonding, we expect to find a rather continuous change for all relevant properties. These different scenarios are depicted and discussed in the Supporting Information (Figure S1, Supporting Information). To answer this question, we explore the nature of the MVB‐CB transition in three different material systems: GeTe1− x Se x , Sb2Te3(1− x )Se3 x , and Bi2−2 x Sb2 x Se3.
2. Results and Discussion
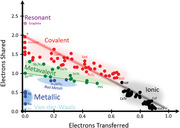
Figure 1 shows a quantum mechanical map, which is capable of distinguishing metallic, covalent, and ionic materials as shown previously.[ 9 ] The map is spanned by two coordinates which are determined from calculations based on the quantum theory of atoms in molecules (QTAIM):[ 14 ] the electron transfer (ET) and the number of electrons shared (ES) between pairs of adjacent atoms.[ 9 ] The electron transfer is determined by integrating the net charge density of an atom over its basin and subtracting the charge of the free reference atom.[ 15 ] The relative electron transfer is obtained upon dividing the total electron transfer by the most common oxidation state. The electron‐sharing is derived from the so‐called (de‐)localization indices.[ 16 ]
Figure 1.
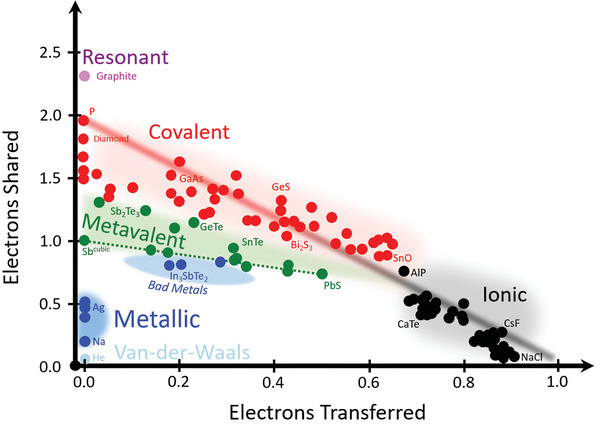
2D map classifying chemical bonding in solids. The map is spanned by the number of electrons shared between adjacent atoms and the electron transfer renormalized by the formal oxidation state. The dotted lines denote the three material systems studied here, i.e., the pseudo‐binary lines from GeTe to GeSe, from Sb2Te3 to Sb2Se3, and from Bi2Se3 to Sb2Se3. All three enable studying the nature of the transition from metavalent (green) to covalent (red) bonding. The nature of the transition can be captured by studying the (dis‐)continuity of the transition in the multidimensional property space. Metallic compounds can be located right below the dashed green line. Figure replotted and updated based on data presented in ref. [ 9 , 31 ].
These two coordinates allow to separate different types of chemical bonding in solids. Ionic materials are characterized by a significant relative electron transfer, typically larger than 0.5, but a rather modest sharing of electrons between adjacent atoms. Consequently, these materials are located in the lower right corner of the map. In covalent compounds, on the contrary, there is vanishing or only modest transfer of electrons between atoms, but up to two electrons (i.e., the classical electron pair defined by Lewis)[ 17 , 18 ] are shared between neighboring atoms. Metals finally are characterized by a small charge transfer but also only share a modest number of electrons between adjacent atoms, as the electrons are delocalized over several neighbors.
A number of physical properties have been identified as being characteristic for certain types of chemical bonds.[ 4 ] For MVB materials, these properties include a large optical dielectric constant ε∞, together with high Born effective charges (Z*).[ 19 ] The former is a measure for the electronic polarizability of the valence electrons, whereas the latter describes the chemical bond polarizability. The dielectric properties are thus characterized by a pronounced polarizability above and below the highest phonon frequency. Recently, it has also been demonstrated that pronounced changes in the imaginary part of the dielectric function ε2(ω) can be used to follow changes in chemical bonding.[ 20 ] Hence, it is interesting to follow changes in ε∞ as well as Z* together with ε2(ω) along the pseudo‐binary lines from GeTe to GeSe, Sb2Te3 to Sb2Se3, as well as Bi2Se3 to Sb2Se3 as these can be correlated with changes in chemical bonding. By studying solid solutions, we are able to tune the stoichiometry in minute steps. This is mandatory to explore the nature of the transition between covalent and metavalent bonding.
To determine ε∞, one of the properties to characterize bonding, a sequence of Fourier transform infrared (FTIR) spectra has been recorded for GeTe1− x Se x thin films. As shown in Figure S2 (Supporting Information), X‐ray diffraction (XRD) measurements of compounds along the pseudo‐binary line between GeTe and GeSe reveal three different crystallographic phases (rhombohedral, hexagonal, and orthorhombic). The linear decrease of the cell volume as a function of stoichiometry is displayed in Figure S3 (Supporting Information), which is strong evidence for the good miscibility of GeTe and GeSe, consistent with previous studies of bulk alloys.[ 21 , 22 ] From the measured reflectance and transmittance spectra, the dielectric function is determined. The resulting optical dielectric constant ε∞, which is the value of the dielectric function above the highest phonon frequency, is shown in Figure 2 .
Figure 2.
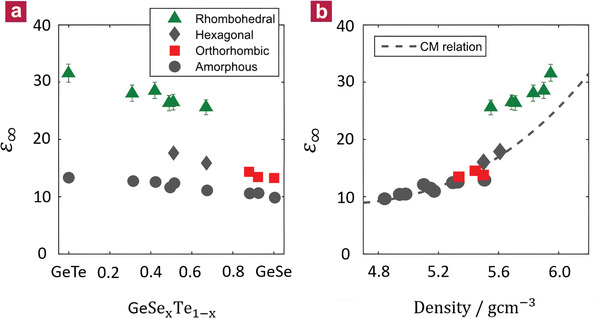
Optical dielectric constant ε∞ along the pseudo‐binary line between GeTe and GeSe. a) ε∞ as a function of stoichiometry. The rhombohedral phase, found up to 70% Se, is characterized by large values of ε∞, which exceed the value of the corresponding amorphous phases by more than 100%. Between 50% and 70% Se content the rhombohedral phase is metastable and transforms into a hexagonal phase upon further heating. This transition is accompanied by a pronounced drop in ε∞. b) ε∞ plotted as a function of density. The data for the amorphous, orthorhombic, and hexagonal phase follow the Clausius–Mossotti (CM) relation (dashed line), which relates ε∞ and the mass density of the material. Only the rhombohedral phase shows an excess of the electronic polarizability and hence ε∞, characteristic for metavalent bonding.
Two findings are striking in this figure. A pronounced difference between the amorphous and crystalline phase is only observed for the Te‐rich, rhombohedral phase. Furthermore, upon the transition from the rhombohedral to the hexagonal and the orthorhombic crystalline phase, a sudden drop in ε∞ is found. To derive electronic polarizabilities, which are indicative for the bonding mechanism, the density of the solid has to be taken into account, as expressed by the Clausius–Mossotti relation.[ 23 ] X‐ray reflectometry (XRR) was used to rule out a discontinuous change of the mass density owing to the different atomic arrangement in the rhombohedral and hexagonal/orthorhombic phases. The density smoothly decreases with increasing concentration of GeSe (Figure S4, Supporting Information). A plot of ε∞ versus the mass density is displayed in Figure 2b. The dashed line represents a least‐squares fit considering only the covalently bonded systems (amorphous, hexagonal, and orthorhombic phases) using one set of atomic electronic polarizabilities (cf. the Supporting Information). All these compounds follow the Clausius–Mossotti relation.[ 23 ] On the contrary, all compounds with a rhombohedral crystal structure show an excess in ε∞, which cannot be explained by their higher density. Instead, the rhombohedral samples possess an additional electronic polarizability, which is attributed to a change in bonding. Yet, we still need to explore how this change of bonding is related to changes of atomic arrangement, i.e., the crystallographic structure. This is depicted in the Supporting Information, where both XRD and Raman spectra are displayed (Figures S2 and S5, Supporting Information).
As shown there, the sudden drop in electronic polarizability is also accompanied by the transition from the rhombohedral to the hexagonal phase, with a concomitant change of the vibrational properties (as seen in the corresponding Raman spectra). The atomic arrangement hence differs significantly for the three crystallographic phases.
To establish that this discontinuity of the electronic polarizability between metavalent and covalent bonding in the GeTe–GeSe system is a more generic feature, the pseudo‐binary lines from Sb2Te3 to Sb2Se3 and from Bi2Se3 to Sb2Se3 have been studied, too. Sb2Te3 is a prominent constituent of many phase‐change materials, exhibits good thermoelectric properties,[ 24 ] and shows properties typical for topological insulators.[ 25 ] Sb2Te3 also has the characteristic features of MVB such as a high value for ε∞ [ 26 ] and a slightly distorted octahedral arrangement.[ 7 , 27 ] By contrast, Sb2Se3 features an orthorhombic atomic arrangement (cf. Figure S6, Supporting Information), comparable to GeSe.[ 28 ] This crystalline compound is characterized by a small value of ε∞, which is barely larger than the value found in the amorphous phase. Hence, in this material no metavalent bonds are formed.[ 7 ] This is in line with a previous theoretical study, which found the nearest‐neighbour bonds in orthorhombic GeSe and Sb2Se3 to be stiff, strong, and covalent in their behavior.[ 29 ] Thus, both lack the typical fingerprints of metavalently bonded materials. Therefore, the pseudo‐binary line from Sb2Te3 to Sb2Se3 also allows investigating how MVB collapses. As discussed for the GeTe–GeSe system, we observe a good miscibility of Sb2Te3 and Sb2Se3, as evidenced by the steady shift of XRD reflection positions with composition (cf. Figures S6 and S7, Supporting Information). The comprehensive changes of XRD patterns, XRR densities (cf. Figure S8, Supporting Information), and Raman spectra (cf. Figure S9, Supporting Information) upon alloying Sb2Te3 with Sb2Se3 are presented and discussed in the Supporting Information. Figure 3 displays the optical dielectric constant for various Sb2Se3 x Te3(1− x ) compounds.
Figure 3.
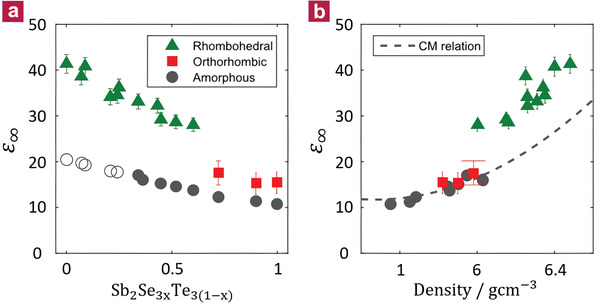
Optical dielectric constant ε∞ along the pseudo‐binary line between Sb2Te3 and Sb2Se3. a) ε∞ as a function of stoichiometry. As for the GeTe1− x Se x system, the optical dielectric constant ε∞ of the crystalline phase is much higher than the corresponding amorphous state. The transition from the rhombohedral to the orthorhombic phase is accompanied by an abrupt drop in ε∞, indicative of a sudden breakdown of metavalent bonding. Samples with an Sb2Se3 content of less than 30% are already (partially) crystalline after deposition. Hence, values for ε∞ of these amorphous samples were extrapolated (open circles). b) The Clausius–Mossotti plot of ε∞ versus the mass density confirms that the rapid drop of ε∞ is not caused by a change of the mass density.
Again, two findings are noteworthy. A pronounced difference between the amorphous and crystalline phase is only observed for the Te‐rich, rhombohedral phase. Upon the transition from the rhombohedral to the orthorhombic crystalline phase, a sudden drop in ε∞ is found. XRR measurements were performed to confirm that this jump of ε∞ at the transition is not because of a discontinuous change of the mass density. The density was found to decrease smoothly moving toward Sb2Se3 (see the Supporting Information). The optical dielectric constants are displayed in Figure 3b as a function of the density. All iono‐covalent compounds can be described well by the Clausius–Mossotti relation with a single set of bond polarizabilities (dashed line) as depicted in Figure 2. Yet, this relation fails to describe the Sb2Te3‐rich materials that develop MVB. As for the GeTe–GeSe line, the rhombohedral samples of Sb2Se3 x Te3(1− x ) possess an additional polarizability that arises from the creation of metavalent bonds upon crystallization. Hence, for both pseudo‐binary lines, where substitutions were made on the anion sublattice, a sudden change of the optical dielectric constant ε∞ is observed, which is indicative of a discontinuous change in bonding.
Yet, the Raman spectra depicted in the Supporting Information also reveal that the atomic arrangement changes suddenly at the transition. Hence, from these results alone, it is not obvious if the discontinuous changes depicted in Figures 2 and 3 are caused by differences in atomic arrangement, differences in bonding or both. However, further data presented below provide a clear answer. The change of the vibrational properties can also be observed in FTIR spectra recorded in the far‐infrared down to 20 cm−1 (2.5 meV). This is displayed in Figure 4 , where a striking difference in the frequency and intensity of the phonon modes is shown.
Figure 4.
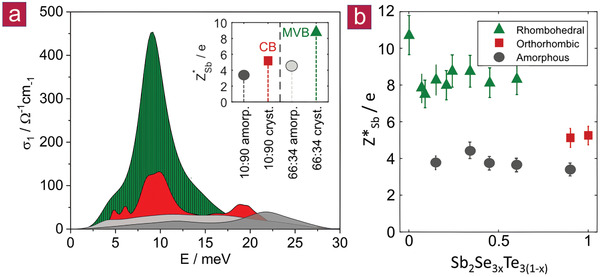
Born effective charge (Z*) of different Sb2Se3 x Te3(1− x ) compounds. a) Optical conductivity σ1 of four different samples up to 40 meV, the range typical for optical phonons in higher chalcogenides. The integral of the curves represents the phonon spectral weight, which is linked to the Born effective charge (Z*) (see the Supporting Information). The spectral weights of the amorphous phases of Sb2Se1.98Te1.02 (shown in light gray and denoted as 66:34) and Sb2Se2.7Te0.3 (dark gray, 90:10) do not differ significantly. Upon crystallization, a major increase of spectral weight is only found for Sb2Se1.98Te1.02. This pronounced increase is directly related to a concomitant increase of the Born effective charge (Z*). Note that the electronic background was subtracted for the conducting samples. b) Born effective charge (Z*) for Sb in Sb2Se3 x Te3(1− x ). For all amorphous phases, values of Z*Sb around 4 are observed, independent of stoichiometry. The orthorhombic samples only show a slight increase of Z*Sb upon crystallization. On the contrary, the rhombohedral compounds are characterized by significantly higher values of 8–10. The simultaneous increase of Z*Sb and ε∞ upon the formation of the rhombohedral phase is clear evidence for metavalent bonding and can be used as a fingerprint for its identification.
The rhombohedral samples show significantly stronger phonon modes, which can be ascribed to the high value of the Born effective charge (Z*), which characterizes the chemical bond polarizability in these compounds.[ 19 ] A large increase of Z* upon crystallization is observed for all rhombohedral compounds. This is different in the orthorhombic systems where only a small increase of Z* can be observed. Hence, the extraordinarily high values for Z* in the rhombohedral phase and the sudden drop upon the transition to the orthorhombic phase provide further evidence that the rhombohedral phase is governed by MVB in contrast to the conventional iono‐covalent bonding in the orthorhombic materials.
Finally, we have investigated a third pseudo‐binary line, i.e., Bi2Se3–Sb2Se3. The corresponding data are presented and discussed in the Supporting Information (cf. Figures S11–S16, Supporting Information). Here, again a similar scenario unfolds upon replacing Bi by Sb. It is noteworthy, that MVB collapses regardless of whether substitutions are made on the cation or anion sublattice. The optical dielectric constant decreases significantly and the Raman spectra show a distinct change going from rhombohedral Bi2Se3 to orthorhombic Sb2Se3. These changes are accompanied by changes in the XRD patterns, indicative of distinct differences in atomic arrangement. A slight compositional broadening of the transition was found owing to the miscibility gap in the Bi2Se3–Sb2Se3 phase diagram. Interestingly, such miscibility gaps are often observed in phase diagrams when very similar chalcogenides are mixed, which use different bonding mechanisms (i.e., metavalent and covalent bonding).
From these three cases, we can conclude that the collapse of metavalent bonding is accompanied by a sudden drop of the optical dielectric constant ε∞ and the Born effective charge (Z*). To confirm that the discontinuous property changes are indeed because of changes in bonding, systematic studies of bond breaking for the GeTe–GeSe pseudo‐binary have been performed using atom probe tomography (APT), as depicted in Figures S17 and S18 (Supporting Information). A detailed discussion concerning APT and bond breaking can be found in the Supporting Information and in previous publications.[ 6 , 20 ] Our data show that the transition from rhombohedral GeTe1− x Se x to hexagonal GeTe1− x Se x and orthorhombic GeSe is accompanied by a discontinuous change in the probability of multiple events (i.e., bond breaking). While the latter two phases show a bond breaking pattern, which closely resembles the one for covalent bonding, the rhombohedral phase of GeTe1− x Se x is characterized by an unconventional bond rupture, where each successful laser pulse dislodges several fragments with a high probability. As atom probe tomography probes bond breaking rather than differences in atomic arrangement, this difference in bond rupture must be related to differences in bonding.[ 6 ] The discontinuous change of the optical dielectric constants upon the transition from the rhombohedral to the hexagonal/orthorhombic phase thus indeed coincides with a change of bond type.
In the remainder of this paper, we will discuss what is the best way to describe and explain this change in chemical bonding. To this end, Figure 5 shows data obtained from optical spectroscopy. Details concerning data collection and fitting can be found in the Experimental Section and the Supporting Information. In Figure 5a,b, reflectance data are shown for amorphous and crystalline GeTe1− x Se x from 1.1 to 5.9 eV. For the amorphous sample series only a modest and rather continuous change in reflectance is observed. For the crystalline sample on the contrary, the reflectance maxima are significantly decreasing in amplitude. Interestingly, the reflectance even decreases significantly upon the transition from the rhombohedral (r) to the hexagonal (h) phase of GeTe1− x Se x compounds with identical stoichiometry as exemplified for the GeTe0.4Se0.6 stoichiometry in Figure 5. This implies that the corresponding valence and conduction band states, which determine the shape of the dielectric function (details can be found in the Supporting Information) in the energy range up to 4 eV must change systematically with stoichiometry and structure. In contrast, much smaller changes occur for the amorphous series. This conclusion is supported by the imaginary parts of the dielectric functions (cf. Figure 5c,d), which fit the measured optical data. For the crystalline series a significant decrease of the height of the maximum of ε2(ω) is found upon increasing Se content, accompanied by a concomitant increase of the position of this maximum. Especially noteworthy is the drop of the height of the maximum of ε2(ω) for crystalline samples with identical stoichiometry but different atomic arrangement. On the contrary, for the amorphous series only a marginal change of the imaginary part of the dielectric function is observed. This indicates that there are much more pronounced changes in the nature of the valence and conduction band states for the crystalline than the amorphous sample series. The occupied and empty states directly below and above the Fermi level are predominantly attributed to p‐electrons, which form σ‐bonds (cf. Figure 6 ).[ 3 , 30 ]
Figure 5.
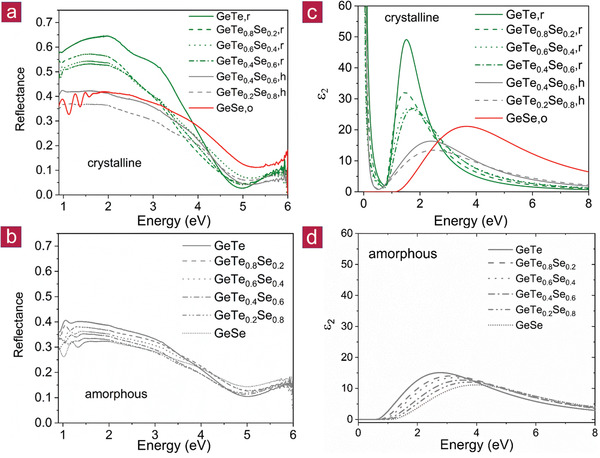
a,b) Reflectance data for crystalline (a) and amorphous (b) GeTe1− x Se x as well as c,d) the resulting imaginary part of the dielectric function ε2(ω) of crystalline (c) and amorphous (d) GeTe1− x Se x . For the amorphous GeTe1− x Se x series only very small continuous changes are observed upon increasing Se content for the reflectance. On the contrary, pronounced changes and a discontinuous jump in the reflectance are observed for crystalline GeTe1− x Se x . These changes can be attributed to changes in the imaginary part of the dielectric function ε2(ω), in particular the height and position of its maximum. The pronounced and discontinuous change for the crystalline samples can be explained with the transition from metavalent to covalent bonding.
Figure 6.
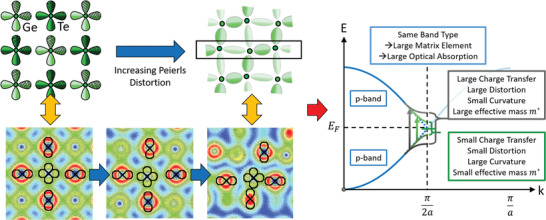
Illustration of the bond formation in GeTe and the resulting band structure. Atomic orbitals of Ge and Te responsible for bond formation in GeTe are depicted on the left. σ‐bonds are formed from p‐orbitals, which are occupied by about half an electron pair (ES ≈ 1), resulting in a metallic band (blue curves on the right side of the figure). However, moderate charge transfer and significant electron sharing result in a small bandgap. When alloying GeTe with Se, the degree of electron sharing significantly increases (cf. Figure 1), resulting in an increased Peierls distortion, which can be verified experimentally (cf. Figure 5). Top part on left‐hand side: Adapted with permission.[ 31 ] Copyright 2020, The Authors, published by Wiley‐VCH. On the bottom, from left to right, valence charge density plots for GeTe in the cubic, rhombohedral (equilibrium), and orthorhombic phases. The central atom is Ge. Same color scale ranges and isolines values for all phases. The alignment of the p orbitals and extent of the Peierls distortion is linked to the existence of MVB. In the orthorhombic phase, the loss of orbital alignment and large Peierls distortion ratios in the y‐direction of the figure is triggering the disappearance of MVB. The projection plane is defined by a Ge–Te–Te triplet of atoms (other atoms are thus out of‐plane for the rhombohedral and orthorhombic phases).
All materials studied here are isoelectronic to GeTe, i.e., they have on average three p‐electrons per lattice site. GeTe and all other compounds on the pseudo‐binary line between GeTe and GeSe have six valence p‐electrons, which form σ‐bonds. For an octahedral arrangement, these p‐orbitals are perfectly aligned. In this case there is only a small bandgap owing to the modest charge transfer between Ge and Te as already previously noted. Yet, this situation has a pronounced consequence for the matrix element for the optical transition. The perfect octahedral arrangement leads to a large overlap of the wave functions of the initial and final state and hence a large matrix element for the optical transition. This is depicted in Figure 7 .
Figure 7.
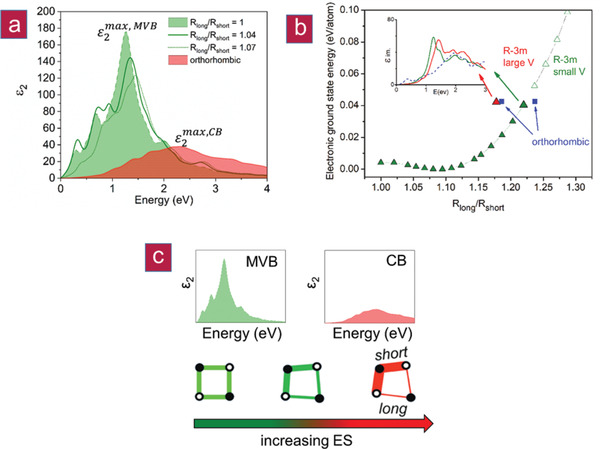
Theoretical ε2(ω) as a function of the Peierls Distortion (i.e., R long/R short). a) Optical absorption (ε2(ω)) as a function of the degree of the R long/R short ratio for rhombohedral GeTe (green) and orthorhombic GeTe (red), confirming the experimental findings of a discontinuous transition from MVB to CB; b) electronic ground state energy as a function of the R long/R short ratio. The optimized orthorhombic phase is anisotropic, with two different Peierls distortion ratios. At comparable cohesive energy, one can find two rhombohedral phases with different volumes (larger triangles). These rhombohedral phases differ by less than 2 meV per atom in energy, but vary by more than 5% in volume, an absorption peak shifted by about 0.2 eV (inset) and a decreased dielectric constant for the larger volume structure. c) A scheme demonstrating the effect of increasing ES on the R long/R short ratio and on ε2(ω). These findings confirm the discontinuous character of the MVB‐CB border.
In GeTe, the large values of ε2 max have been attributed to the alignment of the p‐orbitals of adjacent atoms, i.e., a weak Peierls distortion.[ 31 , 32 ] For the GeTe1− x Se x series (cf. Figure 5), a decreasing amplitude and increasing energy of ε2 max are observed. This finding can be reproduced, if we calculate the optical properties of crystalline GeTe as a function of an increasing Peierls distortion (i.e., the R long/R short ratio), which also decreases the p‐orbital alignment (cf. Figure 7). The increasing Peierls distortion leads to an increase of charge accumulation in the shorter bonds.[ 33 ] The concomitant decrease in p‐orbital alignment is visible in the changes of the matrix element shown in Figure 8 . For R long/R short ratios in the range from 1.15 to 1.20, several structures are energetically almost identical, yet have different atomic densities and symmetries. This can explain the abrupt change in properties measured for the GeTe1− x Se x series. Upon increasing the Peierls distortion, the number of electrons shared between adjacent atoms increases, while the effective coordination number decreases. The number of electrons transferred between Ge and Te is almost not altered. Hence, Figure 7 shows the impact of the Peierls distortion (i.e., changes in ES alone) on ε2 max. These findings confirm that an increasing Peierls distortion decreases the magnitude and increases the energy of ε2 max and that the transition from metavalent to covalent bonding is discontinuous, strengthening our hypothesis that the metavalent bond is a new, fundamental bonding type in solids. This is also confirmed by results shown in Figure 8, where the matrix element (ME) and the joint density of states (JDOS) are shown for different degrees of Peierls distortion. Clear differences in the matrix element are visible when comparing MVB (cf. Figure 8a,b) and CB (cf. Figure 8c,d), i.e., p‐orbital overlap is distinctly different. It is noteworthy that changes in the joint density of states are subtle compared to changes in the matrix element, i.e., the changes in optical absorption shown in Figure 7 are predominantly governed by chemical bonding.
Figure 8.
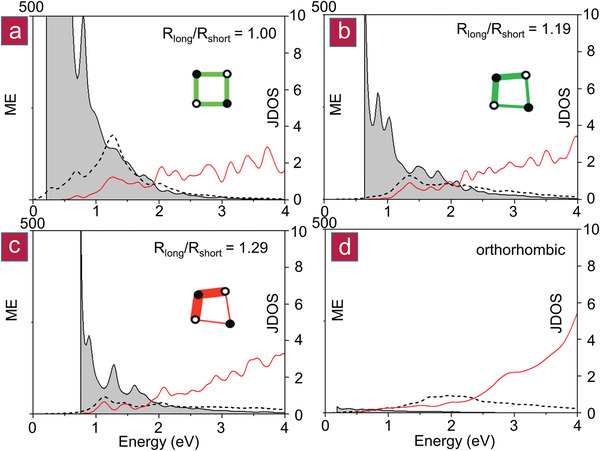
Matrix element (ME) and joint density of states (JDOS). An increase in ES (i.e., in R long/R short) results in significant changes in the matrix element (i.e., in p‐orbital overlap) shown in gray, while the joint density (red curves) remains similar within the same crystal system. This figure shows clear differences between metavalent (a,b) and covalent (c,d) systems. ε2(ω) is shown as black dotted lines.
Hence, this work demonstrates that chemical bonding in solids can be controlled by both the strength of the Peierls distortion (i.e., the R long/R short ratio) and the concomitant p‐orbital alignment, which can be described by the chemical bond descriptor ES. However, chemical bonding can also be controlled by the charge transfer between adjacent atoms in a perfect octahedral atomic arrangement, characterized by the chemical bond descriptor ET.[ 31 ] For PbX (X = Te, Se, S), there is no Peierls distortion and all three higher lead mono chalcogenides crystallize in the rock salt structure, i.e., a perfect octahedral arrangement. These lead chalcogenides show an increasing ET from PbTe, to PbSe and finally PbS, which causes a decrease of the amplitude and an increase of the energy of ε2 max, related to changes in the matrix element.[ 31 ] The number of ES and ET between adjacent atoms can therefore be viewed as the natural variables to describe chemical bonding in solids.
Regarding the starting hypothesis of this work, the answer is clear. Our findings demonstrate unequivocally that there is a distinct border between metavalent and covalent bonding (cf. Figure 1), regardless whether substitution is performed on the (formal) anion or cation sublattice. This inference immediately raises several interesting questions: Is there a link between metavalent bonding in solids and unconventional bonding mechanisms reported for molecules? Heated debates about the nature of chemical bonds have accompanied the development of quantum mechanics.[ 34 , 35 ] Initially, the discussions focused on bonding in molecules. In recent decades, compelling evidence has been presented for unconventional bonding mechanisms in molecules where concepts such as charge shift bonding,[ 36 ] hypervalent bonding[ 37 ] or 3 center–2 electron (3c–2e) bonding[ 38 ] have been proposed. It is hence interesting to look for similarities between metavalent bonding in solids and these unconventional bonds in molecules. However, it is also obvious that MVB differs significantly from those molecular bonds. So far, to our knowledge, these unconventional molecular bonds have not been related to unique measurable properties of molecules, while the concepts presented here have been developed to provide new design strategies for solids. Furthermore, the unconventional bonds in molecules are usually discussed as a sub‐group of covalent bonds. A discontinuous transition between, e.g., covalent bonding and charge‐shift bonding, for example, has not been reported to our knowledge, while compelling evidence has been presented demonstrating the discontinuous nature of the transition between metavalent and covalent bonding in solids. This transition raises further interesting questions and provides opportunities for systematic materials design. One can wonder, for example, how the border between metavalent and metallic bonding as well as ionic bonding[ 31 ] looks like? Metavalent bonding is characterized by the competition between electron delocalization (as in metallic bonding) and electron localization (as in ionic and covalent bonding). Further support for this claim comes from transport data summarized in Figure 9 for the Sb2Se3 x Te3(1− x ) system, which reveal that the room temperature conductivity of the metavalently bonded materials in this series are all located in a narrow range of about 103±1 S cm−1, while the covalently bonded materials have a significantly lower electrical conductivity at room temperature.
Figure 9.
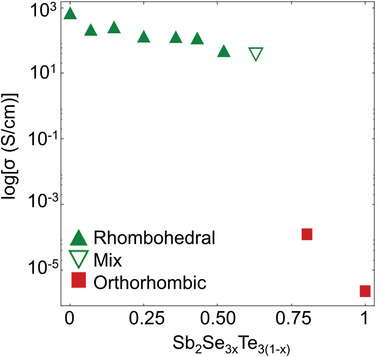
Electrical conductivity of Sb2Se3 x Te3(1− x ) system. At the border between metavalent and covalent bonding the electrical conductivity drops by several orders of magnitude, indicative of a strong increase in charge carrier localization.
Once the system transitions from metavalent to covalent, the electrical conductivity sharply decreases by 4–6 orders of magnitude. Hence, a low‐temperature transition from insulating to metallic behavior can be expected, if the border between metavalent and metallic bonding is crossed. For these materials electron correlations are weak, as the static dielectric constant is very large.[ 39 ] Hence, this border provides the fascinating opportunity to investigate the nature of the metal–insulator transition without pronounced electron correlation.
3. Conclusion
Exploring the borders of metavalent bonding is not only interesting for fundamental questions related to the nature of chemical bonding in solids and its relationship to characteristic properties. It also provides a clear understanding for which range of materials a portfolio of attractive properties for specific applications can be expected. One example is the recent investigation of In3SbTe2 for photonic applications in the NIR, which demonstrates the potential of such materials. In3SbTe2 shows the characteristic property portfolio of phase‐change materials. There is, for example, a significant change of optical properties upon crystallizing this compound. While amorphous samples show the characteristic features of covalently bonded materials, the crystalline phase has a high electrical conductivity and shows a Drude‐like reflectance in the NIR.[ 40 ] In the map of Figure 1, this material has an ES value which locates this material below the dashed line, which is apparently the borderline for MVB compounds. Below this line, unconventional metals are found. Typical phase‐change materials like GeTe and Ge2Sb2Te5, on the contrary, are characterized by larger ES values. Hence, one can ponder if the map in Figure 1 can be used to tailor phase‐change materials. This question was recently answered in the affirmative.[ 41 ] By studying the effect of iso‐electronic element replacement, i.e., replacing Te by Se, or replacing Ge by Sn the crystallization speed could be altered by a factor of 106! This pronounced change in kinetics can be attributed to significant changes of bonding.
Finally, it has recently been shown that good thermoelectrics based on monochalcogenides can be found for those materials, which possess the characteristics of metavalent bonding, while the covalently bonded materials showed a by far inferior performance.[ 13 , 42 , 43 ] The improvement of the thermoelectric properties can be partly attributed to an improvement of electronic properties, related to the unique band structure of the metavalently bonded materials, which leads to a sudden jump of the power factor upon the transition from covalent to metavalent bonding[ 42 , 43 ] Yet, also the thermal properties are superior for the metavalent solids, which are characterized by soft, anharmonic bonds, which reduce the thermal conductivity[ 3 , 44 ] The low frequency of transverse optical modes can be attributed to the fact that the longitudinal optical modes already have a relatively low frequency, as the bond order between adjacent atoms is ½ (ES ≈ 1) and the masses of the atoms involved are large. The transverse optical modes are even significantly lower in frequency, as the Born effective charges of the atoms are large,[ 3 ] leading to a strong increase of the static dielectric constant εst over the optical dielectric constant ε∞ and hence low‐frequency transverse optical modes. This can be seen from the Lydanne–Sachs–Teller relationship[ 45 ] which links the frequencies of transverse and longitudinal optical modes to the ratio of ε∞ and εst.
In this context, the sharp transition from metavalent to covalent bonding discussed here as well as previous work on the transition between metavalent and iono‐covalent bonding[ 31 ] provides a blueprint to tailor the property portfolio relevant for phase‐change materials and thermoelectrics based on the two natural variables for chemical bonding, the electrons shared, and transferred between adjacent atoms.
4. Experimental Section
Sample Preparation
To prepare FTIR samples, a 150 nm Al layer was deposited onto a glass substrate. Alternatively, Si 〈100〉 was used as a substrate. Subsequently, the films to be investigated (thickness 400–800 nm) are deposited. DC and RF magnetron sputtering were used for film deposition (background pressure 2 × 10⁻⁶ mbar, 20 sccm argon as sputter gas). Stoichiometric targets of Al, GeTe, GeSe, Sb2Te3, Sb2Se3, and Bi2Se3 and (ZnS)80:(SiO2)20 (purity 99.99%) were used as sputter targets. To adjust the stoichiometry, the sputter power of the corresponding targets was adjusted. Films for far‐infrared FTIR measurements were prepared on double‐side polished Si 〈100〉 substrates (ρ > 5000 mΩ cm) that were subsequently cleaned in acetone, isopropyl alcohol, and distilled water within an ultrasonic bath. Raman samples were prepared on boron‐doped, single‐side‐polished Si 〈100〉 substrates. Ellipsometry and reflectance samples were prepared on phosphorus‐doped single‐side‐polished Si 〈100〉 substrates, and they were additionally capped with 9 nm of (ZnS)80:(SiO2)20 to mitigate evaporation of Se during crystallization. For all capped samples an additional reference sample with just the capping layer was prepared during the same sputter run to estimate its influence on the measurements.
The as‐deposited amorphous films were crystallized in an argon atmosphere. The film structure was verified by X‐ray diffraction, while the film densities were determined using X‐ray reflectivity measurements. The film thickness was determined on reference samples prepared in the same sputter session using a Bruker DekTak profilometer. Several thickness values were taken at different positions and their average values were used as a reference for the optical simulations.
Optical Measurements
Reflectance measurements shown in Figure 5 were performed in an Avantes AvaSpec‐ULS2048CL‐EVO spectrometer at normal incidence over a spectral range of 1.1 eV (9.100 cm−1) to 5.9 eV (47.000 cm−1) using an aluminum mirror as a reference. Measurements in the visible range (i.e., from 9.000 to 18.000 cm−1) were performed using a Bruker Vertex 80v Fourier‐transform spectrometer to increase data quality. Reflectance spectra in the range from 50 meV (400 cm−1) to 1 eV (8.000 cm−1) were measured, using a Bruker IFS 66v/s spectrometer with a resolution of 0.24 meV using a globar source. The reflectance spectra of an Al mirror reference and the sample were measured subsequently to exclude drift effects. For normalization, the final spectrum was obtained by dividing the measured spectrum by the reference. The angle of incidence of the incoming beam was kept constant at 10° with respect to the surface normal. The relative measurement error for the reflectance is 0.2% in the wavelength range measured.
Transmission data were recorded from 2.5 meV (20 cm−1) to 1.5 eV (12.000 cm−1), the Si bandgap prevented to go higher. The response of the bare substrates was also recorded. The data were collected in a Bruker IFS66/v spectrometer. To cover the whole spectral range, a 4K bolometer, far‐ and mid‐infrared DLTGS detectors, a liquid nitrogen cooled InSb photoconductor, and a Si photodiode in combination with Hg‐arc, globar, and tungsten lamps were used. Three beam splitters, Ge on Mylar, Ge on KBr, and Quartz, were used. As the films and substrate have optical quality parallel surfaces, Fabry–Pérot interferences were clearly discernible in these data. A spectral resolution of 5 cm−1 which washes out the interference fringes of the substrate, while preserving phonon spectral signatures of the film, was chosen. For an anisotropic system, the quantities ε∞ and Z* are described by tensors. However, the XRD measurements clearly reveal that all samples are polycrystalline and do not exhibit a pronounced texture. Hence, the measured values for ε∞ and Z* correspond to an average over all crystallographic orientations.
Raman measurements were carried out using a WITec alpha300 R confocal Raman microscope with a 532 nm laser. The measurements were performed at room temperature under ambient condition using a 50× objective. The resulting spot size was around 400 nm. All spectra were recorded using a grating with 1800 lines mm−1 and a resolution of around 1 cm−1. Owing to the low heat conductance and a low melting point of the films a laser power of 100 µW was used. All measurements were taken at different spots on the sample to evaluate the spatial variation of the Raman signal.
To verify the stoichiometry, X‐ray spectroscopy (EDX) was performed. A FEI Helios 650 NanoLab system was used to obtain the EDX data. The AZtec 2.1 software was used for data analysis. The electron beam was operated at 10 keV and 0.4 nA on a 200 × 300 µm area and was calibrated with a copper sample prior to measurement.
Modeling of the Spectra
The infrared response of a material was fully characterized by its frequency‐dependent dielectric function ε(ω), which is a linear superposition of different excitations. For the materials the following equation was used
| (1) |
Besides a constant high frequency contribution, ε(ω) also has a Drude[ 46 ] term for mobile carriers, a Tauc–Lorentz[ 47 , 48 ] model for the interband gap, and harmonic Lorentz oscillators[ 46 ] for localized polar excitations, such as phonons.
The reflectance spectra were analyzed in the range from 50 meV to 3 eV using the SCOUT software. A layer stack consisting of a thin film (500–800 nm)/Al mirror (150 nm)/glass substrate (500 µm) was simulated, with the dielectric function of aluminum taken from a database. The latter was checked to be in excellent agreement with the optical properties of a reference specimen, the Al coating. The film thickness of the semiconductor was fitted within the confidence interval of the DekTak profilometer. The optical dielectric constant was determined from the dielectric function as ε∞ = ε1 (0.05 eV), after subtracting the Drude contribution, when necessary.
Transmission from 3 meV to 1.5 eV in thin films was analyzed with a custom‐made software considering a thin film over a silicon substrate stack. Coherent light propagation was assumed in the film and, because of the choice of spectral resolution, incoherent propagation in the substrate. Both bare substrate and stack were modeled with the dielectric function described above. This gives a very good but not perfect description of the system transmittance. However, tiny deviations between data and fit indicate that excitations in the film and, to a lesser extent also in the substrate, do not follow exactly the dielectric function models mentioned above. These models exclude, for instance, phonon anharmonic effects. A model independent refinement to the data can be achieved by a variational correction to the dielectric function as proposed by Kuzmenko,[ 49 ] which gives results with an accuracy equivalent to Kramers–Kronig. It is particularly useful for these data as the inversion of the transmission and its Kramers–Kronig calculated phase in multilayer systems is numerically unstable. The implementation chosen for this variational approach is described in ref. [ 50 ].
Computational Details
All theoretical calculations in this paper were performed using density functional theory as implemented in the Vienna Ab initio Simulation Package (VASP).[ 51 , 52 , 53 , 54 ] The electronic structure was computed using PAW potentials[ 55 ] with Ge (4s, 4p) and Te (5s, 5p) electrons treated as valence electrons. The exchange‐correlation was computed using the PBEsol functional[ 56 ] and the plane waves basis was expanded up to a 520 eV kinetic energy cutoff. The Brillouin zone was sampled with 14 × 14 × 14 k‐points for the rhombohedral (R‐3m) phase and 12 × 8 × 12 k‐points for the orthorhombic (Pnma) phase. The dielectric functions were computed using Fermi's golden rule and a sum over states close to the Fermi level (5/14 and 20/28 valence/conduction states for the R‐3m and the Pnma phases, respectively). All structures were relaxed (maximal residual force lower than 1 × 10⁻⁴ eV Å−1) keeping the following constraints. For the rhombohedral phase, the R long/R short ratio was imposed, whereas for the Pnma phase the atoms were only allowed to move along one of the cell vectors at once.
The total energy of the relaxed Pnma phase is 55 meV/atom higher than the equilibrium R‐3m structure and equal to the R‐3m structure for which the Peierls distortion ratio is about 1.22.
Conflict of Interest
The authors declare no conflict of interest.
Author Contributions
L.G., S.J., and A.v.H. contributed equally to this work. L.G., S.J., and A.v.H. produced most samples and characterized them by XRD, XRR, and FTIR. A.P. and A.P. studied GeSe, S.J. and A.v.H. studied the GeTe–GeSe and Sb2Te3–Sb2Se3 series, whereas L.G. and S.M. studied the Bi2Se3–Sb2Se3 series. Data for Figure 5 were produced by C.T., S.W., Y.Z., and R.P.S.M.L. characterized the low‐frequency FTIR spectra and M.R. and M.D. measured the Raman spectra. J.‐Y.R. produced and analyzed the ab initio simulation data. The paper was written by L.G., S.J., S.M., and M.W., with the help and contributions from all co‐authors. All authors have given approval to the final version of the manuscript. The project was initiated and conceptualized by M.W.
Supporting information
Supporting Information
Acknowledgements
The authors thank K. Shportko for FTIR measurements, and M. Wirtssohn for carrying out EDX measurements, both focusing on the GeTe–GeSe pseudo‐binary line. H. Volker and V. Deringer (Oxford) are gratefully acknowledged for careful reading of the manuscript, and W. Sander (RU Bochum) is gratefully acknowledged for helpful discussions on resonance bonding or the lack thereof in aromatic compounds. This work was partially supported through the SFB 917 (Nanoswitches). M.W. furthermore acknowledges funding by an ERC Advanced Grant 340698 (“Disorder control”) and a Distinguished Professorship. S.M. gratefully acknowledges financial support from the ERS Start‐Up grant for postdocs 2018 (Grant No. StUpPD_324‐18), whereas J.‐Y.R. acknowledge support from the FRS‐FNRS (CDR Grant No. ABIGLO J.0154.21), the CÉCI (funded by the F.R.S.‐FNRS under Grant No. 2.5020.11), and the Tier‐1 supercomputer of the Fédération Wallonie‐Bruxelles (Grant No. 1117545).
Open access funding enabled and organized by Projekt DEAL.
Guarneri L., Jakobs S., von A. Hoegen, Maier S., Xu M., Zhu M., Wahl S., Teichrib C., Zhou Y., Cojocaru‐Mirédin O., Raghuwanshi M., Schön C.‐F., Drögeler M., Stampfer C., Lobo R. P. S. M., Piarristeguy A., Pradel A., Raty J.‐Y., Wuttig M., Metavalent Bonding in Crystalline Solids: How Does It Collapse?. Adv. Mater. 2021, 33, 2102356. 10.1002/adma.202102356
Data Availability Statement
The data that support the findings of this study are available from the corresponding author upon reasonable request.
References
- 1. Laing M., J. Chem. Educ. 2008, 85. [Google Scholar]
- 2. Meyer L. J., Die Modernen Theorien der Chemie und ihre Bedeutung für die Chemische Statistik, Verlag von Maruschke & Berendt, Breslau, 1864.
- 3. Kooi B. J., Wuttig M., Adv. Mater. 2020, 32, 1908302. [DOI] [PubMed] [Google Scholar]
- 4. Wuttig M., Deringer V. L., Gonze X., Bichara C., Raty J. Y., Adv. Mater. 2018, 30, 1803777. [DOI] [PubMed] [Google Scholar]
- 5. Giri D., Williams L., Mukherjee A., Rajan K., J. Chem. Phys. 2021, 154, 124105. [DOI] [PubMed] [Google Scholar]
- 6. Zhu M., Cojocaru‐Miredin O., Mio A. M., Keutgen J., Kupers M., Yu Y., Cho J. Y., Dronskowski R., Wuttig M., Adv. Mater. 2018, 30, 1706735. [DOI] [PubMed] [Google Scholar]
- 7. Cheng Y. D., Cojocaru‐Miredin O., Keutgen J., Yu Y., Kupers M., Schumacher M., Golub P., Raty J. Y., Dronskowski R., Wuttig M., Adv. Mater. 2019, 31, 1904316. [DOI] [PubMed] [Google Scholar]
- 8. Maier S., Steinberg S., Cheng Y., Schön C.‐F., Schumacher M., Mazzarello R., Golub P., Nelson R., Cojocaru‐Mirédin O., Raty J.‐Y., Wuttig M., Adv. Mater. 2020, 32, 2005533. [DOI] [PubMed] [Google Scholar]
- 9. Raty J. Y., Schumacher M., Golub P., Deringer V. L., Gatti C., Wuttig M., Adv. Mater. 2019, 31, 1806280. [DOI] [PubMed] [Google Scholar]
- 10. Cuenca‐Gotor V. P., Sans J. A., Gomis O., Mujica A., Radescu S., Munoz A., Rodriguez‐Hernandez P., da Silva E. L., Popescu C., Ibanez J., Vilaplana R., Manjon F. J., Phys. Chem. Chem. Phys. 2020, 22, 3352. [DOI] [PubMed] [Google Scholar]
- 11. Xu M., Jakobs S., Mazzarello R., Cho J. Y., Yang Z., Hollermann H., Shang D. S., Miao X. S., Yu Z. H., Wang L., Wuttig M., J. Phys. Chem. C 2017, 121. [Google Scholar]
- 12. Wuttig M., Schoen C.‐F., Schumacher M., Robertson J., Golub P., Bousquet E., Raty J.‐Y., arXiv: 2012.03794, 2020.
- 13. Sarkar D., Roychowdhury S., Arora R., Ghosh T., Vasdev A., Joseph B., Sheet G., Waghmare U. V., Biswas K., Angew. Chem., Int. Ed. 2021, 60, 10350. [DOI] [PubMed] [Google Scholar]
- 14. Bader R., Nguyen‐Dang T., Advances in Quantum Chemistry, Vol. 14, Elsevier, Amsterdam, The Netherlands: 1981, pp. 63–124. [Google Scholar]
- 15. Bader R. F. W., Acc. Chem. Res. 1985, 18, 9. [Google Scholar]
- 16. Bader R. F. W., Stephens M. E., J. Am. Chem. Soc. 1975, 97, 7391. [Google Scholar]
- 17. Lewis G. N., Valence and the Structure of Atoms and Molecules, University Microfilms, Ann Arbor, MI, USA: 1977. [Google Scholar]
- 18. Zhao L. L., Schwarz W. H. E., Frenking G., Nat. Rev. Chem. 2019, 3, 35. [Google Scholar]
- 19. Gonze X., Lee C., Phys. Rev. B 1997, 55, 10355. [Google Scholar]
- 20. Maier S., Steinberg S., Cheng Y. D., Schon C. F., Schumacher M., Mazzarello R., Golub P., Nelson R., Cojocaru‐Miredin O., Raty J. Y., Wuttig M., Adv. Mater. 2020, 32, 2005533. [DOI] [PubMed] [Google Scholar]
- 21. Muir J. A., Cashman R. J., J. Phys. Chem. Solids 1967, 28, 1009. [Google Scholar]
- 22. Wiedemeier H., Siemers P. A., High Temp. Sci. 1984, 17, 395. [Google Scholar]
- 23. Talebian E., Talebian M., Optik 2013, 124, 2324. [Google Scholar]
- 24. Fang B., Zeng Z. G., Yan X. X., Hu Z. Y., J. Mater. Sci.: Mater. Electron. 2013, 24, 1105. [Google Scholar]
- 25. Zhang H. J., Liu C. X., Qi X. L., Dai X., Fang Z., Zhang S. C., Nat. Phys. 2009, 5, 438. [Google Scholar]
- 26. Liu S., Wei J. S., Gan F. X., Appl. Phys. Lett. 2012, 100, 111903. [Google Scholar]
- 27. Da Silva J. L. F., Walsh A., Lee H. L., Phys. Rev. B 2008, 78, 224111. [Google Scholar]
- 28. Tideswell N. W., Kruse F. H., McCullough J. D., Acta Crystallogr. 1957, 10, 99. [Google Scholar]
- 29. Deringer V. L., Stoffel R. P., Wuttig M., Dronskowski R., Chem. Sci. 2015, 6, 5255. [DOI] [PMC free article] [PubMed] [Google Scholar]
- 30. Lencer D., Salinga M., Wuttig M., Adv. Mater. 2011, 23, 2030. [DOI] [PubMed] [Google Scholar]
- 31. Maier S., Steinberg S., Cheng Y., Schön C.‐F., Schumacher M., Mazzarello R., Golub P., Nelson R., Cojocaru‐Mirédin O., Raty J.‐Y., Wuttig M., Adv. Mater 2020, 32, 2005533. [DOI] [PubMed] [Google Scholar]
- 32. Huang B., Robertson J., Phys. Rev. B 2010, 81, 081204. [Google Scholar]
- 33. Raty J. Y., Wuttig M., J. Phys. D: Appl. Phys. 2020, 53, 234002. [Google Scholar]
- 34. Pauling L., The Nature of The Chemical Bond, Cornell University Press, Ithaca, NY, USA: 1960. [Google Scholar]
- 35. Gavroglu K., Simões A., Neither Physics nor Chemistry: A History of Quantum Chemistry, MIT Press, London: 2012. [Google Scholar]
- 36. Shaik S., Danovich D., Galbraith J. M., Braida B., Wu W., Hiberty P. C., Angew. Chem., Int. Ed. 2020, 59, 984. [DOI] [PubMed] [Google Scholar]
- 37. Minkin V. I., Pure Appl. Chem. 1999, 71, 1919. [Google Scholar]
- 38. Green J. C., Green M. L. H., Parkin G., Chem. Commun. 2012, 48, 11481. [DOI] [PubMed] [Google Scholar]
- 39. Siegrist T., Jost P., Volker H., Woda M., Merkelbach P., Schlockermann C., Wuttig M., Nat. Mater. 2011, 10, 202. [DOI] [PubMed] [Google Scholar]
- 40. Hessler A., Wahl S., Leuteritz T., Antonopoulos A., Stergianou C., Schon C. F., Naumann L., Eicker N., Lewin M., Mass T. W. W., Wuttig M., Linden S., Taubner T., Nat. Commun. 2021, 12, 924. [DOI] [PMC free article] [PubMed] [Google Scholar]
- 41. Persch C., Müller M. J., Yadav A., Pries J., Honné N., Kerres P., Wei S., Tanaka H., Fantini P., Varesi E., Pellizzer F., Wuttig M., arXiv: 2103.00116, 2021. [DOI] [PMC free article] [PubMed]
- 42. Yu Y., Cagnoni M., Cojocaru‐Miredin O., Wuttig M., Adv. Funct. Mater. 2019, 30, 1904862. [Google Scholar]
- 43. Cagnoni M., Fuhren D., Wuttig M., Adv. Mater. 2018, 30, 1801787. [DOI] [PubMed] [Google Scholar]
- 44. Matsunaga T., Yamada N., Kojima R., Shamoto S., Sato M., Tanida H., Uruga T., Kohara S., Takata M., Zalden P., Bruns G., Sergueev I., Wille H. C., Hermann R. P., Wuttig M., Adv. Funct. Mater. 2011, 21, 2232. [Google Scholar]
- 45. Lyddane R. H., Sachs R. G., Teller E., Phys. Rev. 1941, 59, 673. [Google Scholar]
- 46. Wooten F., Optical Properties of Solids, Academic, New York: 1972. [Google Scholar]
- 47. Potts W. J., Chemical Infrared Spectroscopy, Wiley, New York: 1963. [Google Scholar]
- 48. Schubert M., Infrared Ellipsometry on Semiconductor Layer Structures: Phonons, Plasmons, and Polaritons, Vol. 209, Springer Tracts in Modern Physics, Springer‐Verlag, Berlin, Germany: 2004, pp. 1–6. [Google Scholar]
- 49. Kuzmenko A. B., Rev. Sci. Instrum. 2005, 76, 083108. [Google Scholar]
- 50. Chanda G., Lobo R., Schachinger E., Wosnitza J., Naito M., Pronin A. V., Phys. Rev. B 2014, 90, 024503. [Google Scholar]
- 51. Kresse G., Furthmuller J., Comput. Mater. Sci. 1996, 6, 15. [Google Scholar]
- 52. Kresse G., Furthmüller J., Phys. Rev. B: Condens. Matter Mater. Phys. 1996, 54, 11169. [DOI] [PubMed] [Google Scholar]
- 53. Kresse G., Joubert D., Phys. Rev. B 1999, 59, 1758. [Google Scholar]
- 54. Kresse G., Furthmuller J., Hafner J., Phys. Rev. B 1994, 50, 13181. [DOI] [PubMed] [Google Scholar]
- 55. Blochl P. E., Phys. Rev. B 1994, 50, 17953. [DOI] [PubMed] [Google Scholar]
- 56. Perdew J. P., Ruzsinszky A., Csonka G. I., Vydrov O. A., Scuseria G. E., Constantin L. A., Zhou X. L., Burke K., Phys. Rev. Lett. 2008, 100, 136406. [DOI] [PubMed] [Google Scholar]
Associated Data
This section collects any data citations, data availability statements, or supplementary materials included in this article.
Supplementary Materials
Supporting Information
Data Availability Statement
The data that support the findings of this study are available from the corresponding author upon reasonable request.


