Abstract
3D bioprinting possesses the potential to revolutionize contemporary methodologies for fabricating tissue models employed in pharmaceutical research and experimental investigations. This is enhanced by combining bioprinting with advanced organs‐on‐a‐chip (OOCs), which includes a complex arrangement of multiple cell types representing organ‐specific cells, connective tissue, and vasculature. However, both OOCs and bioprinting so far demand a high degree of manual intervention, thereby impeding efficiency and inhibiting scalability to meet technological requirements. Through the combination of drop‐on‐demand bioprinting with robotic handling of microfluidic chips, a print procedure is achieved that is proficient in managing three distinct tissue models on a chip within only a minute, as well as capable of consecutively processing numerous OOCs without manual intervention. This process rests upon the development of a post‐printing sealable microfluidic chip, that is compatible with different types of 3D‐bioprinters and easily connected to a perfusion system. The capabilities of the automized bioprint process are showcased through the creation of a multicellular and vascularized liver carcinoma model on the chip. The process achieves full vascularization and stable microvascular network formation over 14 days of culture time, with pronounced spheroidal cell growth and albumin secretion of HepG2 serving as a representative cell model.
Keywords: bioprinting, organ‐on‐a‐chip, robotics, vascularization
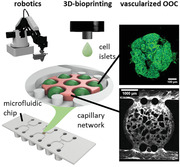
This work shows how the fabrication process of vascularized Organs‐on‐a‐Chip can be automated using drop‐on‐demand 3D‐bioprinting in combination with robotics. This includes a microfluidic chip design that is accessible to different types of 3D‐bioprinters. A multi‐material bioprinting process is presented for an exemplary liver carcinoma model with HepG2 cells as cell islets supported by a surrounding self‐assembled microvascular network.
1. Introduction
Since December 2022, the regulatory landscape for preclinical drug testing has witnessed a significant transformation, driven by the Food and Drug Administration's decision to eliminate the necessity of animal models.[ 1 ] A promising substitute to these models lies in organs‐on‐a‐chip (OOCs), which have demonstrated their ability to accurately predict drug toxicity in previous instances.[ 2 , 3 , 4 ] However, to integrate OOCs into routine pharmaceutical practices, it is imperative to upscale and refine their fabrication processes, which include the microfluidic chip, chip handling procedures, and the intricate task of tissue model structuring.
The prevailing standard for microfluidic chip fabrication in research involves PDMS casting,[ 4 , 5 , 6 ] a labor‐intensive and tedious process on a material that is limited in application due to its high small molecule absorbance.[ 7 , 8 , 9 ] However, several alternatives have emerged including 3D printing,[ 10 , 11 , 12 , 13 , 14 , 15 ] laser cutting,[ 16 , 17 ] injection molding,[ 18 , 19 , 20 , 21 , 22 , 23 ] and 3D stamping.[ 9 , 17 , 24 ] Though 3D printing holds substantial utility for prototyping and conducting experiments on a limited scale, conventional fabrication techniques, like injection molding, offer heightened reproducibility and reliability, and are most likely to dominate in future fabrication.
In parallel, the landscape of tissue modeling has evolved significantly, transitioning from simplistic 2D models toward more intricate 3D counterparts to preserve cellular functionality.[ 4 , 25 , 26 ] Recent research has also placed a strong emphasis on incorporating vascularization, a pivotal facet enhancing biomimicry and enabling faithful representation of nutrient and drug transport while preventing the onset of necrosis.[ 6 , 27 , 28 , 29 ] The on‐chip fabrication of these multi‐cellular tissue models with intricate spatial arrangements presents a notable challenge, particularly when aiming to incorporate direct cell‐cell interactions. In addressing this challenge, bioprinting emerges as a promising tool, offering the potential to streamline fabrication processes, eliminate manual intervention, and concurrently enhance reproducibility and standardization.[ 29 , 30 , 31 ]
The combination of bioprinting and OOCs introduces a heightened level of complexity to the chip design, as the chip must be accessible to the bioprinter, and subsequently sealed tightly to withstand perfusion. To achieve these objectives and uphold a high throughput, an automation framework encompassing the placement, loading, and final assembly of the chip post‐printing is needed.[ 32 ] In this context, the integration of robotic systems equipped with sensors stands as a promising solution, drawing upon established precedents within the industrial and pharmaceutical research sectors.[ 33 , 34 ]
To enable sample taking at various time points, connectivity or access to the culture medium is important. In this case, another focus today lies on direct perfusion, aiming to enhance physiological relevance by emulating continuous blood flow.[ 35 , 36 , 37 ] An optimal microfluidic chip design must therefore satisfy multiple criteria: a) accessibility for tissue model integration, b) connectivity to a perfusion system, and c) scalability to support an elevated fabrication throughput.
This paper addresses the above‐mentioned three challenges—microfluidic chip fabrication, on‐chip tissue model generation, and OOC handling. In the first step, a microfluidic chip was designed, prototyped, and tested based on a transparent and cytocompatible print process before the final design was sent to upscaling via injection molding in a cyclic olefin polymer (COP). The chip is assembled during and after printing and is compatible with many types of bioprinters, as well as manual filling. The chip delivery, 3D‐bioprinting preparation, chip closure, and storage are realized via a robotic system in a single‐step approach without manual intervention (Figure 1A).
Figure 1.
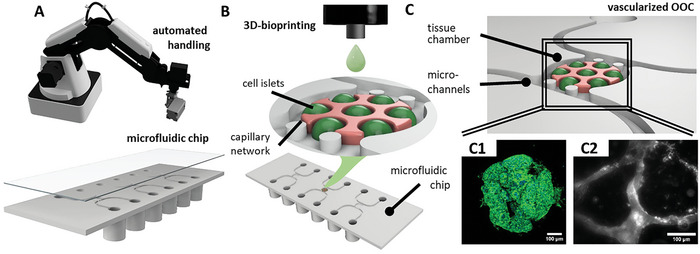
Sketch of the process steps toward an automized fabrication process of vascularized OOCs. A robotic system automatically handles custom‐designed microfluidic chips (A) in the pre‐ and post‐process of 3D‐bioprinting (B). Inside the tissue chamber of the microfluidic chip, printed islets of HepG2 cells proliferate and form agglomerates, with a microvascular network forming during culture time (C).
To improve the scalability of the tissue model generation on the chip, a drop‐on‐demand (DoD) microvalve bioprint process is developed. Using multiple print heads with different bioinks, a spatially distributed tissue model containing parenchymal cells, as well as a vascular bed is obtained (Figure 1B). While there are a variety of approaches employed with 3D‐bioprinters to achieve 3D vasculature,[ 38 , 39 , 40 , 41 ] many strategies rely on larger channels covered with endothelial cells[ 42 , 43 , 44 ] or on coaxially extruded vessel structures.[ 45 , 46 ] In this work, we chose a different approach, which is the self‐assembly of endothelial cells into microvascular networks (µVN), which is most commonly used in non‐printed tissue models.[ 47 , 48 , 49 ] These self‐assembled µVNs have been shown as suitable to mimic the microcirculatory system, with a more native barrier function and even nutrient distribution within the tissue model compared to larger channels.[ 50 , 51 , 52 ] We employ this capability for our model by printing a vasculogensis bioink containing a mix of human umbilical vein endothelial cell (HUVEC) and human dermal fibroblast (HDF) around drops of a parenchymal bioink, which leads to the formation of µVN during culture time that support the parenchymal islets (Figure 1C).
To demonstrate the functionality of the developed microfluidic chip in combination with the automated 3D‐bioprint process and robotic handling, a liver carcinoma model based on HepG2 cells is presented. During the culture time of 14 days, a stable µVN develops around islets of HepG2 cells, which proliferate strongly and form spheroidal agglomerates (Figure 1C). This underlines that 3D bioprinting, in combination with robotic handling, can remove manual processes and increase productivity even for complex and vascularized OOCs.
2. Results and Discussion
2.1. Design of the Tissue Model
As a demonstrator of our approach, the primary objective was to establish a vascularized OOC using DoD bioprinting technology. We designed a 3D, complex tissue model inside a single chamber within the microfluidic chip, therefore deliberately avoiding any synthetic interfaces between the model tissue and the surrounding vascular matrix. The model contains small printed islets that can contain different types of parenchymal cells, which are surrounded by a vascularized matrix material. HepG2 cells were chosen as an exemplary carcinoma model as parenchymal cells.
Based on a previous screening study of bioinks compatible with HepG2 cells and the employed printing system,[ 53 ] agarose was selected for its compatibility with HepG2 cells, its printability, and its thermal gelling behavior which does not require additional UV exposure or manual addition of crosslinkers. To achieve vascularization of the model, the cellular islands are further embedded in a fibrin gel containing HDFs and HUVECs, which self‐assemble into capillary‐like structures within several days.[ 49 , 54 , 55 ] The specific concentration of 10 mg mL−1 of fibrinogen was based on literature reports of stable and well‐developed µVNs,[ 47 , 48 , 50 , 56 , 57 , 58 ] which was also successful in this work. Instead of printing an artificial vascular network, cooled fibrinogen with HUVEC and HDF inside is printed over the HepG2 islands and crosslinked post‐printing via thrombin contained in the HepG2 bioink.
2.2. Development of the Microfluidic Chip
In the initial phase, a microfluidic chip accessible to a bioprinter and sealable afterward had to be designed. The first prototypes were realized using a transparent and cytocompatible 3D‐Digital Light Processing (DLP) print process.[ 59 ] All designs offer two fluidic channels that mimic the arterial and venous flow system of the body, with a round central chamber in the middle for the vascularized tissue model (Figure 2A). The top of the main chamber is accessible for a bioprinter by an opening, which is sealed post‐printing by a lid (Figure 2B,C). Different pillar numbers, shapes, and diameters that stop the hydrogel in the central chamber from entering the fluidic channels were tested in this step, as well as different chamber diameters and chip heights (Figure S1, Supporting Information). The final chip design features 500 µm wide channels around a central chamber of 3 mm diameter, which is large enough to allow complex printing while being small enough to be fully supported by µVNs as our experiments show (Figure 2D). The chamber is separated from the channels by two pillars, which prevent the bioinks from flowing into the channel system during sealing. The chip height of 300 µm is based on the resolution of modern bioprinters and set to make it accessible to be filled by various printers and bioink types.[ 60 , 61 , 62 ]
Figure 2.
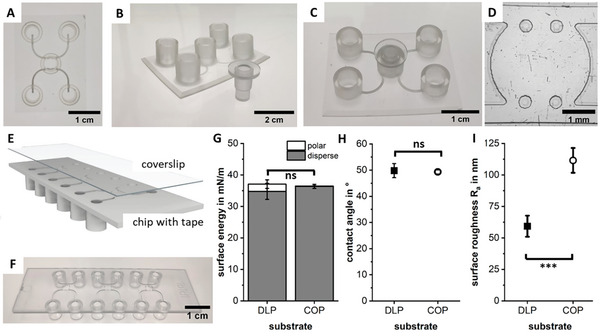
Transparent microfluidic chip prototypes were printed using an adapted 3D‐DLP print process. The printed chips offer a wide opening for the print head over the central chamber (A) that is closed with a plug after the bioprinting process (B,C). After testing different chip geometries, the final design contains a 3 mm wide tissue chamber with two round pillars separating the chamber from the channels (D). The COP custom‐fabricated chips offer three OOC units on a standard microscopy slide format accessible via Luer connectors. The bottom of the chip is covered by a double‐sided cytocompatible tape, which is sealed by a protective foil (E). After the bioprint process, the protective foil is removed and the chip is sealed with a polymer coverslip (F). The surface energy (G) and contact angle to a bioprinted agarose hydrogel (H) show no significant (ns) difference between both substrate materials, though the roughness is smaller for the DLP‐printed surface with *** for p < 0.001 (I).
With the prototype phase completed, the final design was fabricated by injection molding using a COP (Figure 2E,F). The advantages of COP are its exceptional optical quality, high moisture barrier, and biological inertness, which makes it popular for microfluidic devices.[ 8 , 63 , 64 ] The translation from prototypes to the final chip design is simple and does not require large adaptations to the print process or general material handling as surface energies and therefore the contact angle of a printed drop of agarose does not vary significantly (Figure 2G,H). The surface quality is similar for both fabrication methods and lies in the range of 60–100 nm (Figure 2I).
The final chip offers three tissue chambers on a standard microscopy slide format with a thin polymer coverslip for high‐resolution imaging. It is open on the bottom, allowing for different types of bioprinters to access it and place multiple bioinks, cell types, or cell aggregates inside. For closure after loading the tissue model, the sealing of a double‐sided cytocompatible tape is removed and the polymer cover slip is placed firmly on top.
The standard format, as well as the connection to the perfusion system via Luer connectors, facilitates handling and is compatible with existing equipment. The three chambers on a chip can be either used for multiple samples of the same tissue but also enable a facile connection between each other for future developments such as body‐on‐a‐chip systems. With a tissue height of 300 µm and a bottom thickness of 170 µm, the analysis on‐chip can be conducted both with advanced microscopy systems, but also with standard microscopes and is therefore suitable for many different types of laboratories.
2.3. Drop‐on‐Demand Bioprinting
In microvalve DoD bioprinting, the material's rheology, microvalve diameter, and print pressure settings dominate the print resolution and expected shear stress for cells for a given bioink. While agarose already has a very low shear viscosity of around 3 mPa s, fibrinogen is highly shear thinning and therefore also present at low viscosities during printing (Figure 3A), which suggests easy printability at low print pressures as well as very low shear stress for cells in both bioinks.
Figure 3.
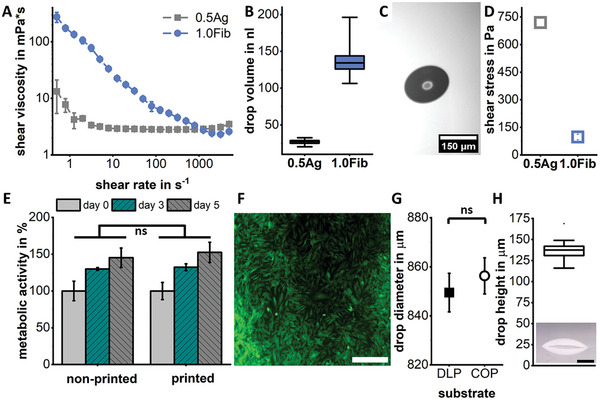
Shear viscosity measurements show Newton‐like flow behavior for agarose and strong shear thinning for fibrinogen (A). Drop volumes of both bioinks (B) as measured in flight (C). The very low nozzle shear stresses of below 1 kPa that cells experience during printing (D) do not significantly (ns) affect the metabolic activity of HUVEC (E) or the cell viability 14 h post‐printing of HDF cells (F) with live cells stained with FDA (green) and dead cells stained with PI (red). Scale bar showing 500 µm. The average drop diameter is around 850 µm on both DLP printed prototypes and the final chip out of COP with no significant difference between the substrate (ns) (G). The resulting drop height is around 140 µm on COP as imaged from the side with a scale bar showing 300 µm (H).
As the highest resolution is necessary for the HepG2 islands, they were printed with a smaller valve of 150 µm at low print pressure, leading to drops with only 27 nL volume as measured in flight (Figure 3B,C). The drop volume is much higher for fibrinogen, as a larger valve is sufficient for filling the chamber and leads to lower shear stresses for cells (Figure 3D). The low shear stress retains the same high metabolic activity and viability for the sensitive primary cells contained in this ink compared to the non‐printed control group (Figure 3E,F and Figure S2, Supporting Information).
The average diameter of agarose drops on either the DLP printed chips or the injection molded chips is ≈850 µm (Figure 3G,H). Following the theory of circle packing in a circle,[ 65 ] this leads to a maximum of seven drops of the HepG2 bioink that can fit into the central chamber if a 15% tolerance is included. All following tissue prints are therefore conducted with seven drops arranged in a circle. Resulting from the wettability and therefore diameter of drops of a certain volume, the resulting average drop height is around 140 µm for agarose. This height leaves enough space for the endothelial cells to grow around and below the liver islands and does not restrict their path (Figure 3H).
2.4. Automated DoD Print Process
The print process of both the HepG2 bioink and the vasculogenesis bioink is realized via two separate print heads that can be heated for agarose (T ag = 37 °C), while the fibrinogen‐containing print head is cooled (T fib = 10 °C). The chip is placed on an aluminum sample holder, which controls the chip's temperature and enables the repeated and necessary highly precise positioning of many chips under the print heads (Figure 4A,B).
Figure 4.
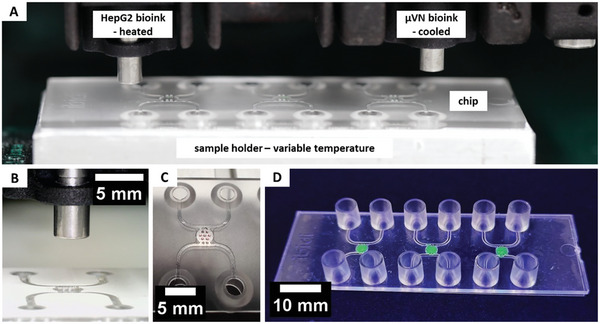
Overview of the printing configuration. The parenchymal bioink containing HepG2 is placed in a heated print head to keep the agarose liquid, while the vasculogenesis bioink is in a cooled print head to prevent fibrinogenesis. The chip is placed on a temperature‐controlled sample holder (A) that ensures repeatable positioning of the chips inside the printer (B). First, seven individual drops of the parenchymal bioink (red) are printed and cooled (C), before the chamber is filled with the vasculogenesis bioink (stained in green for better visualization) and the chip sealed (D).
During the print process of the HepG2 bioink, the chip is kept at room temperature (T = 23 °C) to avoid any thermal effects such as condensation or Marangoni between the drops (Video S1, Supporting Information). Directly afterward, the chip is cooled to 5 °C for 30 s to ensure gelation of the agarose (Figure 4C). Next, the vasculogenesis bioink is printed over the existing drops (Video S2, Supporting Information). The chip is then sealed and placed in the incubator for fibrin gelation (Figure 4D). The process of printing both bioinks into all three tissue chambers requires only 40 s, with the cooling step in between adding another 30 s. For industry applications, this process can be further accelerated by placing multiple chips behind each other or by printing with multiple print head arrays. A key advantage of DoD‐bioprinting compared to other printers for this case is that no vertical movement of the print heads is required during the whole print process.
While rapid print processes already exist for other printers, we also developed a robotic system that replaces the manual process steps of chip delivery, lid removal, chip closure, and chip storage to further boost the automatization of the tissue model fabrication (Figure 5 and Video S3, Supporting Information). The development of such a manipulation and transport system, as well as the corresponding process chain, is an important foundation for improving and standardizing the procedure for the automated production of OOCs.
Figure 5.
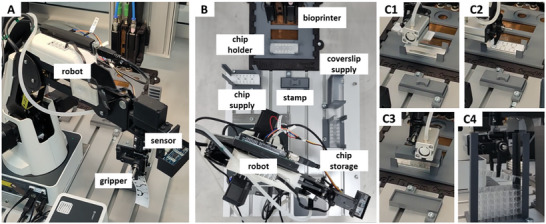
Images of the robotic transport and manipulation system. The commercial robot is equipped with an ultrasonic sensor, as well as a printed gripper (A). The full system comprises a robot, supply points for microfluidic chips and coverslips, a temperature‐controlled chip holder for bioprinting, and a stamp for sealing, as well as a storage point for finished chips (B). Steps along the process chain include chip delivery (C1), protective foil removal (C2), sealing (C3), and chip storage (C4).
The process chain was implemented and validated using a laboratory‐scale demonstrator. In addition to the bioprinting system, this comprises a 4‐axis robot, supply and storage points, a chip holder, and a stamp for fixing the seal on the chip (Figure 5A,B). The individual steps in the process chain (Figure 5C1–4) are monitored by integrated sensors to ensure their successful and repeatable implementation. An ultrasonic sensor measures the distance between the robot grip and the objects, as well as realizing the general object detection, while a camera monitors the success of the removal of the protective foil. Signal processing and control are handled by a microcontroller, which communicates with the printer hardware via a software interface and repeats individual steps if necessary. This integration of an automated transport and placement solution removes manual handling steps and is therefore an essential component for the successful industrial translation of complex OOCs.
2.5. Tissue Culture
The envisioned vascularized tissue model requires the self‐assembly of HUVEC and HDF into µVNs on the chip. The selected fibrin matrix together with the combination of both cell types leads to the formation of fine µVN networks that develop during 14 days in culture (Figure 6A). During culture time, the vessel area percentage per chip does not vary significantly (Figure 6B), while the number of branches decreases strongly over the course of culture time (Figure 6C) as the networks form and start to span throughout the whole tissue chamber with its diameter of 3 mm. This strong decrease in the number of branches over time and the final value of around 50 branches per mm2 has been reported before.[ 50 , 66 , 67 ] With the formation and maturation of the networks, their average length and diameter increase to around 130 and 35 µm, respectively (Figure 6C,D), similar to previous reports on vasculogenesis in fibrin gels.[ 50 , 68 , 69 ]
Figure 6.
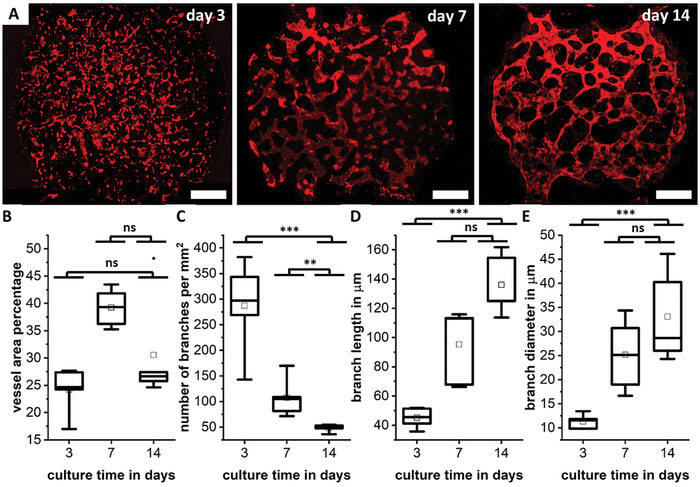
On‐chip culture of the fibrin bioink results in the formation and maturation of fine, self‐assembled microvascular networks over the course of 14 days, with CD‐31 stained red (A). Scale bar showing 500 µm. The vessel area percentage per chip (B), the branch density (C), the branch length (D), and the branch diameter (E) are given. Differences between days are marked as ns for not significant, ** for p < 0.01, *** for p < 0.001.
By coating the channel walls with fibronectin post‐printing and seeding of HUVEC inside the channel, a lining of ECs on the channel walls is achieved (Figure 7A). The formed µVNs are finely branched, with the vessel walls lined and stabilized by HDF as reported before (Figure 7B,C and Figures S3 and S4, Supporting Information).[ 54 , 55 , 70 ] The networks can be perfused as shown for a 70 kDa FITC‐labeled Dextran and confocal images validate that they are hollow with an open lumen (Figure 7D,E and Figures S5 and S6, Supporting Information).
Figure 7.
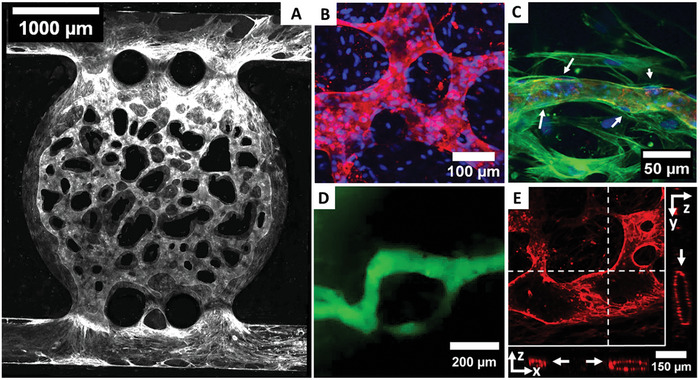
On‐chip culture of the fibrin bioink results in a fine, µVN by HUVEC throughout the whole chip after 14 days of culture (A), staining of CD‐31 (white). The network is highly branched with various diameters (B) and HDF lining the outer vessel walls as indicated by white arrows (C) as seen in confocal microscopy with CD‐31 (red), nuclei (blue), and actin filaments (green) stained. The networks can be perfused by 70 kDa FITC‐dextran (D) and show an open lumen (indicated by white arrows) as visible in a z‐projection image with slice direction shown in x‐ and y‐plane as indicated by white lines (E) with CD‐31stained red.
Bringing together both bioinks in a single print process results in HepG2 cell islands that are supported with nutrients via the surrounding vascular network (Figure 8A,B). Inside the drops of agarose, HepG2 cells do not only survive but proliferate strongly between days 0 and 14 (Figure 8C,D). By themselves, they agglomerate and start to form 3D cell spheroids within their drop of agarose with no intention to grow outside (Figure 8D,E and Video S4, Supporting Information). The agglomeration and spheroid‐like appearance after longer culture periods is typical for HepG2 cells cultured in 3D.[ 71 , 72 ] This general behavior has been reported for both cancerogenic and other hepatic cells, with groups observing this behavior for models based only on hepatic cells,[ 73 , 74 , 75 , 76 , 77 ] as well as in the presence of vascular networks[ 78 , 79 , 80 ] or endothelial cells.[ 81 , 82 ] The retention of the HepG2 cells inside the drops of agarose promotes this agglomeration behavior, and due to the limited volume, causes the spheroid‐like shapes as has been reported before in alginate drops.[ 83 ]
Figure 8.
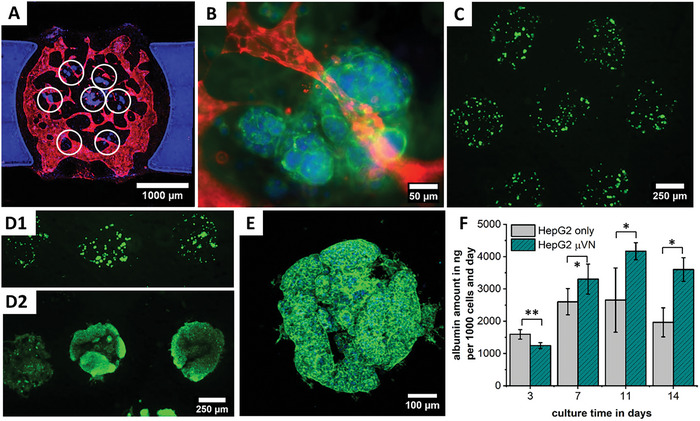
In the tri‐culture, HepG2 islands (white circles) are surrounded by the vascular network (A,B). After printing HepG2 cells (C), they proliferate strongly between day 0 (D1) and 14 (D2), forming spheroidal agglomerations inside the agarose matrix with no intent of growing outside (E). Albumin synthesis increases during the first 11 days and is higher when the model is supported by a µVN (F), with * for p < 0.05 and ** for p < 0.01.
In our model, this behavior is utilized to form cell spheroids directly in the model without the need to pre‐fabricate spheroids, which is in contrast to many other works which place pre‐formed spheroids on chip to form vascularized carcinoma models.[ 56 , 57 , 84 , 85 , 86 , 87 , 88 , 89 ] By removing the need to pre‐fabricate spheroids, additional manual steps can be omitted and the fabrication process accelerated. Apart from the proliferation of cells, an increase in albumin levels is seen in our model until day 11. The presence of a µVN further increases the albumin levels (Figure 8F). This observation fits in well with the findings of previous studies.[ 78 , 82 ]
3. Conclusion and Outlook
The presented approach toward upscaling the fabrication process for vascularized OOCs involves microfluidic chip production and the print process itself, as well as the robotic handling of all included components. In the first step, a microfluidic chip design was translated from 3D‐printed prototypes to an industrial injection molding process. The developed chip offers easy handling at exceptional imaging qualities while being open to use with many different types of bioprinters or even manual filling. Possible future areas of application include other cell types, other types of bioinks, or the combination with spheroid placement systems or high‐resolution printers.
The handling of the microfluidic chip is realized via a robotic system in a single‐step approach, including chip delivery, preparation, closure, and storage, with no need for manual intervention, taking on‐chip work a step closer to mainstream usage. In combination with a DoD bioprint process, a complex vascularized tissue model is achieved within a minute. The very high print resolution of 850 µm or less and the low required amount of hydrogel (190 nL tissue‐specific drops in 3 µL of vasculogenesis matrix) are ideal for the use with valuable cell sources and assays requiring a large number of repetitions. By relying on the self‐assembly of µVNs instead of printing hollow structures, the complexity of fabrication is reduced while increasing the biological complexity and nutrient supply. The biological function of the fabricated model is demonstrated for HepG2 cells, which proliferate and form spheroid‐like structures within their drops over the course of 14 days.
This work demonstrates the potential for scaling up microfluidic chip fabrication, 3D printing, and chip handling processes, even when dealing with intricate tissue models or facing constraints in cell availability. In the future, these advancements can help in the translation of complex OOC systems into routine pharmaceutical operations, and simplify the execution of larger‐scale assays for a broad range of researchers.
4. Experimental Section
3D‐DLP Printing
For prototyping, an Asiga Max stereolithography printer (Litholabs/Asiga, Heidelberg, Germany) with PlasClear resin (Asiga, Heidelberg) was used. To achieve transparency, the manufacturer's build plate was replaced by a custom‐built plate made of highly polished and hardened 42CrMo4 steel as presented before. STL‐files of print geometries were created in Siemens NX (Siemens Digital Industries Software, Plano, USA). After printing, the samples were washed with isopropanol and then treated for 10 min in isopropanol in an ultrasonic bath. The washing step was followed by a post‐curing step in water for 10 min under the Asiga Flash UV chamber (Litholabs/Asiga, Heidelberg, Germany). For further post‐treatment steps, samples were then left in isopropanol overnight and post‐cured for an additional 8 h.
COP Chips
The final chip was injection molded out of a COP. A pre‐cut double‐sided adhesive film with a protective cover was on top of this chip. The chip was sealed with a COP coverslip after the removal of the protective film.
Hydrogel Composition
To prepare the stock solutions, agarose (low gelling temperature, Sigma‐Aldrich, St. Louis, USA) was mixed with distilled water and sterilized in the autoclave. Before use, it was reheated to 70 °C and maintained at 40 °C. Fibrinogen from human plasma (Sigma‐Aldrich, St. Louis, USA) was dissolved in cold TBS for a stock concentration of 50 mg mL−1 and sterile‐filtered. Bovine thrombin (Sigma‐Aldrich, St. Louis, USA) was dissolved in TBS containing 50 mm calcium chloride for a stock of 40 U mL−1 and sterile filtered before use. For experiments off chip, 0.5 wt/vol% agarose (0.5Ag) was prepared by mixing 1 part of 1 wt/vol% agarose with 1 part of DMEM. For fibrin, fibrinogen was mixed with serum‐free EGM‐2 and thrombin for a final concentration of 10 mg mL−1 and 1 U mL−1, respectively. For experiments on the chip, thrombin was added to the agarose blend at a final concentration of 5 U mL−1 and both gels were supplemented with 1% PenStrep and 1% Amphotericin B (Gibco, Life Technologies Limited, Paisley, UK).
Surface Roughness
Quantification of roughness parameters was done with a DektakXT profilometer (Bruker Corporation, Billerica, USA) over a line length of 200 µm with a tip radius of 2.5 µm and a tip force of 3 mg. Plot data shows the mean of ten scans.
Surface Energy
The surface energy was determined with a contact angle goniometer drop shape analyzer DSA 100 (Krüss GmbH, Hamburg, Germany). Six droplets of 2 µL volume of deionized water, diiodomethane, and polyethylene glycol were measured for each surface and the surface energy was calculated by the Owens, Wendth, Rabel, and Kaelble (OWRK) method.
Rheological Characterization
Rheological measurements were conducted on a rotary oscillating rheometer (Kinexus lab+, NETZSCH‐Gerätebau, Selb, Germany). The shear viscosity was measured using a 1° cone‐plate geometry with a diameter of 60 mm for shear rates from 0.5 to 5000 s−1, taking five measurement points per decade. Agarose was measured at 37 °C and fibrinogen at 10 °C. For each hydrogel, three shear rate curves were taken.
DoD Bioprinting
Bioprinting experiments were conducted on a DoD microvalve‐based 3D‐bioprinting system (SuperFill‐Custom, Black Drop Biodrucker GmbH, Aachen, Germany) with a microvalve diameter of 300 µm for fibrinogen and 150 µm for agarose, with a valve opening time of 450 µs. Print head temperatures were kept the same as for rheological characterizations. The print pressure for the analysis of drop volume, drop area, and post‐printing cell viability was set to 0.2 bar for all materials and experiments.
The drop volume was measured with an embedded SmartDrop system (BioFluidix GmbH, Freiburg, Germany) (n = 40 for agarose and 150 for fibrinogen). The area of 20 printed drops was measured on flat samples by directly imaging them under the microscope. The number of cells per drop was measured for 150 drops and with cell nuclei stained with DAPI directly after printing. The drop height and contact angles were measured with a Dino‐Lite Edge digital camera (Dino‐Lite Europe, Almere, Netherlands) for ten drops on a COP coverslip (ibidi GmbH Graefelfing, Germany).
Robotic Movement
The automated movement process was realized on a Dobot‐Magician model 2 (Shenzhen Yuejiang Technology Co., Ltd, Shenzhen, China) with a pneumatic gripper that handled the microfluidic chip components. An ultrasonic sensor HC‐SR04 (SparkFun Electronics, Niwot, USA) monitored the pickup of chips, while a Genius WideCam F100 image sensor (KYE Systems Corporation, Taipei, Taiwan) checked for the successful removal of the protective foil. Their feedback was processed with the logic of a finite‐state machine in order to repeat process steps or abort the process if necessary. For the technical realization and implementation, an interface was created between the programming language of the robot and the 3D bioprinter using a Python API (Python software foundation, Delaware, USA). Supply and storage racks for chips, as well as a stamp, to seal the chip were 3D printed.[ 38 ]
Cell Culture
Human liver carcinoma cells (HepG2, ATCC, Manassas, USA) were cultured in low glucose DMEM (Gibco, Life Technologies Limited, Paisley, UK) with 10% FBS (Thermo Fisher Scientific Inc., Waltham, USA) and 1% PenStrep (Gibco) needing passage every third or fourth day. HUVECs (pooled donors, PromoCell, Heidelberg, Germany), were cultured in EGM‐2 (PromoCell, Heidelberg, Germany) and 1% PenStrep and used at passages 3–4. HDF (ATCC, Manassas, USA) were cultured in DMEM (Gibco) with 10% FBS (Thermo Fisher Scientific Inc.) and 1% PenStrep (Gibco) until passage 5. For the bioinks, HepG2 cells were mixed with agarose at a final concentration of 5 × 10⁶ cells/mL. HUVEC and HDF were mixed in fibrin at a 10:1 ratio for a final cell concentration of 5 × 10⁶ and 0.5 × 10⁶ cells/mL, respectively. On chip, cells were cultured with EGM‐2.
Cell Assays
HUVEC metabolic activity post‐printing was assessed with a CellTiter Blue assay (Promega Corporation, Fitchburg, USA). 100 µL of medium with 20 µL CellTiter Blue were added to each well and incubated at 37 °C for 3 h. CellTiter Blue conversion was given as the percentage of signal compared to the mean of signal for each sample on day 0. The fluorescence intensity of the supernatant was read with an Infinite M Plex plate reader (Tecan Group AG, Maennedorf, Switzerland). Post‐printing cell viability of HDF was determined by staining live cells with fluorescein diacetate (Sigma‐Aldrich, St. Louis, USA) and dead cells with propidium iodide (Carl Roth GmbH + Co. KG, Karlsruhe, Germany) (1:60 diluted in Ringer's solution).
Before immunofluorescence stains, cells were fixed in 4% paraformaldehyde (Carl Roth GmbH + Co. KG, Karlsruhe, Germany) for 30 min and permeabilized with 0.5% Triton X‐100 in PBS (Carl Roth GmbH + Co. KG, Karlsruhe, Germany) for 15 min. CD31 was stained by incubating samples with an anti‐CD31 mouse monoclonal antibody (Sigma Aldrich, St. Louis, USA) diluted at 1:100 in PBS overnight, followed by a goat‐anti‐mouse IgG secondary antibody AlexaFluor 594 (Thermo Fisher Scientific Inc., Waltham, USA) at a dilution of 1:200 in PBS for 2 h. For actin and nuclei staining, Alexa Fluor 488 Phalloidin (1:400 dilution) (Thermo Fisher Scientific Inc., Waltham, USA) and DAPI (1:800 dilution) (Sigma Aldrich, St. Louis, USA) were added during the last incubation step.
To quantify albumin production, a human serum albumin ELISA kit (Sigma Aldrich, St. Louis, USA) was used. Samples were collected every 3 days for three chambers and pooled for measuring, with n = 3 measurements taken. Albumin synthesis was calculated for 1000 cells by counting the number of cells per drop at day 0.
Microscopy
Bright field, phase contrast, and fluorescence microscopy were conducted on a light microscope (Echo Revolve, Discover Echo Inc., San Diego, USA). Confocal laser scanning fluorescence microscopy images were taken on a TCS SP8 microscope (Leica Microsystems, Mannheim, Germany).
Vessel Analysis
The perfusability of the networks was tested by perfusing the networks with a 70 kDa FITC‐labeled dextran (Sigma‐Aldrich, St. Louis, USA) dissolved in a culture medium at a concentration of 50 µm.
To obtain vessel parameters, confocal z‐stack images were taken of the whole chamber with an image size of 800 × 800 µm2 with 16–20 images per chamber. For image analysis, the CD‐31 channel of the image was used. In the first step, images were binarized using Fiji (see Section S6, Supporting Information, for details). The binarized image was used to determine the number of white pixels and to obtain the vessel area using a Python script. The vessel area percentage per chip was a summary of the vessel areas per image and was obtained by pixel size. The next steps were based on the Matlab (The MathWorks, Natick, USA) image processing library. The number of branches per image and the length of each branch were obtained by skeletonizing the image, identifying the branch and end points, and measuring the distance between them. The average diameter of each branch was determined by measuring the distance to the vessel wall along the skeleton. For the graphs, the mean of these values was obtained for each sample with n = 5 samples per time point.
Statistical Analysis
Statistical significance was determined with a two‐sample t‐test. Graphical data shows the mean with error bars as the standard error of the mean (SEM), with significance depicted as ns for no significance, * for p < 0.05, ** for p < 0.01, and *** for p < 0.001 with α = 0.05.
Conflict of Interest
The authors declare no conflict of interest.
Supporting information
Supporting Information
Supplemental Video 1
Supplemental Video 2
Supplemental Video 3
Supplemental Video 4
Acknowledgements
The authors kindly acknowledge the financial support by Zentrales Innovationsprogramm Mittelstand (ZIM), grant number KK5031601CS0 by the German Federal Ministry for Economic Affairs and Energy (BMWi) and LOEWE Research Initiatives Network by the German federal state of Hesse, research cluster FlowForLife. The embedded SmartDrop was leased from the Laboratory for MEMS Applications, University of Freiburg, and developed during the DoD‐BioPrint project funded by the (BMBF), project numbers 02P20E020 and 02P20E02. The authors especially thank Tobias Meckel (Macromolecular and Paper Chemistry, Technical University of Darmstadt) for the support with confocal microscopy.
Open access funding enabled and organized by Projekt DEAL.
Fritschen A., Lindner N., Scholpp S., Richthof P., Dietz J., Linke P., Guttenberg Z., Blaeser A., High‐Scale 3D‐Bioprinting Platform for the Automated Production of Vascularized Organs‐on‐a‐Chip. Adv. Healthcare Mater. 2024, 13, 2304028. 10.1002/adhm.202304028
Contributor Information
Anna Fritschen, Email: fritschen@idd.tu-darmstadt.de.
Andreas Blaeser, Email: blaeser@idd.tu-darmstadt.de.
Data Availability Statement
The data that support the findings of this study are available from the corresponding author upon reasonable request.
References
- 1. Moutinho S., Nat. Med. 2023, 29, 2151. [DOI] [PubMed] [Google Scholar]
- 2. Ewart L., Apostolou A., Briggs S. A., Carman C. V., Chaff J. T., Heng A. R., Jadalannagari S., Janardhanan J., Jang K., Joshipura S. R., Kadam M. M., Kanellias M., Kujala V. J., Kulkarni G., Le C. Y., Lucchesi C., Manatakis D. V., Maniar K. K., Quinn M. E., Ravan J. S., Rizos A. C., Sauld J. F. K., Sliz J. D., Tien‐street W., Trinidad D. R., Velez J., Wendell M., Irrechukwu O., Mahalingaiah P. K., Ingber D. E., et al., Nat Commun 2022, 2, 154. [DOI] [PMC free article] [PubMed] [Google Scholar]
- 3. Herland A., Maoz B. M., Das D., Somayaji M. R., Prantil‐Baun R., Novak R., Cronce M., Huffstater T., Jeanty S., Ingram M., Chalkiadaki A., Chou D. B., Marquez S., Delahanty A., Jalili‐Firoozinezhad S., Milton Y., Sontheimer‐Phelps A., Swenor B., Levy O., Parker K. K., Przekwas A., Ingber D. E., Nat. Biomed. Eng. 2020, 4, 421. [DOI] [PMC free article] [PubMed] [Google Scholar]
- 4. Ingber D. E., Nat. Rev. 2022, 23, 467. [DOI] [PMC free article] [PubMed] [Google Scholar]
- 5. Fritschen A., Blaeser A., Biomaterials 2020, 268, 120556. [DOI] [PubMed] [Google Scholar]
- 6. Low L., Mummery C., Berridge B. R., Austin C. P., Tagle D. A., Nat. Rev. Drug Discovery 2020, 20, 345. [DOI] [PubMed] [Google Scholar]
- 7. Halldorsson S., Lucumi E., Gómez‐Sjöberg R., Fleming R. M. T., Biosens. Bioelectron. 2015, 63, 218. [DOI] [PubMed] [Google Scholar]
- 8. Aghvami S. A., Opathalage A., Zhang Z. K., Ludwig M., Heymann M., Norton M., Wilkins N., Fraden S., Sens. Actuators, B 2017, 247, 940. [Google Scholar]
- 9. Lai B. F. L., Lu R. X. Z., Davenport Huyer L., Kakinoki S., Yazbeck J., Wang E. Y., Wu Q., Zhang B., Radisic M., Nat. Protoc. 2021, 16, 2158. [DOI] [PubMed] [Google Scholar]
- 10. Gross B. C., Erkal J. L., Lockwood S. Y., Chen C., Spence D. M., Anal. Chem. 2014, 86, 3240. [DOI] [PubMed] [Google Scholar]
- 11. Au A. K., Huynh W., Horowitz L. F., Folch A., Angew. Chem., Int. Ed. 2016, 55, 3862. [DOI] [PMC free article] [PubMed] [Google Scholar]
- 12. Ho C. M. B., Ng S. H., Li K. H. H., Yoon Y. J., Lab Chip 2015, 15, 3627. [DOI] [PubMed] [Google Scholar]
- 13. Urrios A., Parra‐Cabrera C., Bhattacharjee N., Gonzalez‐Suarez A. M., Rigat‐Brugarolas L. G., Nallapatti U., Samitier J., Deforest C. A., Posas F., Garcia‐Cordero J. L., Folch A., Lab Chip 2016, 16, 2287. [DOI] [PMC free article] [PubMed] [Google Scholar]
- 14. Lee H., Cho D. W., Lab Chip 2016, 16, 2618. [DOI] [PubMed] [Google Scholar]
- 15. Park J. Y., Ryu H., Lee B., Ha D., Ahn M., Kim S., Kim J. Y., Jeon N. L., Cho D., Biofabrication 2019, 11, 015002. [DOI] [PubMed] [Google Scholar]
- 16. Bilican I., Guler M. T., Appl. Surf. Sci. 2020, 534, 147642. [Google Scholar]
- 17. Kojic S. P., Stojanovic G. M., Radonic V., Sensors 2019, 19, 1719. [DOI] [PMC free article] [PubMed] [Google Scholar]
- 18. Lee Y., Choi J. W., Yu J., Park D., Ha J., Son K., Lee S., Chung M., Kim H. Y., Jeon N. L., Lab Chip 2018, 18, 2433. [DOI] [PubMed] [Google Scholar]
- 19. Ko J., Ahn J., Kim S., Lee Y., Lee J., Park D., Jeon N. L., Lab Chip 2019, 19, 2822. [DOI] [PubMed] [Google Scholar]
- 20. Lee S. R., Hyung S., Bang S., Lee Y., Ko J., Lee S., Kim H. J., Jeon N. L., Biofabrication 2019, 11, 035013. [DOI] [PubMed] [Google Scholar]
- 21. Kaden T., Graf K., Rennert K., Li R., Mosig A. S., Raasch M., Sci. Rep. 2023, 13, 13338. [DOI] [PMC free article] [PubMed] [Google Scholar]
- 22. Ma X., Li R., Jin Z., Fan Y., Zhou X., Zhang Y., Microsyst. Technol. 2020, 26, 1317. [Google Scholar]
- 23. Nguyen T., Vinayaka A. C., Bang D. D., Wolff A., Micromachines 2019, 10, 624.31546811 [Google Scholar]
- 24. Zhang B., Montgomery M., Chamberlain M. D., Ogawa S., Korolj A., Pahnke A., Wells L. A., Masse S., Kim J., Reis L., Momen A., Nunes S. S., Wheeler A. R., Nanthakumar K., Keller G., Sefton M. V., Radisic M., Nat. Mater. 2016, 15, 669. [DOI] [PMC free article] [PubMed] [Google Scholar]
- 25. Ewart L., Dehne E.‐M., Fabre K., Gibbs S., Hickman J., Hornberg E., Ingelman‐Sundberg M., Jang K.‐J., Jones D. R., Lauschke V. M., Marx U., Mettetal J. T., Pointon A., Williams D., Zimmermann W.‐H., Newham P., Annu. Rev. Pharmacol. Toxicol. 2018, 58, 65. [DOI] [PubMed] [Google Scholar]
- 26. Polidoro M. A., Ferrari E., Marzorati S., Lleo A., Rasponi M., Liver Int. 2021, 41, 1744. [DOI] [PubMed] [Google Scholar]
- 27. Huang Y., Zhang X. F., Gao G., Yonezawa T., Cui X., Biotechnol. J. 2017, 12, 1600734. [DOI] [PubMed] [Google Scholar]
- 28. Bishop E. S., Mostafa S., Pakvasa M., Luu H. H., Lee M. J., Wolf J. M., Ameer G. A., He T. C., Reid R. R., Genes Dis. 2017, 4, 185. [DOI] [PMC free article] [PubMed] [Google Scholar]
- 29. Miri A. K., Mostafavi E., Khorsandi D., Hu S. K., Malpica M., Khademhosseini A., Biofabrication 2019, 11, 042002. [DOI] [PMC free article] [PubMed] [Google Scholar]
- 30. Lindner N., Blaeser A., Front. Bioeng. Biotechnol. 2022, 10, 855042. [DOI] [PMC free article] [PubMed] [Google Scholar]
- 31. Ashammakhi N., Ahadian S., Xu C., Montazerian H., Ko H., Nasiri R., Barros N., Khademhosseini A., Mater. Today Bio 2019, 1, 100008. [DOI] [PMC free article] [PubMed] [Google Scholar]
- 32. Leung C. M., de Haan P., Ronaldson‐Bouchard K., Kim G. A., Ko J., Rho H. S., Chen Z., Habibovic P., Jeon N. L., Takayama S., Shuler M. L., Vunjak‐Novakovic G., Frey O., Verpoorte E., Toh Y. C., Nat. Rev. Methods Primers 2022, 2, 33. [Google Scholar]
- 33. Saharan V. A., in Computer Aided Pharmaceutics and Drug Delivery (Ed.: Saharan V.A.), Springer, New York: 2022, p. 381–414. [Google Scholar]
- 34. Stasevych M., Zvarych V., Big Data Cogn. Comput. 2023, 7, 147. [Google Scholar]
- 35. de Graaf M. N. S., Vivas A., van der Meer A. D., Mummery C. L., Orlova V. V., Micromachines 2022, 13, 1359. [DOI] [PMC free article] [PubMed] [Google Scholar]
- 36. Thompson C. L., Fu S., Knight M. M., Thorpe S. D., Front Bioeng Biotechnol 2020, 8, 602646. [DOI] [PMC free article] [PubMed] [Google Scholar]
- 37. Danku A. E., Dulf E. H., Braicu C., Jurj A., Berindan‐Neagoe I., Front Bioeng Biotechnol 2022, 10, 840674. [DOI] [PMC free article] [PubMed] [Google Scholar]
- 38. Fetah K., Tebon P., Goudie M. J., Eichenbaum J., Ren L., Barros N., Nasiri R., Ahadian S., Ashammakhi N., Dokmeci M. R., Khademhosseini A., Prog. Biomed. Eng. 2019, 1, 012001. [Google Scholar]
- 39. Deng J., Wei W., Chen Z., Lin B., Zhao W., Luo Y., Zhang X., Micromachines 2019, 10, 676. [DOI] [PMC free article] [PubMed] [Google Scholar]
- 40. Dikyol C., Altunbek M., Bartolo P., Koc B., Int. J. Bioprint. 2021, 24, e00159. [Google Scholar]
- 41. Chae S., Ha D. H., Lee H., Int. J. Bioprint. 2023, 9, 748. [DOI] [PMC free article] [PubMed] [Google Scholar]
- 42. De Lorenzi F., Hansen N., Theek B., Daware R., Motta A., Breuel S., Nasehi R., Baumeister J., Schöneberg J., Stojanović N., von Stillfried S., Vogt M., Müller‐Newen G., Maurer J., Sofias A. M., Lammers T., Fischer H., Kiessling F., Adv. Mater. 2024, 36, 2303196. [DOI] [PubMed] [Google Scholar]
- 43. Liu X., Wang X., Zhang L., Sun L., Wang H., Zhao H., Zhang Z., Liu W., Huang Y., Ji S., Zhang J., Li K., Song B., Li C., Zhang H., Li S., Wang S., Zheng X., Gu Q., Adv. Healthcare Mater. 2021, 10, 2101405. [DOI] [PubMed] [Google Scholar]
- 44. Lee V. K., Kim D. Y., Ngo H., Lee Y., Seo L., Yoo S. S., Vincent P. A., Dai G., Biomaterials 2014, 35, 8092. [DOI] [PMC free article] [PubMed] [Google Scholar]
- 45. Maji S., Lee M., Lee J., Lee J., Lee H., Mater. Today Bio 2023, 21, 100723. [DOI] [PMC free article] [PubMed] [Google Scholar]
- 46. Kang D., Hong G., An S., Jang I., Yun W. S., Shim J. H., Jin S., Small 2020, 16, 1905505. [DOI] [PubMed] [Google Scholar]
- 47. Dibble M., Di Cio’ S., Luo P., Balkwill F., Gautrot J. E., Sci. Rep. 2023, 13, 5729. [DOI] [PMC free article] [PubMed] [Google Scholar]
- 48. Wang X., Phan D. T. T., Sobrino A., George S. C., Hughes C. C. W., Lee A. P., Lab Chip 2016, 16, 282. [DOI] [PMC free article] [PubMed] [Google Scholar]
- 49. Vajda J., Milojević M., Maver U., Vihar B., Biomedicines 2021, 9, 589. [DOI] [PMC free article] [PubMed] [Google Scholar]
- 50. Paek J., Park S. E., Lu Q., Park K. T., Cho M., Oh J. M., Kwon K. W., Yi Y. S., Song J. W., Edelstein H. I., Ishibashi J., Yang W., Myerson J. W., Kiseleva R. Y., Aprelev P., Hood E. D., Stambolian D., Seale P., Muzykantov V. R., Huh D., ACS Nano 2019, 13, 7627. [DOI] [PubMed] [Google Scholar]
- 51. Winkelman M. A., Kim D. Y., Kakarla S., Grath A., Silvia N., Dai G., Lab Chip 2022, 22, 170. [DOI] [PMC free article] [PubMed] [Google Scholar]
- 52. Offeddu G. S., Haase K., Gillrie M. R., Li R., Morozova O., Hickman D., Knutson C. G., Kamm R. D., Biomaterials 2019, 212, 115. [DOI] [PubMed] [Google Scholar]
- 53. Fritschen A., Acedo Mestre M., Scholpp S., Blaeser A., Front. Bioeng. Biotechnol. 2023, 11, 1093101. [DOI] [PMC free article] [PubMed] [Google Scholar]
- 54. Morin K. T., Tranquillo R. T., Exp. Cell Res. 2013, 319, 2409. [DOI] [PMC free article] [PubMed] [Google Scholar]
- 55. Kosyakova N., Kao D. D., Figetakis M., López‐Giráldez F., Spindler S., Graham M., James K. J., Won Shin J., Liu X., Tietjen G. T., Pober J. S., Chang W. G., npj Regen. Med. 2020, 5, 1. [DOI] [PMC free article] [PubMed] [Google Scholar]
- 56. Sobrino A., Phan D. T. T., Datta R., Wang X., Hachey S. J., Romero‐López M., Gratton E., Lee A. P., George S. C., Hughes C. C. W., Sci. Rep. 2016, 6, 31589. [DOI] [PMC free article] [PubMed] [Google Scholar]
- 57. Phan D. T. T., Wang X., Craver B. M., Sobrino A., Zhao D., Chen J. C., Lee L. Y. N., George S. C., Lee A. P., Hughes C. C. W., Lab Chip 2017, 17, 511. [DOI] [PMC free article] [PubMed] [Google Scholar]
- 58. Kim S., Chung M., Ahn J., Lee S., Jeon N. L., Lab Chip 2016, 16, 4189. [DOI] [PubMed] [Google Scholar]
- 59. Fritschen A., Bell A. K., Königstein I., Stark R. W., Blaeser A., Biomater. Sci. 2022, 10, 1981. [DOI] [PubMed] [Google Scholar]
- 60. Miri A. K., Mirzaee I., Hassan S., Mesbah Oskui S., Nieto D., Khademhosseini A., Zhang Y. S., Lab Chip 2019, 19, 2019. [DOI] [PMC free article] [PubMed] [Google Scholar]
- 61. Blaeser A., Duarte Campos D. F., Fischer H., Curr. Opin. Biomed. Eng. 2017, 2, 58. [Google Scholar]
- 62. Zandrini T., Florczak S., Levato R., Ovsianikov A., Trends Biotechnol. 2023, 41, 604. [DOI] [PubMed] [Google Scholar]
- 63. Agha A., Waheed W., Alamoodi N., Mathew B., Alnaimat F., Abu‐Nada E., Abderrahmane A., Alazzam A., Macromol. Mater. Eng. 2022, 307, 2200053. [Google Scholar]
- 64. Bruijns B., Veciana A., Tiggelaar R., Gardeniers H., Biosensors 2019, 9, 85. [DOI] [PMC free article] [PubMed] [Google Scholar]
- 65. Pirl U., Nachr. Ges. Wiss. Goettingen, Math.‐Phys. Kl. 1967, 40, 111. [Google Scholar]
- 66. Wan H. Y., Chen J. C. H., Xiao Q., Wong C. W., Yang B., Cao B., Tuan R. S., Nilsson S. K., Ho Y. P., Raghunath M., Kamm R. D., Blocki A., Biomater. Res. 2023, 27, 32. [DOI] [PMC free article] [PubMed] [Google Scholar]
- 67. Yue T., Zhao D., Phan D. T. T., Wang X., Park J. J., Biviji Z., Hughes C. C. W., Lee A. P., Microsyst. Nanoeng. 2021, 7, 4. [DOI] [PMC free article] [PubMed] [Google Scholar]
- 68. Rambøl M. H., Han E., Niklason L. E., Tissue Eng., Part A 2020, 26, 556. [DOI] [PMC free article] [PubMed] [Google Scholar]
- 69. Zhang K., Du Z., Yuan T., Huang J., Zhao X., Mi S., Biomicrofluidics 2022, 16, 044101. [DOI] [PMC free article] [PubMed] [Google Scholar]
- 70. Newman A. C., Chou W., Welch‐Reardon K. M., Fong A. H., Popson S. A., Phan D. T., Sandoval D. R., Nguyen D. P., Gershon P. D., Hughes C. C. W., Arterioscler. Thromb. Vasc. Biol. 2013, 33, 513. [DOI] [PMC free article] [PubMed] [Google Scholar]
- 71. Luckert C., Schulz C., Lehmann N., Thomas M., Hofmann U., Hammad S., Hengstler J. G., Braeuning A., Lampen A., Hessel S., Arch. Toxicol. 2017, 91, 393. [DOI] [PubMed] [Google Scholar]
- 72. Chen L., Ma H., Li K., Song X., Zeng X., Mater. Sci. Eng., C 2021, 126, 112119. [DOI] [PubMed] [Google Scholar]
- 73. Cui J., Wang H., Zheng Z., Shi Q., Sun T., Huang Q., Fukuda T., Biofabrication 2019, 11, 015016. [DOI] [PubMed] [Google Scholar]
- 74. Li Y., Zhang T., Pang Y., Li L., Chen Z. N., Sun W., Biofabrication 2019, 11, 034102. [DOI] [PubMed] [Google Scholar]
- 75. Mao S., He J., Zhao Y., Liu T., Xie F., Yang H., Mao Y., Pang Y., Sun W., Biofabrication 2020, 12, 045014. [DOI] [PubMed] [Google Scholar]
- 76. Christoffersson J., Aronsson C., Jury M., Selegård R., Aili D., Mandenius C. F., Biofabrication 2019, 11, 015013. [DOI] [PubMed] [Google Scholar]
- 77. Ma C., Peng Y., Li H., Chen W., Trends Pharmacol. Sci. 2021, 42, 119. [DOI] [PMC free article] [PubMed] [Google Scholar]
- 78. Taymour R., Chicaiza‐Cabezas N. A., Gelinsky M., Lode A., Biofabrication 2022, 14, 045019. [DOI] [PubMed] [Google Scholar]
- 79. Pimentel C R., Ko S. K., Caviglia C., Wolff A., Emnéus J., Keller S. S., Dufva M., Acta Biomater. 2018, 65, 174. [DOI] [PubMed] [Google Scholar]
- 80. Taymour R., Kilian D., Ahlfeld T., Gelinsky M., Lode A., Sci. Rep. 2021, 11, 5130. [DOI] [PMC free article] [PubMed] [Google Scholar]
- 81. Cuvellier M., Ezan F., Oliveira H., Rose S., Fricain J. C., Langouët S., Legagneux V., Baffet G., Biomaterials 2021, 269, 120611. [DOI] [PubMed] [Google Scholar]
- 82. Ma X., Qu X., Zhu W., Li Y. S., Yuan S., Zhang H., Liu J., Wang P., Lai C. S. E., Zanella F., Feng G. S., Sheikh F., Chien S., Chen S., Proc. Natl. Acad. Sci. U. S. A. 2016, 113, 2206. [DOI] [PMC free article] [PubMed] [Google Scholar]
- 83. Miranda R. G., Ferraz E. R. A., Pereira L. C., Dorta D. J., in Toxicity Assessment: Methods and Protocols, Humana Press, New York: 2021, pp. 197–206. [Google Scholar]
- 84. Wang E., Andrade M. J., Smith Q., Biomicrofluidics 2023, 17, 064108. [DOI] [PMC free article] [PubMed] [Google Scholar]
- 85. Nashimoto Y., Okada R., Hanada S., Arima Y., Nishiyama K., Miura T., Yokokawa R., Biomaterials 2020, 229, 119547. [DOI] [PubMed] [Google Scholar]
- 86. Hu Z., Cao Y., Galan E. A., Hao L., Zhao H., Tang J., Sang G., Wang H., Xu B., Ma S., ACS Biomater. Sci. Eng. 2022, 8, 1215. [DOI] [PubMed] [Google Scholar]
- 87. Li Q., Niu K., Wang D., Xuan L., Wang X., Lab Chip 2021, 22, 2682. [DOI] [PubMed] [Google Scholar]
- 88. Wan Z., Floryan M. A., Coughlin M. F., Zhang S., Zhong A. X., Shelton S. E., Wang X., Xu C., Barbie D. A., Kamm R. D., Adv. Healthcare Mater. 2023, 12, 2201784. [DOI] [PMC free article] [PubMed] [Google Scholar]
- 89. Tevlek A., Kecili S., Ozcelik O. S., Kulah H., Tekin H. C., ACS Omega 2022, 8, 3630. [DOI] [PMC free article] [PubMed] [Google Scholar]
Associated Data
This section collects any data citations, data availability statements, or supplementary materials included in this article.
Supplementary Materials
Supporting Information
Supplemental Video 1
Supplemental Video 2
Supplemental Video 3
Supplemental Video 4
Data Availability Statement
The data that support the findings of this study are available from the corresponding author upon reasonable request.


