

Abstract
Artificial multicellular systems are gaining importance in the field of tissue engineering and regenerative medicine. Reconstruction of complex tissue architectures in vitro is nevertheless challenging, and methods permitting controllable and high‐throughput fabrication of complex multicellular architectures are needed. Here, a facile and high‐throughput method is developed based on a tunable droplet‐fusion technique, allowing programmed assembly of multiple cell spheroids into complex multicellular architectures. The droplet‐fusion technique allows for construction of various multicellular architectures (double‐spheroids, multi‐spheroids, hetero‐spheroids) in a miniaturized high‐density array format. As an example of application, the propagation of Wnt signaling is investigated within hetero‐spheroids formed from two fused Wnt‐releasing and Wnt‐reporter cell spheroids. The developed method provides an approach for miniaturized, high‐throughput construction of complex 3D multicellular architectures and can be applied for studying various biological processes including cell signaling, cancer invasion, embryogenesis, and neural development.
Keywords: droplet merging, droplet microarrays, high‐throughput methods, multicellular architectures, spheroids
Artificial multicellular systems allow biological structures and behavior to be reconstituted in vitro in the field of tissue engineering and regenerative medicine. In this work, a programmable droplet merging method is demonstrated for high‐throughput generation of complex multi‐spheroidal cellular architectures. The potential of this methodology is validated by studying the propagation of Wnt signaling within hetero‐spheroids.
Reproduction of native tissues in vitro is important as a tool, as it both enables investigation of fundamental biological processes, and drug and toxicity screenings. In order to closely mimic complex tissues in vitro, artificial multicellular systems are created from different cell types in spatially ordered structures or well‐defined geometries in a 3D microenvironment.[ 1 , 2 , 3 ] These systems can be built from building blocks[ 4 , 5 , 6 , 7 ] such as cell sheets,[ 8 ] cell‐laden microgels,[ 5 ] cell spheroids,[ 9 ] and organoids.[ 10 , 11 ] Precise control of cellular composition and spatial distribution of building blocks within artificial multicellular systems allows for reconstitution of native tissues in their healthy and disease state in vitro.[ 12 ]
There are a number of methodologies developed for fabrication of complex 3D cell systems in vitro.[ 3 , 4 , 5 , 6 , 7 , 13 , 14 ] Directed assembly allows manual positioning or stacking building blocks to form 3D architectures.[ 15 , 16 ] Birey et al. applied this method for fusion of two forebrain organoids in order to mimic the human brain development and demonstrate inter‐neuronal migration.[ 15 ] The method of directed assembly is, however, manual and not compatible with high throughput. Remote assembly, such as, acoustic node,[ 14 , 17 ] magnetic cell levitation,[ 13 , 18 ] optical tweezers,[ 19 ] or laser‐guided direct writing,[ 20 ] can achieve assembly of cells or spheroids against gravity or viscous forces. Chen et al. demonstrated the assembly of hepatic organoids by an acoustic node technique, and the technique was able to achieve formation of bile canaliculi networks resembling native hepatic tissue.[ 17 ] Souza et al. used magnetic cell levitation to manipulate a glioblastoma cell spheroid, and a human astrocyte spheroid in order to create a cell invasion model.[ 18 ] These methods depend on sophisticated equipment, paramagnetic media, or introduce a risk of laser‐induced cell damage. Another common strategy used to fabricate multicellular architecture is assembly of cell‐laden hydrogels or microgels,[ 5 , 21 , 22 ] or cell seeding on scaffolds.[ 7 , 23 ] However, these biomaterial‐based methods failed to provide high cell packing density. The use of artificial scaffolds or gel matrices additionally lead to disadvantages for constructing 3D tissue models due to their influence on cell–cell interactions, autocrine, and paracrine signaling. 3D printing[ 3 ] is a promising method for designing and achieving multicellular architectures, but it is relatively slow, not always compatible with high throughput and relies on printable bio‐inks for maintaining 3D structure and cell viability.
In spite of advancements in methods for in vitro 3D tissue modelling, most of them do not meet the requirements for high‐throughput and miniaturization and are associated with high consumption of both costly reagents and potentially limited types of cells. A platform enabling controllable fabrication of complex artificial multicellular systems from matrix‐free “building blocks” in a high‐throughput miniaturized format is crucial to realize studies and screenings of various biological processes, such as cell signaling, paracrine signaling, cell–cell interactions or drug response, using physiologically more relevant cell culture models.[ 12 , 24 ]
Recently we developed the droplet microarray (DMA) platform,[ 25 , 26 , 27 ] which enables fabrication of nanoliter droplet microarrays where the shape, size and density of droplets depend on the design of hydrophilic patterns surrounded by the superhydrophobic barriers. The DMA platform enables cultivation and high throughput screening of various cell types in hundreds of individual nanoliter droplets functioning as independent miniaturized habitats.[ 28 ] Furthermore, the DMA was recently demonstrated for facile generation of cell spheroids utilizing hanging drop method.[ 27 ]
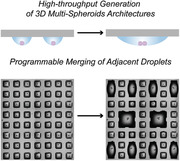
Here, we hypothesized that due to the absence of physical solid barriers between the droplets, which usually separate cell reservoirs in microtiter plates; it should be possible to merge neighboring droplets of interest in a controlled and non‐contact way by increasing the volume of neighboring droplets using a non‐contact liquid dispenser. Such a process could be additionally controlled by altering the size and distance between the hydrophilic spots on the DMA and should enable controlled non‐contact merging of neighboring cell compartments in a high‐throughput way. Utilizing these properties of the DMA platform, we demonstrate PROgrammable Merging of Adjacent Droplets (proMAD method) to generate microarrays of multi‐spheroid architectures with new geometries by fusing two or more neighboring droplets containing cell spheroids. The proMAD method is scaffold‐free and can be automated to form arrays of spheroid assemblies in a high throughput and miniaturized way to address the complex nature of cellular mechanisms used in cell–cell communication. Here, we used the proMAD method to investigate the propagation of Wnt signaling within hetero‐spheroid 3D architectures.
High throughput preparation of single cell spheroids on the DMA platform was performed using the method of hanging droplets as previously described.[ 27 ] In this work, we used DMA consisting of 14 × 14 hydrophilic spots (1 mm × 1 mm each) with a distance between spots of 500 µm (Figure 1 and Figure S1, Supporting Information). Arrays of droplets in volumes ranging from 50 to 300 nL were obtained using a non‐contact low volume liquid dispenser (I‐DOT, see the Experimental Section). In order to generate cell spheroids on the DMA, HepG2 cells were dispensed in 200 nL droplets on the DMA (Figure 1a). Afterward the DMA containing cells was immediately inverted, resulting in gravity‐driven aggregation of the cells at the droplet‐air interface. After 2 days of culturing in this format, single HepG2 spheroids were formed spontaneously in every individual hanging droplet (Figure 1b). We were able to control the diameter of spheroids, ranging from 30 to 150 µm, on the DMA slide by dispensing different number of cells into individual droplets (Figure S2, Supporting Information). In order to characterize the spheroids grown on the DMA platform, we measured and calculated their circularity, aspect ratio, roundness, and solidity (Figure S3 and Table S1, Supporting Information).[ 29 ] The measured values for roundness and solidity were close to 1 for all spheroid sizes. For example, HepG2 spheroids containing 400 cells showed a roundness value of 0.87 ± 0.08 and solidity of 0.96 ± 0.01 after 5 days of culturing (Figure S3 and Table S1, Supporting Information). This indicates that formed 3D cell structures are tight and round‐shaped spheroids.
Figure 1.
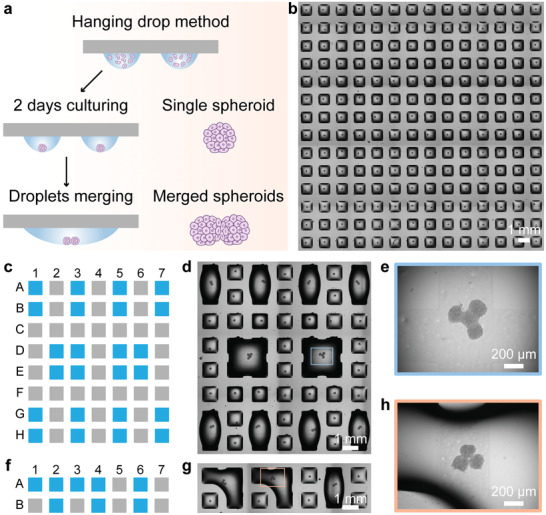
Programmable merging of adjacent droplets (proMAD). a) Schematic of the hanging drop method to form arrays of cell spheroids using the miniaturized droplet microarrays (DMA) with hydrophilic spots divided by superhydrophobic borders. To realize the programmable assembly of spheroids, the droplets are merged by increasing volumes of neighboring droplets. b) Microscopy image of a 14 × 14 array of single HepG2 spheroids. c,f) The printing scheme for controllable merging of multiple droplets on the DMA. The following printing volumes were used: 900 nL per droplet for fusing 2 or 4 droplets; 850 nL per droplet for fusing 3 droplets together (blue spots in (c) and (f)). d,g) Microscopy images of the DMA containing 2, 3, and 4 merged droplets containing spheroids. e,h) Images of 4 spheroids and 3 spheroids in merged droplets after 24 h fusion.
The proMAD method is based on dispensing additional volume of cell culture medium into individual neighboring droplets and their controlled fusion across the superhydrophobic barriers (Figure 1). Typically, the droplets of 200 nL volume are well confined and stable on hydrophilic square spots of 1 × 1 mm separated by 500 µm superhydrophobic border. Addition of 900 nL of medium into each neighboring 200 nL droplet (i.e., 1100 nL in total in each spot) leads to a spontaneous merging of the adjacent droplets into a new large droplet strongly adhered to the two hydrophilic spots (Figure 1). After merging the droplets, the DMA slide was inverted again for culturing, bringing the two previously separated spheroids into contact at the base of the droplet, and resulting in their adhesion and fusion into a multi‐spheroidal complex (Figure 1a). Similarly, we were able to merge more than two droplets by increasing the volume of multiple neighboring droplets (Figure 1c–h). Interestingly, this leads to the formation of fused spheroids composed of multiple individual cell spheroids.
Figure 2a shows the possible combinations of various spheroid‐complexes. We defined the term “binding number” to describe the number of contact sites each single spheroids with neighboring spheroids during the fusion process (the number shown in each spheroid on schematic representation in Figure 2a). The number of “constitutional isomers” of merged spheroids and combination probabilities were counted by simulation algorithms (Note S1, Figures S4 and S5, Table S2, Supporting Information) and experimental results. For example, for the fusion of 3 spheroids upon merging 3 droplets, there are two possibilities of forming spheroid‐complex. The three spheroids may either combine in a linear cluster with binding numbers 1, 2, 1 (Figure 2a, named A1A2A1), or in a triangle cluster with a binding number of 2 for each individual spheroid (named A2A2A2). We statistically quantified the combination probabilities of “constitutional isomers” of merged spheroids. The experimental probabilities were ≈61% and ≈39% for linear combination A1A2A1 and triangle structure A2A2A2, respectively. The probabilities obtained by the simulation algorithm are ≈85% and ≈15%, respectively, assuming the same contact probability for the spheres. As another example, the quaternary spheroids with a tetrahedral structure (A3A3A3A3) given by simulation has a probability of 0.3%, and we did not find such a configuration experimentally.
Figure 2.
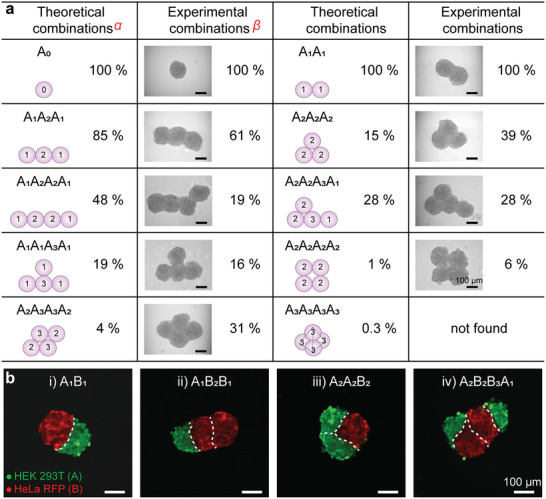
Examples of multispheroid architectures formed by the proMAD method. a) Schematic representation, probabilities and corresponding examples of different HepG2 multispheroids. “Binding numbers” corresponding to number of binding sites between individual spheroids of the complex are shown in each spheroid on the schemes. α, In the theoretical models, the cell spheroids were treated as spheres and the combined probability was given by a simulation algorithm (Figures S4 and S5, Supporting Information). β, The combined probability is derived from experimental statistics (3 spheroids, n = 33 and 4 spheroids, n = 32). b) Fluorescence microscopy images of hetero‐spheroid architectures built from two different cell lines (HeLa cells expressing RFP and HEK 293T stained with green fluorescent 5‐chloromethylfluorescein diacetate) 24 h post merging: A1B1, A1B2B1, A2A2B2, and A2B2B3A1.
In addition to fusing variable number of homologous spheroids, it is also possible to fuse spheroids formed from different cell types (Figure 2b). In multicellular organisms, tissues are composed of multiple cell types with spatial organization that work together to perform specific functions. In order to achieve such heterogeneous multi‐spheroids, we dispensed two different cell types, HeLa cells expressing red fluorescent protein (RFP) and HEK 293T stained with a green fluorescent dye (5‐chloromethylfluorescein diacetate), into neighboring droplets (Figure S6, Supporting Information). After two days of cultivation, both HEK 293T and HeLa RFP spheroids were formed on the DMA and were merged pairwise using the proMAD method. Figure 2b demonstrates examples of hetero‐spheroids formed from merging two, three and four spheroids of HEK and HeLa cells in different combinations, including A1B1 double spheroid, A1B2B1, A2A2B2 ternary spheroids, and A2B2B3A1 quaternary spheroids. Figure 2b shows that even after 24 h of the fusion process there is a clear boundary between the two cell types in the hetero‐spheroids. Thus, the proMAD method enables controllable assembly of individual spheroids by merging specific number of neighboring droplets generating multi‐spheroid aggregates, as well as hetero‐spheroid architectures in an array format.
In order to observe the process of spheroids’ fusion, we have monitored two spheroids combined in one droplet by microscopy at defined time points during 5 days after merging the droplets (Figure 3a). Two HepG2 spheroids first fused into a peanut‐shaped structure followed by forming a solid fused oval structure from 24 to 96 h after merging the droplets (Figure 3a). Live–dead staining using Calcein‐AM (live cells) and PI (dead cells) of obtained double‐spheroids showed high cell viability within the spheroids (Figure S7, Supporting Information).
Figure 3.
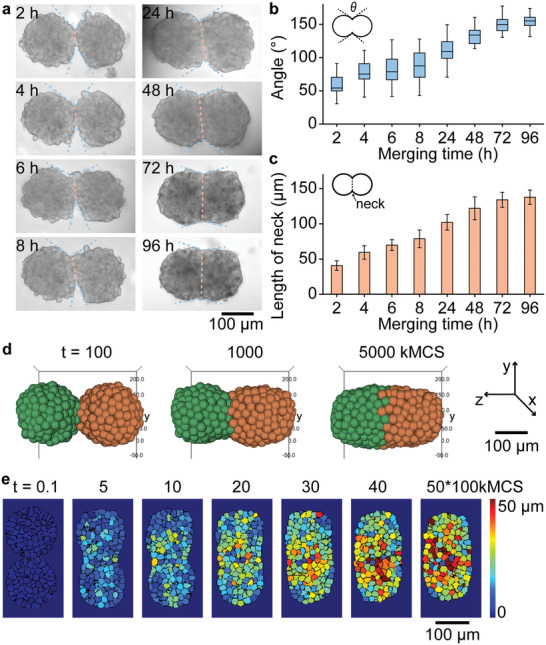
Experimental and simulation study of the fusion process of two cell spheroids. a) Bright‐field microscopy images of two HepG2 spheroids fusing over 96 h after the initial contact. b) Plot of the included angles between merged spheroids over time. The angles are shown by the blue dotted line in (a). c) The plot showing the length of the neck (orange dotted line shown in (a)) of merging spheroids over the time. The error bars in (b) and (c) represent SD from 10 different merged spheroids. d) 3D simulation of the fusion process of two spheroids (spheroid diameter, 150 µm, 400 cells). e) Heat maps show spatiotemporal movement of individual cells during the fusion process. The color map indicates the displacement of each cell compared to its initial position (t = 0). The kMCS is time scale, and stands for kilo Monte Carlo Sweeps.
To describe the fusion process, we have measured the tangent angles at the fusion points between two merged spheroids (Figure 3a, dashed blue lines, see the Experimental Section). Two hours post merging, the shapes of two original spheroids were still clearly recognizable and the angles between the two spheroids varied from 57° ± 16° to 154° ± 11° (Figure 3a,b). After 48 h of co‐culture, the angles between the two spheroids were above 110° gradually approaching 180° by complete fusion at 96 h post‐merging (Figure 3a,b). The length of the merged region that we refer to as “neck” (Figure 3a, dashed orange lines), between two spheroids was around 40.7 ± 6.8 µm 2 h post‐fusion and gradually increased to 138 ± 10 µm at 96 h after merging (Figure 3c).
We also use a cell–cell interaction model to simulate the fusion process of two spheroids (Figure 3d, Note S2, Supporting Information).[ 30 ] We use two 150 µm cell spheroids composed of 400 cells with cell–cell adhesive interactions to simulate the fusion process (Table S3, Supporting Information). The simulated deformation of double spheroids during the fusion process is consistent with the experimental results. The simulation also confirms that both the tangent angles at the fusion points between two merged spheroids and the lengths of the “neck” gradually increase during fusion process (Figure S8, Supporting Information). The heat map (Figure 3e) shows the relative displacement of individual cells during fusion, demonstrating that the cells in spheroids have been redistributed to form new oval structures. The total length of the double‐spheroid reduced by ≈18% (296 ± 14 to 242 ± 11 µm, and Figure S9, Supporting Information) 96 h post‐fusion and by ≈12% in our experiment and simulation, respectively. Thus, the merged spheroids were gradually fusion into one using the proMAD method, and the fusion process can be visualized by combining with an online microscope.
Using DAPI staining followed by microscopy, we observed clear elongation of a significant number of cell nuclei at the interface region between two merged spheroids 24 h after start of co‐culture (Figure S10, Supporting Information). The aspect ratio of cell nuclei was determined as the ratio of the long axis to the short axis of the ellipse circumscribed around the nuclei. The nuclei within the merged region of fused spheroids had bigger aspect ratio of 1.9 ± 0.3 compared to the aspect ratio of 1.1 ± 0.1 of nuclei in the center of individual spheroids (Figure S10a–c, Supporting Information), indicating statistically significant elongation of nuclei in the merging region during fusion process.[ 16 , 31 ]
In order to observe if cells in the merging region between two spheroids form comparable cell–cell contacts as within the original spheroids, we performed immunostaining of fused spheroids for E‐cadherin (Figure 4a). The cell surface adhesion protein E‐cadherin was used to visualize cell adhesion and cellular junctions.[ 32 ] Formation of cell–cell junctions, not only within individual spheroids, but also between the two merged spheroids, as confirmed by the homogeneous E‐cadherin throughout the whole fused double spheroid (Figure 4a), indicates the biological fusion of spheroids instead of physisorption.
Figure 4.
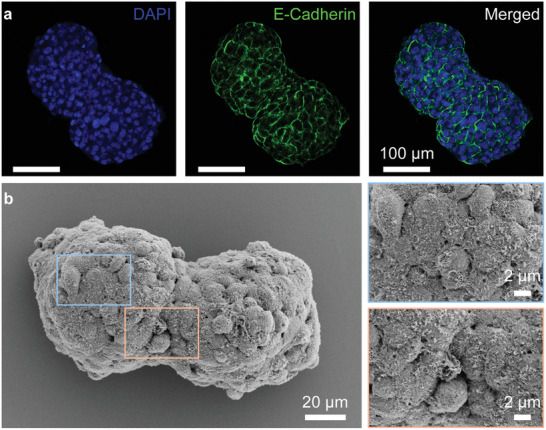
The cell–cell interactions within multi‐spheroid architectures. a) Fluorescence microscopy images of two HepG2 spheroids 24 h after fusion. E‐cadherin staining (green fluorescence) visualizes intercellular junction. DAPI (blue fluorescence) presents the cell nuclei. Merged: overlay of DAPI, E‐Cadherin staining. b) The SEM images of merged spheroids (HepG2, 24 h after fusion). Left image was taken at 2000X magnification. Upper right image (blue box) at 7000× magnification showed cell–cell contacts in individual spheroid. Bottom right image (orange box) at 7000× magnification showed the contact “neck” region of the double‐spheroids.
We have also imaged the fused spheroids using scanning electron microscopy (SEM) in order to visualize the morphology of two fused spheroids and the interface between two spheroids (Figure 4b). The SEM imaging confirmed the formation of the initial “peanut” shaped fusion complex and tight interaction between cells at the interface of the individual spheroid. Therefore, these results indicate that the multi‐spheroidal 3D architectures obtained by our method had tight cell–cell contacts between spheroids.
In this part, we demonstrate the power and potential of the proMAD method for the investigation of signaling process using the example of Wnt signaling. Wnt signaling is a cell to cell communication network that is crucially important for multiple biological processes during development and in adult homeostasis, and is highly relevant for disease progression, including cancer.[ 33 ] It remains highly debated how Wnt signals are propagated. Different mechanisms have been proposed to explain how lipophilic Wnt proteins, secreted from spatially localized cell populations, activate signaling in cells located several cell diameters away from their production source.[ 34 , 35 , 36 ] Wnt signaling between two different cell populations was previously investigated in a 2D in vitro model where cells releasing Wnt were physically separated from a layer of reporter cells in adjacent compartments.[ 37 ] Such 2D model has, however, its limitations including different behavior of cells cultured as a 2D layer. It would therefore be beneficial to develop controllable 3D cellular systems for the study of various signaling processes, including Wnt signaling. We have used the proMAD method to study Wnt signaling propagation between 3D cell aggregates. We used two different cell types for the formation of spheroids: first, a cell line expressing and secreting Wnt‐3a proteins (HEK 293T, Wnt‐3a), and second, a cell line harboring a TOP‐GFP fluorescent reporter (HEK 293T, TOP‐GFP) for monitoring activation of Wnt signaling in these cells.[ 38 , 39 , 40 , 41 ]
In order to allow the controlled fusion of spheroids formed from these two types of cells, an array containing Wnt producing spheroids as well as Wnt reporter spheroids was generated (see Experimental Section). As described above, we print these two cell lines (200 cells in each spot) into neighboring droplets of DMA at the same time, and culture them for 2 days to obtain spheroids using the hanging drop method. We then fused the Wnt producing spheroids (HEK 293T, Wnt‐3a) with the reporter spheroids (HEK 293T, TOP‐GFP) using the proMAD method (Figure 5a). Wnt signaling activity was monitored 24 and 48 h post‐fusion by measuring fluorescence intensities in the TOP‐GFP reporter spheroids (Figure 5b). The mean fluorescence intensity of reporter spheroids was 45.3 ± 10.0 after 24 h of co‐culture, and 58.3 ± 5.7 after 48 h of co‐culture (Figure 5b). After 48 h of co‐culture the entire reporter spheroid showed homogeneous GFP fluorescence, indicating robust activation of Wnt signaling in all cells of the spheroid (Figure 5c‐i,ii). To account for non‐specific background activation of Wnt signaling in the TOP‐GFP Wnt reporter spheroids, TOP‐GFP fluorescence was measured in the presence of control HEK 293T cell spheroids, which do not express Wnt‐3a (Figure 5c‐i). The control experiment showed only weak GFP intensity (Figure 5c‐i,ii),[ 39 , 40 ] with the mean fluorescence intensities of 3.0 ± 1.1 and 2.9 ± 0.9, 24 and 48 h post‐fusion, respectively. The fluorescence intensities of TOP‐GFP Wnt reporter spheroids increased ≈15‐fold (24 h) and ≈20‐fold (48 h) in the presence of Wnt‐3a compared to the control spheroids.
Figure 5.
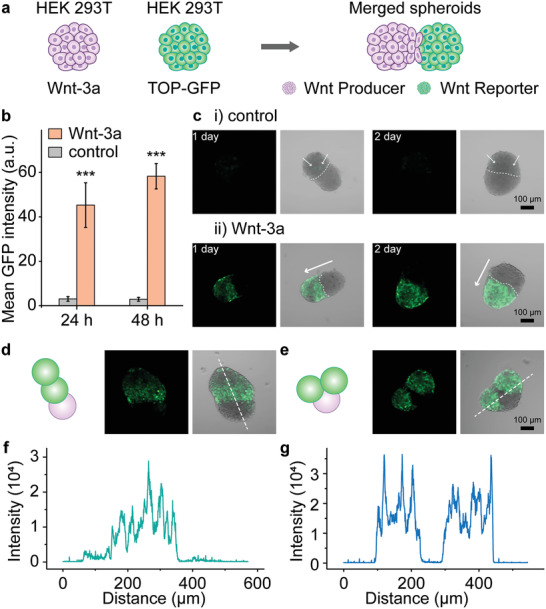
Wnt signaling between merged spheroids. a) Schematic representation of Wnt‐signaling propagation system using a multi‐spheroid complex of producer spheroids (HEK 293T, Wnt‐3a) and reporter spheroids (HEK 293T, TOP‐GFP). b) A graph showing the activation of reporter spheroids. Activation was estimated by the intensity of GFP fluorescence in confocal images. (The GFP intensities were calculated from at least 10 merged spheroids. ***, P < 0.001, One‐way ANOVA) c) Confocal images showing the activation of Wnt/β‐catenin signaling in the reporter spheroids estimated by GFP fluorescence. i) Merged spheroids of HEK 293T spheroid (control) and reporter spheroid. The white arrows point weak GFP fluorescence. ii) Merged spheroids of one Wnt producer spheroid (HEK 293T) and one Wnt reporter spheroid (HEK 293T, TOP‐GFP). The white arrows point direction of Wnt propagation. d,e) Schematic representation and fluorescence microscopy images of two studied triple spheroids with one Wnt producer spheroid (HEK 293T) and two Wnt reporter spheroids (HEK 293T, TOP‐GFP). f) A graph showing a profile of GFP intensities along white dashed line of the triple spheroid shown in (d). g) A graph showing profile of GFP fluorescence intensities along the white dashed line of the triple spheroid shown in (e).
We next tested the propagation of Wnt signaling within a triple spheroid‐complex, after merging two reporter spheroids with one Wnt‐3a producing spheroid followed by selection of two different fused spheroid architectures for analysis. In the first architecture, the two reporter spheroids were arranged in a linear structure with the Wnt producing spheroid located at one end (Figure 5d). The reporter spheroid directly adjacent to the Wnt producing one was strongly activated, whereas the distally located reporter spheroid was less strongly activated (Figure 5d,f). In the second combination, the two reporter spheroids were located on each side of the producer spheroid, showing strong activation of both reporter spheroids to an equal extent (Figure 5e,g). The GFP fluorescence activation was measured 48 h post‐fusion and the overall distance of Wnt‐3a signal propagation between spheroids was 103 ± 21 µm.
These results clearly demonstrate that long‐range Wnt signaling between adjacent cell populations takes place and can be quantified and further studied using proMAD method and open the possibility of follow‐up studies in diverse fields ranging from basic biology to cancer research. In summary, we have shown that proMAD method is a powerful tool for studying Wnt cell signaling in 3D cell culture models, which is beneficial in comparison to traditional 2D system.
In this study, we have established a proMAD method based on a highly miniaturized droplet microarray (DMA) platform. The droplet microarray is a planar array of hydrophilic spots located on a superhydrophobic background and allows for the formation of an open array of hundreds of nanoliter droplets, containing uniform 3D cell spheroids in each droplet. Using standard low volume liquid dispenser, the proMAD method enables controlled merging from 2 up to 6 neighboring nanoliter droplets, resulting in the on‐demand fusion of the individual cell spheroids into complex 3D cellular architectures. An advantage of our method, compatible with the array format, is the possibility of controlled and precise formation of multispheroid 3D cellular architectures in a high‐throughput manner. We showed that fused multispheroids develop mature cell–cell contacts at the interface between the individual spheroids and develop into single merged 3D cell architecture within a few days after merging. We have demonstrated the possibility of obtaining complex multi‐spheroidal cellular architectures from both homogeneous spheroids and heterogeneous spheroids.
The proMAD method offers a unique combination of advantages in comparison to existing methods for 3D cell culture. 1) It is a high throughput approach and can be used to form complex multicellular architectures in parallel. 2) It is a miniaturized method, where formation of spheroids takes place in 200 nL droplets and requires only 50 to 400 cells per spots (Figure S2, Supporting Information). Miniaturization not only enables reduction of the costs, but also permits high throughput experiments using rare and limited cell types, such as, stem cells, or primary patient‐derived cells. 3) The proMAD method is fast and formation of complex multi‐spheroidal structures can be achieved within 3 days. The ability to reduce the time and number of operations required for the experiments is important for all kinds of applications, but especially it makes a difference in the context of personalized testing on patient material, where time is crucial for making a decision on a therapy. 4) The proMAD method is based on an open droplet microarray platform, which is easily accessible for manipulations. This enables creation of different types of assays, where different factors of interest can be added at desired locations and at different time points of the experiments, and where the structure of interest can be retrieved easily after the experiment. 5) It is compatible with microscopy of any kind, opening numerous opportunities for high content screenings, end‐point assays and real‐time parallel monitoring of changes in 3D multicellular structures. 6) The proMAD methodology is scaffold‐free and does not require additional components like Matrigel,[ 42 ] hydrogels,[ 5 ] or 3D scaffolds[ 23 , 43 ] which might influence the cellular system under investigation. Also, unlike microfluidic devices, the spheroid architectures do not require organic oils or surfactants for stabilization.[ 44 ] Our system is, therefore, biomaterials‐free and consists of pure multicellular architectures, allowing for reproduction of 3D cell structures based on natural cell–cell interaction without the influence of additional factors like scaffolds or coatings. 7) An important novelty of the proMAD method is its compatibility with controllable combination of any neighboring droplets containing 3D cellular structures of interest in a high throughput manner simply by using a low‐volume dispenser, programmed to add liquid to the location of interest (Figures 1 and 2). 8) Finally, the proMAD method is capable of creating hetero‐spheroids formed from different cell types of different origin. To demonstrate an application of the ability to create heterospheroids, we have performed a Wnt signaling propagation experiment, where the Wnt producer and Wnt reporter spheroids were fused into one 3D hetero‐spheroid (Figure 5). This model will be of value for studying Wnt‐ (or other signaling molecule) dependent pattern formation in native‐like tissues and should help clarify what cellular mechanisms are employed in the propagation of Wnt ligand between cells under varying conditions.[ 38 , 45 ]
Thus, the established proMAD technology allows for controllable and high‐throughput generation and screening of complex multi‐ and hetero‐spheroidal architectures on demand. This allows for reaching desired complexity of 3D cellular structures in controlled high throughput manner and performing complex combinatorial assays. Native tissues comprise heterogeneous mixtures of different cell types that interact with each other to provide biological functionality. Hetero‐spheroid complexes obtained with the proMAD method can be used to mimic distinct natural cellular compartments, their interactions, and signaling processes, thus enabling high‐throughput investigation of biological processes under more controlled, semi‐native environments and in a miniaturized way.
Experimental Section
Materials
Droplet‐microarray (DMA) slides (1 mm × 1 mm spots) were purchased from Aquarray GmbH (Eggenstein‐Leopoldshafen, Germany). Dulbecco's modified Eagle medium (DMEM, high glucose, 41966‐029), fetal bovine serum (FBS, 10270‐106) and penicillin–streptomycin (10 000 U mL−1, 15140‐122), puromycin dihydrochloride (10 mg mL−1, A1113803) were obtained from Gibco. Anti‐E cadherin antibody‐intercellular junction marker (ab40772), goat anti‐rabbit IgG H&L (Alexa Fluor 488, ab150077) were brought from the Abcam plc. 2‐(4‐Amidinophenyl)‐6‐indolecarbamidine dihydrochloride (DAPI, D9542), Blocker BSA (10X) in PBS (37525), hexamethyldisilazane (ReagentPlus, HMDS, 99.9%, 379212), CellTracker Green CMFDA (5‐chloromethylfluorescein diacetate, C2925) and Triton X‐100 (T9284) were obtained from Sigma‐Aldrich Inc., and used without purification. Calcein‐AM (C3099) and propidium iodide (PI, 1.0 mg mL−1 in water, P3566) were bought from Thermo Fisher Scientific Inc. Paraformaldehyde (granulated, Art. No. 0335.2) was obtained from Carl Roth GmbH. Glutaraldehyde solution (25% in water, 104 239) were bought from Merck Chemicals GmbH. ScreenFect A (SF) (catalog #S‐3001, lot A15‐9) and dilution buffer (DB) (catalog #S‐2001, lot 18‐2603‐02A) were bought from ScreenFect GmbH (Germany). The HeLa RFP (Cat. Nr: SC031‐Puro) was bought from AMS Biotechnology (Europe) and cultured according to the company's protocols. The dye or antibodies were stored and used according to the manufacturer's protocols.
Culture Medium
HepG2, HEK 293T, and HEK 293T (TOP‐GFP) were cultured in DMEM supplemented with 10% FBS, 1% penicillin/streptomycin. HeLa RFP cells were cultured in DMEM supplemented with 10% FBS, 1% penicillin/streptomycin, and 0.005% puromycin (10 mg mL−1). The medium used for single spheroids (all cell lines) was DMEM supplemented with 15% FBS, 1% penicillin/streptomycin. The medium used for transfection and droplet merging was DMEM supplemented with 10% FBS, 1% penicillin/streptomycin.
Spheroids Architecture
The HepG2 was cultured according to the ATCC protocols. The cell spheroids were formed in the hanging drops as the previous work.[ 27 ] For example, the HepG2 suspensions (2 × 10⁶ cells mL−1) were printed on the DMA with 200 nL in each spots by the I‐DOT dispenser (Dispendix GmbH, Germany). The as‐prepared spheroids were kept for two days before merging. The merging process was executed by adding 900 µL more DMEM into the neighboring spots by the dispenser (e.g., A1 and A2, C5, and C6, Figure S6, Supporting Information). The following printing sequences were used: for fusing 4 droplets the medium was added sequentially to D2, E2, D3, E3 spots (blue spots in Figure 1c, 900 nL more DMEM for each spots); and for fusing 3 droplets the medium was added sequentially to A1, A2, B2 spots (blue spots in Figure 1f, 850 nL more DMEM for each spots). Then the neighboring droplets were fused into one. The slide was inverted and kept culturing for 24, 48, 72, and 96 h. The spheroids or the merged spheroids were observed and imaging by Keyence (BZ‐9000, Japan).
For the fusion of two different cell lines, two different cell lines were chosen: HeLa RFP cells and HEK 293T cells. In order to distinguish two different cells, HEK 293T were pre‐stained by a CellTrackerdye (CMFDA, 5‐chloromethylfluorescein diacetate, 10 × 10−6 m) for 30 min before the cell experiment. Then HeLa RFP cells (1 × 10⁶ cells mL−1, 200 nL in each spots) and HEK 293T cells (1 × 10⁶ cells mL−1, 200 nL in each spots) were printed on the odd columns (1, 3, 5, 7, 9, 11, and 13) and the even columns (2, 4, 6, 8, 10, 12, and 14) of the DMA. After 2 days cultivation (hanging drop method), spheroids were merged by four ways: one HeLa RFP spheroid and one HEK 293T spheroid, one HEK 293T spheroid and two HeLa RFP spheroids, two HEK 293T spheroids and one HeLa RFP spheroid, two HEK 293T spheroids and two HeLa RFP spheroids. The merged spheroids were checked after 24 h with a confocal microscope (LSM 800 confocal laser scanning microscope, Zeiss Germany).
Image Analysis
In order to characterize the spheroids grown on the DMA platform, their circularity, aspect ratio, roundness, and solidity was measured and calculated[ 29 ] by ImageJ. The shapes of spheroids were outlined by “freehand selections,” and 30 spheroids were measured by same method. In order to study the fusion process of two spheroids, optical images of cell spheroid fusion at different time points were captured and analyzed by ImageJ software. By using an angle tool of ImageJ, included angles of merged spheroids at different fusion time points were measured (see blue dotted line in Figure 3a). And by using a length measuring tool of ImageJ, lengths of the merged region (“neck”) between two spheroids (orange dotted line in Figure 3a) were measured. 10 different merged spheroids were measured by same method.
Cell Viability
To check cell viability of the merged spheroids, double spheroids were collected and washed with PBS after 24 h post‐fusion. Then the spheroids were stained with Calcein‐AM (1/2000) and propidium iodide (1/2000) for 15 min at 37 °C. The merged spheroids were imaged by fluorescence microscopy (Keyence, BZ‐9000, and Japan).
Immunostaining of Spheroids
The merged spheroids were fixed by paraformaldehyde (PFA, 4%) after collecting and washing with PBS (1X). Then the spheroids were permeabilized by Triton X‐100 (0.5%) at room temperature for 30 min. After washing with PBS three times, the spheroids were immersed in BSA (1%) blocking solution for 2 h at room temperature. The solution was then replaced with anti‐E cadherin antibody (1/500) and kept at 4 °C overnight. The excess antibodies were washed away with PBS. The Alexa Fluor 488 labeled secondary antibodies (goat anti‐rabbit IgG, 1/800) was introduced at room temperature for another 1 h. The spheroids were then washed with PBS and immersed in the solution of DAPI (10 µg mL−1) for 30 min. After totally washed with PBS, the spheroids were placed in an ibidi chamber (200 µL PBS) and imaged by confocal microscopy (LSM 800, Zeiss Germany). The spheroids were settled by natural sedimentation method in each step in order to keep the original shape of the spheroids.
Fixation of Merged Spheroids for SEM
After 24 h fusion, the spheroids were collected with PBS (1X) in a centrifuge tube (1.5 mL) at room temperature. After 10 min standing, the spheroids were washed with PBS (1X) three times carefully. The PBS were removed and replaced with glutaraldehyde solution (2.5 wt%, 1 mL). After 60 min fixation at room temperature, the spheroids were washed with PBS (1X) once. Then the dehydration was applied with different concentration of ethanol and water (30%, 50%, 70%, 85%, 95%, and 100%, 10 min for each step). To remove the water in cells totally, the spheroids were treated with 50% HMDS (ethanol solution), and 100% HMDS for 10 min respectively. The spheroids were carefully transferred on a clean glass slide and dried in the air. The samples were adhered on a sample stage and imaged with a scanning electron microscope (Pt sputtering for 7 nm, Zeiss LEO 1530, EHT = 5 kV).
Transfection of Wnt‐3a with HEK 293T Cells
HEK 293T cells were cultured in Dulbecco's modified Eagle medium supplemented with 10% fetal bovine serum, 1% penicillin/streptomycin and maintained at 37 °C and 5% CO2. Cells were transfected with 500 µg Mouse pCS2+ Wnt3a and 500 µg LacZ plasmid in 6‐well plates using ScreenFect A according to the manufacturer's 1‐step protocol. As control (without Wnt), 1 µg LacZ was transfected to HEK 293T cells. 24 h post‐transfection cells were used to generate spheroids.
Wnt Signaling between Spheroids
HEK 293T Wnt‐3a producing, as well as the stable HEK 293T TOP‐GFP reporter cell line[ 41 ] were seeded according to the scheming program (Figure S6, Supporting Information). The Wnt producing cells (Wnt‐3a transfected HEK 293T, 24 h, 1 × 10⁶ cells mL−1, and 200 nL) were printed on column 1, 3, 5, 7, 9, 11, 13 and reporter cells (stable HEK 293T TOP‐GFP, 1 × 10⁶ cells mL−1, and 200 nL) were printed on column 2, 4, 6, 8, 10, 12, and 14. After 2 days culturing by the hanging drop method, the neighboring spots were merged by adding 900 nL DMEM to each spots (e.g., A1 and A2, C5 and C6, Figure S6, Supporting Information). To investigate the Wnt signaling, the merged spheroids were checked every 24 h with fluorescence microscopy (Keyence, BZ‐9000, and Japan) and confocal microscopy (LSM 800 confocal laser scanning microscope, Zeiss Germany).
Conflict of Interest
P.L. and A.P. are co‐founders and shareholders of Aquarray GmbH that manufactures droplet microarrays used in this study. Other co‐authors declare no conflict of interests.
Supporting information
Supporting Information
Acknowledgements
This work was supported by ERC Starting Grant (ID: 337077‐DropCellArray), Helmholtz program BIF‐TM (Helmholtz Association) and part of the work was supported by the Deutsche Forschungsgemeinschaft (DFG, German Research Foundation) under Germany's Excellence Strategy 2082/1 – 390761711 (Excellence Cluster “3D Matter Made to Order ”). The authors thank Prof. Ute Schepers for the donation of HepG2 cells. The HEK 293T cell line was provided by Dr. Gary Davidson; the HEK 293T (TOP‐GFP) cell line was provided by Xianxian Wang. The authors thank Zita Gonda for help with Wnt3a transfection experiment. H.C. is grateful to the Helmholtz–OCPC (Office of China Postdoc Council) Postdoc Program. X.W. acknowledges funding from the China Scholar Council (CSC). The authors also acknowledge funding by the Deutsche Forschungsgemeinschaft (DFG, German Research Foundation), project number 331351713–SFB 1324 (project A06 to G. D.) J.R. and A.S. gratefully acknowledge the Gauss Centre for Supercomputing e.V. (https://www.gauss‐centre.eu/) for funding this project by providing computing time through the John von Neumann Institute for Computing (NIC) on the GCS Supercomputer JUWELS at Jülich Supercomputing Centre (JSC).
Open access funding enabled and organized by Projekt DEAL.
Cui H., Wang X., Wesslowski J., Tronser T., Rosenbauer J., Schug A., Davidson G., Popova A. A., Levkin P. A., Assembly of Multi‐Spheroid Cellular Architectures by Programmable Droplet Merging. Adv. Mater. 2021, 33, 2006434. 10.1002/adma.202006434
Contributor Information
Anna A. Popova, Email: anna.popova@kit.edu.
Pavel A. Levkin, Email: levkin@kit.edu.
References
- 1. Place E. S., Evans N. D., Stevens M. M., Nat. Mater. 2009, 8, 457. [DOI] [PubMed] [Google Scholar]
- 2. Laurent J., Blin G., Chatelain F., Vanneaux V., Fuchs A., Larghero J., Théry M., Nat. Biomed. Eng. 2017, 1, 939. [DOI] [PubMed] [Google Scholar]
- 3. Moroni L., Burdick J. A., Highley C., Lee S. J., Morimoto Y., Takeuchi S., Yoo J. J., Nat. Rev. Mater. 2018, 3, 21. [DOI] [PMC free article] [PubMed] [Google Scholar]
- 4. Gaspar V. M., Lavrador P., Borges J., Oliveira M. B., Mano J. F., Adv. Mater. 2020, 32, 1903975. [DOI] [PubMed] [Google Scholar]
- 5. Nichol J. W., Khademhosseini A., Soft Matter 2009, 5, 1312. [DOI] [PMC free article] [PubMed] [Google Scholar]
- 6. Ouyang L., Armstrong J. P. K., Salmeron‐Sanchez M., Stevens M. M., Adv. Funct. Mater. 2020, 30, 1909009. [DOI] [PMC free article] [PubMed] [Google Scholar]
- 7. Pedde R. D., Mirani B., Navaei A., Styan T., Wong S., Mehrali M., Thakur A., Mohtaram N. K., Bayati A., Dolatshahi‐Pirouz A., Nikkhah M., Willerth S. M., Akbari M., Adv. Mater. 2017, 29, 1606061. [DOI] [PubMed] [Google Scholar]
- 8. Haraguchi Y., Shimizu T., Sasagawa T., Sekine H., Sakaguchi K., Kikuchi T., Sekine W., Sekiya S., Yamato M., Umezu M., Okano T., Nat. Protoc. 2012, 7, 850. [DOI] [PubMed] [Google Scholar]
- 9. Laschke M. W., Menger M. D., Trends Biotechnol. 2017, 35, 133. [DOI] [PubMed] [Google Scholar]
- 10. Brassard J. A., Lutolf M. P., Cell Stem Cell 2019, 24, 860. [DOI] [PubMed] [Google Scholar]
- 11. Takebe T., Wells J. M., Science 2019, 364, 956. [DOI] [PMC free article] [PubMed] [Google Scholar]
- 12. Good M., Trepat X., Nature 2018, 563, 188. [DOI] [PubMed] [Google Scholar]
- 13. Zwi‐Dantsis L., Wang B., Marijon C., Zonetti S., Ferrini A., Massi L., Stuckey D. J., Terracciano C. M., Stevens M. M., Adv. Mater. 2020, 32, 1904598. [DOI] [PMC free article] [PubMed] [Google Scholar]
- 14. Ren T., Chen P., Gu L., Ogut M. G., Demirci U., Adv. Mater. 2020, 32, 1905713. [DOI] [PubMed] [Google Scholar]
- 15. Birey F., Andersen J., Makinson C. D., Islam S., Wei W., Huber N., Fan H. C., Metzler K. R. C., Panagiotakos G., Thom N., O'Rourke N. A., Steinmetz L. M., Bernstein J. A., Hallmayer J., Huguenard J. R., Paşca S. P., Nature 2017, 545, 54. [DOI] [PMC free article] [PubMed] [Google Scholar]
- 16. Luo J., Meng J., Gu Z., Wang L., Zhang F., Wang S., Small 2019, 15, 1900030. [DOI] [PubMed] [Google Scholar]
- 17. Chen P., Güven S., Usta O. B., Yarmush M. L., Demirci U., Adv. Healthcare Mater. 2015, 4, 1937. [DOI] [PMC free article] [PubMed] [Google Scholar]
- 18. Souza G. R., Molina J. R., Raphael R. M., Ozawa M. G., Stark D. J., Levin C. S., Bronk L. F., Ananta J. S., Mandelin J., Georgescu M.‐M., Bankson J. A., Gelovani J. G., Killian T. C., Arap W., Pasqualini R., Nat. Nanotechnol. 2010, 5, 291. [DOI] [PMC free article] [PubMed] [Google Scholar]
- 19. Mirsaidov U., Scrimgeour J., Timp W., Beck K., Mir M., Matsudaira P., Timp G., Lab Chip 2008, 8, 2174. [DOI] [PubMed] [Google Scholar]
- 20. Nahmias Y., Odde D. J., Nat. Protoc. 2006, 1, 2288. [DOI] [PubMed] [Google Scholar]
- 21. Tasoglu S., Yu C. H., Gungordu H. I., Guven S., Vural T., Demirci U., Nat. Commun. 2014, 5, 4702. [DOI] [PMC free article] [PubMed] [Google Scholar]
- 22. Zamanian B., Masaeli M., Nichol J. W., Khabiry M., Hancock M. J., Bae H., Khademhosseini A., Small 2010, 6, 937. [DOI] [PMC free article] [PubMed] [Google Scholar]
- 23. Mosadegh B., Dabiri B. E., Lockett M. R., Derda R., Campbell P., Parker K. K., Whitesides G. M., Adv. Healthcare Mater. 2014, 3, 1036. [DOI] [PMC free article] [PubMed] [Google Scholar]
- 24. Glass D. S., Alon U., Science 2018, 361, 1199. [DOI] [PubMed] [Google Scholar]
- 25. Benz M., Molla M. R., Böser A., Rosenfeld A., Levkin P. A., Nat. Commun. 2019, 10, 2879. [DOI] [PMC free article] [PubMed] [Google Scholar]
- 26. Lei W., Bruchmann J., Rüping J. L., Levkin P. A., Schwartz T., Adv. Sci. 2019, 6, 1900519. [DOI] [PMC free article] [PubMed] [Google Scholar]
- 27. Popova A. A., Tronser T., Demir K., Haitz P., Kuodyte K., Starkuviene V., Wajda P., Levkin P. A., Small 2019, 15, 1901299. [DOI] [PubMed] [Google Scholar]
- 28. Meckenstock R. U., von Netzer F., Stumpp C., Lueders T., Himmelberg A. M., Hertkorn N., Schmitt‐Kopplin P., Harir M., Hosein R., Haque S., Schulze‐Makuch D., Science 2014, 345, 673. [DOI] [PubMed] [Google Scholar]
- 29. Oliveira N. M., Martins‐Cruz C., Oliveira M. B., Reis R. L., Mano J. F., Adv. Biosyst. 2018, 2, 1700069. [Google Scholar]
- 30. Berghoff M., Rosenbauer J., Hoffmann F., Schug A., BMC Bioinformatics 2020, 21, 436. [DOI] [PMC free article] [PubMed] [Google Scholar]
- 31. Tremblay D., Andrzejewski L., Leclerc A., Pelling A. E., Cytoskeleton 2013, 70, 837. [DOI] [PubMed] [Google Scholar]
- 32. Maître J.‐L., Berthoumieux H., Krens S. F. G., Salbreux G., Jülicher F., Paluch E., Heisenberg C.‐P., Science 2012, 338, 253. [DOI] [PubMed] [Google Scholar]
- 33. Clevers H., Nusse R., Cell 2012, 149, 1192. [DOI] [PubMed] [Google Scholar]
- 34. Pani A. M., Goldstein B., eLife 2018, 7, 38325. [DOI] [PMC free article] [PubMed] [Google Scholar]
- 35. Gross J. C., Chaudhary V., Bartscherer K., Boutros M., Nat. Cell Biol. 2012, 14, 1036. [DOI] [PubMed] [Google Scholar]
- 36. Stanganello E., Hagemann A. I. H., Mattes B., Sinner C., Meyen D., Weber S., Schug A., Raz E., Scholpp S., Nat. Commun. 2015, 6, 5846. [DOI] [PubMed] [Google Scholar]
- 37. Efremov A. N., Stanganello E., Welle A., Scholpp S., Levkin P. A., Biomaterials 2013, 34, 1757. [DOI] [PubMed] [Google Scholar]
- 38. Takada R., Mii Y., Krayukhina E., Maruyama Y., Mio K., Sasaki Y., Shinkawa T., Pack C.‐G., Sako Y., Sato C., Uchiyama S., Takada S., Commun. Biol. 2018, 1, 165. [DOI] [PMC free article] [PubMed] [Google Scholar]
- 39. Reya T., Duncan A. W., Ailles L., Domen J., Scherer D. C., Willert K., Hintz L., Nusse R., Weissman I. L., Nature 2003, 423, 409. [DOI] [PubMed] [Google Scholar]
- 40. Yu X., Malenka R. C., Nat. Neurosci. 2003, 6, 1169. [DOI] [PubMed] [Google Scholar]
- 41. Wesslowski J., Kozielewicz P., Wang X., Cui H., Schihada H., Kranz D., Karuna P., Levkin M. P., Gross J. C., Boutros M., Schulte G., Davidson G., J. Biol. Chem. 2020, 295, 8759. [DOI] [PMC free article] [PubMed] [Google Scholar]
- 42. Bagley J. A., Reumann D., Bian S., Lévi‐Strauss J., Knoblich J. A., Nat. Methods 2017, 14, 743. [DOI] [PMC free article] [PubMed] [Google Scholar]
- 43. Wang L., Cai P., Luo J., Zhang F., Liu J., Chen Y., Zhu Z., Song Y., Yang B., Liu X., Chen X., Wang S., Nano Res. 2018, 11, 5704. [Google Scholar]
- 44. Choi C.‐H., Wang H., Lee H., Kim J. H., Zhang L., Mao A., Mooney D. J., Weitz D. A., Lab Chip 2016, 16, 1549. [DOI] [PMC free article] [PubMed] [Google Scholar]
- 45. Farin H. F., Jordens I., Mosa M. H., Basak O., Korving J., Tauriello D. V. F., de Punder K., Angers S., Peters P. J., Maurice M. M., Clevers H., Nature 2016, 530, 340. [DOI] [PubMed] [Google Scholar]
Associated Data
This section collects any data citations, data availability statements, or supplementary materials included in this article.
Supplementary Materials
Supporting Information