Abstract
The protein corona can significantly modulate the physicochemical properties and gene delivery of polyethylenimine (PEI)/DNA complexes (polyplexes). The effects of the protein corona on the transfection have been well studied in terms of averaged gene expression in a whole cell population. Such evaluation methods give excellent and reliable statistics, but they in general provide the final transfection efficiency without reflecting the dynamic process of gene expression. In this regard the influence of bovine serum albumin (BSA) on the gene expression of PEI polyplexes also on a single cell level via live imaging is analyzed. The results reveal that although the BSA corona causes difference in the overall gene expression and mRNA transcription, the gene expression behavior on the level of individual cell is similar, including the mitosis‐dependent expression, distributions of onset time, expression pattern in two daughter cells, and expression kinetics in successfully transfected cells. Comparison of single cell and ensemble data on whole cell cultures indicate that the protein corona does not alter the transfection process after nuclear entry, including cell division, polyplex dissociation, and protein expression. Its influence on other steps of in vitro gene delivery before nuclear entry shall render the difference in the overall transfection.
Keywords: protein corona, gene delivery, single cell tracking
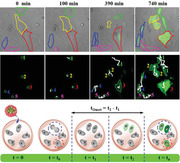
Single cell tracking is applied to investigate the influence of BSA on the gene expression of PEI polyplexes. Despite the difference in the overall transfection efficiency, gene expression with/without BSA behaves similarly on a single cell level. The effects of BSA on other gene delivery steps before nuclear entry thus would be responsible for the difference in the overall transfection.
1. Introduction
Considerable efforts have been devoted to developing new non‐viral vectors, especially cationic polymers for efficient gene delivery.[ 1 ] Branched polyethylenimine (PEI) with a molecular weight of 25 kDa shows high in vitro transfection efficiency and readily commercial availability, so that it is still the most frequently used positive control in recent gene delivery studies.[ 1b,d,e ] PEI condenses DNA into PEI/DNA complexes, so called polyplexes, and they have been demonstrated to efficiently transfect cells in vitro in serum free conditions. However, this is far away from in vivo applications, where many other factors and also the presence of serum proteins need to be considered. Serum proteins, especially the negatively charged ones, can be adsorbed onto the positive surface of the polyplexes to form a protein corona, which alters transfection efficiency of PEI‐based polyplexes in a protein dose‐dependent manner.[ 2 , 3 , 4 ]
Our previous studies showed that the protein corona could significantly modulate the physicochemical properties and the gene delivery efficiency of PEI polyplexes.[ 2 ] Using bovine serum albumin (BSA) as a model, luciferase expression transfected by PEI/DNA/BSA polyplexes showed BSA dose‐dependent manner and reached its peak at composition 1/1/4 (denoted as P 1/1/4), which can be compared with PEI/DNA/BSA weight ratios of 1/1/0 (i.e., no protein, denoted as P 1/1/0). Lower or higher amounts of BSA resulted in lower transfection, together with decreased hydrodynamic diameters. P 1/1/4 polyplexes were most representative and thus were selected in our previous and this study. Both polyplexes demonstrated different physicochemical properties including hydrodynamic diameter, zeta potential, structure compactness in the presence of salts, accessibility of salt ions to the inside polyplexes, and they had different endocytic pathways, and intracellular fate.[ 2 ] In 2‐[4‐(2‐hydroxyethyl)‐1‐piperazinyl]ethane‐sulfonic acid (i.e., HEPES; 10 mm, pH 7.4) aqueous solution, the hydrodynamic diameters of P 1/1/0 and P 1/1/4 polyplexes were ca. 90 and ca. 2000 nm, and their zeta potentials were +12.3 and +3.1 mV, respectively. Therefore, P 1/1/4 polyplexes can be considered as large aggregates of P 1/1/0 polyplexes with BSA. Their spherical morphology can be found in our previous publication.[ 2 ] In our studies and many other studies,[ 2 , 5 ] transfection efficiency was evaluated in terms of averaged gene expression of the whole cell population which was exposed to the polyplexes comprising plasmids encoding for luciferase (an enzyme catalyzing the luminescent reaction of luciferin with oxygen and adenosine triphosphate (ATP)), or fluorescent protein reporting systems. However, cells respond heterogeneously during transfection, and the expression behavior of a single transfected cell is stochastic.[ 6 ] While analysis of the transfection efficiency on the level of cell populations gives excellent and reliable statistics, the dynamic process of gene expression on a single cell level is not reflected.
Recently, live imaging of gene expression on a single cell level has been reported to study polyplex,[ 7 ] lipoplex,[ 8 ] and inorganic particle[ 9 ] mediated transfection, which provides direct access to study the correlation between gene expression and cell division,[ 7 , 8 , 9 ] distributions of onset time,[ 7 , 8 ] and gene expression kinetics.[ 6 , 8 ] This method is particularly suitable to quantitatively understand the heterogeneity of gene expression, as individual cells can be monitored with high temporal and spatial resolution.
This stimulated us to study how the protein corona modulates gene expression of PEI polyplexes on a single cell level. P 1/1/0 and polyplexes with adsorbed BSA, here P 1/1/4, were selected to study differences and common features in gene expression behavior, including single and dual expression of reporter genes and mRNA transcription on a whole cell population, as well as mitosis‐dependence of expression, distribution of onset time, expression pattern in two daughter cells, and expression kinetics in non‐dividing or dividing cells on a single cell. Moreover, polyplex dissociation in successfully transfected cells was investigated.
2. Results and Discussions
2.1. Cellular Uptake, Luciferase Expression, and mRNA Transcription
As the protein exchange and resulting changes in the protein corona components would be an issue, incubation of cells with polyplexes was conducted in serum free medium. The internalization of P 1/1/0 and P 1/1/4 polyplexes was first evaluated in HeLa cells. For that, cells were incubated with polyplexes prepared from a Cy5‐labelled DNA (DNACy5) at 1.4 µg mL−1 DNA in serum free culture medium for 0.5–6 h, and the association of the polyplexes with cells in terms of DNACy5 fluorescence was measured by flow cytometry. Note that we are referring to cellular associations, as in flow cytometry DNACy5 adherent to the outer cell membrane as well as internalized DNACy5 provides fluorescence signal, and there may be a significant time lag from adherence to the start of endocytosis.[ 10 ] Our previous study indicated that more than 85% cells were viable after transfection at 1.4 µg mL−1 DNA.[ 2 ] As shown in Figure 1a, the cellular association increased over time and the fluorescence originating from DNACy5 in P 1/1/0 and P 1/1/4 was similar for both polyplexes. Thus, the delivery efficiency for both polyplexes is similar.
Figure 1.
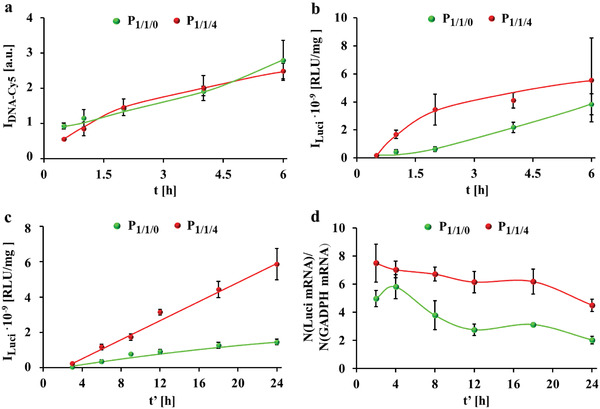
Cellular uptake, luciferase expression, and mRNA transcription. a) Association of P 1/1/0 and P 1/1/4 polyplexes prepared from Cy5‐labelled DNA (DNACy5) to HeLa cells in terms of Cy5 fluorescence I DNA‐Cy5 per cell as measured by flow cytometer. Cells were incubated with polyplexes at 1.4 µg mL−1 DNA (containing 40 ng mL−1 DNACy5) in serum free culture medium for t = 0.5–6 h and measured immediately. b) Luciferase expression of cells after exposure to polyplexes prepared from luciferase‐encoding plasmid (pLuci) for different incubation times t. Cells were incubated with polyplexes at 1.4 µg mL−1 pLuci in serum free medium for t = 0.5–6 h, followed by further culture in fresh 10% FBS supplemented cell culture medium without polyplexes for t′ = 24 h. The luciferase luminescence I Luci from cells was detected by a luminescence detection system. Luminescence is given in relative luminescence units (RLU) per amount of total proteins in RLU/mg. c) Luciferase expression I Luci after different culture time t′. Cells were incubated with polyplexes at 1.4 µg mL−1 DNA in serum free medium for t = 3 h, followed by further culture in fresh 10% FBS supplemented cell culture medium for t″ = 3–24 h. d) mRNA transcription upon exposure of cells to polyplexes at 1.4 µg mL−1 DNA in serum free medium for t = 3 h, followed by further culture in fresh 10% FBS supplemented cell culture medium for t' = 2–24 h. mRNA transcription is displayed in terms of the relative luciferase mRNA transcription number normalized to the house keeping gene GADPH, that is, detected number of luciferase mRNA/detected number of GADPH mRNA.
Subsequently, the in vitro gene expression using a luciferase‐encoding plasmid in P 1/1/0 and P 1/1/4 as the report gene was evaluated in terms of intracellular luciferase luminescence as detected by a luminescence detector (Figure 1b). Cells were incubated with polyplexes at 1.4 µg mL−1 DNA in serum free medium for 0.5–6 h, followed by further culture in fresh 10% FBS supplemented cell culture medium without polyplexes for 24 h. P 1/1/4 transfected ca. 2–4 times more than P 1/1/0. Transfection was also carried out first in serum free culture medium for 3 h, and then incubation was continued in fresh 10% FBS supplemented cell culture medium without polyplexes. Similar to the data shown in Figure 1b, there was more luciferase detected for P 1/1/4 than for P 1/1/0 (Figure 1c). For example, P 1/1/4 had ca. 3 times more luciferase expression compared with P 1/1/0 after 24 h. We also measured the relative mRNA level of luciferase by real time polymerase chain reaction (RT‐PCR). The value was normalized to that of the house‐keeping gene GAPDH in order to exclude interference from differences in cell number (Figure 1d). After transient and robust transcription within the initial 4 h, the mRNA amount of luciferase decreased gradually, probably due to cleavage by endogenous nuclease.[ 11 ] The overall mRNA level transfected by P 1/1/4 was 1.2‐2.2 folds higher than that of P 1/1/0, suggesting that P 1/1/4 more endurably transcribed mRNA. This explains well the higher luciferase luminescence due to incubation with P 1/1/4 than P 1/1/0 (Figure 1c). Provided the assumption that polyplexes comprising luciferase‐encoding plasmid and polyplexes comprising DNACy5 have the same endocytosis behavior (i.e., the data of Figure 1a should be similar for polyplexes comprising luciferase‐encoding plasmid) we can conclude that while P 1/1/0 and P 1/1/4 are internalized by cells with the same kinetics, transfection in terms of mRNA level and protein biosynthesis is lower for P 1/1/0 than for P 1/1/4.
2.2. Dual Delivery of Plasmids
To further investigate the difference in P 1/1/0 and P 1/1/4 polyplexes mediated transfection, co‐transfection upon the delivery of two different plasmids was tested. We first evaluated the protein expression via dual delivery of polyplexes carrying either enhanced green fluorescent protein (eGFP)‐encoding plasmid (peGFP) or red fluorescent protein (RFP)‐encoding plasmid (pRFP). The eGPF‐ and RPF‐expressing cells were imaged by confocal laser scanning microscope (CLSM), and the percentage of fluorescent cells (i.e., transfected cells expressing the fluorescence proteins) was calculated from the images (for fluorescence images‐based data analysis we refer to the Figure S1.4.1.1, Supporting Information). As shown in Figure 2a, P 1/1/0 transfected ca. 28% cells with peGFP and to a lower content, ca. 22% cells with pRFP. P 1/1/4 resulted in ca. 12% cells expressing eGFP and ca. 9% cells expressing RFP. The reason for the slight transfection difference in the two plasmids (peGFP versus pRFP) might be caused by experimental artifacts, such as the different fluorescent intensities of the two proteins (eGFP versus RFP) and detection thresholds in the corresponding channels of the CLSM. The different efficiencies of promotors in both plasmids and variations in the biosynthetic difficulties of two fluorescent proteins could also be the reason. The data shown in Figures 1c and 2a at first glance seem contradictory in terms of comparing transfection with P 1/1/0 versus P 1/1/4 by the different reporting systems. We speculate that P 1/1/4 may transfect less cells, but has a higher expression amount per cell, which has also been observed with other previously reported gene delivery vectors.[ 1 , 2 ] To confirm this, distributions of eGFP fluorescence intensity (denoted as I eGFP) transfected by P 1/1/4 or P 1/1/0 using peGFP are calculated in Figure 2b. The average I eGFP of the eGFP expressing cell subpopulation (whose I eGFP is large than 10) in P 1/1/4 or P 1/1/0 transfected cells was 43.9 and 91.0, respectively, which supports our speculation.
Figure 2.
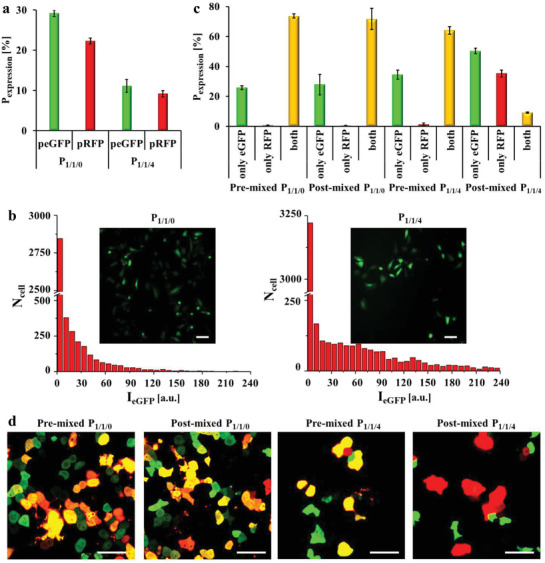
Dual delivery of pre‐mixed and post‐mixed P 1/1/0 and P 1/1/4 polyplexes to HeLa cells using enhanced green fluorescent protein (eGFP)‐encoding plasmid (peGFP) and red fluorescent protein (RFP)‐encoding plasmid (pRFP) as reporting genes. Cells were incubated with polyplexes at 1.4 µg mL−1 DNA in serum free cell culture medium for t = 3 h, followed by further culture in fresh 10% FBS supplemented cell culture medium without polyplexes for t′ = 24 h. The cells were imaged by confocal laser scanning microscopy (CLSM), and the fraction of fluorescent cells was calculated. The transfection efficiency P expression is thus given in terms of percentage of cells expressing eGFP or RFP. a) Only one type of plasmid (i.e., peGFP or pRFP) was added to the respective cell cultures. b) Distributions of eGFP fluorescence intensity (denoted as I eGFP) transfected by P 1/1/4 or P 1/1/0 using peGFP. N cell is the total amount of cells measured from the images. Insert images are cells expressing eGFP. Scale bars represent 50 µm. c,d) Dual delivery of peGFP and pRFP using pre‐mixed or post‐mixed polyplexes. For pre‐mixed polyplexes the two plasmids (i.e., peGFP or pRFP) were mixed first, and PEI was added later. For post‐mixed polyplexes, polyplexes containing one type of plasmid were prepared first, and the two types of polyplexes carrying different plasmids were mixed later. In each polyplex particle, pre‐mixed polyplexes contained two types of plasmids, whereas post‐mixed polyplexes contained only one type of plasmid. The two plasmids were mixed at 1:1 mass ratio. c) Percentage of cells expressing only eGFP, only RFP, and both in successfully transfected cells. d) Images of eGFP (shown in green) and RFP (red) expressing cells measured by CLSM. Cells expressing both proteins are shown in yellow. The scale bars represent 50 µm.
Subsequently, two plasmids were dually delivered using pre‐mixed and post‐mixed polyplexes. For pre‐mixed polyplexes the two plasmids (peGFP or pRFP) were mixed first, and PEI was added later to form the polyplexes. For post‐mixed polyplexes first polyplexes containing only one type of plasmid were prepared first, and the two types of polyplexes carrying different plasmids then were mixed later. In each individual polyplex particle, the pre‐mixed polyplexes contained two types of plasmids, while post‐mixed polyplexes contained only one type of plasmid. As shown in Figure 2c,d, cells only expressing eGFP were more than those only expressing RFP in each group, in agreement with the results displayed in Figure 2a. No significant difference was observed in pre‐mixed and post‐mixed P 1/1/0, and most RFP‐expressing cells expressed eGFP simultaneously. Interestingly, pre‐mixed P 1/1/4 had ca. 1% of cells only expressing RFP, whereas the ratio dramatically increased to ca. 35% in case of post‐mixed P 1/1/4. One possible explanation could be that a single or very few P 1/1/4 polyplex particles were responsible for transfection, so that only one type of plasmid was transfected.[ 12 ] For P 1/1/0 polyplexes, more particles were involved with transfection.
2.3. Real‐Time Imaging of eGFP Expression on a Single Cell Level
To observe gene expression on the level of single HeLa cells, cells were tracked and their eGFP expression was monitored with time‐lapse CLSM (for data analysis we refer to the Figure S1.4.2.1, Supporting Information). This also involved proliferation of the monitored cells. Cell division could be easily observed in the bright field channel without the need for staining (e.g., Hoechst 33 342 for nucleus staining), which avoided potential interference of staining with the metabolism, division, and final transfection of the cells.[ 13 ] Low laser power and proper time intervals (10 min) were used to minimize light‐induced eGFP quenching and phototoxicity during CLSM imaging.
A representative cell tracking of P 1/1/0 mediated transfection is demonstrated in Figure 3a and Movie S1.1, Supporting Information, and the kinetics of eGFP expression of each imaged cell are plotted in Figure 3b. For the non‐dividing cell (indicated by the red outline in Figure 3a) eGFP expression started after 320 min exposure and had the highest eGFP expression level after 740 min. For dividing cells (indicated by the green, yellow, blue, and pink outlines in Figure 3a) eGFP expression always initiated after mitosis (both daughter cells can be seen in Figure 3a) and expression levels were rather moderate. Early division (referring to the time point of cell exposure to polyplexes) did thus not result in higher eGFP expression than late dividing cells. For instance, the cells #1, #2, and #5 finished mitosis at 420, 380, and 120 min, respectively, and cell #2 had highest eGFP expression at the end of observation. Interestingly, in all cases, the two isogenous daughter cells originating from the same parent cell expressed eGFP simultaneously. The following phenomena were not observed for proliferated cells: i) one cell expressed eGFP while the other cell did not; and ii) one cell expressed eGFP earlier than the other one.
Figure 3.
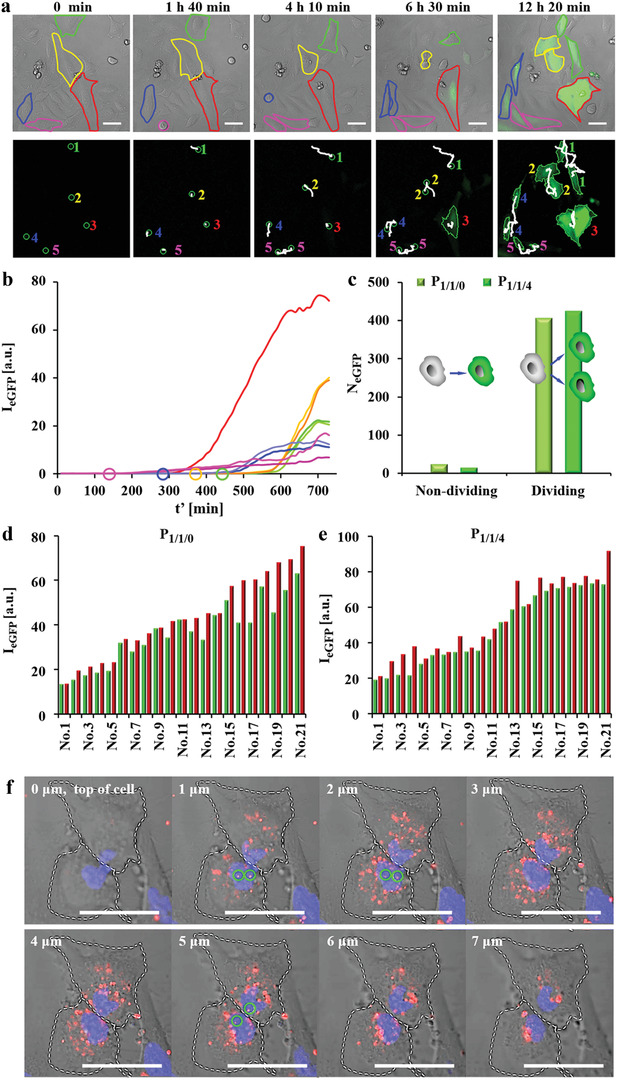
Time lapse images of eGFP expression in HeLa cells upon exposure to P 1/1/0 and P 1/1/4 polyplexes. Cells were incubated with polyplexes at 1.4 µg mL−1 peGFP in serum free medium for t = 3 h. Afterwards, cells were cultured in fresh 10% FBS supplemented cell culture medium and were imaged by CLSM every 10 min (the time point t′ = 0 refers to the start of imaging). a) Representative real‐time tracking of eGFP expression after P 1/1/0 transfection. The red outline indicates a non‐dividing cell. The green, yellow, blue, and pink outlines indicate cells that had divided during observation. The expressed eGFP signal is shown in the green fluorescence channel. The scale bars represent 50 µm. Cell tracking is shown in the lower panel. Here, the cell trajectories are shown in white. Daughter cells are indicated with the same number as their respective parent cells. b) Kinetics of eGFP expression (in terms of eGFP fluorescence intensity I eGFP) as calculated from the cells shown in (a). Circles indicate the time when cells started to divide. c) Statistics of non‐dividing and dividing cells expressing eGFP. N eGFP is the number of observed cells expressing eGFP, which had or had not divided during the observation period. d,e) eGFP expression of 21 pairs of daughter cells at the end of observation (t′ = 24 h) after transfection by d) P 1/1/0 and e) P 1/1/4 (for each pair of fluorescence the intensity of one daughter cell is shown in green, of the other daughter cell in red). f) Z‐stack images of P 1/1/0 polyplex distributions in the nuclei of two daughter cells just after mitosis. Cells were incubated with P 1/1/0 polyplexes prepared from DNACy5. Circles indicate DNA that was in the nucleus, as evidenced by orthogonal views (Figure S1.3.6.2, Supporting Information). The DNACy5 fluorescence is shown in red. The nuclei were stained with Hoechst 33342 and can be seen in the blue fluorescence channel. The scale bars represent 50 µm.
A statistic from more than 4 independent experiments shows that most cells expressed eGFP post‐mitosis (Figure 3c). For P 1/1/0 mediated transfection, 202 pairs of daughter cells expressed eGFP after division and only 25 non‐dividing cells expressed eGFP. Similarly, P 1/1/4 transfected 213 pairs of daughter cells and to a much lower extent 16 non‐dividing cells. The nuclear envelope is the main barrier preventing polyplexes or released plasmids from nuclear entry. During mitosis, the envelope is temporarily disassembled, and plasmids can gain access to the newly formed nuclei of daughter cells, which is a prerequisite for gene expression.[ 14 ] For non‐dividing cells, polyplexes and released plasmids must squeeze into the nuclei through nuclear pores in the envelope. Hence, these data suggest that most polyplexes could hardly cross the nuclear envelope. In some cases, the final eGFP expression levels of two daughter cells after 24 h were similar, while large differences were also observed in other cases (Figure 3d,e). To visualize the intranuclear P 1/1/0 polyplexes in two daughter cells which had just finished division (Figure S1.3.6.1, Supporting Information), polyplexes were prepared from DNACy5 and cells were scanned in z‐directions with an interval distance of 1 µm (Figure 3f). Note that we cannot judge if the plasmid DNA was in the released form or was still condensed inside polyplexes when PEI was not fluorescence labeled. Thus, we used the term polyplexes here which contained both possibilities. Intranuclear polyplexes can be distinguished from the orthogonal views (Figure S1.3.6.2, Supporting Information). The results indicate that polyplexes heterogeneously distributed at least in some daughter cells, which may explain the difference in their final expression level. This hypothesis still would need to be further confirmed in future studies and at this point remains speculative.
From the data shown in Figure 3a–e the time which cells took to initiate eGFP expression post mitosis, defined as onset time t onset, was calculated for the two different polyplexes. The onset time is the sum of the times required for intranuclear polyplex dissociation (i.e., release of the plasmid from PEI), plasmid DNA binding to the transcriptional machinery, mRNA transcription, and protein translation, and it was calculated as t onset = t ini,eGFP − t mitosis. Here t mitosis is defined as the time when cells just have finished mitosis, and it can be directly determined from the transmission channel. t ini,eGFP is defined as the time when the fluorescence intensity of expressed eGFP is larger than a threshold. As eGFP is inherently highly fluorescent, the detection limit issues of eGFP can almost be ignored in this study. The averaged onset time of P 1/1/0 was 172 min (Figure 4a), and P 1/1/4 showed a narrower distribution of onset times with an average value of 134 min (Figure 4b). As the difference in onset time between both polyplexes most likely will be the first step, namely the release of the plasmids from PEI, this suggests that P 1/1/4 polyplexes could dissociate faster. The minimum onset time of P 1/1/0 and P 1/1/4 was 80 and 70 min, respectively (see Figure 4). It is reported that the earlier a cell divides, the longer time is required for expression due to gradual polyplexes dissociation.[ 7 ] To check this, from the data of Figure 3a the time t mitosis (i.e., duration from the beginning of observation t′ = 0 to the start of cell division, which was apparent in the phase contrast images) had been calculated. These data show that the mitosis time did not affect the onset time (Figure 4c,d). One possible explanation might be that both polyplexes were highly stable in the cytosol, which will be discussed later. Despite the difference in t onset of the measured cells and in the final eGFP expression levels in some pairs of two daughter cells, as aforementioned two daughter cells always expressed eGFP simultaneously, namely t onset of two daughter cells was the same.
Figure 4.
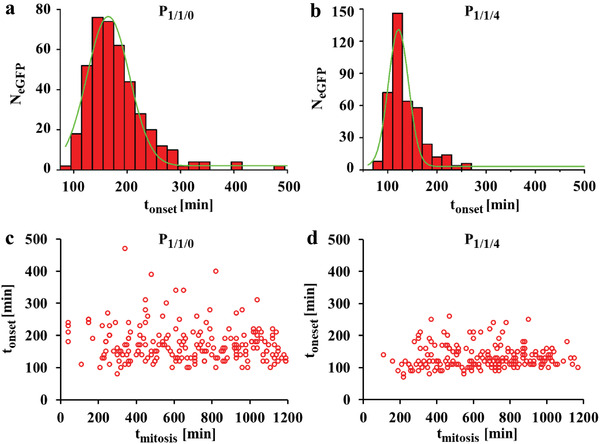
Onset and mitosis time of cells transfected by P 1/1/0 and P 1/1/4 polyplexes. The onset time t onset is the time which cells took to initiate eGFP expression post mitosis. The mitosis time t mitosis is the duration from the beginning of observation at t′ = 0 to the start of mitosis. Cells were incubated with polyplexes in serum free cell culture medium at 1.4 µg mL−1 peGFP for t = 3 h, followed by culture in fresh 10% FBS supplemented cell culture medium and were then monitored by time‐lapse CLSM. a,b) Distributions of onset time in a) P 1/1/0 and b) P 1/1/4 transfected cells. N eGFP (t onset) is the number of cells with respective onset time t onset. c,d) Correlation between onset and mitosis time in c) P 1/1/0 and d) P 1/1/4 transfected cells.
As above‐mentioned, cells continuously expressed luciferase within 24 h after exposure (Figure 1d). To explain this, we first calculated the number of eGFP expressing cells. As shown in Figure 5a,b, the number of successfully transfected cells almost linearly increased within 4 h to 20 h after exposure and reached a plateau afterwards. This trend was consistent with the cell proliferation behavior (Figure S1.3.5.1, Supporting Information). Cell density increased rapidly until it reached the threshold to trigger contact inhibition, and thus the proliferation ceased.
Figure 5.
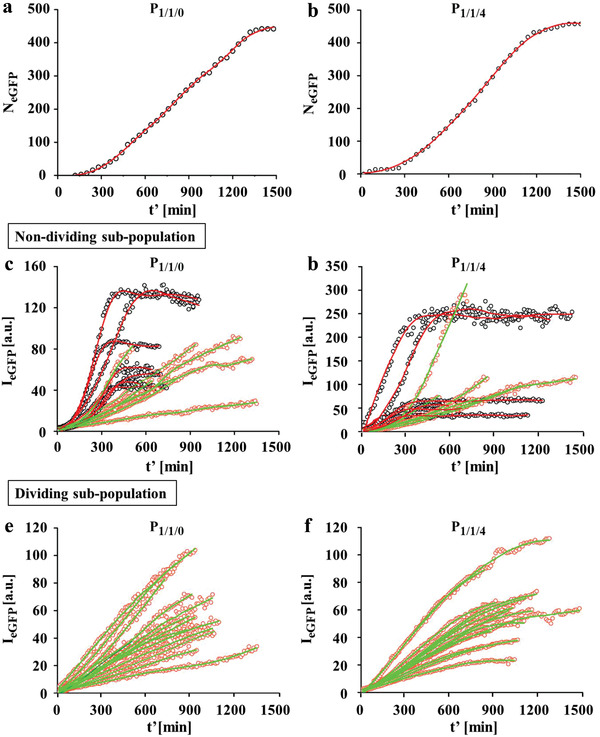
eGFP expression kinetics of cells transfected by P 1/1/0 and P 1/1/4 polyplexes. Cells were incubated with polyplexes in serum free cell culture medium at 1.4 µg mL−1 peGFP for t = 3 h, followed by culture in fresh 10% FBS supplemented cell culture medium and were then monitored by time‐lapse CLSM. a,b) The cumulative number of eGFP expressing cells N eGFP over time t′ upon transfection by a) P 1/1/0 and b) P 1/1/4 polyplexes. c–f) Expression kinetics in c,d) non‐dividing and e,f) dividing sub‐populations. Red curves indicate expression the kinetics of cells which stopped expression after reaching the maximum level. Green curves indicate the expression kinetics of cells which continuously expressed eGFP.
The expression kinetics in the non‐dividing and dividing cell sub‐populations were analyzed (Figure 5c,d). Non‐dividing cells either continuously expressed eGFP or stopped expression after reaching the maximum level. In contrast, all dividing cells progressively produced eGFP (Figure 5e,f). The GFP protein has a half‐life of 54 h in human embryonic kidney cells,[ 15 ] thus its degradation during the time of observation can be neglected. Cells transfected by eGFP‐encoding mRNA have been reported to display an S‐shaped eGFP expression pattern, due to a reduced mRNA level by endogenous enzymatic degradation.[ 8b ] Hence, we speculate that the S‐shaped eGFP expression time‐course in some non‐dividing expressing cells resulted from insufficient cytosolic mRNA levels, whereas in continuously expressing cells the mRNA should be progressively transcribed. However, the highest eGFP level was found in those cells with S‐shaped expression profile in both polyplexes. These results indicate that non‐dividing cells with an S‐shaped eGFP expression pattern transiently produced more mRNA.
2.4. Polyplex Dissociation and Nuclear Localization
Polyplexes may dissociate (i.e., DNA is released from the PEI): i) directly in endo/lysosomes after endocytosis; ii) in the cytosol after a small fraction of them had escaped from endo/lysosomes; and or iii) in the nuclei after nuclear entry. The released DNA inendo/lysosomes was supposed to be completely degraded and was not responsible for transfection. Those released in the cytosol or in the nuclei must bind to the transcription machinery in the nuclei to initiate transfection. To find out which DNA was the primary cause for transfection in our study, we check the dissociation of both polyplexes in eGFP expressing cells.
Polyplexes (i.e., P 1/1/0 and P 1/1/4) were prepared from rhodamine B isothiocyanate labelled PEI (PEIRBITC) and DNACy5. HeLa cells were exposed to polyplexes in serum free culture medium for 3 h, followed by further culture in fresh 10% FBS supplemented cell culture medium (without polyplexes) for 24 h. The fluorescence labeling of PEI and DNA decreased the transfection efficiency from ca. 34% to ca. 15% (Figure S1.3.3.1, Supporting Information), and only those eGFP expressing cells were analyzed by CLSM (Figure 6a,b). The overlap degree was quantified by measuring the Manders' coefficients m 1 (DNACy5) and m 2 (PEIRBITC)[ 16 ] (Figure 6c), which are indicators for the colocalization degree between pixels from two different fluorescence channels (pseudo‐colored in cyan for PEIRBITC and in red for DNACy5) ranging from 0 to 1. Zero correlates to no overlap and one correlates to complete overlap. The coefficients m 1 of both P 1/1/0 and P 1/1/4 were larger than 90%, indicating most DNA molecules were still condensed inside the polyplexes, which supported our aforementioned explanation in Figure 4c,d. Using z‐stack scanning and orthogonal imaging, we also observed only condensed polyplexes but no released DNA in the nuclei of eGFP expressing cells (Figure 6d,e; eGFP fluorescence is not displayed). The intranuclear particle numbers of P 1/1/0 and P 1/1/4 were different: three P 1/1/0 polyplex particles were observed as in Figure 6d and only one P 1/1/4 polyplex particle was found as in Figure 6e. This result supports our aforementioned inference in Figure 2c,d, that a single or very few P 1/1/4 polyplex particles were responsible for transfection, but more particles of P 1/1/4 polyplex could transfect cells.
Figure 6.
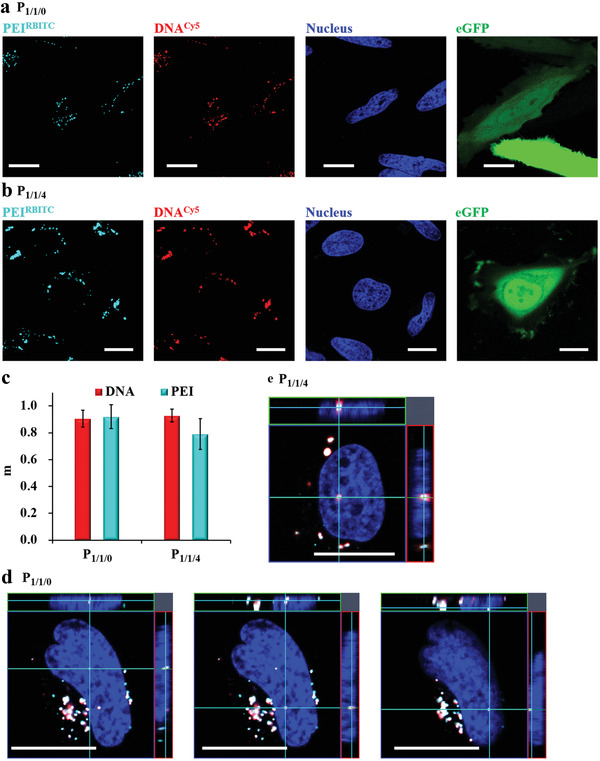
Dissociation and nuclear entry of P 1/1/0 and P 1/1/4 polyplexes in eGFP expressing cells. a,b) Polyplexes were prepared from fluorescence labeled PEIRBITC and DNACy5. HeLa cells were incubated with a) P 1/1/0 and b) P 1/1/4 polyplexes at 1.4 µg mL−1 DNACy5 in serum free culture medium for t = 3 h, followed by further culture in fresh 10% FBS supplemented cell culture medium without polyplexes for t′ = 24 h. In the fluorescence images PEIRBITC is shown in cyan, DNACy5 is shown in red, eGFP is shown in green, and nuclei stained with Hoechst 33342 are shown in the blue fluorescence channel. The scale bars represent 20 µm. c) Overlap degree of PEIRBITC (cyan) and DNACy5 (red) calculated by pixel intensity. Red bars show Manders' coefficient m 1 (DNACy5), the percentage of red fluorescent pixels overlapping with cyan fluorescent pixels. Cyan bars show Manders' coefficient m 2 (PEIRBITC), the percentage of cyan fluorescent pixels overlapping with red fluorescent pixels. N = 21 and 18 cells were analyzed for P 1/1/0 and P 1/1/4, respectively. d,e) Orthogonal views of intranuclear condensed d) P 1/1/0 and e) P 1/1/4 polyplexes in eGFP expressing cells after t′ = 24 h. The scale bars represent 20 µm. Additional data are shown Figure S1.4.3.1, Supporting Information.
The results shown in Figure 6 indicate that most polyplexes did not dissociate in the cytosol and even not in the nuclei. We suggest that DNA release did not mean complete dissociation, as PEI was still colocalized with DNA. One PEI/DNA polyplex particle was reported to contain hundreds to thousands of DNA molecules.[ 17 ] The polyplexes could be partially dissociated in the nuclei, so that some DNA molecules were exposed, which provided the access for the transcription machinery. In our previous work, PEI/DNA/BSA polyplexes at 1/1/40 weight ratio (denoted as P 1/1/40) showed <5% transfection efficiency of eGPF by using the same transfection condition in the present study, but they transfected ca. 75% HeLa cells after nuclear microinjection.[ 2 ] Compared to P 1/1/0 and P 1/1/4, P 1/1/40 polyplexes had a thicker protein corona layer, and their dissociation should be even more difficult. Therefore, the intranuclear dissociation should not be the rate‐limiting step for transfection. Compared to released DNA, condensed DNA in polyplexes is more resistant to nuclease,[ 14 ] and they provide the chance for the late dividing cells to express eGFP. This also explain the linear increase of the eGFP expressing cell number before reaching contact inhibition in Figure 5a,b. We also measured the dissociation of the BSA corona from polyplexes by using fluorescein isothiocyanate (FITC) labeled BSA and DNACy5 (Figure S1.4.3.1, Supporting Information), and the data were analyzed in a similar way. The coefficient m1 (DNACy5) of P 1/1/4 polyplexes was larger than 85% at 4, 10, and 24 h, indicating that majority of the polyplexes contained the BSA corona. Interestingly, the coefficient m2 (BSAFITC) of P 1/1/4 polyplexes was ca. 70%, implying that ca. 30% of BSA could dissociate from polyplexes. Therefore, the BSA corona was partially detached from the P 1/1/4 polyplexes. We admit that the exact dissociation locations, that is, in the endo/lysosomes or in the cytosol, have not been investigated in this study, and will be further measured in our future work.
3. Conclusion
Our previous study showed that the protein corona alters physiochemical properties of PEI‐based polyplexes (PEI polyplexes P 1/1/0 versus their protein corona adsorbed counterparts P 1/1/4) and several intracellular steps of in vitro gene delivery including endocytic pathways, trafficking on the microtubules, and endo/lysosome escape.[ 2 ] In the present study we further demonstrated that for our investigated system the protein corona did not significantly affect the cellular uptake rate of the polyplexes (Figure 1a), but made differences in luciferase expression (Figure 1b,d), mRNA transcription (Figure 1c), expression cell ratios (Figure 2a), expression amount per cell (Figure 2b), and expression pattern of eGFP and RFP after dual delivery of plasmids (Figure 2c,d). These differences thus cannot be explained just by different uptake level of the polyplexes.
Combined with our previous work,[ 2 ] we tried to explain the reason for different transfection behaviors of P 1/1/0 and P 1/1/4 polyplexes: 1) although both polyplexes had similar cell uptake rate, their endocytic pathways are different. The predominate uptake pathways for P 1/1/0 and P 1/1/4 polyplexes were caveolae‐dependent endocytosis and macropinocytosis, respectively. Consequently, the acidification of P 1/1/4 polyplexes was slightly slower than P 1/1/0, which implied that more P 1/1/4 polyplexes can avoid digestion in endo/lysosomes; 2) others have reported that during mitosis, PEI/DNA complexes are transported on astral microtubules towards the poles of the spindle apparatus, and their amount at the location of emerging nuclei of the daughter cells strongly contributes to final transfection result.[ 18 ] Given their different intracellular transport velocity, rapidly moving P 1/1/0 polyplexes have more chance to be enclosed into the nuclei during cell mitosis, whereas stationary P 1/1/4 polyplexes can only be passively trapped inside nuclei with a much lesser chance. This may explain that the higher number of P 1/1/0 polyplexes found inside nuclei of eGFP expressing cells, and only one P 1/1/4 polyplex was observed in the nuclei in all experiments of our study (Figure 6d,e). Moreover, this also explains that P 1/1/0 transfected more cells than P 1/1/4 (Figure 2a,b).
While on the level of whole cell cultures transfection rates were different, on a single cell level P 1/1/0 and P 1/1/4 shared several common features: i) gene expression mediated by both polyplexes was mitosis dependent; ii) after mitosis, in general both daughter cells simultaneously expressed eGFP, but their final gene expression level could be different due to heterogeneous polyplexes distribution inside the respective nuclei; iii) the onset time ranged from 70 to 300 min, and the onset time was found to be independent of the mitosis time; iv) the number of successfully transfected cells almost linearly increased within 4–20 h after exposure before contact inhibition occurred, which correlated to their proliferation behavior; and v) the expression kinetics in non‐dividing expressing cells could be linear or S‐shaped, while that in dividing expressing cells were all linear. Further mechanism studies showed that slow dissociation of P 1/1/0 and P 1/1/4 polyplexes may protect DNA from nuclease degradation and its subsequent entry to nuclei during mitosis should be responsible for transfection, which also explains the results (iii) and (iv). The DNA was still colocalized with PEI in the nuclei of eGFP expressing cells, suggesting that partial polyplex dissociation and exposure of DNA to the transcription machinery could result in transfection. In addition, more P 1/1/0 polyplex particles were found in eGFP expressing cells as compared to P 1/1/4 polyplexes, which explains the difference in expression pattern of eGFP and RFP after the dual delivery of plasmids.
Indeed, the protein corona changed several steps of in vitro gene delivery, but it did not alter the process after nuclear entry, including cell division, polyplex dissociation, and protein expression. The accessibility of P 1/1/0 and P 1/1/4 polyplexes into nuclei should be responsible for the difference in expression cell ratios, and the availability of partially dissociated DNA should determine the expression level per cell. These further need to be confirmed in the future with new methodology and techniques. Our study also points out the need for more future studies, involving in particular larger statistics on a single cell‐based analysis. To date, the role of the protein corona on transfection of polyplexes is still not completely understood.
Conflict of Interest
The authors declare no conflict of interest.
Supporting information
Supporting Information
Supplemental Movie 1
Acknowledgements
This work was funded by the Cluster of Excellence “Advanced Imaging of Matter” of the Deutsche Forschungsgemeinschaft (DFG) – EXC 2056 – project ID 390715994. HY is grateful to Chinese Scholarship Coucil (CSC) for a PhD fellowship.
Open access funding enabled and organized by Projekt DEAL.
Zhu D., Yan H., Zhou Z., Tang J., Liu X., Hartmann R., Parak W. J., Shen Y., Feliu N., Influence of the Modulation of the Protein Corona on Gene Expression Using Polyethylenimine (PEI) Polyplexes as Delivery Vehicle. Adv. Healthcare Mater. 2021, 10, 2100125. 10.1002/adhm.202100125
Contributor Information
Dingcheng Zhu, Email: zhudc@hznu.edu.cn.
Zhuxian Zhou, Email: zhouzx@zju.edu.cn.
Jianbin Tang, Email: jianbin@zju.edu.cn.
Xiangrui Liu, Email: xiangrui@zju.edu.cn.
Wolfgang J. Parak, Email: wolfgang.parak@uni-hamburg.de.
Youqing Shen, Email: shenyq@zju.edu.cn.
Neus Feliu, Email: nfeliu@physnet.uni-hamburg.de.
Data Availability Statement
The data that supports the findings of this study are available in the supplementary material of this article.
References
- 1.a) Yan H., Zhu D., Zhou Z., Liu X., Piao Y., Zhang Z., Liu X., Tang J., Shen Y., Biomaterials 2018, 178, 559; [DOI] [PubMed] [Google Scholar]; b) Zhu D., Yan H., Liu X., Xiang J., Zhou Z., Tang J., Liu X., Shen Y., Adv. Funct. Mater. 2017, 27, 1606826; [Google Scholar]; c) Liu X., Xiang J., Zhu D., Jiang L., Zhou Z., Tang J., Liu X., Huang Y., Shen Y., Adv. Mater. 2016, 28, 1743; [DOI] [PubMed] [Google Scholar]; d) Qiu N., Wang G., Wang J., Zhou Q., Guo M., Wang Y., Hu X., Zhou H., Bai R., You M., Zhang Z., Chen C., Liu Y., Shen Y., Adv. Mater. 2020, 33, 2006189; [DOI] [PubMed] [Google Scholar]; e) Wang G., Zhu D., Zhou Z., Piao Y., Tang J., Shen Y., ACS Appl. Mater. Interfaces 2020, 12, 14825. [DOI] [PubMed] [Google Scholar]
- 2. Zhu D., Yan H., Zhou Z., Tang J., Liu X., Hartmann R., Parak W. J., Feliu N., Shen Y., Biomater. Sci. 2018, 6, 1800. [DOI] [PubMed] [Google Scholar]
- 3. Carrabino S., Di Gioia S., Copreni E., Conese M., J. Gene Med. 2005, 7, 1555. [DOI] [PubMed] [Google Scholar]
- 4. Nicolì E., Syga M. I., Bosetti M., Shastri V. P., PLoS One 2015, 10, e0122581. [DOI] [PMC free article] [PubMed] [Google Scholar]
- 5.a) Wang L. H., Wu D. C., Xu H. X., You Y. Z., Angew. Chem. 2016, 128, 765; [Google Scholar]; b) Shen W., Wang Q., Shen Y., Gao X., Li L., Yan Y., Wang H., Cheng Y., ACS Cent. Sci. 2018, 4, 1326. [DOI] [PMC free article] [PubMed] [Google Scholar]
- 6. Schwake G., Youssef S., Kuhr J. T., Gude S., David M. P., Mendoza E., Frey E., Rädler J. O., Biotechnol. Bioeng. 2010, 105, 805. [DOI] [PubMed] [Google Scholar]
- 7. Durymanov M. O., Yarutkin A. V., Khramtsov Y. V., Rosenkranz A. A., Sobolev A. S., J. Controlled Release 2015, 215, 73. [DOI] [PubMed] [Google Scholar]
- 8.a) Kirchenbuechler I., Kirchenbuechler D., Elbaum M., Exp. Cell Res. 2015, 345, 1; [DOI] [PubMed] [Google Scholar]; b) Leonhardt C., Schwake G., Stögbauer T. R., Rappl S., Kuhr J. T., Ligon T. S., Rädler J. O., Nanomed.: Nanotechnol., Biol. Med. 2014, 10, 679. [DOI] [PubMed] [Google Scholar]
- 9. Chernousova S., Epple M., Gene Ther. 2017, 24, 282. [DOI] [PMC free article] [PubMed] [Google Scholar]
- 10.a) Semmling M., Kreft O., Muñoz Javier A., Sukhorukov G. B., Käs J., Parak W. J., Small 2008, 4, 1763; [DOI] [PubMed] [Google Scholar]; b) Ashraf S., Said A. H., Hartmann R., Assmann M.‐A., Feliu N., Lenz P., Parak W. J., Angew. Chem. 2020, 59, 5438. [DOI] [PMC free article] [PubMed] [Google Scholar]
- 11. Wu L., Fan J., Belasco J. G., Proc. Natl. Acad. Sci. USA 2006, 103, 4034. [DOI] [PMC free article] [PubMed] [Google Scholar]
- 12. Rehman Z. u., Hoekstra D., Zuhorn I. S., ACS Nano 2013, 7, 3767. [DOI] [PubMed] [Google Scholar]
- 13. Zhang X., Kiechle F. L., Ann. Clin. Lab. Sci. 1997, 27, 260. [PubMed] [Google Scholar]
- 14. Zhou Z., Liu X., Zhu D., Wang Y., Zhang Z., Zhou X., Qiu N., Chen X., Shen Y., Adv. Drug Delivery Rev. 2017, 115, 115. [DOI] [PubMed] [Google Scholar]
- 15. Sacchetti A., El Sewedy T., Nasr A. F., Alberti S., FEBS Lett. 2001, 492, 151. [DOI] [PubMed] [Google Scholar]
- 16.a) Hartmann R., Parak W. J., in Systems Biology Application in Synthetic Biology, (Ed.: Singh S.), Springer, Pune, India: 2016, pp. 99–115; [Google Scholar]; b) Schweiger C., Hartmann R., Zhang F., Parak W. J., Kissel T., Gil P. R., J. Nanobiotechnol. 2012, 10, 28. [DOI] [PMC free article] [PubMed] [Google Scholar]
- 17. Perevyazko I. Y., Bauer M., Pavlov G. M., Hoeppener S., Schubert S., Fischer D., Schubert U. S., Langmuir 2012, 28, 16167. [DOI] [PubMed] [Google Scholar]
- 18. Bausinger R., Gersdorff K. V., Braeckmans K., Ogris M., Wagner E., Bräuchle C., Zumbusch A., Angew. Chem., Int. Ed. 2006, 45, 1568. [DOI] [PubMed] [Google Scholar]
Associated Data
This section collects any data citations, data availability statements, or supplementary materials included in this article.
Supplementary Materials
Supporting Information
Supplemental Movie 1
Data Availability Statement
The data that supports the findings of this study are available in the supplementary material of this article.


