Abstract
Objective: To evaluate the efficacy of bone strengthening and pain relieving capsules in the treatment of postmenopausal osteoporosis and its correlation with AMPK/mTOR autophagy signaling pathway. Methods: Between January 2021 and December 2022, 100 patients with postmenopausal osteoporosis of liver-kidney yin deficiency and qi stagnation and blood stasis type were retrospectively screened in the outpatient and inpatient departments of the Department of Orthopaedics and Traumatology of Liuzhou Hospital of Traditional Chinese Medicine, Guangxi Zhuang Autonomous Region, and were randomly divided into 2 groups of 50 patients each according to the order of the timing of the consultation, namely, the Strong Bone Pain Relief Capsules Treatment Group and the Alendronate Sodium Control Group. Bone mineral density of the left femur, Chinese medicine evidence points, serum AMPK level, E2 level before and after treatment, Ca2+ level, IL-17, serum phosphorus level, ALP, PTH, OC, PINP, NTX and TRAP-5b level before and after drug intervention were detected in the two groups. Results: Both groups achieved a lower TCM syndrome score, NRS score of low back pain, and AMPK level after treatment (P<0.001). Both groups had increased Ca2+ concentration and E2 level (P<0.001), and reduced IL-17 and serum P level (P<0.001). Both groups had significantly increased ALP, PTH, OC, PINP level, NTX and TRAP-5b level (P<0.001). The difference between the two groups was significant (P<0.05) and for TRAP-5b levels, (P<0.001). Efficacy for osteoporosis differed between the two groups (P<0.05). Conclusion: Strong Bone Pain Relief Capsules may negatively regulate the level of AMPK and increase the level of cellular autophagy so as to play a role in the improvement of osteoporosis.
Keywords: Evaluation, treatment, postmenopausal osteoporosis
Introduction
Postmenopausal osteoporosis (PMOP) is a common bone metabolic disease associated with aging, which is characterized by decreased bone mass, destruction of bone microstructure prone to fragility fracture [1], and is highly prevalent and harmful [2]. Various complications of postmenopausal osteoporosis affect women’s healthy life and quality of life. Some studies have shown [3,4] that the occurrence of postmenopausal osteoporosis is related to the imbalance of cellular autophagy, and autophagy and autophagy-related factors have a very important role in bone metabolic homeostasis, and among them, AMPK/mTOR autophagy signaling pathway, which plays an important role in regulating the balance of bone metabolism, is one of the main converging points of multiple factors [5]. In the treatment of postmenopausal osteoporosis, there are many types of drugs used in western medicine. The most commonly used ones are calcitonin analogues, parathyroid hormone, and bisphosphonates [6], but the long-term use of these drugs has many side effects. A study has shown that ZGZT can also be used in the clinical treatment of sarcopenia and can effectively promote the formation of osteoblasts and inhibit the differentiation of stem cells into osteoclasts in the treatment of osteoporosis [7]. A study has shown that ZGZT can significantly improve the bone mineral density of primary osteoporosis and relieve the symptoms of low back pain, but the mechanism of action is still not clear [8].
Therefore, the aim of this paper was to explore the correlation between factors associated with the AMPK/mTOR autophagy signaling pathway and postmenopausal osteoporosis.
Clinical data
Research subjects
The study subjects were from January 2021 to December 2022. 100 postmenopausal osteoporosis patients with liver and kidney yin deficiency, qi stagnation, and blood stasis were screened in the outpatient and inpatient departments of the Orthopedics and Traumatology Department of Liuzhou Traditional Chinese Medicine Hospital in Guangxi Zhuang Autonomous Region. All included patients signed informed consent forms. If allergies or adverse reactions occur during treatment, the drug was discontinued immediately.
The patient sample size estimation method uses the sample size estimation online tool (Power And Sample Size), with Power set to 0.8 and α set to 0.05. According to the research group’s preliminary clinical pre-experiment evaluation, the effective rate of the test group is 60% and the control group is 85%. The calculated sample size was 47 per group. Considering that the dropout rate was approximately 10%, the final sample size was determined to be 50 per group.
Diagnostic criteria
Guidelines for the Diagnosis and Treatment of Traditional Chinese Medicine for Postmenopausal Osteoporosis (Osteoporosis) (2019 Edition)” [2]. Western medicine diagnostic standards [9] (based on bone density): Bone density value is detected by dual-energy X-ray, and the result is expressed as T value. T value ≥-1.0 is normal; -2.5< T value <-1.0 is bone mass decline; T value ≤-2.5 can be used to diagnose postmenopausal osteoporosis. Enrolled patients should satisfy both Chinese and western medicine diagnostic criteria [10].
Inclusion criteria
1. Meets the diagnostic criteria for PMOP and liver and kidney yin deficiency, qi stagnation and blood stasis syndrome; 2. Female patients (age 50-60) within 5-10 years of menopause or with >12 months of natural menopause; 3. Voluntary acceptance of the treatments prescribed for this subject; 4. Has signed an informed consent form before the experiment.
Exclusion criteria
1. Parathyroid, gonads, adrenal glands, thyroid and other endocrine system diseases that affect bone metabolism; 2. Immune diseases or gynecological diseases affecting bone metabolism; 3. Digestive and kidney diseases as well as affecting calcium and vitamin D absorption and metabolism.
Case withdrawal and dropout criteria
1. Subjects who cannot comply with the experiment; 2. Subjects who experience serious complications, special physiological changes or even adverse events; 3. Subjects who failed to complete the voluntary withdrawal as required; 4. Subjects who did not take medication as prescribed in the study protocol.
Research methods
Grouping and treatment
Two groups: the Zhuanggu Zhitong Recipe treatment group and the alendronate sodium control group according to the order of visit time. In the end, 50 patients were included in the Zhuanggu Zhitong Recipe group and the alendronate sodium group. 50 cases. All included patients were given oral calcium carbonate D(II) (Wyeth Pharmaceuticals Co., Ltd., national drug approval number: H 10950029) 600 mg/time, once in the morning and evening. The treatment group was given oral Zhuanggu Zhitong Recipe on the basis of taking the above basic medicines (specific drug composition: 15 g of psoralen, 10 g of epimedium, 6 g of wolfberry, 6 g of Ligustrum lucidum, Drynariae 6 g, 6 g of dog’s spine, and 6 g of Achyranthes bidentata. This recipe is processed into non-fried granules according to the technology. It is provided by the pharmacy of Liuzhou Traditional Chinese Medicine Hospital. It was taken with warm water half an hour after breakfast and dinner), 200 ml/time, 2 times/day. The alendronate sodium group was given oral alendronate sodium tablets (Zhuozhou Dongle Pharmaceutical Co., Ltd., national drug approval number H20084165) 70 mg/time, once/week, on the basis of taking the above basic medications. One course of treatment was given every 4 weeks, for a total of 6 courses, for a total of 24 weeks (The research plan was approved by the Ethics Committee of Liuzhou Traditional Chinese Medicine Hospital. Ethics number: 2022 JAN - KY-YN-022-01).
Outcome measures
Security indicators
(1) Patients’ electrolytes were monitored as well as hepatic and renal function before treatment and at 3, 6, and 12 months of treatment. (2) Occurrence of adverse event for prompt treatment of adverse reactions. (3) In the event of an adverse event, a case withdrawal is made promptly, followed by symptomatic treatment for the adverse reaction.
Bone density
A dual-energy X-ray bone density detector (American H OLOGIC Company, model: Horizon-A) as used to detect left femoral bone density before and after drug intervention.
Traditional Chinese Medicine syndrome score
The clinical symptoms of patients before and after treatment were graded and quantified according to the Quantitative Grading Scale of Chinese Medicine Symptoms (Table 1).
Table 1.
TCM syndrome quantitative grading scale
| Syndromes | None (0 point) | Mild (1 point) | Medium (2 points) | Severe (3 points) |
|---|---|---|---|---|
| Main symptoms | ||||
| Low back paina | None | Visual analog scale for pain 1 to 3 minutes | Pain visual analog scale 4 to 6 points | Pain visual analog scale 7 to 10 points |
| Secondary symptoms | ||||
| Soreness and weakness in waist and kneesb | None | Occasionally feeling soreness and weakness in waist and knees after walking (≥1000 m) | Feeling soreness and weakness in waist and knees after walking (300~1000 m) | Feeling soreness and weakness in waist and knees immediately after standing or walking (<300 m) |
| Cramps in lower limbsb | None | ≤2 times per month | 2 to 10 times a month | ≥10 times per month |
| Hard stepsc | None | Occasionally have difficulty walking, but no discomfort within 100 m | Difficulty walking short distances (10-100 m) | Difficulty walking, unable to exceed 10 m, or unable to stand |
| Difficult to be cautiousc | None | Sober and weak | Difficult to be cautious | Unable to be prudent |
The degree of pain is assessed by the patient under the guidance of a doctor, and the total score is calculated by ×3;
After the doctor and patient communicate with each other, the doctor will make an evaluation, and the total score will be calculated by ×2;
After the doctor and patient communicate with each other, the doctor will make an evaluation, and the score will be ×1 when calculating the total score.
AMPK content
ELISA method was applied to detect the serum AMPK content of the two groups of sufferers before and after remedy, record it, and conduct linear correlation analysis with the clinical data analysis results.
Serum Ca2+, P, Fe and E2 levels
The o-cresolphthalein complex ketone method was used to detect the serum calcium ion concentration (Ca2+) and serum iron (Fe) levels of the two groups of sufferers before and after therapy. The phosphine platinum acid reduction method was applied to detect the serum phosphorus (P) levels of the two groups before and after therapy. High-efficiency Liquid chromatography (HPLC) was used to detect the serum estradiol (E2) levels of the two groups of patients before and after therapy.
Serum IL-17 and IL-1 levels
The enzyme-linked immunosorbent assay (ELISA) method was applied to detect the levels of IL-17 and IL-1 in the two groups of patients before and after drug intervention.
Serum bone metabolism related markers
The NPP substrate-AMP buffer method was applied to detect the alkaline phosphatase (ALP) levels of the two groups of patients before and after drug intervention. The ELISA method was used to detect the amino-terminal propeptide of type I procollagen (PINP) and urinary type I collagen in the two groups before and after treatment. Levels of cross-linked N-terminal peptide (L-NTX), tartrate-resistant acid phosphatase 5b (TRACP-5b).
Clinical efficacy evaluation standards [11]
1. Osteoporosis efficacy evaluation criteria (Table 2).
Table 2.
Osteoporosis efficacy evaluation criteria
| Curative effect | Evaluation standard |
|---|---|
| Effective | Complete pain relief and improved bone density. |
| Efficient | The pain is relieved than before, and the bone density has not decreased. |
| Invalid | No significant improvement in pain or bone density. |
2. Criteria for evaluation of efficacy of TCM syndromes (Table 3).
Table 3.
Criteria for evaluation of efficacy of TCM syndromes
| Curative effect | Evaluation standard |
|---|---|
| Got well | Symptoms such as waist and back pain are basically completely relieved, waist and knee soreness, lower limb cramps, difficulty in walking, and weight-bearing functions return to normal, and the syndrome score improvement rate is ≥95%. |
| Effective | Symptoms such as pain in the lower back were significantly relieved, soreness of the waist and knees, cramps in the lower limbs, difficulty in walking, and weight-bearing functions returned to normal, and the syndrome score improvement rate was ≥70%, <95%. |
| Efficient | Symptoms such as waist and back pain were mildly relieved, waist and knee soreness, lower limb cramps, difficulty in walking, and the ability to maintain balance were partially restored, and the syndrome score improvement rate was ≥30% and <70%. |
| Invalid | The clinical symptoms and waist and lower limb functions did not improve compared with before and after treatment, and the syndrome score improvement rate was <30%. |
The flow chart is as follows
The flow chart of this study is shown in Figure 1.
Figure 1.
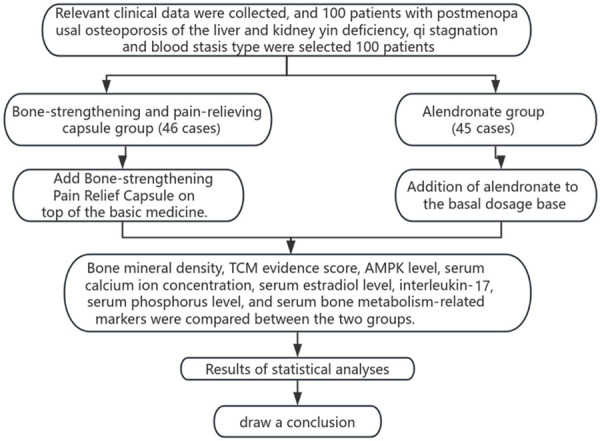
Flow chart.
Statistical methods
Data analysis was carried out using SPSS 24.0 statistical analysis software. For normally distributed measured data, the mean and standard deviation are applied to describe the center position and degree of dispersion of the data. For two groups of normally distributed data, the independent samples T test was used to contrast. Non-normally distributed measured data used the median, 25th percentile, and 75th percentile to describe the location and degree of dispersion of the data. For two groups of non-normally distributed data, the rank sum test (Mann-Whitney U test) was applied for comparison. Analysis of bivariate relationships: Pearson linear correlation analysis was used to assess the relationship between two normally distributed measures. For non-normally distributed data, relationship analysis was performed using rank-sum correlation. Comparisons within groups before and after treatment were performed using paired T tests, comparisons between groups were performed using independent samples T tests, and counted data were compared using rank-sum tests. P<0.05 was used to determine whether a difference was statistically significant. Graphs were drawn using GraphPad Prism 8.2.1 software.
Results
Statistical analysis of basic data
In this chapter of the study, using http://tools.medsci, patients were grouped according to the time of enrolment in order, and there were 50 cases in each of the two groups. During the study period there was 1 patient in the strong bone pain relief formula group who withdrew from the study due to gastrointestinal reactions after taking the drug, no obvious discomfort symptoms appeared in the follow-up, 1 case withdrew voluntarily, and there were 2 cases of loss of visits, shedding a total of 4 cases. In the alendronate group, 3 patients withdrew from the study due to gastrointestinal reactions after taking the drug, 1 withdrew voluntarily, and 2 cases were lost to follow-up, with a total of 5 cases falling off. Finally, 46 cases in the Bone Strengthening and Pain Relieving Formula group and 45 cases in the alendronate group completed this study.
Basic situation comparison
When comparing the basic information (height, age, weight, etc.) and clinical effect evaluation indicators (bone density, bone turnover markers, TCM syndrome scores) between the two groups of patients, no statistical significance had been found in the comparison between the two groups (P>0.05), Table 4.
Table 4.
Basic information of the two groups of patients before treatment (χ±s)
| Zhuanggu Zhitong Recipe Group | Alendronate sodium group | P value | |
|---|---|---|---|
| Age (years) | 55.65±2.45 | 55.75±2.93 | 0.856 |
| Height (cm) | 158.34±2.59 | 157.93±2.66 | 0.454 |
| Weight (kg) | 51.93±2.91 | 51.34±2.62 | 0.315 |
| NRS pain score | 5.26±0.50 | 5.31±0.49 | 0.678 |
| TCM syndrome score | 14.43±2.39 | 13.62±2.47 | 0.114 |
| Left femoral bone density (g/cm2) | 0.440±0.020 | 0.444±0.019 | 0.353 |
| Blood calcium (mmol/L) | 2.52±0.13 | 2.48±0.13 | 0.154 |
| Blood phosphorus (mmol/L) | 1.24±0.09 | 1.26±0.07 | 0.322 |
| Serum iron (μmol/L) | 17.60±2.10 | 17.63±1.74 | 0.926 |
| E2 (pg/mL) | 15.47±0.74 | 15.49±0.71 | 0.895 |
| IL-17 (ng/L) | 141.83±7.48 | 141.96±6.13 | 0.927 |
| IL-1 (ng/L) | 89.98±4.48 | 90.85±5.00 | 0.385 |
| ALP (U/L) | 108.15±5.06 | 109.34±4.99 | 0.265 |
| PINP (ng/ml) | 40.31±1.40 | 39.84±1.29 | 0.100 |
| L-NTX (nmol BCE/mmol Cr) | 83.14±3.09 | 83.20±2.73 | 0.921 |
| TRACP-5b (U/L) | 3.79±0.47 | 3.87±0.50 | 0.426 |
Note: The age of the two groups of patients, the normality test results of the Zhuanggu Zhitong Recipe group and the alendronate sodium group were 0.216 and 0.072 respectively, obeying the normal distribution, the homogeneity of variance test L(1,89)=2.731, P=0.102, indicating homogeneous variances, using the independent sample T test.
Comparison of bone density
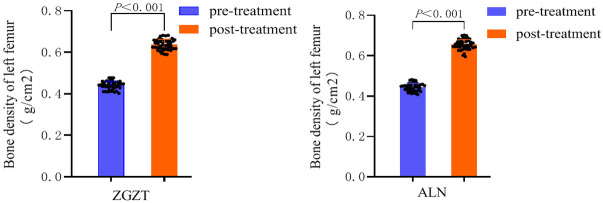
24 weeks of treatment, the bone density value results are shown in Table 5 and Figure 2: Both the Zhuanggu Zhitong Recipe treatment group and the alendronate sodium control group had a significantly increased left femur bone density value (P<0.001).
Table 5.
Comparison of bone density of left femur between two groups before and after treatment (x̅±s)
| Group | Number of samples | Before treatment | After treatment | t | P | |
|---|---|---|---|---|---|---|
| Left femoral bone density (g/cm2) | Zhuanggu Zhitong Recipe Group | 46 | 0.440±0.020 | 0.637±0.024 | -34.67 | 0.001 |
| Alendronate sodium group | 45 | 0.444±0.019 | 0.655±0.024 | -42.95 | 0.001 |
Note: The difference in bone density between the Zhuanggu Zhitong Recipe group and the alendronate sodium group before and after treatment was calculated separately. A normality test was performed on the differences between the two groups. The results were 0.776 and 0.266 respectively, which satisfies normality. Therefore, paired samples T test was used.
Figure 2.
Comparison of femoral bone density between the two groups before and after treatment.
Comparison outcomes of the difference in femoral bone density before and after treatment are shown in Table 6 and Figure 3: The alendronate sodium group had a better effect on increasing bone density than the Zhuanggu Zhitong Recipe group (P<0.05).
Table 6.
Comparison of lumbar spine bone density difference between two groups before and after treatment (x̅±s)
| Group | Number of samples | Difference before and after treatment | t | P | 95% CI of difference | |
|---|---|---|---|---|---|---|
| Left femoral bone density (g/cm2) | Zhuanggu Zhitong Recipe Group | 46 | 0.188±0.021 | -2.83 | 0.006 | -0.022~-0.003 |
| Alendronate sodium group | 45 | 0.201±0.022 |
Note: The normality test was performed on the difference in bone density between the two groups before and after treatment. The results were 0.776 and 0.226 respectively, which satisfied the normality. The homogeneity of variance test L(1,89)=0.109, P=0.742, which satisfies the homogeneity of variances and uses the independent sample T test.
Figure 3.
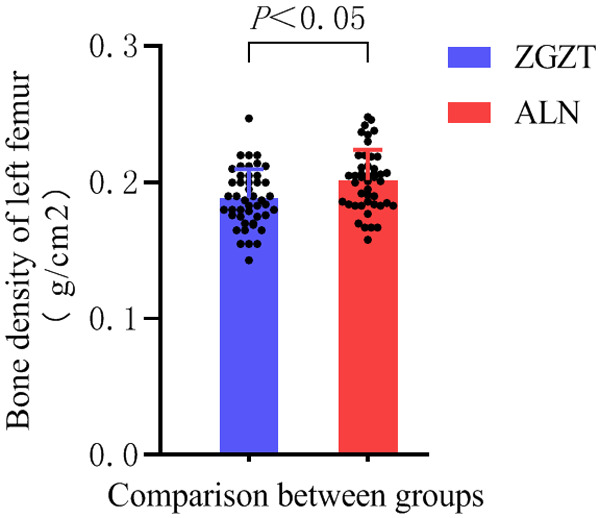
Comparison of differences in femoral bone density between the two groups before and after treatment.
Comparison of TCM syndrome scores
The outcomes of TCM syndrome scores are shown in Table 7 and Figure 4: Both the Zhuanggu Zhitong prescription treatment group and the alendronate sodium control group had lower TCM syndrome scores, indicating that Zhuanggu Zhitong prescription can effectively relieve soreness and weakness of the waist and knees, lower limb cramps, walking and weight-bearing functions, can effectively reduce the NRS score of low back pain, and improve TCM syndrome (P<0.001).
Table 7.
Comparison of TCM syndrome scores between the two groups before and after treatment (x̅±s)
| Group | Number of samples | Before treatment | After treatment | t | P |
|---|---|---|---|---|---|
| Zhuanggu Zhitong Recipe Group | 46 | 14.43±2.39 | 3.82±1.74 | 41.85 | 0.001 |
| Alendronate sodium group | 45 | 13.62±2.47 | 4.28±1.56 | 30.28 | 0.001 |
Note: The difference in TCM syndrome scores before and after treatment in the Zhuanggu Zhitong Recipe group and the alendronate sodium group were calculated respectively. The normality test was performed on the difference in TCM syndrome scores between the two groups before and after remedy. The results were 0.095 and 0.084 respectively, which satisfies the normal distribution, so the paired sample T test is used.
Figure 4.
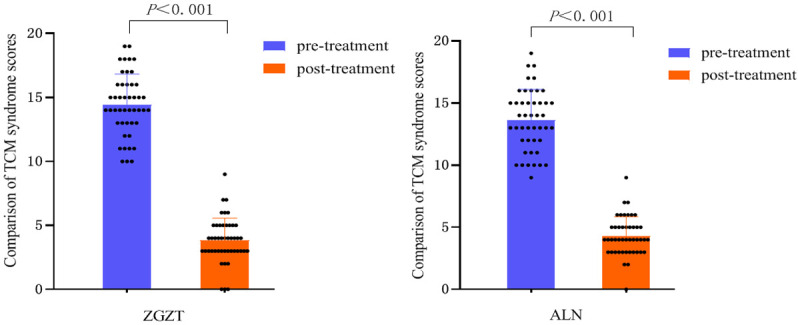
Comparison of TCM syndrome scores between the two groups before and after treatment.
Results of the difference in TCM syndrome scores before and after treatment are shown in Table 8 and Figure 5: Comparison of the difference in TCM syndrome scores before and after treatment. The treatment group of Zhuanggu Zhitong Recipe had a significantly better effect on reducing TCM syndrome scores than alendronic acid. The sodium control group (P<0.05) showed that Zhuanggu Zhitong Recipe had a better effect on improving TCM syndromes than alendronate sodium.
Table 8.
Comparison of the difference in TCM syndrome scores between the two groups before and after treatment (x̅±s)
| Group | Number of samples | Difference before and after treatment | t | P | 95% CI of difference |
|---|---|---|---|---|---|
| Zhuanggu Zhitong Recipe Group | 46 | 10.60±1.71 | 3.20 | 0.002 | 0.484~2.066 |
| Alendronate sodium group | 45 | 9.33±2.06 |
Note: A normality test was conducted on the difference between the two groups of TCM syndrome scores before and after therapy. The results were 0.095 and 0.084 respectively, which satisfied normality. The homogeneity of variance test L(1,89)=2.578, P=0.112, homogeneity of variances, using independent samples T test.
Figure 5.
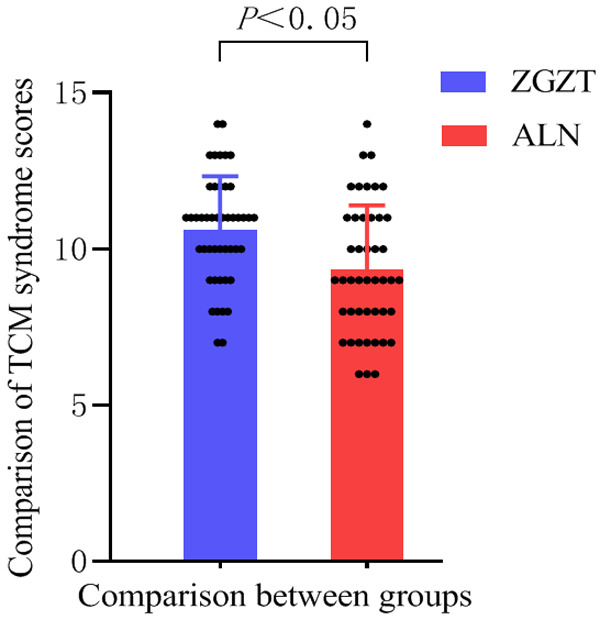
Comparison of the difference in TCM syndrome scores between the two groups before and after treatment.
Comparison of NRS scores for low back pain
The results of the NRS score of low back pain are shown in Table 9 and Figure 6: Both the Zhuanggu Zhitong prescription treatment group and the alendronate sodium control group showed lower NRS scores of low back pain (P<0.001), indicating that both Zhuanggu Zhitong Recipe and alendronate sodium have good effects on relieving low back pain.
Table 9.
Comparison of changes in waist pain NRS scores before and after treatment (x̅±s)
| Group | Number of samples | Before treatment | After treatment | t | P |
|---|---|---|---|---|---|
| Zhuanggu Zhitong Recipe Group | 46 | 5.26±0.50 | 2.84±0.76 | 22.92 | 0.001 |
| Alendronate sodium group | 45 | 5.31±0.49 | 3.53±0.54 | 19.40 | 0.001 |
Note: The difference in NRS scores of cold waist pain before and after treatment in the Zhuanggu Zhitong Recipe group and the alendronate sodium group were calculated respectively. The normality test was performed on the difference in NRS scores of cold waist pain before and after remedy in the two groups. The outcomes were 0.202 and 0.233, satisfying normality, using paired sample T test.
Figure 6.
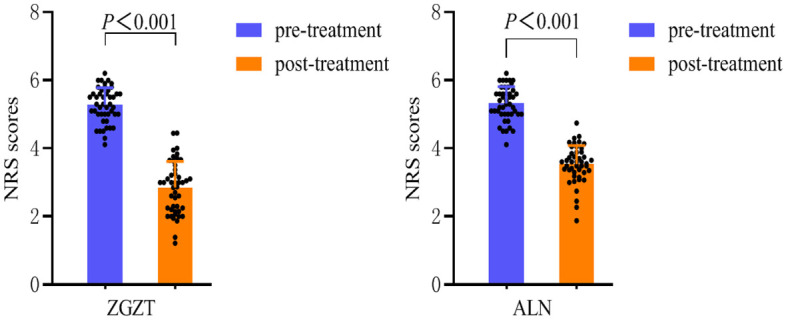
Comparison of NRS scores of cold waist pain in the two groups before and after treatment.
The outcomes are shown in Table 10 and Figure 7. After treatment, the difference in NRS score of cold pain in the waist was compared between the two groups. The improvement of NRS score in the alendronate sodium group was more significant than that of the Zhuanggu Zhitong Recipe group.
Table 10.
Comparison of the difference in waist pain NRS scores between the two groups before and after treatment (x̅±s)
| Group | Number of samples | Difference before and after treatment | t | P | 95% CI of difference |
|---|---|---|---|---|---|
| Zhuanggu Zhitong Recipe Group | 46 | 2.42±0.71 | 4.68 | 0.019 | 0.365~0.922 |
| Alendronate sodium group | 45 | 1.76±0.61 |
Note: The normality test was performed on the difference in NRS scores of cold waist pain between the two groups before and after treatment. The results were 0.202 and 0.233 respectively, which satisfied the normality. The homogeneity of variance test L(1,89)=1.082, P=0.301, indicating homogeneous variances, using the independent sample T test.
Figure 7.
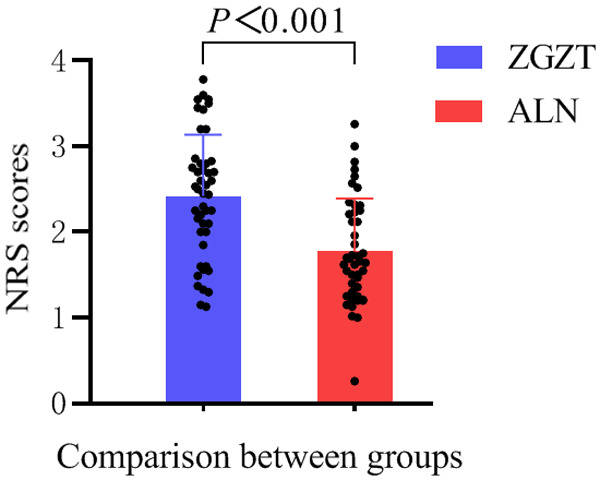
Comparison of the differences between the two groups of low back pain NRS scores before and after treatment.
AMPK content comparison
The AMPK content results are shown in Tables 11, 12 and Figure 8: Both the Zhuanggu Zhitong Recipe treatment group and the alendronate sodium control group of postmenopausal osteoporosis patients had increased AMPK content in the serum. (P<0.001). This indicated that both Zhuanggu Zhitong Recipe and alendronate sodium could effectively reduce AMPK content levels. In order to clarify whether there was a correlation between AMPK levels and postmenopausal osteoporosis, this study further analyzed the linear correlation between AMPK levels in serum and clinical characteristics of patients.
Table 11.
Changes in AMPK content in the two groups before and after treatment (x̅±s)
| Group | Number of samples | Before treatment | After treatment | t | P | |
|---|---|---|---|---|---|---|
| AMPK (pg/mL) | Zhuanggu Zhitong Recipe Group | 46 | 11.31±0.44 | 14.04±0.62 | -28.10 | 0.001 |
| alendronate sodium group | 45 | 11.26±0.38 | 14.12±0.61 | -31.52 | 0.001 |
Note: The difference in AMPK expression levels between the Zhuanggu Zhitong Recipe group and the alendronate sodium group before and after treatment was calculated respectively. A normality test was performed on the differences between the two groups. The results were 0.274 and 0.951 respectively, which met normality. Adopt Paired samples T-test.
Table 12.
Comparison of AMPK content differences between the two groups before and after treatment (x̅±s)
| Group | Number of samples | Difference before and after treatment | t | P | 95% CI of difference | |
|---|---|---|---|---|---|---|
| AMPK (pg/mL) | Zhuanggu Zhitong Recipe Group | 46 | 2.73±0.65 | -0.939 | 0.350 | -0.318-0.139 |
| Alendronate sodium group | 45 | 2.85±0.60 |
Note: The difference in AMPK expression levels between the Zhuanggu Zhitong Recipe group and the alendronate sodium group before and after treatment was calculated respectively. A normality test was performed on the differences between the two groups. The results were 0.274 and 0.951 respectively, which satisfied the normality. The differences between the two groups were tested for homogeneity of variances, L(1,89)=0.357, P=0.552, which satisfied the homogeneity of variances, and the independent sample T test was used.
Figure 8.

Comparison of AMPK content changes before and after treatment and AMPK content difference before and after treatment.
Correlation analysis between AMPK content and patient clinical information
The results of Pearson’s correlation analysis are shown in Table 13. The correlation coefficient between AMPK content and BMD in the serum of postmenopausal osteoporosis patients is r=0.296, P<0.05, which illustrates a relationship between AMPK content and bone density in postmenopausal osteoporosis patients. There was a significant positive correlation between them. The correlation coefficient between AMPK content and E2 was r=0.280, P<0.05, indicating that there is a positive correlation (Figures 9, 10).
Table 13.
Correlation analysis between BMD and E2 and AMPK amount respectively
Note: The normality test results of AMPK, BMD and E2 are 0.142, 0.08 and 0.097 respectively. The two sets of data conform to the normal distribution.
indicates comparison with AMPK group, P<0.05.
indicates comparison with BMD group, P<0.05.
Figure 9.
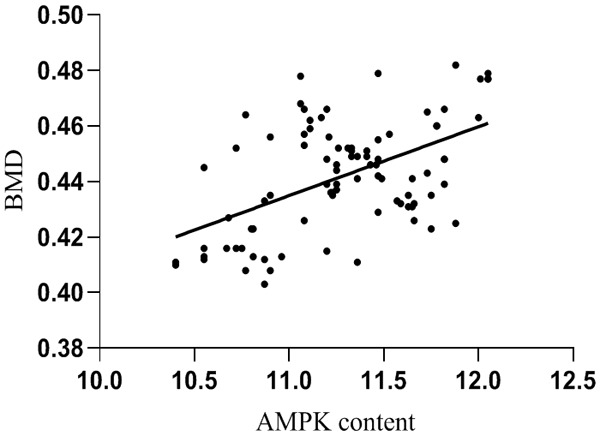
Correlation analysis between BMD and AMPK content.
Figure 10.
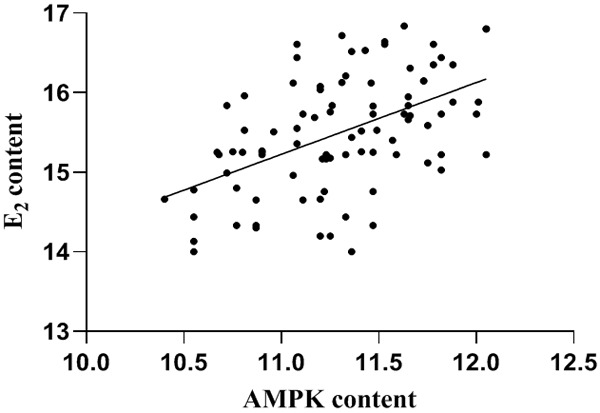
Correlation analysis between E2 and AMPK content.
Comparison of serum Ca2+, P, Fe and E2 levels
The results of serum Ca2+, P, Fe and E2 contents are shown in Table 14 and Figure 11: Both the Zhuanggu Zhitong Recipe treatment group and the alendronate sodium control group were able to increase Ca2+, P, Fe and E2 levels (P<0.001), indicating that both Zhuanggu Zhitong Recipe and alendronate sodium can significantly increase Ca2+, P, Fe and E2.
Table 14.
Comparison of changes in Ca2+, P, Fe and E2 between the two groups before and after treatment (χ±s)
| Group | Number of samples | Before treatment | After treatment | t | P | |
|---|---|---|---|---|---|---|
| Ca2+ (mmol/L) | Zhuanggu Zhitong Recipe Group | 46 | 2.52±0.13 | 2.65±0.13 | -31.64 | 0.001 |
| alendronate sodium group | 45 | 2.48±0.14 | 2.60±0.14 | -36.34 | 0.001 | |
| P (mmol/L) | Zhuanggu Zhitong Recipe Group | 46 | 1.24±0.09 | 1.09±0.08 | 51.88 | 0.001 |
| alendronate sodium group | 45 | 1.26±0.07 | 1.11±0.08 | 64.15 | 0.001 | |
| Fe (μmol/L) | Zhuanggu Zhitong Recipe Group | 46 | 17.60±2.10 | 18.67±2.13 | -32.70 | 0.001 |
| alendronate sodium group | 45 | 17.63±1.74 | 18.48±1.76 | -28.31 | 0.001 | |
| E2 (mmol/L) | Zhuanggu Zhitong Recipe Group | 46 | 15.47±0.74 | 18.77±0.70 | -48.51 | 0.001 |
| alendronate sodium group | 46 | 2.52±0.13 | 2.65±0.13 | -36.51 | 0.001 |
Note: We calculated the difference of Ca2+, P, Fe and E2 content before and after treatment between the Strong Bone Pain Relieving Formula group and the alendronate group, and carried out the normality test on the difference of the two groups. The results were 0.112 and 0.119, 0.107 and 0.100, 0.107 and 0.156, 0.119 and 0.248, respectively, and the difference of the data in the two groups satisfied the normality. The paired samples t-test was used.
Figure 11.
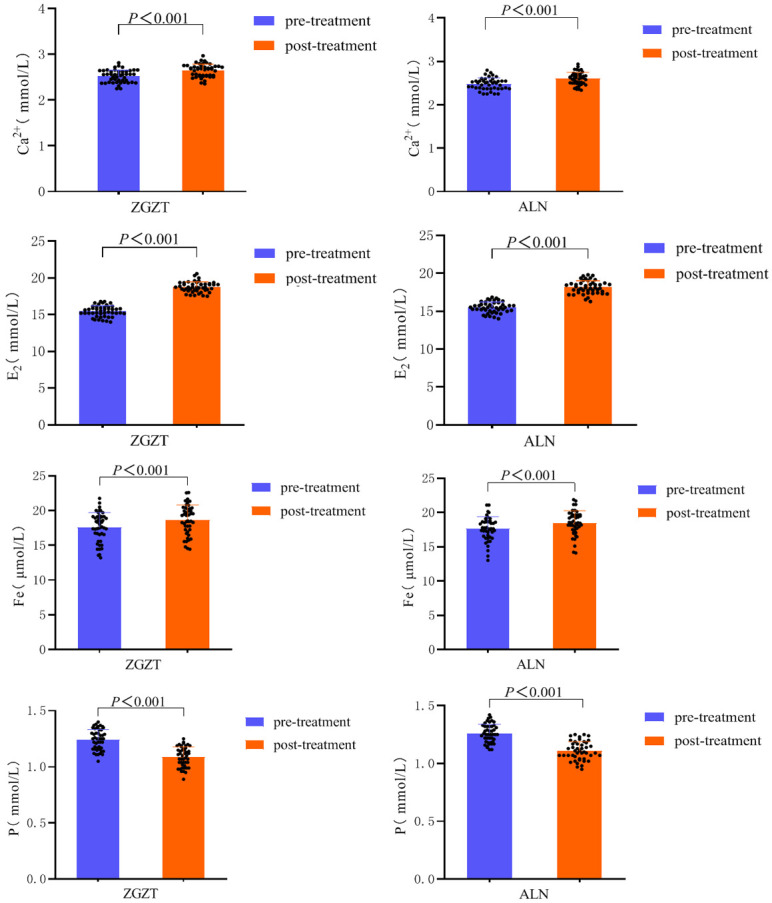
Changes in Ca2+, P, Fe and E2 contents in the two groups before and after treatment.
Serum Ca2+, P, Fe and E2 levels are shown in Table 15 and Figure 12: Calcium ions and blood phosphorus concentrations between the Zhuanggu Zhitong Recipe treatment group and the alendronate sodium control group with no statistical significance in the difference (P>0.05). The comparison of serum Fe levels between groups showed that Zhuanggu Zhitong Recipe was more significant in increasing the patient’s serum iron level (P<0.001). The inter-group comparison of E2 levels in the Zhuanggu Zhitong Recipe treatment group was increased more than that of the alendronate control group (P<0.001), indicating that both groups can significantly increase the patient’s blood calcium concentration and E2 content, but in the improvement The difference in E2 levels in the Zhuanggu Zhitong Recipe treatment group was more significant than that in the alendronate sodium control group.
Table 15.
Comparison of differences in Ca2+, P, Fe, and E2 between the two groups before and after treatment (x̅±s)
| Group | Number of samples | Difference before and after treatment | t | P | 95% CI of difference | |
|---|---|---|---|---|---|---|
| Ca2+ (mmol/L) | Zhuanggu Zhitong Recipe Group | 46 | 0.126±0.027 | 0.779 | 0.434 | -0.006~0.014 |
| Alendronate sodium group | 45 | 0.122±0.019 | ||||
| P (mmol/L) | Zhuanggu Zhitong Recipe Group | 46 | 0.152±0.015 | 0.711 | 0.479 | -0.004~0.010 |
| Alendronate sodium group | 45 | 0.149±0.152 | ||||
| Fe (μmol/L) | Zhuanggu Zhitong Recipe Group | 46 | 1.07±0.22 | 5.191 | 0.001 | 0.141~0.316 |
| Alendronate sodium group | 45 | 0.84±0.19 | ||||
| E2 (mmol/L) | Zhuanggu Zhitong Recipe Group | 46 | 3.29±0.46 | 6.467 | 0.001 | 0.445~0.841 |
| Alendronate sodium group | 45 | 2.65±0.48 |
Note: For Ca2+, P, Fe, and E2, the difference between the contents of the two groups before and after treatment was calculated respectively, and the normality test was performed on the difference between the two groups respectively. Results of Ca2+, P, Fe, and E2 were 0.301 and 0.420, 0.085 and 0.333, 0.107 and 0.156, and 0.119 and 0.248, respectively. For the test of chi-square L(1,89)=2.486, P=0.118, L(1,89)=2.276, P=0.135, test L(1,89)=0.038, P=0.845, L(1,89)=0.159, P=0.691, variance chi-squaredness was satisfied, and independent samples t-test was used.
Figure 12.
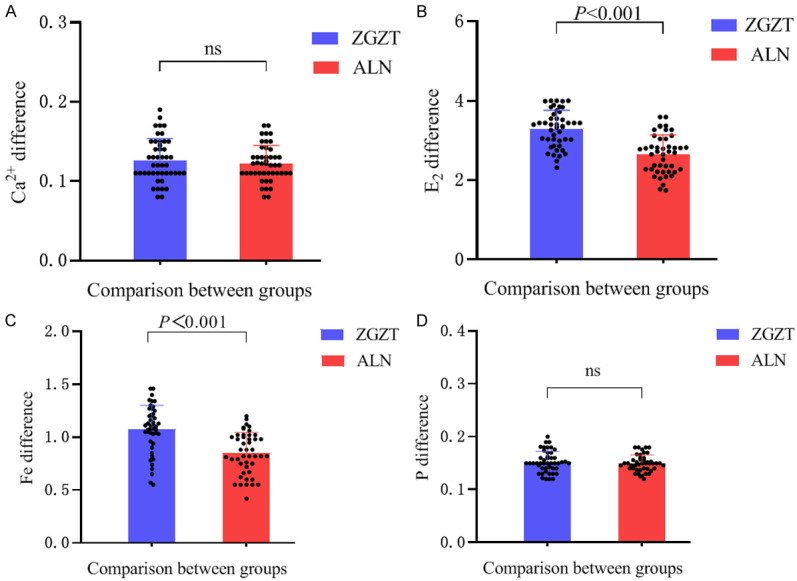
Comparison of differences between the two groups of Ca2+, P, Fe and E2 before and after treatment. Note: A is the comparison of the Ca2+ difference between the two groups, B is the comparison of the E2 difference between the two groups, C is the comparison of the serum iron difference between the two groups, and D is the comparison of the blood phosphorus difference between the two groups.
Comparison of serum IL-17 and IL-1 levels
The results of serum IL-17 and IL-1 levels before and after treatment are shown in Table 16 and Figure 13: Both the Zhuanggu Zhitong Recipe treatment group and the alendronate sodium control group had reduced IL-17 and IL-1 levels (P<0.001), indicating that both Zhuanggu Zhitong Recipe and alendronate sodium had a good effect on reducing inflammatory indicators.
Table 16.
Changes in IL-17 and IL-1 levels in the two groups before and after treatment (χ±s)
| Group | Number of samples | Before treatment | After treatment | t | P | |
|---|---|---|---|---|---|---|
| IL-17 (ng/L) | Zhuanggu Zhitong Recipe Group | 46 | 141.83±7.48 | 118.59±8.17 | 39.78 | 0.001 |
| Alendronate sodium group | 45 | 141.96±6.13 | 119.52±7.82 | 30.42 | 0.001 | |
| IL-1 (ng/L) | Zhuanggu Zhitong Recipe Group | 46 | 89.98±4.48 | 76.46±4.50 | 137.78 | 0.001 |
| Alendronate sodium group | 45 | 90.85±5.00 | 77.33±5.01 | 121.36 | 0.001 |
Note: For IL-17, the difference between the two groups before and after therapy was calculated respectively, and the normality test was performed on the difference between the two groups. The results were 0.108 and 0.404 respectively, both of which were greater than 0.05. Normality was satisfied, and the Paired samples T-test was used. For IL-1, the difference between the two groups before and after therapy was calculated respectively, and the normality test was performed on the difference between the two groups. The results were 0.224 and 0.623 respectively, both of which were greater than 0.05. Normality was satisfied, and the Paired samples T-test was used.
Figure 13.
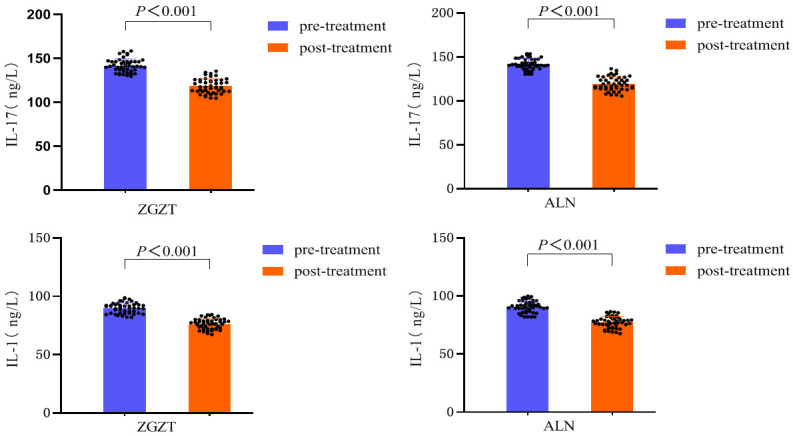
Changes in IL-17 and IL-1 levels in the two groups before and after treatment.
Serum IL-17 and IL-1 contents before and after treatment are shown in Table 17 and Figure 14. There was no difference between IL-17 and IL-1 before and after treatment in the two groups (P>0.05).
Table 17.
Comparison of the differences between the two groups of IL-17 and IL-1 before and after treatment (x̅±s)
| Group | Number of samples | Difference before and after treatment | t | P | 95% CI of difference | |
|---|---|---|---|---|---|---|
| IL-17 (ng/L) | Zhuanggu Zhitong Recipe Group | 46 | 23.23±3.96 | 0.852 | 0.396 | -1.065~2.664 |
| Alendronate sodium group | 45 | 22.32±4.65 | ||||
| IL-1 (ng/L) | Zhuanggu Zhitong Recipe Group | 46 | 13.52±0.66 | 0.019 | 0.985 | -0.292~0.297 |
| Alendronate sodium group | 45 | 13.51±0.74 |
Note: For IL-17, the difference between the two groups before and after remedy was calculated respectively, and the normality test was performed on the difference between the two groups. The results were 0.108 and 0.404 respectively, both of which were greater than 0.05, satisfying normality and having homogeneous variances. The homogeneity test L(1,89)=2.464, P=0.120, meets the homogeneity of variances, and uses the independent sample T test. For IL-1, the difference between the two groups before and after remedy was calculated respectively, and the normality test was performed on the difference between the two groups. The results were 0.224 and 0.623 respectively, both of which were greater than 0.05, satisfying normality and homogeneity of variance. The test L(1,89)=1.129, P=0.291, met the homogeneity of variances, and the independent sample T test was used.
Figure 14.
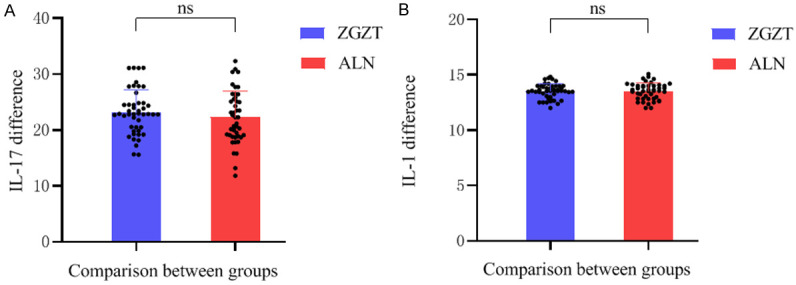
Comparison of differences in IL-17 and IL-1 levels between the two groups before and after treatment. Note: (A) The image is the comparison of the IL-17 difference between the two groups, and (B) the image is the comparison of the IL-1 difference between the two groups.
Comparison of bone formation markers
The results of bone formation markers are shown in Table 18 and Figure 15: Both the Zhuanggu Zhitong Recipe treatment group and the alendronate control group had improved bone formation markers ALP and P in postmenopausal osteoporosis patients. The INP level (P<0.001) shows that both Zhuanggu Zhitong Recipe and alendronate sodium had a good effect on promoting bone formation.
Table 18.
Comparison of bone formation-related marker levels before and after treatment (χ±s)
| Group | Number of samples | Before treatment | After treatment | t | P | |
|---|---|---|---|---|---|---|
| ALP (U/L) | Zhuanggu Zhitong Recipe Group | 46 | 108.15±5.06 | 122.05±5.56 | -38.20 | 0.001 |
| Alendronate sodium group | 45 | 109.34±4.99 | 123.06±5.42 | -30.99 | 0.001 | |
| PINP (ng/ml) | Zhuanggu Zhitong Recipe Group | 46 | 40.31±1.40 | 45.71±1.57 | -33.47 | 0.001 |
| Alendronate sodium group | 45 | 39.84±1.29 | 44.30±1.46 | -24.72 | 0.001 |
Note: The difference between the two groups before and after treatment was calculated for ALP, and the normality test was performed on the difference between the two groups. The results were 0.152 and 0.257, respectively, both greater than 0.05, which satisfied normality. Paired sample T was used test. For PINP, the difference between the two groups before and after remedy was calculated respectively, and the normality test was performed on the difference between the two groups. The results were 0.108 and 0.113 respectively, both of which were greater than 0.05, which satisfied normality. Paired sample T was used test.
Figure 15.
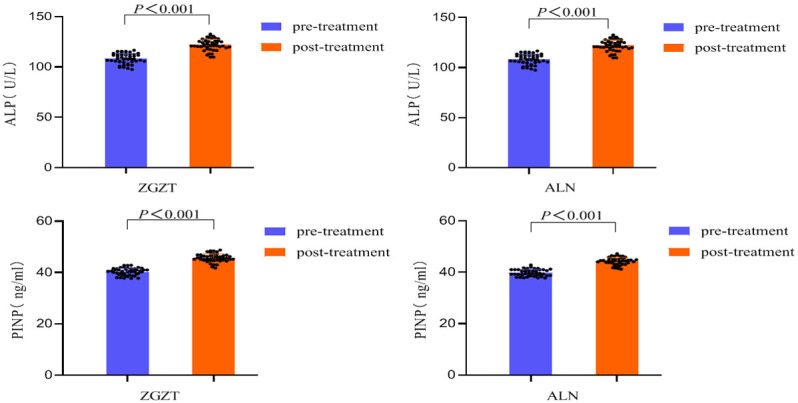
Intra-group comparison of ALP and PINP levels between the two groups before and after treatment.
The difference outcomes of bone formation-related marker levels between the two groups before and after therapy are shown in Table 19 and Figure 16: After treatment, the bone formation-related indicators (ALP, PINP) were compared between the two groups. No significant difference was found in the improvement of ALP (P>0.05), but for the improvement of PINP, the Zhuanggu Zhitong Recipe group was sharply better than the alendronate sodium group (P<0.05), indicating that the Zhuanggu Zhitong Recipe is effective in promoting PINP. The production effect was better than that of alendronate sodium.
Table 19.
Comparison of differences between 19 groups of bone formation related marker levels before and after treatment (x̅±s)
| Group | Number of samples | Difference before and after treatment | t | P | 95% CI of difference | |
|---|---|---|---|---|---|---|
| ALP (U/L) | Zhuanggu Zhitong Recipe Group | 46 | 13.85±2.45 | 0.242 | 0.809 | -0.996~1.272 |
| Alendronate sodium group | 45 | 13.71±2.96 | ||||
| PINP (ng/ml) | Zhuanggu Zhitong Recipe Group | 46 | 5.39±1.09 | 3.870 | 0.001 | 0.455~1.415 |
| Alendronate sodium group | 45 | 4.46±1.21 |
Note: For ALP, the difference between the two groups before and after therapy was calculated respectively, and the normality test was performed on the difference between the two groups. The results were 0.152 and 0.257 respectively, both of which were greater than 0.05, which satisfied normality and homogeneity of variance test. Result: L(1,89)=2.393, P=0.125, which meets the homogeneity of variances, and the independent sample T test is used. For PINP, the difference between the two groups before and after therapy was calculated respectively, and the normality test was performed on the difference between the two groups. The results were 0.108 and 0.113 respectively, both of which were greater than 0.05, which satisfied normality and homogeneity of variance test. Result: L(1,89)=0.538, P=0.465, meeting the homogeneity of variances, using the independent sample T test.
Figure 16.
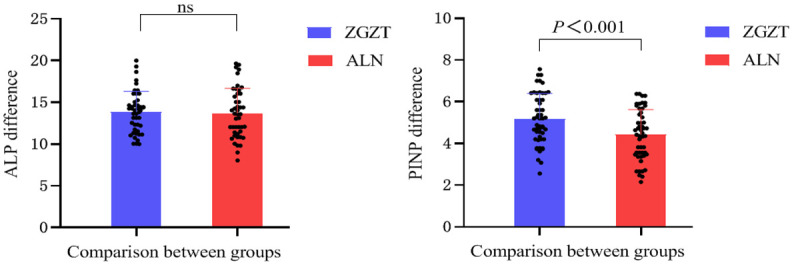
Comparison of bone formation-related marker levels between the two groups before and after treatment.
The two groups based on the levels of bone resorption markers (L-NTX, TRACP-5b) are shown in Table 20 and Figure 17: Both the Zhuanggu Zhitong Recipe treatment group and the alendronate sodium control group had lower bone resorption markers (L-NTX, TRACP-5b) levels (P<0.001), indicating that both Zhuanggu Zhitong Recipe and alendronate sodium have the regulatory effect of significantly reducing the levels of L-NTX and TRACP-5b.
Table 20.
Comparison of L-NTX and TRACP-5b levels between the two groups before and after treatment (χ±s)
| Group | Number of samples | Before treatment | After treatment | t | P | |
|---|---|---|---|---|---|---|
| L-NTX (nmolBCE/L) | Zhuanggu Zhitong Recipe Group | 46 | 83.14±3.09 | 61.96±4.82 | 31.41 | 0.001 |
| Alendronate sodium group | 45 | 83.20±2.73 | 59.70±4.60 | 44.58 | 0.001 | |
| TRACP-5b (U/L) | Zhuanggu Zhitong Recipe Group | 46 | 3.79±0.47 | 3.42±0.47 | 889.96 | 0.001 |
| Alendronate sodium group | 45 | 3.87±0.50 | 3.48±0.50 | 943.13 | 0.001 |
Note: The differences of L-NTX and TRACP-5b content before and after treatment were calculated for the two groups respectively, and the normality test was conducted for the differences of the two groups. Results were 0.353 and 0.142, 0.260 and 0.134 respectively, which were all greater than 0.05, which satisfied normality and the paired samples t-test was used.
Figure 17.
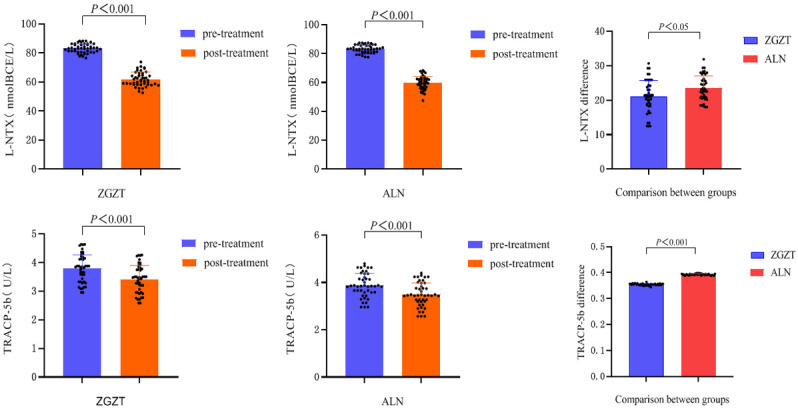
Intra-group comparison of L-NTX and TRACP-5b levels before and after treatment between the two groups and inter-group comparison of the differences before and after treatment.
The difference in results of L-NTX and TRACP-5b between the two groups before and after therapy are shown in Table 21 and Figure 17. The alendronate control group had an excellent improvement effect on the bone resorption markers L-NTX and TRACP-5b as did the Zhuanggu Zhitong Recipe treatment group (P<0.05).
Table 21.
Comparison of differences between the two groups before and after treatment with L-NTX and TRACP-5b (χ±s)
| Group | Number of samples | Difference before and after treatment | t | P | 95% CI of difference | |
|---|---|---|---|---|---|---|
| L-NTX (nmolBCE/L) | Zhuanggu Zhitong Recipe Group | 46 | 21.17±4.57 | -2.71 | 0.008 | -4.033~-0.623 |
| Alendronate sodium group | 45 | 23.50±3.53 | ||||
| TRACP-5b (U/L) | Zhuanggu Zhitong Recipe Group | 46 | 0.374±0.002 | -31.98 | 0.001 | -0.019~-0.017 |
| Alendronate sodium group | 45 | 0.392±0.002 |
Note: L-NTX content between the two groups before and after treatment was calculated separately, and the normality test was performed on the difference between the two groups. The results were 0.353 and 0.142 respectively, both greater than 0.05, which satisfied normality and having homogeneous variances. The results of the homogeneity test: L(1,89)=1.252, P=0.266, satisfying the homogeneity of variances, using the independent sample T test. TRACP-5b content between the two groups before and after remedy was calculated respectively, and the normality test was performed on the difference between the two groups. The results were 0.260 and 0.134 respectively, both greater than 0.05, satisfying normality and variance. Homogeneity test results: L(1,89)=0.024, P=0.876, which meets the homogeneity of variances and used the independent sample T test.
Comparison of osteoporosis effect assessment
Osteoporosis efficacy evaluation criteria
The results of the two groups in improving osteoporosis are shown in Table 22: Comparison of the efficacy showed a significant difference (P<0.05). The alendronate sodium improvement of bone density value was better better than Zhuanggu Zhitong Recipe.
Table 22.
Comparison of osteoporosis therapeutic effects (N%)
| Group | Number of samples | Effective | Efficient | Invalid | Z | P |
|---|---|---|---|---|---|---|
| Zhuanggu Zhitong Recipe Group | 46 | 33 (71.7) | 13 (28.3) | 0 | -2.042 | 0.041 |
| Alendronate sodium group | 45 | 40 (88.9) | 5 (11.1) | 0 |
Note: Using the rank sum test, the average rank of the Zhuanggu Zhitong Recipe group was 42.14, and the average rank of the alendronate sodium group was 49.94; Z=-2.042, P=0.041.
TCM syndrome efficacy evaluation criteria
The results are shown in Table 23. The comparison of the efficacy of traditional Chinese medicine syndrome between the two groups shows that the Zhuanggu Zhitong Recipe group is better than alendronate sodium in terms of systemic care for postmenopausal osteoporosis patients.
Table 23.
Comparison of efficacy of 5 TCM syndromes (N%)
| Group | Number of samples | get well | Effective | efficient | invalid | Z | P |
|---|---|---|---|---|---|---|---|
| Zhuanggu Zhitong Recipe Group | 46 | 5 (11.8) | 39 (84.5) | 2 (3.7) | 0 | -2.906 | 0.004 |
| alendronate sodium group | 45 | 2 (4.4) | 30 (66.7) | 13 (28.99) | 0 |
Note: Using the rank sum test, the average rank of the Zhuanggu Zhitong Recipe group is 57.10, and the average rank of the alendronate sodium group is 44.88; Z=-2.906, P=0.004.
Discussion
Improvement of bone turnover marker levels and bone density
We found that bone resorption markers NTX and TRAP-5b were reduced after treatment in the Strong Bone Pain Relieving Capsules group, and 25-OH-VD was significantly increased in both groups after treatment, but the magnitude of the elevation was not significantly different between the two groups. Bone mineral density is the gold standard for the diagnosis of osteoporosis [12], and by using dual-energy X-ray absorptiometry to measure femoral bone mineral density and dual-utilizing bone mineral density (BMD) before and after treatment, this suggests that the Strong Bone Relief Formula has a promising role to play in the treatment of postmenopausal osteoporosis.
Improvement of TCM syndromes
Traditional Chinese medicine considers “deficiency” and “stasis” as the main pathogenesis of postmenopausal osteoporosis [13]. Bone-strengthening and pain-relieving capsule is one of the effective drugs for the treatment of postmenopausal osteoporosis under the guidance of the theory of replenishing deficiency and regulating stasis. This study showed that the group of Bone-strengthening and Pain Relieving Capsules could significantly improve the TCM evidence points and significantly reduce the clinical symptoms such as low back pain, lumbar and knee soreness, and calf cramps. Although there were some differences between the group and alendronate group in improving bone density, it was significantly better than the alendronate group in improving patients’ clinical symptoms and systemic care effects.
Improvement of serum Ca2+, P, Fe and E2
As an important estrogen for women [14], E2 can promote the proliferation and differentiation of osteoblasts to promote bone formation. It can also inhibit the formation and activity of osteoclasts and reduce bone resorption [15]. In this study, after 24 weeks of treatment, Zhuanggu Zhitong Recipe can significantly increase E2 levels. Compared to the alendronate sodium group, its effect was more significant. This is consistent with the results of some studies confirming that traditional Chinese medicine has an estrogen-like effect.
The imbalance of calcium and phosphorus metabolism will lead to increased secretion of parathyroid hormone (PTH), thereby increasing bone resorption [16]. This study found that the serum Ca2+ concentration of postmenopausal osteoporosis patients was significantly increased after treatment with Zhuanggu Zhitong Recipe, and there was no statistical difference between the increase in serum calcium concentration and the alendronic acid group.
Serum iron plays a crucial role in bone health and maintenance [17]. In this study, serum iron concentration was slightly elevated after treatment in both groups, but the degree of elevation was significantly higher in the group of The Strong Waist Tong Fang than in the group of Alendronic Acid.
Improvement in serum IL-17 and IL-1
Autophagy can inhibit osteoclast proliferation and differentiation by regulating T cells and suppressing the release of inflammatory factors [18]. Liu [19] et al. found that ozone can regulate autophagy in OA chondrocytes through the AMPK/mTOR signaling pathway, thereby inhibiting the release of inflammatory factors, suggesting that inflammatory factors are the main factors causing articular cartilage pain [20]. This study found that after 24 weeks of drug treatment, The Zhuanggu Zhitong Recipe treatment group significantly reduced IL-17 and IL-1 levels, indicating that Zhuanggu Zhitong Recipe has good efficacy in improving osteoporotic pain and slowing bone loss.
Correlation analysis between AMPK content and bone density
We propose a hypothesis: Zhuanggu Zhitong Recipe may play a role in treating postmenopausal osteoporosis by regulating autophagy through the AMPK signaling pathway.
Clinical study summary
Zhuanggu Zhitong Recipe combined with calcium carbonate D(II) can significantly increase the AMPK content. AMPK has a significant positive correlation with bone density. Zhuanggu Zhitong Recipe may improve the level of autophagy by positively regulating AMPK levels in osteoporosis.
Acknowledgements
This study was supported by the Liuzhou Science and Technology Program (No. 2022CAC0218); Natural Science Foundation of Guangxi Zhuang Autonomous Region (No. 2020GXNSFAA297099); 2023 Central Subsidies for Guangxi’s Seventh Batch of National Famous Elderly Chinese Medicine Workshop Construction Project (Liu Zhaoning) (01.01.24.01).
Disclosure of conflict of interest
None.
References
- 1.Lane JM, Russell L, Khan SN. Osteoporosis. Clin Orthop Relat Res. 2000:139–150. doi: 10.1097/00003086-200003000-00016. [DOI] [PubMed] [Google Scholar]
- 2.China Association of Traditional Chinese Medicine. Guidelines for the diagnosis and treatment of postmenopausal osteoporosis (bone failure) with traditional Chinese medicine (2019 edition) Traditional Chinese Medicine Osteopathic. 2020;32:1–13. [Google Scholar]
- 3.Li X, Xu J, Dai B, Wang X, Guo Q, Qin L. Targeting autophagy in osteoporosis: from pathophysiology to potential therapy. Ageing Res Rev. 2020;62:101098. doi: 10.1016/j.arr.2020.101098. [DOI] [PubMed] [Google Scholar]
- 4.Yin X, Zhou C, Li J, Liu R, Shi B, Yuan Q, Zou S. Correction to: Autophagy in bone homeostasis and the onset of osteoporosis. Bone Res. 2020;8:36. doi: 10.1038/s41413-020-00114-0. [DOI] [PMC free article] [PubMed] [Google Scholar]
- 5.Liu P, Zhou J, Cui H, Xu J, Ruan G, Ding C, Wang K. Vitamin D plays a protective role in osteoarthritis by regulating AMPK/mTOR signalling pathway to activate chondrocyte autophagy. Clin Exp Rheumatol. 2024;42:736–745. doi: 10.55563/clinexprheumatol/chmuts. [DOI] [PubMed] [Google Scholar]
- 6.Wong CH, Kan AKC, Tsoi KH, Chan SSY, Jiang NS, Loong CHN, Fong CHY, Wong JSH, Shea GKH, Cheung CL, Lee CH, Tan KCB, Woo YC, Lui DTW. Clinical characteristics, densitometric parameters and outcomes of patients with atypical femoral fractures related to bisphosphonate treatment for osteoporosis. Endocrine. 2024;84:223–235. doi: 10.1007/s12020-023-03608-z. [DOI] [PubMed] [Google Scholar]
- 7.Zhang ND, Han T, Huang BK, Rahman K, Jiang YP, Xu HT, Qin LP, Xin HL, Zhang QY, Li YM. Traditional Chinese medicine formulas for the treatment of osteoporosis: implication for antiosteoporotic drug discovery. J Ethnopharmacol. 2016;189:61–80. doi: 10.1016/j.jep.2016.05.025. [DOI] [PubMed] [Google Scholar]
- 8.Ma J, Ye M, Li Y, Chai S, Huang H, Lian X, Huang H. Zhuanggu Zhitong Capsule alleviates osteosarcopenia in rats by up-regulating PI3K/Akt/Bcl2 signaling pathway. Biomed Pharmacother. 2021;142:111939. doi: 10.1016/j.biopha.2021.111939. [DOI] [PubMed] [Google Scholar]
- 9.Guidelines for Diagnosis and Treatment of Primary Osteoporosis (2022) Chinese Journal of Osteoporosis and Bone Mineral Diseases. 2022;15:573–611. [Google Scholar]
- 10.Dai S, Xue JG. Diagnostic and therapeutic efficacy standards of Chinese medicine. Beijing: People’s Health Publishing House; 2001. pp. 165–166. [Google Scholar]
- 11.Zheng XY. Guiding principles for clinical research of new Chinese medicines (for Trial Implementation) Beijing: China Pharmaceutical Science and Technology Press; 2002. pp. 233–237. [Google Scholar]
- 12.Shevroja E, Cafarelli FP, Guglielmi G, Hans D. DXA parameters, Trabecular Bone Score (TBS) and Bone Mineral Density (BMD), in fracture risk prediction in endocrine-mediated secondary osteoporosis. Endocrine. 2021;74:20–28. doi: 10.1007/s12020-021-02806-x. [DOI] [PMC free article] [PubMed] [Google Scholar]
- 13.Cai XY, Chen Y, Chen SQ, Yu J, Lei XM. Study on the mechanism of Zhuanggu Zhitong Recipe inhibiting bone resorption through RANKL/RANK signaling pathway. Chinese Journal of Osteoporosis. 2023;29:1333–1339. [Google Scholar]
- 14.Fernandez C, Tennyson J, Priscilla AS. Osteoporosis and its association with vitamin D receptor, oestrogen α receptor, parathyroid receptor and collagen type I alpha receptor gene polymorphisms with bone mineral density: a pilot study from South Indian postmenopausal women of Tamil Nadu. Biochem Genet. 2022;60:2015–2036. doi: 10.1007/s10528-022-10197-5. [DOI] [PubMed] [Google Scholar]
- 15.Zhang YW, Huan C, Huang TR, Tang ZD. Research on how isopsoralen mediates BMP2/Runx2/Osx signaling pathway to promote osteoblast proliferation and differentiation. World Science and Technology - Modernization of Traditional Chinese Medicine. 2023;25:2677–2683. [Google Scholar]
- 16.Couce ML, Saenz De Pipaon M. Bone mineralization and calcium phosphorus metabolism. Nutrients. 2021;13:3692. doi: 10.3390/nu13113692. [DOI] [PMC free article] [PubMed] [Google Scholar]
- 17.Zhang H, Yang F, Cao Z, Xu Y, Wang M. The influence of iron on bone metabolism disorders. Osteoporos Int. 2024;35:243–253. doi: 10.1007/s00198-023-06937-x. [DOI] [PubMed] [Google Scholar]
- 18.Wang T, He C. TNF-α and IL-6: the link between immune and bone system. Curr Drug Targets. 2020;21:213–227. doi: 10.2174/1389450120666190821161259. [DOI] [PubMed] [Google Scholar]
- 19.Liu L, Bai H, Jiao G, Wang X, Zhang Z, Song X, Ma T, Li T, Gao L. CF101 alleviates OA progression and inhibits the inflammatory process via the AMP/ATP/AMPK/mTOR axis. Bone. 2022;155:116264. doi: 10.1016/j.bone.2021.116264. [DOI] [PubMed] [Google Scholar]
- 20.Bhadricha H, Patel V, Singh AK, Savardekar L, Patil A, Surve S, Desai M. Increased frequency of Th17 cells and IL-17 levels are associated with low bone mineral density in postmenopausal women. Sci Rep. 2021;11:16155. doi: 10.1038/s41598-021-95640-0. [DOI] [PMC free article] [PubMed] [Google Scholar]


