Abstract
Protein misfolding fuels multiple neurodegenerative diseases, but existing techniques lack the resolution to pinpoint the location and physical properties of aggregates within living cells. Our protocol describes high-resolution confocal and fluorescent lifetime microscopy (Fast 3D FLIM) of an aggregation probing system. This system involves a metastable HaloTag protein (HT-aggr) labeled with P1 solvatochromic fluorophore, which can be targeted to subcellular compartments. This strategy allows to distinguish between aggregated and folded probe species, since P1 fluorophore changes its lifetime depending on the hydrophobicity of its microenvironment. The probe is not fluorescence intensity-dependent, overcoming issues related to intensity-based measurements of labeled proteins, such as control of probe quantity due to differences in expression or photobleaching of a proportion of the fluorophore population. Our approach reports on the performance of the machinery dealing with aggregation-prone substrates and thus opens doors to studying proteostasis and its role in neurodegenerative diseases.
Key features
• Aggregation state: Tracks aggregate formation and disaggregation with pulse-chase experiments
• Sub-organellar resolution: Pinpoints and allows control of aggregate location within the cell, exceeding traditional techniques
• Quantitative analysis: Measures aggregate load through image analysis
• Methodology:
• Metastable HaloTag variant labeling with a solvatochromic small-molecule reporter ligand
• High-resolution confocal microscopy coupled with FLIM for aggregate identification and localization
• Image analysis for aggregate quantification and distribution within the ER
• Pulse-chase experiments to track aggregates
Keywords: HT-aggrER , ER, FLIM, 3D-FLIM, Disaggregation
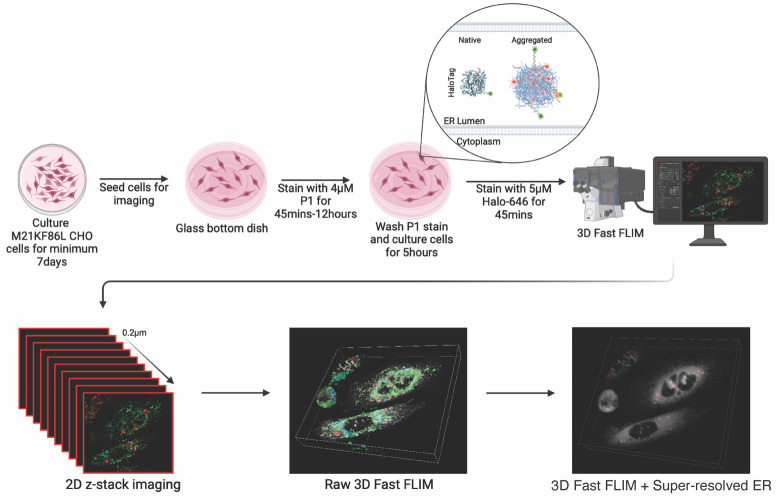
Graphical overview

Background
Protein misfolding and aggregation are hallmarks of numerous neurodegenerative diseases, including Alzheimer’s, Parkinson’s, and amyotrophic lateral sclerosis (ALS) [1]. Unraveling how the protein folding and quality control system handles aggregation-prone substrates is key to understanding why protein folding mechanisms fail, leading to age-associated aggregate accumulation in disease [2].
Proteostasis, the intricate network governing protein homeostasis within cells, relies on the coordinated efforts of various organelles and molecular machinery. Each cellular compartment contributes uniquely to the folding, trafficking, and degradation of proteins, with specific proteins and mechanisms orchestrating these processes. The endoplasmic reticulum (ER) stands as a primary site for protein folding and quality control. Within its lumen, chaperone proteins such as BiP/GRP78 and calnexin/calreticulin assist in guiding nascent polypeptides into their native conformations [3]. The ER also houses the unfolded protein response (UPR), a signaling pathway activated in response to ER stress, which coordinates adaptive measures to restore proteostasis. In the cytosol, molecular chaperones such as Hsp70 and Hsp90 safeguard protein folding, preventing misfolding and aggregation [4]. The ubiquitin-proteasome system (UPS) plays a vital role in protein degradation, tagging misfolded or damaged proteins with ubiquitin for proteasomal degradation. Mitochondria harbor molecular chaperones like Hsp60 and Hsp70, which facilitate the folding of mitochondrial proteins [5].
Understanding the specific proteins and mechanisms operating within each cellular compartment is essential for deciphering the molecular underpinnings of proteostasis and its dysregulation in disease. By elucidating these intricate pathways, researchers can identify novel therapeutic targets and develop interventions aimed at restoring protein homeostasis in various pathological conditions. Thus, the ability to probe the performance of the proteostasis machinery through detecting aggregation with organelle-level resolution is essential.
Existing tools for studying protein aggregation offer valuable insights, but they come with limitations. While immunoblots can detect total protein levels, they lack spatial information, preventing precise localization of aggregates within the cell beyond crude fractions. Electron microscopy provides high resolution but requires harsh fixation procedures, hindering live-cell studies and potentially altering the delicate ultrastructure of subcellular organelles. Fluorescent microscopy offers the advantage of live-cell imaging but often struggles to distinguish between misfolded aggregates and native protein structures, particularly within crowded confines of organelles such as the ER.
Our protocol addresses these limitations by introducing a subcellular resolution system combining confocal super-resolution microscopy with fast fluorescence lifetime imaging microscopy (FLIM) [6] by taking advantage of a metastable probe labeled with a solvatochromic fluorophore [7] that changes its lifetime depending on aggregation state [8]. Solvatochromic dyes change fluorescent properties based on their microenvironment, namely by polarity. P1 solvatochromic fluorophore is a modified BODIPY with a chloro-alkane chain ligand designed to covalently bind to Halotag, a modified bacterial haloalkane dehalogenase. HT-aggrER is Halotag further modified by the addition of signal peptide and KDEL motif for ER localization and point mutations that make the otherwise metastable protein more aggregate-prone [7]. When P1 binds to and labels HT-aggrER in living cells, its fluorescence lifetime is influenced by protein aggregation status, with a longer lifetime observed in aggregated proteins, which can be promoted by heat shock [8]. Monomeric protein can also be visualized by P1 labeling, but with a shorter lifetime, allowing for optical separation of protein species and thus real-time monitoring of protein aggregation status. HT-aggrER can also be labeled by fluorescent ligands such as TMR and Janelia Fluor 646, which label non-aggregated HT-aggr more brightly than P1 but are quenched and not fluorescent inside hydrophobic aggregates. This provides another degree of flexibility in the labeling of aggregated and soluble protein species. Resolving protein aggregates with this level of detail in live cells is affordable through the critical improvement in speed of time-correlated single-photon counting (TCSPC) fast FLIM on the Leica SP8 FALCON [9,10], which detects photons at ~80 mega counts per second and plots average arrival time for each pixel in near-real time without exponential fitting [11]. LIGHTNING deconvolution applies the Richardson-Lucy algorithm and the underlying principles of point spread function to remove background and out-of-focus signal from a 3D confocal image voxel by voxel, based on an adaptative decision mask. Implementing fast FLIM alongside LIGHTNING deconvolution of correlated confocal images allows for the localization of the FLIM data to sub-diffraction limit resolution counter images. This combination unlocks new avenues for studying protein aggregation state with subcellular resolution, offering several key advantages over existing methods. Beyond providing unparalleled insights into ER protein aggregation, our protocol is applicable for exploring other areas of cellular proteostasis, using the aggregation probe variants targeted to other cellular compartments. Additionally, this system could be used for live-cell drug screening, allowing researchers to rapidly assess the effectiveness of potential therapeutics in preventing or disassembling protein aggregates. The versatile protocol described here thus fills a gap in existing methodologies by offering high-resolution and quantitative insights into the complex protein aggregation process. Its implementation can help to gain a deeper understanding of protein misfolding-related diseases and the development of therapeutic strategies against them.
Materials and reagents
Biological materials
Chinese hamster ovary cells (CHO-K1, ATCC CCL-61) with stable expression of HT-aggrER (HaloTag with M21K F86L mutations)
Reagents
Nutrient mixture F12 Ham [Sodium bicarbonate (+), L-Glutamine (-)] (Sigma Merck, catalog number: N4888-500ML)
Fetal bovine serum (FBS) (Sigma, catalog number: F9665-500ML)
Penicillin-streptomycin (Pen/strep) (Thermo Scientific, catalog number: 15140122)
L-Glutamine (Thermo Scientific, catalog number: 25030024)
P1 solvatochromic fluorophore (prepared in-house—protocol described in General Notes and Supplementary File 1)
1× Dulbecco’s phosphate-buffered saline (DPBS) (Thermo Fisher Scientific, catalog number: 14190169)
0.05% Trypsin-EDTA (1×) (Thermo Fisher, catalog number: 25200056)
Janelia Fluor 646 HaloTag ligand (Promega, catalog number: GA1120) (see General Notes for further discussion of the use of commercially available HaloTag ligands to label HT-aggr)
Solutions
Complete nutrient mixture F12 Ham (see Recipes)
P1 staining solution (see Recipes)
Janelia Fluor 646 HaloTag staining solution (see Recipes)
Recipes
-
Complete nutrient mixture F12 Ham
Reagent Stock concentration Final concentration Amount Nutrient mixture F12 Ham 100× 90% 500 mL FBS 100× 10% 50 mL Pen/strep 10,000 U/mL 1% 5.5 mL L-Glutamine 200 mM 1% 5.5 mL -
P1 staining solution
Reagent Final concentration Amount Complete nutrient mixture F12 Ham NA 500 μL P1 (2 mM) 4 μM 1 μL -
Janelia Fluor 646 HaloTag staining solution
Reagent Final concentration Amount Complete nutrient mixture F12 Ham NA 500 μL Janelia Fluor 646 HaloTag (200 mM) 200 μM 0.5 μL
Laboratory supplies
Coverslip bottomed dishes, IBIDI (IBL Labor GmbH, catalog number: D35C4-20-1-N)
10 cm dish (Falcon, catalog number: 353003)
Centrifuge tube, 15 mL (Appleton Woods Ltd, catalog number: AB031)
Equipment
Leica Stellaris 8 FALCON FLIM Microscope (Leica, Wetzlar, Germany, model: STELLARIS8)
Benchtop centrifuge (Eppendorf, model: 5810 R, product code: 12813252)
Software and datasets
Leica LAS X (v5.2.2, 01.02.2024)
Icy (v2.5.2.0, 08.02.2024)
Procedure
-
Preparation of CHO HT-aggrER cells for 3D-FLIM imaging
Grow cells in complete nutrient mixture F12 media (see Recipe 1) in a cell culture incubator at 37 °C and 5% CO2 until cells reach 70%–80% confluency in a 10 cm dish.
Aspirate complete nutrient mixture F12 from cells, wash once with 1× DPBS, add 1 mL of Trypsin-EDTA, and return cells to incubator for ~3 min.
Once detached, add 3 mL of complete nutrient mixture F12 media to cells and pipette up and down 10 times to make a single-cell suspension.
Count cells using a hemacytometer or automated cell counter.
Transfer cells to a 15 mL falcon tube and centrifuge at 200× g for 5 min.
Aspirate supernatant and resuspend cells with complete media at 1×10⁶ cells/mL.
Seed cells at 3,000 cells/cm2 in a coverslip glass-bottomed cell culture vessel.
Return to incubator and grow to ~70% confluency.
-
Pulse labeling of HT-aggrER with P1 solvatochromic fluorophore
Dilute P1 stock to 4 μM final concentration in prewarmed complete nutrient mixture F12 media (see Recipe 2).
Take cells grown from Section A and replace media with P1 staining solution.
Return cells to the incubator for 45 min.
Remove P1 staining solution and wash with prewarmed complete media.
Replace with prewarmed complete nutrient mixture F12 media.
Now that HT-aggER has been pulse-labeled, the cells can be subjected to a treatment of choice prior to imaging to observe the effect of the treatment on protein aggregates over time. For example, we have observed that mild ER stress induced by tunicamycin or thapsigargin results in a decrease in long-lifetime aggregates [8].
-
Counter-labeling with 646 HaloTag ligand to visualize ER
Directly before imaging, newly synthesized HT-aggrER can be pulse-labeled with Janelia Fluor 646 HaloTag ligand (see Recipe 3) (this only labels non-aggregated HT and thus serves as a counterstain for the endoplasmic reticulum).
Stain cells with Janelia Fluor 646 HaloTag staining solution for 45 min prior to imaging.
Remove Janelia Fluor 646 HaloTag staining solution and wash twice with prewarmed 1× DPBS.
Add 500 μL of fresh complete nutrient mixture F12 media to the well and subject to imaging. We have not observed any difference in fluorescence lifetime of our probe in media with or without phenol red or serum.
-
FLIM live cell imaging of P1-label
Warm the microscope stage to 37 °C and set CO2 level to 5%.
Place the cell sample on the microscope stage.
Locate and focus on cells through eyepieces using brightfield illumination to minimize bleaching of P1 fluorophore.
-
Set microscope parameters in LAS X software as follows:
FLIM mode
Laser 1: Excitation/emission 440/450–500 nm, pulsed laser (see notes; for P1 imaging, faster laser repetition rate may result in apparent shortening of fluorescence lifetime)
Laser 2: Excitation/emission 646/655–750 nm (for 646 HaloTag ligand imaging, follow steps C1–4)
HyDx detector in counting mode
Frame size 512 × 512 pixels
Scan speed 400 Hz
Count frame average of 15–20
Set Z-stack for the cell (begin and end)
Start image acquisition (Start Experiment button).
-
Confocal live imaging in the LIGHTNING mode of 646 HaloTag ligand
Immediately after FLIM imaging of cells, deselect FLIM mode and select LIGHTNING mode of LAS X software.
Do not change the Z-stack or frame-size settings acquired in FLIM mode.
Start image acquisition (Start experiment button).
-
Image rendering
-
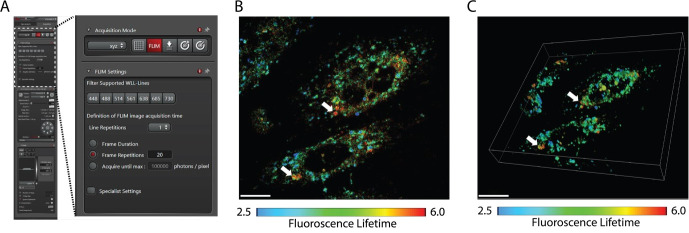
Raw FLIM image rendering (Figure 1) produces a map of mean arrival time for each pixel of the acquired Fast FLIM image. The values are color-coded to distinguish protein aggregates with longer lifetime.
Select FLIM mode.
Set the lifetime range (2.5–6 ns). In this range, pixels with a lifetime of >4.5 ns will appear in yellow/red, allowing aggregates to be distinguished as red puncta from green-folded probe species. We also observe concentrated areas of shorter lifetime (blue) signal. Further work is required to understand the biological relevance of these regions. Since their lifetime does not correspond to that of aggregated HT-aggr such as that induced by heat shock [8], we do not consider these as aggregates when we perform image analysis.
Export image in TIFF or PNG format (ensure “Save Palette Image as RGB” is selected to maintain the defined FLIM lookup table in the saved image).
Export in the format of 3D-movie.
-
Aggregate size analysis of FLIM data in Icy Software (Figure 2)
Open the exported TIFF or PNG FLIM image files in Icy Software (v2.5.2) [12].
Select Build RGB Image.
Deselect Ch1 and Ch2 (green and blue) channels to leave only red pixels, reflecting regions of fluorescence lifetime >4.5 ns.
Open the Aggregates Detector protocol.
Adjust the Threshold and Min volume settings to identify aggregates of the desired intensity and size. We typically use threshold = 125 and min volume = 5 to avoid quantification of diffuse signal.
Run Aggregates Detector and then navigate to the ROI tab on the right-hand side of the viewer. There will be a list of ROIs corresponding to aggregates with corresponding shape descriptors such as area. This table can be exported to Excel for subsequent analysis of shape descriptor metrics (Figure 2D).
-
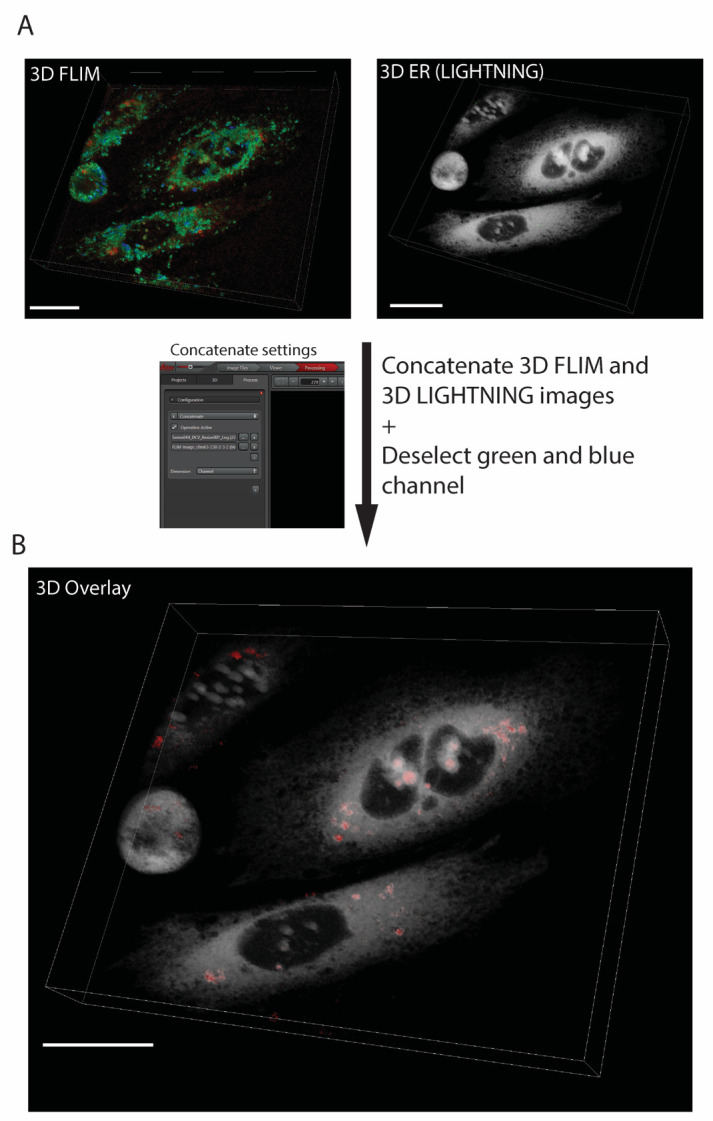
3D FLIM image rendering (Figure 3). This produces a 3D image of the FLIM map overlayed with the high-resolution ER counter image. This should be used for visual purposes only and not for quantitative analysis of aggregates.
Select 3D tool on LASX software.
Open 3D FLIM and corresponding LIGHTNING confocal images.
Under the Processing tab, select the concatenate function.
Select both 3D FLIM and LIGHTNING images to concatenate by channel.
Apply concatenation.
Deselect blue and green channels.
Set minimum intensity threshold to 40.
Using movie editor, export image in movie mode (Video 1).
-
Figure 1. Illustration of Raw 3D FLIM image.
A. Settings for acquiring FLIM image using Leica Stellaris 8 confocal. B. Micrograph of 2D plane of CHO M21K F86L cells acquired using settings as in A. C. Micrograph of 3D FLIM image of cell as in B. White arrows point toward aggregates. Images are at 63× magnification and were acquired using Leica Stellaris 8 FALCON. Scale bar: 20 µm. Lifetime range: 2.5–6.0.
Figure 2. Schematic representation of calculating frequency distribution of aggregates’ sizes extracted from FLIM using Icy software.

A. 2D FLIM image is imported into Icy and converted to RGB image. B. Green and blue channels are deselected to leave only red pixels corresponding to longer lifetime areas. C. Aggregates Detector plugin is utilized to identify and extract shape descriptors from long-lifetime aggregates. D. Representative graph of aggregate size in correspondence to its relative frequency.
Figure 3. Processed high-resolution 3D FLIM image.

A. Micrographs of FLIM and ER acquired using FLIM mode and LIGHTNING confocal mode, respectively. B. 3D overlay of micrograph of FLIM (red/green) and ER (grey) image. Red spots represent aggregated probes. Images are at 63× magnification and were acquired using Leica Stellaris 8 FALCON. Scale bar: 20 μm. Lifetime range: 2.5–6.0 ns.
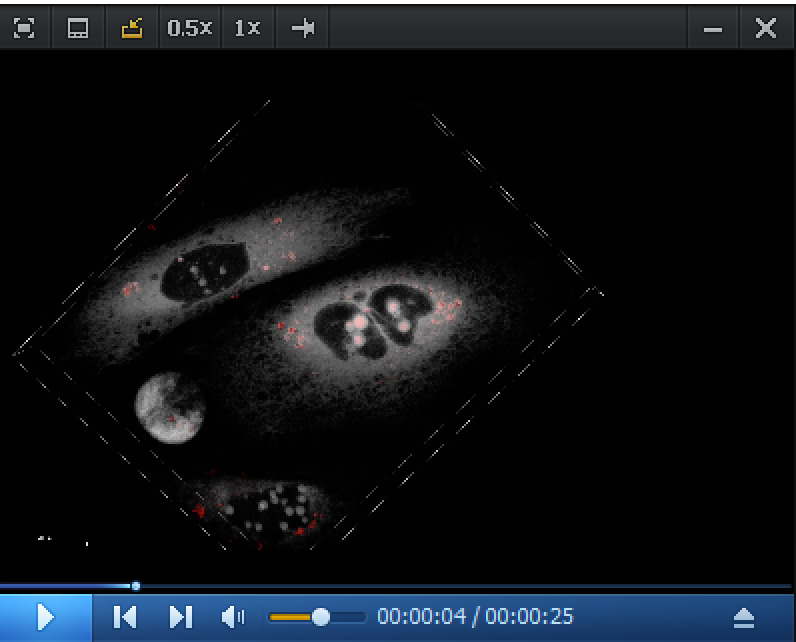
Video 1. 3D fast-FLIM image of P1-labeled HT-aggrER aggregates acquired by FLIM (red), overlayed with HaloTag ligand 646-labeled newly synthesized HT-aggrER acquired by confocal (grey).

Red spots represent longer lifetime aggregates.
Validation of protocol
This protocol has been used and validated in the following research article [8]:
Melo et al. (2022). Stress-induced protein disaggregation in the endoplasmic reticulum catalysed by BiP. Nat Commun (Figure 2, panel e).
General notes and troubleshooting
Here, the protocol has been demonstrated on the CHO-K1 cell line harboring stable integration of the HT-aggrER construct with M21K F86L mutations. This cell line and other mutant cell lines used in Melo et al. [8] are available upon request.
Alternatively, the plasmids used in Melo et al. [8] and this protocol are available via Addgene. We recommend using stable cell lines harboring the plasmids, as the formation of protein aggregates occurs several days after expression and thus cannot be visualized transiently.
P1 solvatochromic HaloTag ligand was synthesized by Dr. Ana Costa at the University of Algarve, Portugal, and is available upon request to Dr. Edward Avezov. A full methodology for P1 synthesis can be found in Supplementary File 1.
Other HaloTag ligands can be used to label HT-aggrER but behave differently from P1 in terms of binding propensity and fluorogenicity to aggregates. For example, Janelia Fluor HaloTag TMR and 646 do not label the aggregates we observe with long fluorescence lifetime as measured by P1 labeling. However, diffuse HT-aggr and other short-lifetime puncta are labeled by these ligands.
Overnight P1 labeling can also be performed.
Before staining cells with HaloTag ligand 646, wash away P1 stain and allow cells to grow in fresh nutrient mixture F12 medium for a minimum of 4 h. This is to allow sufficient time for new HT-aggrER to be synthesized after washing excess P1 label away, which will be available to covalently bind to HaloTag ligand 646 and thus act as a counterstain for the ER.
Fluorescence lifetime is dependent on the frequency of the laser used. For the original research article in which the protocol was validated, Zeiss LSM710 with 20 MHz laser was used for 2D FLIM. For this Bio-protocol, Leica Stellaris 8 FALCON FLIM microscope with 80 MHz laser was used to acquire 3D FLIM images. The differing laser frequencies have an impact on the observed fluorescence lifetime of the P1-labeled probe.
3D FLIM is enabled by improved imaging speeds of Fast-FLIM, made possible by reduced detector dead time, which allows for ~80 mega counts per second photon detection speeds. Other microscope systems capable of TCSPC FLIM with comparable detection speed, such as Becker & Hickl FASTAC FLIM or picoQuant MultiHarp 150, should thus be able to reproduce our approach when combined with a sub-diffraction limit resolution confocal system such as Airyscan or stimulated emission depletion (STED).
Acknowledgments
E.A. in this work is supported by the UK Dementia Research Institute through UK DRI Ltd, principally funded by the Medical Research Council, The Evelyn Trust and Alzheimer’s Society. K.G. is supported by Cambridge Indian Ramanujan Scholarship. E.P.M. received Portuguese national funds from FCT - Foundation for Science and Technology through projects UIDB/04326/2020 (DOI:10.54499/UIDB/04326/2020), UIDP/04326/2020 (DOI:10.54499/UIDP/04326/2020) and LA/P/0101/2020 (DOI:10.54499/LA/P/0101/2020). This protocol is adapted from Melo et. al [8].
Competing interests
The authors declare no competing interests.
Supplementary information
The following supporting information can be downloaded here:
Supplementary File 1
References
- 1. Scheres S. H. W., Ryskeldi-Falcon B. and Goedert M.(2023). Molecular pathology of neurodegenerative diseases by cryo-EM of amyloids. Nature. 621(7980): 701 710 710. 10.1038/s41586-023-06437-2 [DOI] [PubMed] [Google Scholar]
- 2. Hipp M. S., Kasturi P. and Hartl F. U.(2019). The proteostasis network and its decline in ageing. Nat Rev Mol Cell Biol. 20(7): 421 435 435. 10.1038/s41580-019-0101-y [DOI] [PubMed] [Google Scholar]
- 3. Wang M. and Kaufman R. J.(2016). Protein misfolding in the endoplasmic reticulum as a conduit to human disease. Nature. 529(7586): 326 335 335. 10.1038/nature17041 [DOI] [PubMed] [Google Scholar]
- 4. Rutledge B. S., Choy W. Y. and Duennwald M. L.(2022). Folding or holding?—Hsp70 and Hsp90 chaperoning of misfolded proteins in neurodegenerative disease. J Biol Chem. 298(5): 101905 . 10.1016/j.jbc.2022.101905 [DOI] [PMC free article] [PubMed] [Google Scholar]
- 5. Jebara F., Weiss C. and Azem A.(2017). Hsp60andHsp70Chaperones: Guardians of Mitochondrial Proteostasis. In Wiley, Encyclopedia of Life Sciences(1st ed., pp. 1–9). https://doi.org/ 10.1002/9780470015902.a0027152 [DOI] [Google Scholar]
- 6. Holcman D., Parutto P., Chambers J. E., Fantham M., Young L. J., Marciniak S. J., Kaminski C. F., Ron D. and Avezov E.(2018). Single particle trajectories reveal active endoplasmic reticulum luminal flow. Nat Cell Biol. 20(10): 1118 1125 1125. 10.1038/s41556-018-0192-2 [DOI] [PMC free article] [PubMed] [Google Scholar]
- 7. Liu Y., Fares M., Dunham N. P., Gao Z., Miao K., Jiang X., Bollinger S. S., Boal A. K. and Zhang X.(2017). AgHalo: A Facile Fluorogenic Sensor to Detect Drug‐Induced Proteome Stress. Angew Chem Int Ed. 56(30): 8672 8676 8676. 10.1002/anie.201702417 [DOI] [PubMed] [Google Scholar]
- 8. Melo E. P., Konno T., Farace I., Awadelkareem M. A., Skov L. R., Teodoro F., Sancho T. P., Paton A. W., Paton J. C., Fares M., et al.(2022). Stress-induced protein disaggregation in the endoplasmic reticulum catalysed by BiP. Nat Commun. 13(1): 2501 . 10.1038/s41467-022-30238-2 [DOI] [PMC free article] [PubMed] [Google Scholar]
- 9. Konno T., Parutto P., Crapart C. C., Davì V., Bailey D. M. D., Awadelkareem M. A., Hockings C., Brown A. I., Xiang K. M., Agrawal A., et al.(2024). Endoplasmic reticulum morphology regulation by RTN4 modulates neuronal regeneration by curbing luminal transport. Cell Rep. 43(7): 114357 . 10.1016/j.celrep.2024.114357 [DOI] [PubMed] [Google Scholar]
- 10. Crapart C. C., Scott Z. C., Konno T., Sharma A., Parutto P., Bailey D. M. D., Westrate L. M., Avezov E. and Koslover E. F.(2024). Luminal transport through intact endoplasmic reticulum limits the magnitude of localized Ca2+ signals. Proc Natl Acad Sci U S A. 121(13): e2312172121. https://doi.org/ 10.1073/pnas.2312172121 [DOI] [PMC free article] [PubMed] [Google Scholar]
- 11. Alvarez L. A., Widzgowski B., Ossato G., van den Broek B., Jalink K., Kuschel L., Roberti M. J., Hecht F.(2019). Application note: SP8 FALCON: A novel concept in fluorescence lifetime imaging enabling video-rate confocal FLIM. Nat Methods. Available at: https://www.nature.com/articles/d42473-019-00261-x [Google Scholar]
- 12. de Chaumont F., Dallongeville S., Chenouard N., Hervé N., Pop S., Provoost T., Meas-Yedid V., Pankajakshan P., Lecomte T., Le Montagner Y., et al.(2012). Icy: an open bioimage informatics platform for extended reproducible research. Nat Methods. 9(7): 690 696 696. 10.1038/nmeth.2075 [DOI] [PubMed] [Google Scholar]


