

Abstract
Embryonic tendon cells have been studied in vitro to better understand mechanisms of tendon development. Outcomes of in vitro cell culture studies are easily affected by phenotype instability of embryonic tendon cells during expansion in vitro to achieve desired cell numbers, yet this has not been characterized. In the present study, we characterized phenotype stability, expansion potential, and onset of senescence in chick embryo tendon cells from low to high cell doublings. We focused on cells of Hamburger-Hamilton stages (HH) 40 and HH42, where HH40 is the earliest stage associated with substantial increases in extracellular matrix and mechanical properties during embryonic tendon development. HH40 and HH42 cells both downregulated expression levels of tendon phenotype markers, scleraxis and tenomodulin, and exhibited onset of senescence, based on p16 and p21 expression levels, cell surface area, and percentage of β-galactosidase positive cells, before significant decreases in proliferation rates were detected. These findings showed that embryonic tendon cells destabilize phenotype and become senescent earlier than they begin to decline in proliferation rates in vitro. Additionally, embryonic stage of isolation appears to have no effect on proliferation rates, whereas later stage HH42 cells downregulate phenotype and become susceptible to senescence sooner than earlier stage HH40 cells. Based on our data, we recommend chick embryo tendon cells be used before a maximum cumulative doubling level of 12 (passage 4 in this study) to avoid phenotype destabilization and onset of senescence.
Keywords: embryonic tendon, phenotype, proliferation, senescence, tenocyte
1 |. INTRODUCTION
Tendon is a highly collagenous connective tissue that transmits muscle-generated forces to bone to enable movement. Tendons possess poor intrinsic healing capacity to regenerate after injury, and instead form fibrotic scar tissue associated with inferior mechanical properties, compromised function, and often pain, leading to nearly 70 million physician visits each year in the United States1 and high rates of work disability.2 Tendons are also associated with musculoskeletal birth deformities, such as congenital talipes equinovarus (also known as clubfoot),3 which not only compromise musculoskeletal function but also lead to osteoarthritis and other orthopedic ailments in adult years. Taken together, we are interested in understanding how embryonic tendons form during development and using this knowledge to motivate novel approaches to treat adult tendon injuries as well as congenital birth deformities.
Embryonic tendon cells have been studied in vitro to better understand their roles in tendon development.4–13 In vitro studies can complement in vivo studies by providing a controlled environment within which to characterize the effects of specific cues without the myriad of confounding factors present in vivo. It is common practice to expand embryonic tendon cells in vitro until sufficient cell numbers are achieved to perform experiments. The extent of proliferation in each study is typically referred to as “passage number,” which is the number of times cells have been detached at sub-confluency and re-seeded at a lower density on tissue culture plastic, to facilitate continued cell proliferation. Notably, the number of times that cells double between passages can vary significantly within studies as well as between studies because of the subjective nature in deciding when cells are ready to be passaged. Thus, in characterizing cell proliferation rates, both passage number and cell doubling number are informative metrics to consider.
The passage number at which embryonic tendon cells are used for experiments has varied significantly across studies. For example, one study encapsulated passage 2 chick embryonic tendon cells within functionalized alginate hydrogels to characterize the effects of scaffold stiffness on embryonic tendon cell morphology and gene expression profile.5 Another study encapsulated chick embryonic tendon cells within gels immediately after harvest, without expansion in vitro, to study the effects of actin cytoskeleton on engineered tendon mechanical properties.11 Embryonic chick tendon cells have also been expanded to passage 7 before culture within fibrin gels to examine mechanisms of tendon crimp formation.7 To examine the effects of scleraxis knockdown on cell functions in vitro, equine fetal tendon cells have been isolated and expanded to passage 14 before treatment.12 The wide variability across studies in embryonic tendon cell doublings in vitro before experimentation is of interest because postnatal tendon cells are known to stop proliferating and lose their phenotype at higher passages in vitro,14–17 whereas this has not been characterized for embryonic tendon cells.
Several studies have shown that at higher doublings in vitro, human, mouse, and rabbit postnatal tendon cells cease proliferating, reduce deposition of tendon extracellular matrix (ECM) components, and upregulate senescence markers including β-galactosidase (β-gal) and cell cycle inhibitors.14–16 While the effects of passage, or cell doublings, have not been characterized for embryonic or fetal tendon cells, it has been shown that fetal bovine anterior cruciate ligament cells and rat dermal fibroblasts cultured in vitro exhibit different behaviors (e.g., proliferative capacity, ECM deposition) compared to postnatal cells that are isolated from the tissues of the same anatomical origins.18,19 The finite number of times that cultured cells can double in vitro is attributed to the onset of replicative senescence, a phenomenon termed the Hayflick limit.20 Whether embryonic tendon cells experience this phenomenon has not been characterized. Characterization of embryonic tendon cell behavior in vitro is critical to guide the extent to which embryonic tendon cell populations can be expanded while maintaining a stable tendon phenotype.
In this study, we characterized the behaviors of embryonic tendon cells in vitro based on proliferative capacity, phenotype stability, and onset of senescence from low to high cell doublings. We used the chick embryo because this model is widely used to study embryonic tendon development.5,7,11,21–29 We hypothesized that embryonic tendon cells reduce proliferation rate and tendon phenotype marker levels and become senescent at higher doublings. We also hypothesized that later stage embryonic tendon cells destabilize phenotype and become senescent sooner than earlier stage embryonic tendon cells. Working toward a long-term goal of regenerating adult tendons based on embryonic tissue formation, we focused on Hamburger–Hamilton30 (HH) 40 and HH42 chick embryonic tendon cells because ECM deposition, organization, and collagen crosslinking are actively occurring at these stages of development.11,21,23,24,26 Our results reveal embryonic tendon cells significantly downregulate tendon phenotype marker expression levels and begin to exhibit signs of senescence despite continuing to proliferate for an extended period of time, and that these outcomes are embryonic stage-specific. We recommend embryonic tendon cells to be expanded to a maximum cumulative doubling level (CPD) of 12 (passage 4 in this study), to avoid loss of tendon phenotype and onset of senescence. These findings provide important guidance to future studies that use embryonic tendon cells in vitro.
2 |. MATERIALS AND METHODS
2.1 |. Experimental overview
Embryonic tendon cells were isolated from the calcaneal tendons of chick embryos at HH40 and HH42 (incubation Days 14 and 16, respectively). The cells were seeded on tissue culture plastic at 20,000 cells/cm2 and cultured until ~90% confluency, at which point the cells were trypsinized from the plastic and divided into two groups. One group was re-seeded on tissue culture plastic to continue culturing through subsequent passages until a plateau in proliferation rates was detected, and the other group was harvested to evaluate cell number, morphology, tendon phenotype based on expression of the tendon markers scleraxis and tenomodulin, and onset of senescence based on cell surface area and expression of β-gal and cell cycle inhibitors p16 and p21.
2.2 |. Embryonic tendon cell isolation and culture
Fertilized white leghorn chick embryos (University of Connecticut Poultry Farm) were cultured in a humidified rocking incubator at 37.5°C, sacrificed, and staged at HH40 and HH42. Calcaneal tendons were dissected from both limbs of six chick embryos and pooled together for one biological replicate (N). Tendons were cut into small pieces using micro-scissors and digested in 1% collagenase type II solution (1 mg/ml) while shaking at 200 rotations per minute (RPM) at 37°C for 25 min. The tissue suspension was neutralized by complete medium consisting of Dulbecco’s modified Eagle’s medium (Life Technologies), 10% fetal bovine serum (Atlanta Biologicals), and 1% antimycotic-antibiotic (Gibco). The digested suspension was filtered through a 40-μm cell strainer to obtain cells. Cells were seeded at 20,000 cells/cm2 and trypsinized at ~90% confluency for re-seeding and harvest.
2.3 |. Proliferation rate analysis
CPD and population doubling time (PDT) were quantified to evaluate proliferation rates. Three biological replicates (N = 3) of HH40 and HH42 tendon cells each, were counted at each passage using a hemocytometer. CPD, which represents the cumulative number of times cells have doubled, was calculated as:
where CPD0 is the CPD of the previous passage, and N0 and N1 are the cell numbers at the beginning and the end of the current passage being analyzed, respectively.14,15,20 PDT, which represents the number of hours cells take to double in number, was calculated as:
2.4 |. Senescence-associated β-gal staining and analysis
At each passage, a portion of the cells were harvested and re-plated at 10,000 cells/cm2 in six-well plates for staining. Cells were cultured for 24 h so that cells had adequate time to adhere but not enough time to proliferate and physically touch adjacent cells. Cells were stained using a β-gal staining kit (Cell Signaling) according to manufacturer instructions. Three biological replicates (N = 3) of HH40 and HH42 tendon cells were each stained for β-gal at each passage. For each biological replicate (N), the numbers of β-gal-positive and total cells were counted in three different wells (n = 3 technical replicates) using ImageJ by three different reviewers in a blinded manner.
2.5 |. Cell surface area measurements
Surface area of all β-gal-positive and -negative cells (50–150 cells per biological replicate) were measured for three biological replicates (N = 3) of HH40 and HH42 tendon cell cultures each, using the cell tracing function in ImageJ by three different reviewers in a blinded manner.
2.6 |. Reverse-transcription polymerase chain reaction (RT-PCR)
Calcaneal tendons were freshly harvested from three biological replicates (N = 3) of HH40 and HH42 embryos and homogenized in TRIzol LS (Life Technologies). For in vitro cultures, a portion of the cells were harvested for RNA isolation from three biological replicates (N = 3) of HH40 and HH42 tendon cell cultures at each passage. Cells were homogenized in TRIzol (Life Technologies). Total RNA was isolated from tissue and cell lysates according to the manufacturer instructions and reverse-transcribed using the Superscript III First Strand Synthesis kit (Invitrogen). PCR was performed using Platinum™ Taq DNA Polymerase High Fidelity (Invitrogen) on Mastercycler® (Eppendorf). Chick-specific primers were used to characterize gene expression levels of tendon markers (scleraxis and tenomodulin), senescence markers (p16 and p21), and housekeeping gene (18S) (Table 1). Gene expression levels of scleraxis, tenomodulin, p16, and p21 for each biological replicate were normalized to the corresponding levels of 18S of the same sample.
TABLE 1.
Forward and reverse primer sequences
| Gene | Accession No. | Forward sequence | Reverse sequence |
|---|---|---|---|
| 18S 5 | AF173612.1 | CGGGGCCATGATTAAGAGGG | CTTTAGTTCGTCTTGCGCCG |
| Scleraxis 5 | NM_204253.1 | CGCGACAGGAAGACGGCGAT | CTGGCAGCGGGGTGAAGACG |
| Tenomodulin 5 | NM_206985.2 | CATGGTCTGGGTGCCTGGCG | TCCGGAGCTGCTATCGGGGT |
| p16 | NM_204434.1 | GCGGGATGAACTAGCCAACG | GTCCGACCGAAGGAGTTGAC |
| p21 | NM_204396 | ACTTCAACTTCGAGACCGAGAC | GGGCTCTTCCTATACATTGCAC |
2.7 |. Statistical analyses
Proliferation rates, percentage of β-gal positive cells, gene expression levels, and average cell surface areas were analyzed for statistically significant differences between passages and embryonic stages HH40 and HH42 using two-way analysis of variance (ANOVA) followed by Sidak’s multiple comparisons test. All statistical analyses were performed in Prism 8 (GraphPad Software).
3 |. RESULTS
3.1 |. Proliferation rates
Proliferation rates of HH40 and HH42 tendon cells were assessed by calculating CPD and PDT based on the cell number at the beginning and the end of each passage. HH40 and HH42 cells exhibited similar growth curves that appeared linear in the first 30 days of culture, or passage 10, after which they began to plateau (Figure 1A). Cells needed 2 days to reach 90% confluency for passage 1, and 10 days for passage 12 (Figure 1A). PDTs, the number of hours cells needed to double in number, were the same between HH40 and HH42 cells at different CPDs (Figure 1B). At early CPDs, PDTs were low and constant for both HH40 and HH42 cells. However, by CPD 31, PDT increased significantly for both HH40 and HH42 cells (Figure 1B). Passage number correlated linearly with CPD for both HH40 (R2 = 0.9659) and HH42 (R2 = 0.9249) cells throughout the experiment (Figure 1C).
FIGURE 1.
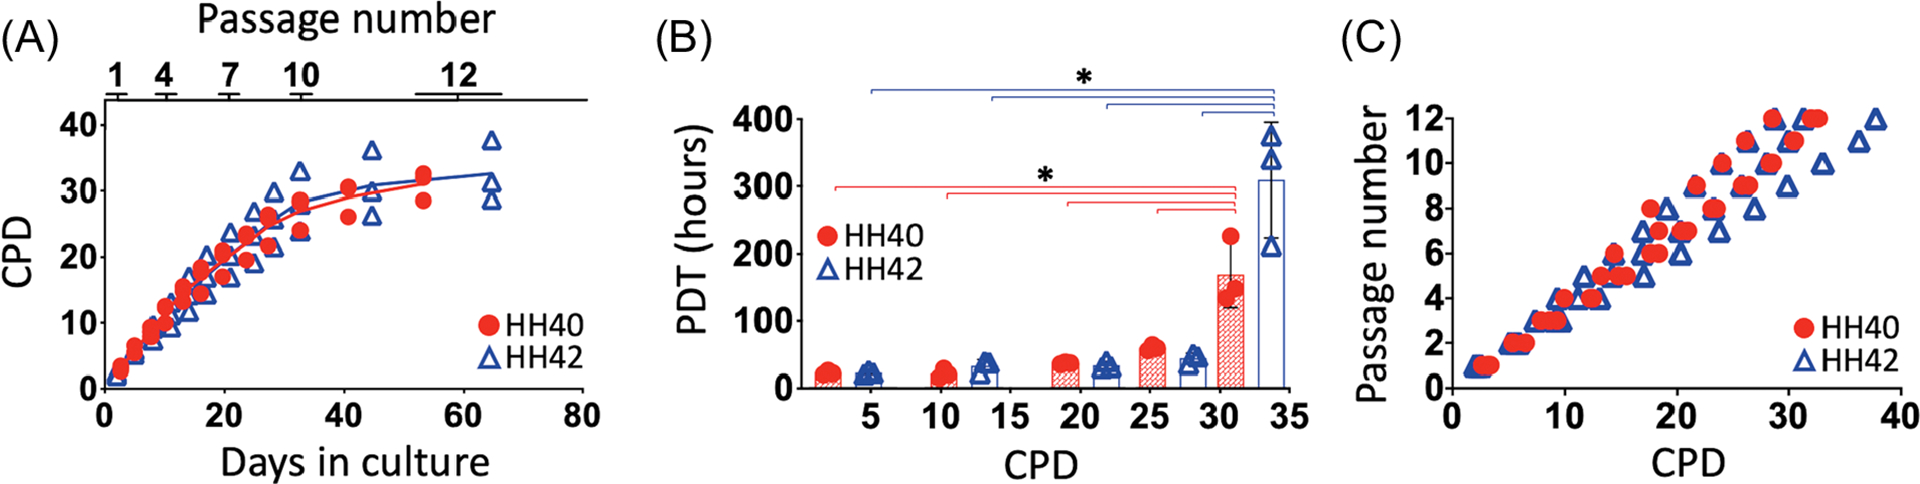
Proliferation rates were similar between HH40 and HH42 cells. (A) CPD of HH40 and HH42 cells increased over time in culture, and then began to plateau after 30 days (or passage 10). (B) PDTs were the same between HH40 and HH42 cells at different CPDs. PDTs were low and constant for both HH40 and HH42 cells from the beginning of the experiment until CPD 31, at which time PDT increased significantly for both HH40 and HH42 cells. (C) Passage number correlated linearly with CPD for both HH40 and HH42 cells for the duration of the study. N = 3 for each stage; two-way ANOVA; *p < 0.05 between different passages within same stage
3.2 |. Phenotype stability
Phenotype stabilities of HH40 and HH42 tendon cells were assessed by measuring scleraxis and tenomodulin gene expression levels from low to high passages. Scleraxis expression levels increased significantly in both HH40 and HH42 cells at passage 1 compared to freshly harvested tendons (p < 0.05) (Figure 2A). Scleraxis expression levels were the same between freshly harvested HH40 and HH42 tendons. Scleraxis expression levels decreased significantly in HH40 and HH42 cells by passages 10 and 7, respectively (p < 0.05) (Figure 2A). Comparison between cell types showed that scleraxis expression levels became significantly lower in HH42 than HH40 cells by passage 7 (p < 0.05) (Figure 2A). Tenomodulin expression levels were higher in freshly harvested HH42 tendon compared to HH40 tendon and remained 3- to 4-fold higher in HH42 than HH40 cells from passage 1 to passage 7 in vitro (p < 0.05) (Figure 2B). Tenomodulin expression levels were higher in both HH40 and HH42 cells at passage 1 compared to freshly harvested tendons. During culture in vitro, tenomodulin expression levels stayed the same in HH40 cells, whereas tenomodulin expression levels decreased significantly in HH42 cells by passage 10 (p < 0.05) (Figure 2B).
FIGURE 2.
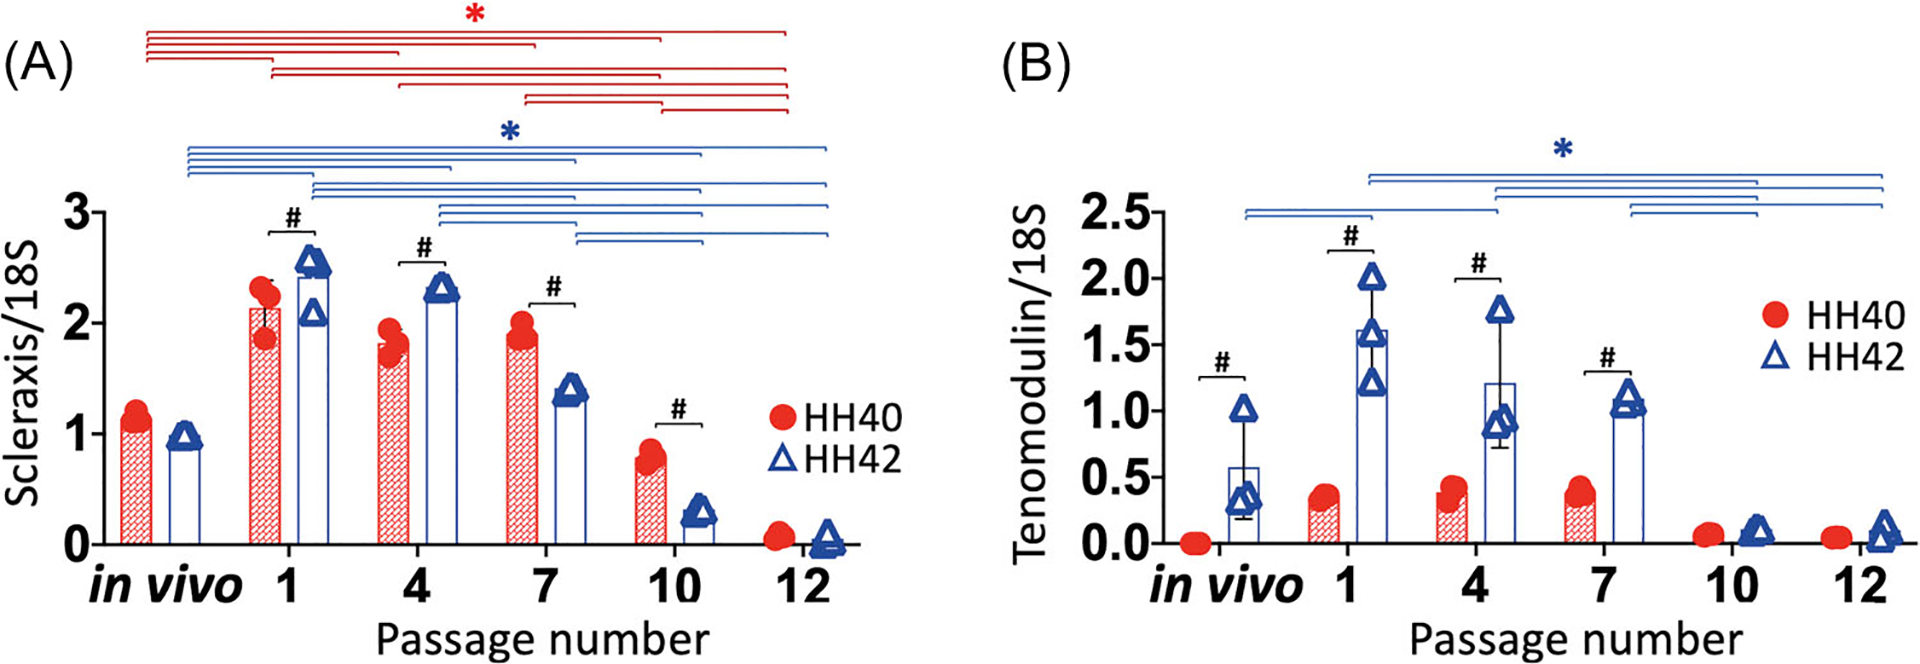
Gene expression levels of tendon markers scleraxis and tenomodulin declined at higher passage numbers in both HH40 and HH42 cells. (A) Scleraxis expression levels increased significantly in both HH40 and HH42 cells at passage 1 compared to freshly harvested tendons. During culture in vitro, scleraxis expression levels of HH40 and HH42 cells decreased significantly by passages 10 and 7, respectively. Scleraxis expression levels were the same between freshly harvested HH40 and HH42 tendons. Scleraxis expression levels became significantly lower in HH42 cells than HH40 cells by passage 7. (B) Tenomodulin expression levels were higher in freshly harvested HH42 tendon compared to HH40 tendon and remained 3- to 4-fold higher in HH42 than HH40 cells from passage 1 to passage 7 in vitro. Tenomodulin expression levels were higher in both HH40 and HH42 cells at passage 1 compared to freshly harvested tendons. During culture in vitro, tenomodulin expression levels in HH40 cells remained the same between passages, whereas tenomodulin expression levels in HH42 cells decreased significantly by passage 10. N = 3 for each stage; two-way ANOVA; *p < 0.05 between freshly harvested tendons and different passages within same stage; #p < 0.05 between HH40 and HH42 freshly harvested tendons or HH40 and HH42 cells at the same passage
3.3 |. Senescence marker expression
Onset of senescence was evaluated by quantifying the percentage of β-gal-positive cells and cell surface area (Figure 3). Cells exhibited predominately thin, elongated morphology during earlier passages (1 through 4) and enlarged surface areas during later passages (7 through 12) (Figure 3A). The percentage of β-gal positive cells were examined at each passage from 1 to 12 for both HH40 and HH42 cells (Figure 3B). The percentage of β-gal positive cells was less than 5% in both HH40 and HH42 cultures and remained the same between passages and embryonic stages from passages 1 to 6. Statistically significant increases were first detected at passage 10 in HH40 cell cultures and at passage 7 in HH42 cell cultures (Figure 3B). The percentage of β-gal positive cells became significantly higher in HH42 than HH40 cultures starting at passage 7 (Figure 3B). By passage 10, average surface area of β-gal positive cells in both HH40 and HH42 cultures was significantly larger (approximately 3 times) than at the earliest timepoint (p < 0.05) (Figure 3C), whereas average surface area of β-gal negative cells remained constant (Figure 3D). There was no significant difference in surface areas of β-gal positive cells and β-gal negative cells between HH40 and HH42 throughout their time in culture (Figure 3C,D).
FIGURE 3.
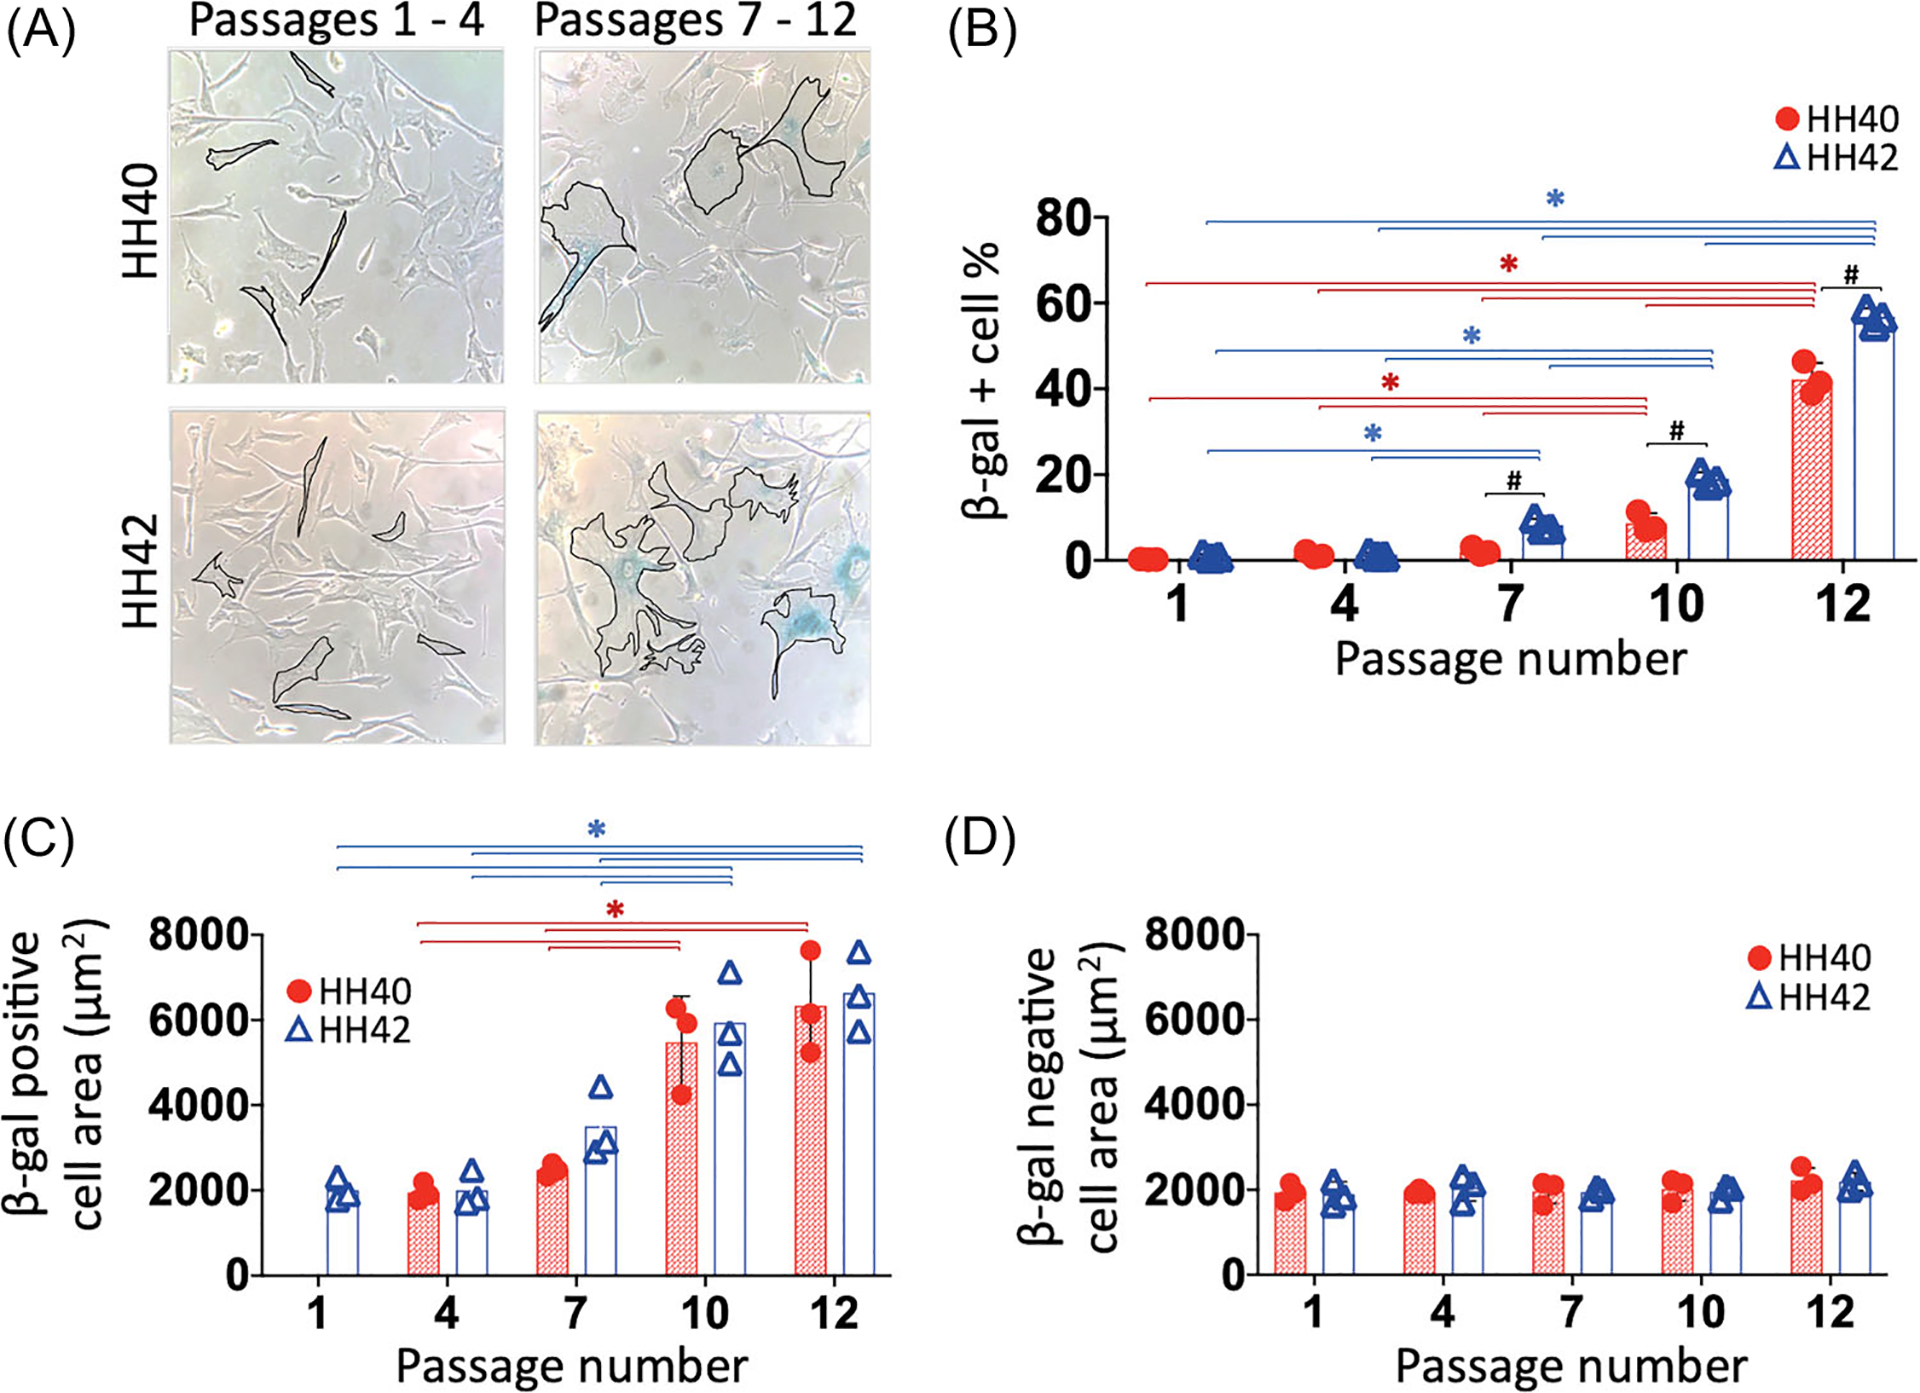
Cell surface area and β-gal positivity. (A) Representative images of β-gal-stained HH40 and HH42 cells with select cells outlined to highlight representative morphology. Cells exhibited predominately thin, elongated morphology during earlier passages (1 through 4) and enlarged, wider surface areas during later passages (7 through 12). (B) The percentage of β-gal positive cells were examined at each passage from 1 to 12 for both HH40 and HH42 cells. Data for passages 1, 4, 7, 10, and 12 are shown, but note that there were no changes in the percentage of β-gal positive cells between passages and embryonic stages from passages 1 through 6. The percentage of β-gal positive cells increased significantly at passage 10 in HH40 cell cultures and at passage 7 in HH42 cell cultures. The percentage of β-gal positive cells became significantly higher in HH42 than HH40 cultures starting at passage 7. (C) Surface area of β-gal positive cells increased significantly by passage 10 in both HH40 and HH42 cultures. There was no significant difference in surface area of β-gal positive cells between HH40 and HH42 cultures. (D) Surface area of β-gal negative cells remained constant throughout culture. There was no significant difference in surface area of β-gal negative cells between HH40 and HH42 cultures. N = 3 for each stage; two-way ANOVA; *p < 0.05 between different passages within same stage; #p < 0.05 between HH40 and HH42 cells at the same passage
We further characterized the senescent state of embryonic tendon cells by evaluating gene expression levels of cell cycle inhibitors p16 and p21 (Figure 4). Expression levels of p16 decreased significantly in HH40 cells at passage 1 compared to freshly harvested tendon (p < 0.05) (Figure 4A), whereas expression levels of p16 remained the same between HH42 cells at passage 1 and freshly harvested tendon. Expression levels of p16 were significantly higher in freshly harvested HH40 tendon compared to HH42 tendon (p < 0.05) but were the same between the two cell stages throughout their time in culture. Expression levels of p16 increased significantly by passage 12 in both HH40 and HH42 cells in vitro (p < 0.05) (Figure 4A). Expression levels of p21 were the same between freshly harvested HH40 and HH42 tendons (Figure 4B). At passage 1, expression levels of p21 decreased significantly in both HH40 and HH42 cells compared to freshly harvested tendons (Figure 4B). In addition, expression levels of p21 were significantly higher in HH40 compared to HH42 cells at passage 1. Expression levels of p21 increased significantly by passage 12 in HH40 cells and passage 4 in HH42 cells in vitro (p < 0.05) (Figure 4B).
FIGURE 4.
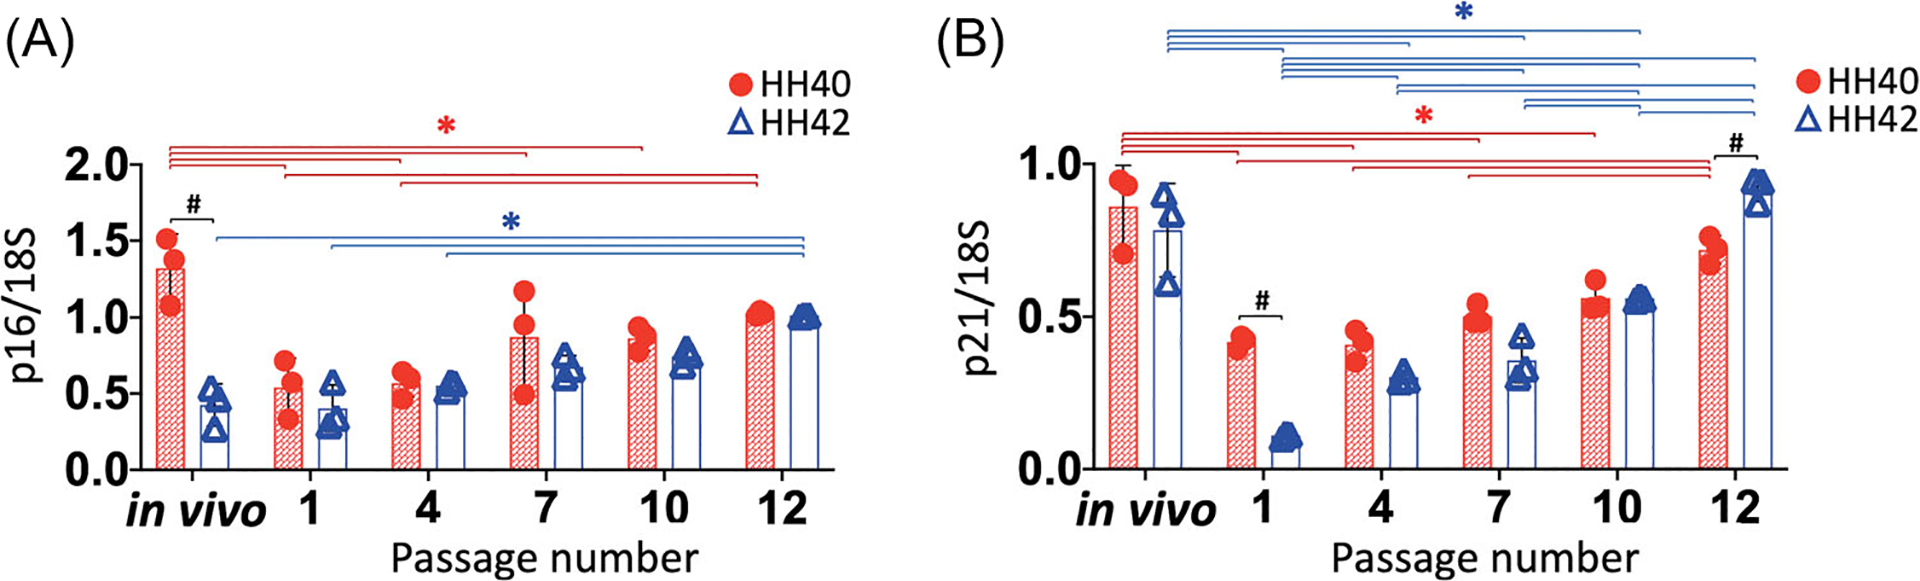
Gene expression levels of cell cycle inhibitors p16 and p21 in HH40 and HH42 cells. (A) Expression levels of p16 were lower in HH40 cells at passage 1 compared to freshly harvested tendon, but remained the same between HH42 cells at passage 1 and freshly harvested tendon. Expression levels of p16 were higher in freshly harvested HH40 tendon than HH42 tendon, but were similar between HH40 and HH42 cells through passage 12. Expression levels of p16 in both HH40 and HH42 cells increased significantly by passage 12. (B) Expression levels of p21 were the same between freshly harvested HH40 and HH42 tendons, but at passage 1 were significantly higher in HH40 than HH42 cells. Expression levels of p21 decreased significantly in both HH40 and HH42 cells at passage 1 compared to freshly harvested tendons. Expression levels of p21 increased significantly by passage 12 in HH40 cells and passage 4 in HH42 cells. N = 3 for each stage; two-way ANOVA; *p < 0.05 between freshly harvested tendons and different passages within same stage; #p < 0.05 between HH40 and HH42 freshly harvested tendons or HH40 and HH42 cells at the same passage
4 |. DISCUSSION
In this study, we characterized the effects of long-term in vitro culture on phenotype stability, proliferation rate, and onset of senescence for chick embryo tendon cells harvested from an earlier (HH40) and a later (HH42) developmental stage (Figure 5). Both HH40 and HH42 cells began to lose their phenotype and exhibit signs of senescence before declines in proliferation rate were observed. Comparison between stages showed that HH42 cells downregulated tendon phenotype marker expression and became senescent sooner than HH40 cells. Based on our results, embryonic tendon cells can be expanded to passage 4, or CPD 12, before phenotype marker levels begin to decrease and senescent cells are detectable.
FIGURE 5.
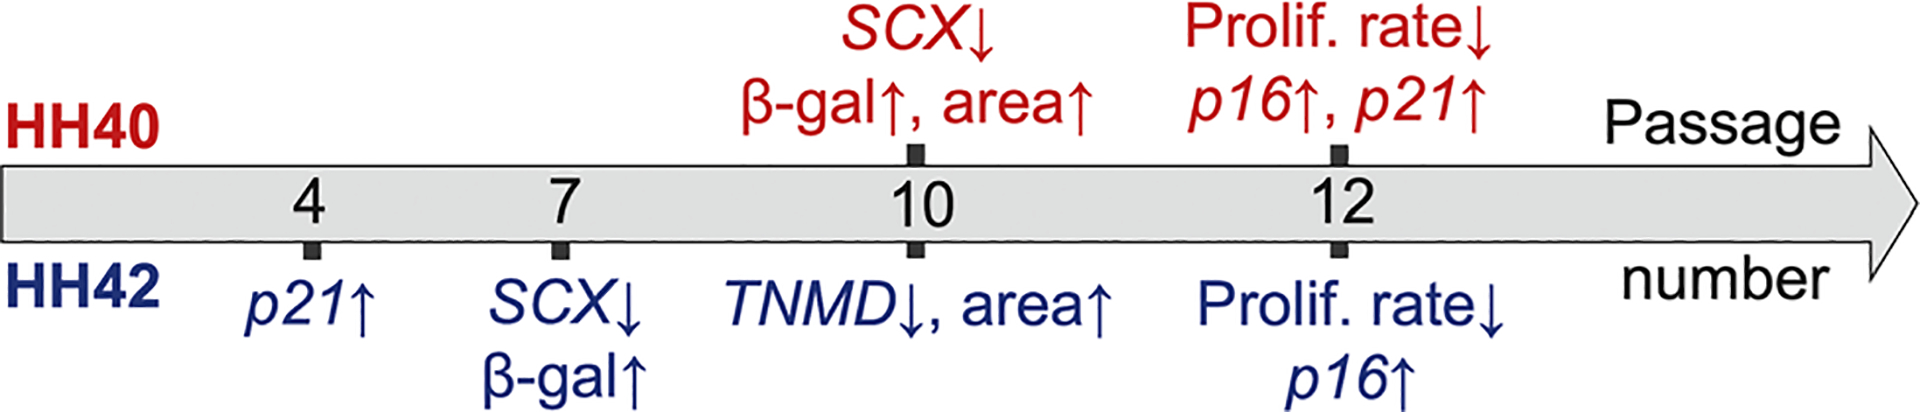
Timeline of significant changes in phenotype expression, proliferation rate, and senescence characteristics for HH40 and HH42 tendon cells cultured in vitro (passage number not to scale). TNMD is not shown for HH40 cells in the timeline because TNMD expression levels did not change significantly between different passages in vitro
Proliferation rates were similar for HH40 and HH42 embryonic tendon cells throughout the experiment, with both decreasing significantly by CPD 31, or passage 12 (Figure 1). Decreasing proliferation rates at higher passage numbers have also been reported for 5-month-old fetal bovine tendon cells.8 Additionally, studies in postnatal tendon cells have shown declining proliferation rates in vitro with increasing age of the donor animal.15,31–34 Patellar tendon cells isolated from 3- to 4-month-old rats exhibit significantly higher proliferation rates than tendon cells from 24 to 26-month-old rats.31 Another study showed lower proliferation rates with human Achilles tendon cells from older patients (63 ± 14 years) compared to cells from younger patients (28 ± 5 years).15 Achilles tendon cells isolated from 2-, 12-, and 24-month-old rats showed decreasing proliferation rates with increasing age, with the biggest difference observed between 2- and 24-month-old rats.32 In contrast to the age-dependent proliferation behaviors of postnatal tendon cells reported in these other studies, our study suggests embryonic tendon cell proliferative capacity in vitro is independent of embryonic stage. However, future studies should characterize proliferation rates of embryonic tendon cells isolated from additional developmental stages to confirm this conclusion.
Embryonic tendon cells downregulated scleraxis and tenomodulin expression as early as passage 7 (Figure 2), reflecting limited phenotype stability during proliferation in vitro. While phenotype stability of embryonic tendon cells in vitro has not been previously examined, other embryonic tissue-derived cells such as brain endothelial cells and cartilage cells have been shown to downregulate expression of their respective phenotype markers with increasing number of population doublings in culture.35,36 Here, scleraxis and tenomodulin expression levels were used to assess embryonic tendon cell phenotype. Scleraxis is a transcription factor involved in determining tendon cell fate and is the earliest known tendon marker,22,37 whereas tenomodulin is detected later during development.38 Knockout of tenomodulin leads to abnormally large collagen fibrils in tendon after birth.39 In our study, tenomodulin expression levels were higher in freshly harvested HH42 tendon compared to HH40 tendon, reflecting the more differentiated state of HH42 cells. In addition, tenomodulin expression levels were higher in HH42 cells than HH40 cells in culture up to passage 7 (Figure 2). Significant reduction in tenomodulin expression levels also occurred after scleraxis expression decreased (Figure 5). This seemed consistent with previous findings that tenomodulin is a downstream target of scleraxis during embryonic tendon development.22,37,40 Scleraxis expression decreased sooner in HH42 cells than in HH40 cells (Figure 2), revealing embryonic stage of cell isolation is a factor in phenotype stability in vitro. While other studies have not directly compared phenotype stability of embryonic tendon cells between different developmental stages, it has been reported that scleraxis expression levels in postnatal patellar tendon cells are higher in 3–4-month-old rats compared to 24–26-month-old rats.31 It would be interesting to compare our current findings with the phenotype stabilities of earlier embryonic stage cells and also with early postnatal tendon cells in future studies.
At passage 1, scleraxis and tenomodulin expression levels in HH40 and HH42 cells were significantly higher compared to freshly harvested tendon (Figure 2). Based on our previous publication that showed stiffer substrates upregulated gene expression levels of tendon markers such as scleraxis in cultured chick embryo tendon cells in vitro, it is possible in our current study that the stiffness of tissue culture plastic increased expression levels of scleraxis and tenomodulin over that in softer native tendon tissue in vivo.5 However, we suggest this with caution because in vivo tendon tissue environment is three-dimensional and contains biological factors that are not present in a two-dimensional tissue culture system in vitro.
Significant downregulation of scleraxis and tenomodulin expression levels during culture occurred before the reduction in proliferation rates in HH40 and HH42 cells (Figure 5). It has been previously reported that knockout of tenomodulin leads to impaired proliferation in neonatal mouse tendon cells in vivo.39 Knockout of tenomodulin also reduces proliferation rates of 6-month-old mouse tail tendon cells cultured in vitro, whereas transient transfection of tenomodulin rescues the proliferative deficit between tenomodulin knockout cells and the control.14 Future studies could perform knockdown experiments to further examine the role of tenomodulin in embryonic tendon cell proliferation in vitro.
The phenomenon in which cells undergo a limited number of doublings in vitro while remaining viable and metabolically active is known as the Hayflick limit.20,41 To characterize whether the cells were approaching the Hayflick limit, or becoming senescent, we used multiple markers as there is no known single marker to reliably evaluate senescence. Characteristics of senescent cells in vitro include enlarged surface area, expression of β-gal, and expression of cell cycle inhibitors.42–45 Enlarged surface area of senescent cells has been attributed to increased organelle volume and cellular content that accumulate because the cells are unable to divide.45 β-gal is a lysosomal enzyme that is upregulated with onset of replicative senescence.42 Other commonly used markers include cyclin-dependent kinase inhibitors p16 and p21, both which induce cell cycle arrest by hindering DNA replication.43,44 In our study, significant increases in the percentage of β-gal positive cells and expression levels of p16 and p21 occurred in both HH40 and HH42 cells at higher passages (Figures 3 and 4). Average surface area of β-gal positive cells increased significantly while that of β-gal negative cells remained constant over time in culture (Figure 3). Our findings are consistent with previous reports in which postnatal mouse and human tendon cells cultured in vitro increased gene expression levels of p16 and percentage of β-gal positive cells at higher passages.14,15,34 In another study, forced overexpression of p16 in human adult Achilles tendon cells increased the percentage of β-gal positive cells and decreased gene expression levels of scleraxis and tenomodulin in vitro.44 Taken together, the upregulation of multiple senescence markers in our study suggests embryonic tendon cells were becoming senescent at higher passages, which could have been the reason for the downregulation of phenotype markers and decreased proliferation rates.
The percentage of β-gal positive cells increased at an earlier passage and remained higher in HH42 cells than HH40 cells, suggesting onset of senescence in vitro occurs more rapidly in later embryonic stage tendon cells (Figure 3). Similar trends with age have been reported for postnatal tendon cells in vitro.32,34 The percentage of β-gal positive cells and expression of cell cycle inhibitor p27 were significantly higher in Achilles tendon cells of 24-month-old rats compared to 2- and 12-month-old rats at the same passages.32 Human Achilles tendon cells from older patients (65 ± 14 years) exhibited higher percentage of β-gal positive cells than those of younger patients (27 ± 5 years) at the same passages in vitro.34 We hypothesize that HH42 embryonic tendon cells possess shorter telomere length and lower telomerase activity than HH40 cells, and that these differences led to the observed differences in proliferation rates and senescence trends. Telomeres provide protection against chromosome degradation during DNA replication.41 Telomere shortening has been implicated in growth arrest of replicative senescent cells.41 During development, telomere length and telomerase activity decline with increasing gestational age in human fetuses.46,47 For example, telomere length and telomerase activity both decline in human fetal tissue between gestational ages 6 and 11 weeks.46 To test our hypothesis, future studies should examine telomere length and telomerase activity of HH42 versus HH40 cells and the influence of these factors on embryonic tendon cell behaviors in vitro.
In our study, p16 and p21 expression levels in both HH40 and HH42 cells at passage 1 decreased significantly compared to freshly harvested tendon (Figure 4). The downregulation of gene expression levels of these cell cycle regulators was particularly interesting. However, the reasons are unknown and future studies would be needed to investigate this. We also found that p21 expression levels in HH42 cells increased significantly by passage 4 whereas percentage of β-gal positive cells, surface area, and p16 levels did not increase until after passage 7 (Figures 3 and 4). Additionally, expression levels of p21 were significantly higher in HH40 than HH42 cells at passage 1 (Figure 4). These data suggest p21 may also play non-senescence roles in embryonic tendon cells. Studies with oligodendrocytes and myoblasts have shown p21 plays roles in development that are independent of senescence.48,49 For example, p21 appears to regulate the G1–G0 transcriptional program in brain development, unrelated to its role in controlling cell cycle exit in cellular senescence.49 It has also been reported that p21 is involved in the mechanism of Sox9 overexpression-induced differentiation of mouse embryonic stem cells into three germ layer lineages by binding to Sox2 enhancer and inhibiting Sox2 expression.50 Future studies should examine potential non-senescence roles of p21 to better understand its roles in embryonic tendon development.
Based on our study, embryonic tendon cells lose their phenotype and start to become senescent before proliferation rate declines in vitro. Furthermore, proliferation rate appears to be independent of embryonic stage of cell isolation, whereas phenotype stability and susceptibility to senescence are dependent on embryonic stage. We discovered that chick embryonic tendon cells can be at least expanded up to passage 4, or CPD 12, before loss of tendon phenotype and onset of senescence occur, but it is possible that different culture conditions would shift that passage number higher or lower. Additionally, chick embryonic tendon cells could potentially be used as late as passage 7 as the slight increase in β-gal positive cells may be considered negligible depending on the scientific question at hand. Taken together, future studies that utilize embryonic tendon cells in vitro should consider the embryonic stage of cell isolation and be aware that these cells may lose their phenotype and experience onset of senescence before proliferation rates decline.
ACKNOWLEDGMENTS
This study was supported by the funding agency National Institutes of Health under grant no. NIH R01AR072886 (to C.K.K.) and the National Science Foundation under grant no. NSF CMMI-1560965 (to C.K.K.).
REFERENCES
- 1.Andersson G The Burden of Musculoskeletal Diseases in the United States: Prevalence, Societal and Economic Cost. American Academy of Orthopaedic Surgeons; 2008. [Google Scholar]
- 2.Centers for Disease Control and Prevention. Work-Related Musculoskeletal Disorders & Ergonomics; 2020. https://www.cdc.gov/workplacehealthpromotion/health-strategies/musculoskeletal-disorders/index.html
- 3.Windisch G, Anderhuber F, Haldi-Brandle V, Exner GU. Anatomical study for an updated comprehension of clubfoot. Part II: ligaments, tendons and muscles. J Child Orthop. 2007;1:79–85. [DOI] [PMC free article] [PubMed] [Google Scholar]
- 4.Brown JP, Galassi TV, Stoppato M, Schiele NR, Kuo CK. Comparative analysis of mesenchymal stem cell and embryonic tendon progenitor cell response to embryonic tendon biochemical and mechanical factors. Stem Cell Res Ther. 2015;6:89. [DOI] [PMC free article] [PubMed] [Google Scholar]
- 5.Marturano JE, Schiele NR, Schiller ZA, Galassi TV, Stoppato M, Kuo CK. Embryonically inspired scaffolds regulate tenogenically differentiating cells. J Biomech. 2016;49:3281–3288. [DOI] [PMC free article] [PubMed] [Google Scholar]
- 6.Havis E, Bonnin MA, Olivera-Martinez I, et al. Transcriptomic analysis of mouse limb tendon cells during development. Development. 2014;141:3683–3696. [DOI] [PubMed] [Google Scholar]
- 7.Herchenhan A, Kalson NS, Holmes DF, Hill P, Kadler KE, Margetts L. Tenocyte contraction induces crimp formation in tendon-like tissue. Biomech Model Mechanobiol. 2012;11:449–459. [DOI] [PMC free article] [PubMed] [Google Scholar]
- 8.Yang J, Zhao Q, Wang K, et al. Isolation and biological characterization of tendon-derived stem cells from fetal bovine. In Vitro Cell Dev Biol Anim. 2016;52:846–856. [DOI] [PMC free article] [PubMed] [Google Scholar]
- 9.Li J, Stoppato M, Schiele NR, Graybeal KL, Nguyen PK, Kuo CK. Embryonic and postnatal tendon cells respond differently to interleukin-1beta. Ann N Y Acad Sci. 2019. [DOI] [PMC free article] [PubMed] [Google Scholar]
- 10.Brown JP, Finley VG, Kuo CK. Embryonic mechanical and soluble cues regulate tendon progenitor cell gene expression as a function of developmental stage and anatomical origin. J Biomech. 2014;47:214–222. [DOI] [PMC free article] [PubMed] [Google Scholar]
- 11.Schiele NR, von Flotow F, Tochka ZL, et al. Actin cytoskeleton contributes to the elastic modulus of embryonic tendon during early development. J Orthop Res. 2015;33:874–881. [DOI] [PMC free article] [PubMed] [Google Scholar]
- 12.Bavin EP, Atkinson F, Barsby T, Guest DJ. Scleraxis is essential for tendon differentiation by equine embryonic stem cells and in equine fetal tenocytes. Stem Cells Dev. 2017;26:441–450. [DOI] [PubMed] [Google Scholar]
- 13.Huang AH, Watson SS, Wang L, et al. Requirement for scleraxis in the recruitment of mesenchymal progenitors during embryonic tendon elongation. Development. 2019:146. [DOI] [PMC free article] [PubMed] [Google Scholar]
- 14.Alberton P, Dex S, Popov C, Shukunami C, Schieker M, Docheva D. Loss of tenomodulin results in reduced self-renewal and augmented senescence of tendon stem/progenitor cells. Stem Cells Dev. 2015;24:597–609. [DOI] [PMC free article] [PubMed] [Google Scholar]
- 15.Kohler J, Popov C, Klotz B, et al. Uncovering the cellular and molecular changes in tendon stem/progenitor cells attributed to tendon aging and degeneration. Aging Cell. 2013;12:988–999. [DOI] [PMC free article] [PubMed] [Google Scholar]
- 16.Zhang J, Wang JH. Characterization of differential properties of rabbit tendon stem cells and tenocytes. BMC Musculoskelet Disord. 2010;11:10. [DOI] [PMC free article] [PubMed] [Google Scholar]
- 17.Jo CH, Lim HJ, Yoon KS. Characterization of tendon-specific markers in various human tissues, tenocytes and mesenchymal stem cells. Tissue Eng Regen Med. 2019;16:151–159. [DOI] [PMC free article] [PubMed] [Google Scholar]
- 18.Stalling SS, Nicoll SB. Fetal ACL fibroblasts exhibit enhanced cellular properties compared with adults. Clin Orthop Relat Res. 2008;466: 3130–3137. [DOI] [PMC free article] [PubMed] [Google Scholar]
- 19.Brink HE, Bernstein J, Nicoll SB. Fetal dermal fibroblasts exhibit enhanced growth and collagen production in two- and three-dimensional culture in comparison to adult fibroblasts. J Tissue Eng Regen Med. 2009;3:623–633. [DOI] [PubMed] [Google Scholar]
- 20.Hayflick L The limited in vitro lifetime of human diploid cell strains. Exp Cell Res. 1965;37:614–636. [DOI] [PubMed] [Google Scholar]
- 21.Marturano JE, Arena JD, Schiller ZA, Georgakoudi I, Kuo CK. Characterization of mechanical and biochemical properties of developing embryonic tendon. Proc Natl Acad Sci USA. 2013;110:6370–6375. [DOI] [PMC free article] [PubMed] [Google Scholar]
- 22.Schweitzer R, Chyung JH, Murtaugh LC, et al. Analysis of the tendon cell fate using Scleraxis, a specific marker for tendons and ligaments. Development. 2001;128:3855–3866. [DOI] [PubMed] [Google Scholar]
- 23.Marturano JE, Xylas JF, Sridharan GV, Georgakoudi I, Kuo CK. Lysyl oxidase-mediated collagen crosslinks may be assessed as markers of functional properties of tendon tissue formation. Acta Biomater. 2014;10:1370–1379. [DOI] [PMC free article] [PubMed] [Google Scholar]
- 24.Pan XS, Li J, Brown EB, Kuo CK. Embryo movements regulate tendon mechanical property development. Philos Trans R Soc Lond B Biol Sci. 2018:373. [DOI] [PMC free article] [PubMed] [Google Scholar]
- 25.Glass ZA, Schiele NR, Kuo CK. Informing tendon tissue engineering with embryonic development. J Biomech. 2014;47:1964–1968. [DOI] [PMC free article] [PubMed] [Google Scholar]
- 26.Kuo CK, Petersen BC, Tuan RS. Spatiotemporal protein distribution of TGF-betas, their receptors, and extracellular matrix molecules during embryonic tendon development. Dev Dyn. 2008;237:1477–1489. [DOI] [PMC free article] [PubMed] [Google Scholar]
- 27.Schiele NR, Marturano JE, Kuo CK. Mechanical factors in embryonic tendon development: potential cues for stem cell tenogenesis. Curr Opin Biotechnol. 2013;24:834–840. [DOI] [PMC free article] [PubMed] [Google Scholar]
- 28.Nguyen PK, Pan XS, Li J, Kuo CK. Roadmap of molecular, compositional, and functional markers during embryonic tendon development. Connect Tissue Res. 2018;59:495–508. [DOI] [PMC free article] [PubMed] [Google Scholar]
- 29.Banos CC, Thomas AH, Kuo CK. Collagen fibrillogenesis in tendon development: current models and regulation of fibril assembly. Birth Defects Res C Embryo Today. 2008;84:228–244. [DOI] [PubMed] [Google Scholar]
- 30.Hamburger V, Hamilton HL. A series of normal stages in the development of the chick embryo. J Morphol. 1951;88:49–92. [PubMed] [Google Scholar]
- 31.Zhou Z, Akinbiyi T, Xu L, et al. Tendon-derived stem/progenitor cell aging: defective self-renewal and altered fate. Aging Cell. 2010;9: 911–915. [DOI] [PMC free article] [PubMed] [Google Scholar]
- 32.Tsai WC, Chang HN, Yu TY, et al. Decreased proliferation of aging tenocytes is associated with down-regulation of cellular senescence-inhibited gene and up-regulation of p27. J Orthop Res. 2011;29: 1598–1603. [DOI] [PubMed] [Google Scholar]
- 33.Chang HN, Pang JH, Chen CP, et al. The effect of aging on migration, proliferation, and collagen expression of tenocytes in response to ciprofloxacin. J Orthop Res. 2012;30:764–768. [DOI] [PubMed] [Google Scholar]
- 34.Hu C, Zhang Y, Tang K, Luo Y, Liu Y, Chen W. Downregulation of CITED2 contributes to TGFbeta-mediated senescence of tendon-derived stem cells. Cell Tissue Res. 2017;368:93–104. [DOI] [PubMed] [Google Scholar]
- 35.Andrews AM, Lutton EM, Cannella LA, et al. Characterization of human fetal brain endothelial cells reveals barrier properties suitable for in vitro modeling of the BBB with syngenic co-cultures. J Cereb Blood Flow Metab. 2018;38:888–903. [DOI] [PMC free article] [PubMed] [Google Scholar]
- 36.Kim HR, Kim J, Park SR, Min BH, Choi BH. Characterization of human fetal cartilage progenitor cells during long-term expansion in a xeno-free medium. Tissue Eng Regen Med. 2018;15:649–659. [DOI] [PMC free article] [PubMed] [Google Scholar]
- 37.Murchison ND, Price BA, Conner DA, et al. Regulation of tendon differentiation by scleraxis distinguishes force-transmitting tendons from muscle-anchoring tendons. Development. 2007;134:2697–2708. [DOI] [PubMed] [Google Scholar]
- 38.Shukunami C, Oshima Y, Hiraki Y. Molecular cloning of tenomodulin, a novel chondromodulin-I related gene. Biochem Biophys Res Commun. 2001;280:1323–1327. [DOI] [PubMed] [Google Scholar]
- 39.Docheva D, Hunziker EB, Fassler R, Brandau O. Tenomodulin is necessary for tenocyte proliferation and tendon maturation. Mol Cell Biol. 2005;25:699–705. [DOI] [PMC free article] [PubMed] [Google Scholar]
- 40.Shukunami C, Takimoto A, Oro M, Hiraki Y. Scleraxis positively regulates the expression of tenomodulin, a differentiation marker of tenocytes. Dev Biol. 2006;298:234–247. [DOI] [PubMed] [Google Scholar]
- 41.Shay JW, Wright WE, Werbin H. Defining the molecular mechanisms of human cell immortalization. Biochim Biophys Acta. 1991; 1072:1–7. [DOI] [PubMed] [Google Scholar]
- 42.Dimri GP, Lee X, Basile G, et al. A biomarker that identifies senescent human cells in culture and in aging skin in vivo. Proc Natl Acad Sci USA. 1995;92:9363–9367. [DOI] [PMC free article] [PubMed] [Google Scholar]
- 43.Itahana K, Campisi J, Dimri GP. Mechanisms of cellular senescence in human and mouse cells. Biogerontology. 2004;5:1–10. [DOI] [PubMed] [Google Scholar]
- 44.Han W, Wang B, Liu J, Chen L. The p16/miR-217/EGR1 pathway modulates age-related tenogenic differentiation in tendon stem/progenitor cells. Acta Biochim Biophys Sin (Shanghai). 2017;49: 1015–1021. [DOI] [PubMed] [Google Scholar]
- 45.Hayflick L, Moorhead PS. The serial cultivation of human diploid cell strains. Exp Cell Res. 1961;25:585–621. [DOI] [PubMed] [Google Scholar]
- 46.Cheng G, Kong F, Luan Y, et al. Differential shortening rate of telomere length in the development of human fetus. Biochem Biophys Res Commun. 2013;442:112–115. [DOI] [PubMed] [Google Scholar]
- 47.Friedrich U, Schwab M, Griese EU, Fritz P, Klotz U. Telomeres in neonates: new insights in fetal hematopoiesis. Pediatr Res. 2001;49: 252–256. [DOI] [PubMed] [Google Scholar]
- 48.Skapek SX, Rhee J, Spicer DB, Lassar AB. Inhibition of myogenic differentiation in proliferating myoblasts by cyclin D1-dependent kinase. Science. 1995;267:1022–1024. [DOI] [PubMed] [Google Scholar]
- 49.Zezula J, Casaccia-Bonnefil P, Ezhevsky SA, et al. p21cip1 is required for the differentiation of oligodendrocytes independently of cell cycle withdrawal. EMBO Rep. 2001;2:27–34. [DOI] [PMC free article] [PubMed] [Google Scholar]
- 50.Yamamizu K, Schlessinger D, Ko MS. SOX9 accelerates ESC differentiation to three germ layer lineages by repressing SOX2 expression through P21 (WAF1/CIP1). Development. 2014;141:4254–4266. [DOI] [PMC free article] [PubMed] [Google Scholar]