Abstract
Introduction
To diagnose sinusoidal obstruction syndrome/veno‐occlusive disease (SOS/VOD), transabdominal ultrasonography is usually used to detect hemodynamic changes, but we tried to detect the changes using four‐dimensional computed tomography (4D‐CT). A 42‐year‐old Japanese woman was diagnosed with late‐onset SOS/VOD with transabdominal ultrasonography and was also assessed using 4D‐CT. Method We analyzed the portal vein (PV) contrast effect every 1.5 seconds and plotted the values of the contrast effect. With this graph, we analyzed three hemodynamic parameters.
Result
We found that these parameters correlated with the patient's status and indicated stasis due to sinusoid constriction.
Conclusion
4D‐CT may become a helpful tool to diagnose and follow up with SOS/VOD.
Keywords: four‐dimensional computed tomography, hematopoietic stem cell transplantation, sinusoidal obstruction syndrome, veno‐occlusive disease
1. INTRODUCTION
Sinusoidal obstruction syndrome (SOS), also known as hepatic veno‐occlusive disease (VOD), is a life‐threatening complication of hematopoietic stem cell transplantation (HSCT) [1]. SOS/VOD usually develops within 3 weeks after HSCT, although in 15–20% it can occur later [2]. SOS/VOD is believed to cause injury to microvascular and endothelial cells hence, causing obstruction of the sinusoid [3]. Its diagnosis is often based on clinical criterion scoring systems such as the Baltimore and Seattle criteria.
Although the detection of hemodynamic changes in SOS/VOD is well known, it has long been considered unnecessary to diagnose SOS/VOD. In 2016, the new European Society for Blood and Marrow Transplantation (EBMT) criteria for the diagnosis of SOS/VOD in adults were reported. According to the new EBMT criteria, a late‐onset SOS/VOD diagnosis requires hemodynamic and/or ultrasonographic evidence. Some studies have reported that transabdominal ultrasonography (US) is a useful tool for detecting blood flow abnormalities in SOS/VOD [4, 5, 6]. Nishida et al. reported that the Hok‐US criteria using US had very high sensitivity and specificity although diagnosis is dependent on the skills of the operator [7]. Some studies have shown the efficacy of other imaging modalities, such as magnetic resonance imaging (MRI), computed tomography (CT), and 18F‐fluorodeoxyglucose (FDG) positron emission tomography CT (PET/CT), in detecting hemodynamic changes.
Recently, four‐dimensional CT (4D‐CT) has been shown to detect blood flow abnormalities in cardiovascular and cerebrovascular diseases. Hepatic diseases such as cirrhosis have also been reported. Herein, we report the detection of blood flow abnormalities in a patient with SOS/VOD by using 4D‐CT.
1.1. Case presentation
A 42‐years‐old Japanese woman with cerebral arteriovenous malformation was referred to our hospital because of pancytopenia in 2020 and was diagnosed with B lymphoblastic leukemia with t(9;22) (q34.1;q11.2); BCR::ABL. She achieved complete remission (CR) after multiple chemotherapy sessions, followed by allogeneic HSCT (allo‐HSCT) using a myeloablative regimen from an unrelated donor. After the first HSCT, she experienced a first relapse 127 days later although she received ponatinib (15 mg on day 32). She was then treated with blinatumomab after the recurrence, achieved second molecular CR, and underwent cord blood transplantation (CBT). However, she experienced a second relapse on day 138 again from the second HSCT, was treated with inotuzumab ozogamicin (0.5 mg/sqm), and finally achieved a third molecular CR.
On day 206 from the second HSCT, she presented to the hospital with right upper extremity pain. Upon admission, blood test results were as follows: WBC 3500/µL, Hb 10.4 g/dL, Plt 4.1×10⁴/µL, T‐Bil 2.6 mg/dL, AST 385 U/L, ALT 375 U/L, LDH 702 U/L, ALP 824 U/L and γGT 642 U/L. No evidence of viremia or other infections was observed. The patient also maintained a complete molecular response in ALL.
The patient was diagnosed with late‐onset SOS based on the diagnostic criteria for adult SOS using EBMT (body weight gain [> 5%], ascites, right upper lobe pain, and evidence of hemodynamics). Ultrasound taken scored more than five points in the Hokkaido US‐based scoring system (HokUS‐10), namely; hepatic right lobe vertical diameter, gallbladder wall thickening, portal vein (PV) diameter, amount of ascites, and portal vein mean velocity. On the same day, the patient also underwent 4D‐CT. A 320‐row CT system (Aquilion ONE; Canon Medical Systems) was used after intravenous injection of iopromide (Iopromide; BAYEL) at 600mI/kg. Each scan was acquired during quiet free breathing. First, we assessed the 4D‐CT scan similar to the HoKUS‐10.
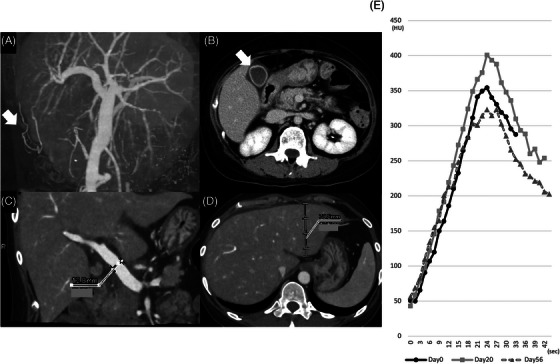
CT revealed hepatomegaly, gallbladder wall thickening, and increased PV diameter like the US findings (Figure 1A–D). Moreover, the paraumbilical vein (PUV) was detected on 4D‐CT, but not on US. To assess the hemodynamics of the liver, we started the value of the contrast effect at the PV scan every 1.5 s from when 200 Hounsfield units (HU) were achieved in the aorta (Figure 1E).
FIGURE 1.

(A) Paraumbilical vein (arrow). (B) Gallbladder wall thickening (arrow). (C) Increased portal vein (PV) diameter (12.8 mm). (D) Hepatomegaly (left lobe vertical diameter, 70.8 mm). (E) The value of the contrast effect at the portal vein scan every 1.5 s.
Defibrotide (25 mg/kg) was administered every 6 h since the day of admission. On day 14 from the initiation of defibrotide, the total bilirubin level gradually decreased and the patient had better physical symptoms. The patient underwent 4D‐CT and US on days 0, 20, and 56 after initiation of defibrotide, with three 4D‐CT imaging tests. Each of the three times, we administered the same amount of the contrast agent. The HokUS‐10 scores on the abdominal US did not change during the hospital stay. With the 4D‐CT appearance, the value of each item was evaluated. Only the thickened gallbladder wall improved while the other positive scores did not change. The patient was finally discharged from the hospital, with noted molecular CR.
2. DISCUSSION
To the best of our knowledge, this is the first study to assess SOS/VOD using 4D‐CT. With 4D‐CT, we can detect hemodynamic changes in SOS/VOD and monitor their improvement. Current evidence supports the need for ultrasonography because of its ability to detect abnormalities in blood flow.
Recently, Some studies have reported that quantitative digital subtraction angiography (DSA) is an efficient method for assessing cerebral hemodynamics using an agent to detect stasis [8]. They plotted the values of the contrast agent and analyzed some hemodynamic parameters. Lin et al. proposed a stasis index for cerebral hemodynamic analysis using the plotted graph [9]. This index is defined as the inflow gradient divided by the absolute value of the outflow gradient. A decreased absolute outflow gradient suggests hemodynamic stasis and the stasis index may indicate pressure on the assessed vein. We apply the assessing technique of the stasis into 4D‐CT to detect the stasis. Recently, 4D‐CT has been used to visualize the flow dynamics of the portal circulation [10]. This visualizes the flow dynamics less invasively than DSA. To detect hemodynamic changes using 4D‐CT, we analyzed the main PV contrast effect every 1.5 s and plotted the values of the contrast effect (Figure 1E). We analyzed three hemodynamic parameters, the inflow gradient, the absolute value of the outflow gradient, and the stasis index.
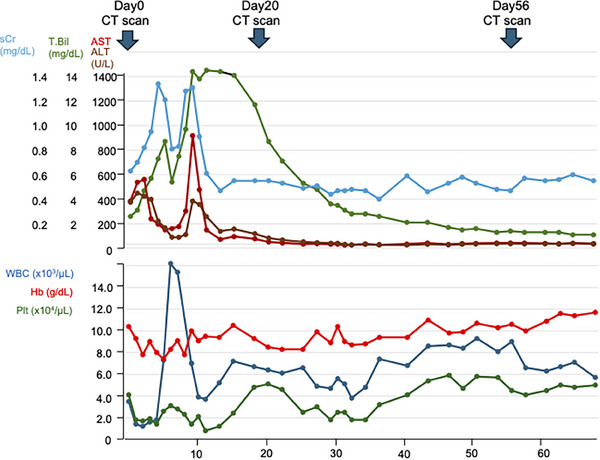
Essentially, also evaluated the inflow gradient and the absolute value of the outflow gradient, which indicated vascular resistance at that site. Anatomically, the portal vein flows through the Glisson area to the sinusoid area. Therefore, we believe that the absolute value of the outflow gradient provides more information about stasis due to sinusoid constriction. We identified day 10 as the patient's most critical clinical day (Figure 2). On day 20, the patient's clinical condition was improving, as indicated by AST/ALT and CBC levels, although her total bilirubin remained elevated. This discrepancy in results is the reason for the controversy between the absolute value of the outflow gradient and the value of the inflow gradient (Table 1 and Figure 2).
TABLE 1.
Hepatic hemodynamic parameters with four‐dimensional computed tomography (4D‐CT).
| Day0 | Day20 | Day56 | |
|---|---|---|---|
| Inflow gradient | 21.156 | 23.431 | 16.191 |
| Absolute value of outflow gradient | 10.943 | 15.282 | 15.068 |
| Stasis index | 1.93 | 1.53 | 1.07 |
FIGURE 2.

Clinical course of this patient.
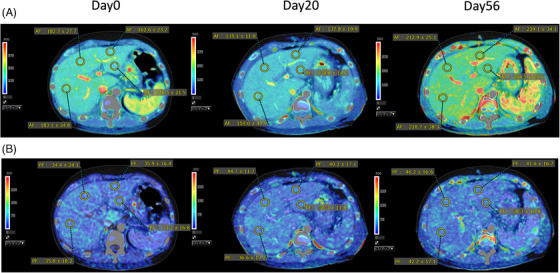
Therefore, to assess the stasis index to indicate the hemodynamic change, we also use the application ‘Vitrea’ produced by Canon. This application is a noninvasive post‐processing software that calculates perfusion characteristics from dynamic CT image data. After input and reference points are identified, the Vitrea software calculates the arterial flow and portal flow and makes perfusion maps. We measured the flow at 4 points (A: left globe lateral segment, B: left globe medial segment, C: right globe anterior segment, D: right globe posterior segment). We got the same trend with PV flow as the stasis index (Figure 3B). The whole liver perfusion images get brighter as the flow gets faster (Figure 3A). In this application, we can also assess the hepatic artery flow, and tend to get better (Table 2).
FIGURE 3.

(A, B) Artery (A) and portal vein (PV) (B) perfusion maps calculated by Vitrea (Day0, 20, and 56).
TABLE 2.
Flow rate (mL/min/100 mL) calculated by Vitrea on 4 points. (A) Left globe lateral segment, (B) Left globe medial segment, (C) Right globe anterior segment, and (D) Right globe posterior segment.
| Day0 | Day20 | Day56 | ||||
|---|---|---|---|---|---|---|
| Artery flow | PV flow | Artery flow | PV flow | Artery flow | PV flow | |
| A | 162.2 ± 23.2 | 35.9 ± 19.9 | 137.8 ± 19.9 | 40.2 ± 17.1 | 239.1 ± 34.1 | 41.6 ± 16.7 |
| B | 146.5 ± 21.5 | 33.2 ± 16.8 | 134.8 ± 14.2 | 36.3 ± 11.8 | 204.5 ± 25.0 | 38.7 ± 10.8 |
| C | 182.7 ± 27.7 | 34.4 ± 24.1 | 135.1 ± 11.8 | 44.7 ± 11.7 | 212.9 ± 25.1 | 46.2 ± 16.6 |
| D | 183.1 ± 34.8 | 35.8 ± 18.2 | 158.0 ± 45.9 | 36.6 ± 13.2 | 21.8 ± 38.3 | 42.2 ± 17.1 |
We also assessed the Hok‐US parameters with AUS and 4D‐CT. Compared with Hok‐US by transabdominal US, the PUV could be detected using CT although it cannot be detected using US.
Contrast‐enhanced CT is a good way to detect collateral veins because of its reproducibility [11]. And, 4D‐CT can measure ascites, hepatic volume, and collateral circulation more objectively and precisely, thereby improving clinical conditions. In this case, the HokUS‐10 score did not improve, contradicting the laboratory data. Gallbladder wall thickness improved and correlated with laboratory data such as total bilirubin and sinusoid obstruction. The reasons for no improvement in the score with AUS may include hepatomegaly, small ascites, and no change in the PV mean velocity.
It is now believed that the ability to detect abnormalities in blood flow using US is superior to other modalities. But, there are some demerits with US. First, the result is very subjective and relies on the operator's skill. Second, the difficulty of detection also depends on each patient's obesity or morphology.
This study has some limitations. First, preparation of a 4D‐CT scanner. The problem is whether the hospital had it. Second, although CT is less invasive, it poses risks for radiation exposure and contrast agent allergies. Such contrast agents could not also be administered especially for patients with severe renal failure. Third, patients must hold their breath for 40 seconds during the CT scan, which may be difficult for some patients. And how we determine the amount of contrast is controversial. Patients with SOS/VOD tend to gain weight, but their blood flow is thought to remain the same.
Hence, 4D‐CT was used in only one case. Further studies are required to validate the effectiveness of 4D‐CT in diagnosing SOS/VOD.
AUTHOR CONTRIBUTIONS
Saori Shimoyama‐Ibuki collected clinical data and wrote the initial draft. Satoshi Iyama and Yoshiya Ohashi have conceptualized the study and reviewed it. Kento Ono, Yusuke Sugama, Chisa Fujita, Akari Goto, Hiroto Horiguchi, Akihito Fujimi, Kohichi Takada, Takeo Tanaka, Koh‐Ichi Sakata, and Masayoshi Kobune contributed to collecting data and reviewing the manuscript. All authors approved the final version of the manuscript.
CONFLICT OF INTEREST STATEMENT
Satoshi Iyama: Alexion Pharmaceuticals: Honoraria, Research Funding; MSD: Research Funding; Otsuka Pharmaceutical: Honoraria, Research Funding; Sanofi: Honoraria, Research Funding; SymBio Pharmaceuticals: Honoraria, Research Funding; Astellas: Honoraria; CSL Behring: Honoraria; Daiichi Sankyo: Honoraria; Meiji Pharma: Honoraria; Nippon Shinyaku: Honoraria; Novartis Honoraria; Hiroto Horiguchi: Otsuka Pharmaceutical: Honoraria, Kyowa Kirin: Honoraria, Chugai pharmaceutical: Honoraria, Janssen pharmaceutical; Kyowa Kirin.: Honoraria, Abbvie pharmaceutical: Honoraria. Kohichi Takada: Daiichi Sankyo: Honoraria. The rest of the authors declare no conflict of interest.
FUNDING INFORMATION
The authors received no specific funding for this work.
ETHICS STATEMENT
The authors have confirmed ethical approval statement is not needed for this submission.
PATIENT CONSENT STATEMENT
The authors confirm the patient's consent for the study.
CLINICAL TRIAL REGISTRATION
The authors have confirmed clinical trial registration is not needed for this submission.
ACKNOWLEDGMENTS
We would like to thank Editage (www.editage.jp) for English language editing.
Shimoyama‐Ibuki S, Iyama S, Ohashi Y, Ono K, Sugama Y, Fujita C, et al. Novel method for assessing sinusoidal obstruction syndrome using four‐dimensional computed tomography. eJHaem. 2024;5:1038–1042. 10.1002/jha2.990
DATA AVAILABILITY STATEMENT
The authors confirm that the data supporting the findings of this study are available within the article.
REFERENCES
- 1. McDonald GB, Sharma P, Matthews DE, Shulman HM, Thomas ED. Venocclusive disease of the liver after bone marrow transplantation: diagnosis, incidence, and predisposing factors. Hepatology. 1984;4:116–122. [DOI] [PubMed] [Google Scholar]
- 2. Carreras E, Rosiñol L, Terol MJ, Alegre A, de Arriba F, García‐Laraña J, et al. Veno‐occlusive disease of the liver after high‐dose cytoreductive therapy with busulfan and melphalan for autologous blood stem cell transplantation in multiple myeloma patients. Biol Blood Marrow Transplant. 2007;13:1448–1454. [DOI] [PubMed] [Google Scholar]
- 3. Bonifazi F, Barbato F, Ravaioli F, Sessa M, Defrancesco I, Arpinati M, et al. Diagnosis and treatment of VOD/SOS after allogeneic hematopoietic stem cell transplantation. Front Immunol. 2020;11:489. [DOI] [PMC free article] [PubMed] [Google Scholar]
- 4. Brown BP, Abu‐Yousef M, Farner R, LaBrecque D, Gingrich R. Doppler sonography: a noninvasive method for evaluation of hepatic venocclusive disease. AJR Am J Roentgenol. 1990;154:721–724. [DOI] [PubMed] [Google Scholar]
- 5. Mahgerefteh SY, Sosna J, Bogot N, Shapira MY, Pappo O, Bloom AI. Radiologic imaging and intervention for gastrointestinal and hepatic complications of hematopoietic stem cell transplantation. Radiology. 2011;258:660–671. [DOI] [PubMed] [Google Scholar]
- 6. Lassau N, Leclère J, Auperin A, Bourhis JH, Hartmann O, Valteau‐Couanet D, et al. Hepatic veno‐occlusive disease after myeloablative treatment and bone marrow transplantation: value of gray‐scale and Doppler US in 100 patients. Radiology. 1997;204:545–552. [DOI] [PubMed] [Google Scholar]
- 7. Nishida M, Kahata K, Hayase E, Shigematsu A, Sato M, Kudo Y, et al. Novel ultrasonographic scoring system of sinusoidal obstruction syndrome after hematopoietic stem cell transplantation. Biol Blood Marrow Transplant. 2018;24:1896–1900. [DOI] [PubMed] [Google Scholar]
- 8. Teng MMH, Chang FC, Lin CJ, Chiang L, Hong JS, Kao YH. Peritherapeutic hemodynamic changes of carotid stenting evaluated with Quantitative DSA in patients with carotid stenosis. Am J Neuroradiol. 2016;37:1883–1888. [DOI] [PMC free article] [PubMed] [Google Scholar]
- 9. Lin TM, Yang HC, Lee CC, Wu HM, Hu YS, Luo CB, et al. Stasis index from hemodynamic analysis using quantitative DSA correlates with hemorrhage of supratentorial arteriovenous malformation: a cross‐sectional study. J Neurol Surg. 2019;132:1574–1582. [DOI] [PubMed] [Google Scholar]
- 10. Kageyama K, Yamamoto A, Jogo A, Izuta S, Himoto D, Kakimi A, et al. Visualization of flow dynamics in the portal circulation using 320‐detector‐row computed tomography: a feasibility study. Eur Radiol Exp. 2021;5:1. 10.1186/s41747-020-00197-8 [DOI] [PMC free article] [PubMed] [Google Scholar]
- 11. Maruyama H, Shiina S. Collaterals in portal hypertension: anatomy and clinical relevance. Quant Imaging Med Surg. 2021;11:3867–3881. [DOI] [PMC free article] [PubMed] [Google Scholar]
Associated Data
This section collects any data citations, data availability statements, or supplementary materials included in this article.
Data Availability Statement
The authors confirm that the data supporting the findings of this study are available within the article.


