Abstract
Irradiation-resistance presents a substantial challenge in the successful application of radiotherapy for non-small-cell lung cancer (NSCLC). However, the specific molecular mechanisms responsible for irradiation-resistance have yet to be completely understood. In this research, the DNA methylation and gene expression patterns resulting from irradiation treatment were produced using the DNA methylation BeadChip and RNA-Seq. An integrated analysis was carried out to identify the genes that are differentially expressed and regulated by DNA methylation. As results, the upregulation of gene expression and downregulation of DNA methylation of hexokinase 1 (HK1), a protein associated with glycolysis, were observed in irradiation-resistant NSCLC cells. Additionally, treatment with the DNA demethylating agent 5-aza-2’-deoxycytidine (5-Aza-dC) resulted in increased expression of HK1. Furthermore, it was found that overexpression of HK1 could enhance irradiation-resistance by impacting glycolysis. Collectively, our study indicate that irradiation-induced alterations in DNA methylation lead to the upregulation of HK1, which in turn promotes glycolysis and contributes to radiotherapy resistance in NSCLC. Therefore, targeting HK1 presents a potential novel strategy for addressing the issue of radiotherapy failure in NSCLC.
Keywords: Non-small cell lung cancer, irradiation-resistance, DNA methylation, HK1, glycolysis
Introduction
Lung cancer is a prevalent form of malignant tumor with high rates of morbidity and mortality, posing a significant threat to human health [1,2]. Non-small cell lung cancer (NSCLC) is the most common type, comprising approximately 85% of all lung cancer cases, and is characterized by rapid progression and poor prognosis, with a 5-year survival rate of less than 20% [3,4]. Current treatment modalities for NSCLC include surgery, drug therapy (such as chemotherapy, targeted therapy, and immunotherapy), and radiotherapy [5]. The selection of treatment for NSCLC depends on the disease stage and the patient’s overall health, with radiotherapy being applicable to all stages of NSCLC, and more than half of NSCLC patients receiving at least one course of radiotherapy as part of their treatment and palliative care [6]. Despite the significant role of radiotherapy in NSCLC treatment, patients often experience resistance to irradiation, leading to treatment failure leading to treatment failure and the potential for cancer recurrence and mortality [7]. Radiation resistance in cancer can manifest through various mechanisms, influenced by the heterogeneity of tumor cells, the surrounding microenvironment, and numerous genetic alterations [8]. Prior research has identified several factors closely associated with cancer radiation resistance, including aberrant DNA damage response, evasion of apoptosis, redistribution of the cell cycle, hypoxic tumor microenvironments, autophagy, metabolic reprogramming, iron deficiency anemia, gene mutations, and dysregulation of signaling pathways [9]. Thus, the development of radiation resistance is multifactorial and can arise through distinct regulatory pathways across different cell types [10]. Consequently, irradiation-resistance represents a major challenge in the radiotherapy of NSCLC, necessitating a comprehensive investigation of the molecular mechanisms underlying irradiation-resistance to enhance the sensitivity of radiotherapy and improve the survival prognosis of NSCLC.
Radiotherapy primarily exerts its anti-cancer effect by interacting with tumor cells through the direct or indirect damage of DNA, leading to cell death [11]. Throughout the course of radiotherapy treatment, the repair of DNA triggered by irradiation-induced damage has the potential to impact the local chromatin environment and epigenetic state, including alterations in DNA methylation [12,13]. DNA methylation, a common covalent modification of cytosines in CpG dinucleotides that can regulate chromatin structure and activity, has been linked to radiotherapy resistance in recent research [14,15]. Previous studies have shown that DNA methylation may not only restrict irradiation-induced DNA damage by creating a protective environment in heterochromatin, but also regulate gene expression programs that could contribute to the development of irradiation-resistant phenotypes [16-18]. Despite the significance of irradiation-induced DNA methylation changes in radiotherapy resistance, the underlying molecular mechanism remains incompletely understood.
In this current investigation, a comprehensive examination of DNA methylation and gene expression patterns in irradiation-resistant NSCLC cells was conducted to pinpoint genes that are differentially expressed due to irradiation-induced DNA methylation changes. The study revealed that the upregulation of hexokinase 1 (HK1) was linked to the downregulation of DNA methylation induced by irradiation, leading to increased resistance of NSCLC cells to irradiation. Furthermore, HK1 was found to influence the biological characteristics of NSCLC cells by modulating glycolysis, which is associated with irradiation-resistance.
Materials and methods
Cell culture and transfection assay
The human non-small cell lung cancer cell lines H1299 and H1975 were obtained from a commercial source (ATCC cell lines) and maintained in RPMI 1640 medium (Gibco) supplemented with 10% fetal bovine serum (Gibco) at 37°C in a humidified atmosphere with 5% CO2. Irradiation of H1299 cells was performed using a 2 Gy irradiation dose delivered by a linear accelerator (Primart 6 MV; Siemens).
To modulate the expression levels of target genes, the pCDNA3.1 plasmids were introduced into cells using Lipofectamine Transfection Reagent (Invitrogen) to upregulate expression, while shRNAs lentiviral vectors were employed to downregulate expression. Cell samples were collected for analysis 48 hours post-transfection.
Cell cytotoxicity assay
The CCK8 Kit (Beyotime) was employed to assess the cytotoxic effects of irradiation on cells. Specifically, 1×10⁶ cells were seeded in the wells of a 6-well plate, and subjected to varying doses (0, 2, 4, 6, 8, 10, 12 Gy) of irradiation using a linear accelerator (Primart 6 MV; Siemens). Subsequently, the cells were harvested for analysis of cell survival utilizing the CCK8 Kit. The extent of cytotoxicity induced by irradiation was quantified and expressed as the ED50 (Gy). The median effective dose (ED50) was calculated as follows: The exponential form of the equation was used and a curve fitted to the data points [fraction affected (Fa) and irradiation dose]: Fa = 1/[1 + (ED50/irradiation dose)m], m = slope of the curve, Fa = % reduction from untreated control × 0.01.
DNA methylation assay
In accordance with the guidelines provided by the manufacturer, the complete DNA content in cells and tissue specimens was isolated using the Genomic DNA Purification Kit (Promega), and subsequently subjected to bisulfite modification utilizing the EpiTect Bisulfite kit (Qiagen). Subsequent to these procedures, a comprehensive analysis of methylation patterns across the genome was conducted using the Illumina Methylation EPIC BeadChip. The methylation score of each CpG is represented as a β-value (β-value = Max (Signal B, 0)/(Max (Signal A, 0) + Max (Signal B, 0) + 100)). The original DNA methylation results have been deposited in figshare (https://doi.org/10.6084/m9.figshare.26894551).
RNA-seq assay
Cellular RNA was extracted using a Total RNA Purification kit (Qiagen), and its concentration and quality were assessed using the Qubit 2.0 Fluorometer (Life Technologies) and the Nanodrop One spectrophotometer. The integrity of the total RNA was evaluated using the Agilent 2100 Bioanalyzer, and only samples with RNA integrity number (RIN) values exceeding 7.0 were utilized for sequencing. Subsequently, 1 μg of RNA was employed for the RNA sample preparations. Strand-specific RNA-seq libraries were prepared using the VAHTS Total RNA-seq (H/M/R) Library Prep Kit (Vazyme) as per the manufacturer’s instructions. This involved RNA purification, fragmentation, first and second strand cDNA synthesis, end repair, adapter ligation, PCR enrichment, and library quantification and validation. The libraries were then sequenced on the Illumina NovaSeq 6000 platform, and the resulting reads were mapped to the human GRCh38 genome. Gene abundance was quantified as fragments per kilobase of exon per million reads mapped (FPKM) using Stringtie software, and the TMM algorithm was applied for normalization. Differential expression analysis of mRNA was conducted using the R package EdgeR. The original sequencing results have been deposited in the Sequence Read Archive (SRA, https://www.ncbi.nlm.nih.gov/sra) PRJNA1071302.
Methylation-specific PCR assay
Methylation-specific PCR (MSP) and unmethylation-specific PCR (UMSP) was used to specifically amplify either the methylated or unmethylated HK1 promoter after bisulfite conversion. A methylation index (MI) was calculated as follows: MI = [(methylated peak intensity)/(methylated peak intensity + unmethylated peak intensity)].
The primers of MSP and UMSP were designed by MethPrimer [19], and the primer sequences for MSP and USP were as follows: MSP primer: Forward 5’-TAATTACGAATTATTGTAATTTTGA-3’; Reverse 5’-AAAAATCAACTAACATAATAACATA-3’. UMSP primer: Forward 5’-TAATTATGAATTATTGTAATTTTGA-3’; Reverse 5’-AAAAATCAACTAACATAATAACATA-3’.
5-aza-2’-deoxycytidine (5-Aza-dC) treatment assay
The DNA methyltransferase inhibitor 5-aza-2’-deoxycytidine (5-Aza-dC) (Sigma) was employed to inhibit DNA methylation. Cells were exposed to 10 μM of 5-Aza-dC for a duration of 72 hours. The drug and culture medium were replenished daily throughout the treatment period.
RT-PCR assay
The RT-PCR assay was performed to analyze the mRNA and lncRNA levels of target genes. Briefly, total RNA in cells and tissue samples was extracted by TRIzol™ (Invitrogen), and 1 μg RNA was used for cDNA reverse transcription by the Reverse Transcription Kit (Takara). The RT-PCR was performed with the SYBR Green Realtime PCR Master Mix Kit (Toyobo) using the ABI ViiATM7Dx Real-Time PCR System (Life Technologies). The RT-PCR primers were as follows: HK1, forward 5’-CGCAGCTCCTGGCCTATTA-3’ and reverse 5’-CTTCCACTCCGCTCGCTTTA-3’; GAPDH, forward 5’-TGACTTCAACAGCGACACCCA-3’ and reverse 5’-CACCCTGTTGCTGTAGCCAAA-3’.
Western blotting assay
The western blotting technique was utilized to assess the protein expression levels of specific genes. Initially, cellular total proteins were extracted using RIPA buffer at 4°C for 0.5 hours, and 50 mg of these proteins were loaded onto a 15% SDS-PAGE for subsequent analysis. Subsequently, rabbit polyclonal primary antibodies (Invitrogen, diluted at 1:1000) targeting HK1 and GAPDH (serving as an internal reference) were applied and left to incubate overnight at 4°C. Following this, HRP (horseradish peroxidase) conjugate goat-anti-rabbit secondary antibody (Invitrogen, diluted at 1:1000) was employed and incubated for 4 hours. The bound antibodies were then detected using the ECL Plus Western Blotting Detection system (GE Healthcare).
Colony formation assay
Cells were exposed to different dose of irradiation (0, 2 Gy) using a linear accelerator (Primart 6 MV; Siemens). Subsequently, the colony formation assay was conducted to assess the impact of the irradiation. Cells were harvested using trypsin and seeded into six-well plates at a density of 1000 cells per well. The cells were then cultured in medium at 37°C with regular medium changes every 3 days. After a 10-day incubation period, the colonies were fixed with 4% formaldehyde for 15 minutes and then stained with crystal violet solution (Beyotime) for 20 minutes. Following washing and photographic documentation, the visible colonies were quantified using ImageJ software.
Cell apoptosis assay
The Annexin V-FITC Apoptosis Detection Kit (Beyotime) was employed to assess cell apoptosis. In summary, 1×10⁶ cells were seeded in each well of a 6-well plate, and following a 48-hour incubation period, the cells were harvested for analysis of apoptosis, which was quantified using flow cytometry.
Cell migration assay
Cell migration was assessed utilizing Transwell chamber culture systems (Becton). After an incubation period of 48 hours, the cells were introduced into the upper Transwell chamber at a density of 1×10⁵ cells per well in a 24-well Transwell insert. Following an additional 24-hour incubation, non-migrated cells adhering to the upper surface of the chamber were removed with cotton swabs. Subsequently, the cells that had migrated to the lower surface of the filters were fixed and stained with Giemsa stain at room temperature for 30 minutes. The quantification of migrated cells was performed using a light microscope (Leica).
Glucose uptake and lactic acid production assay
Glucose uptake was evaluated utilizing a Glucose Uptake-Glo Assay kit (Promega), while lactic acid levels were quantified using a Lactate-Glo Assay kit (Promega) in accordance with the manufacturer’s instructions. Cell cultures were cultivated until they achieved 70% confluence, at which juncture the growth medium was replaced with fresh medium. Subsequently, after a 24-hour incubation period, the cells were collected for the assessment of glucose uptake and lactic acid production. The acquired data was standardized based on the total cell count.
Statistical analyses
The presented values represent the average ± standard deviation (SD) derived from a minimum of three independent experiments. Statistical analyses were performed using SPSS v.21.0 (IBM, USA). A significance level of P < 0.05 (two-tailed) was considered as statistically significant.
Results
Analysis of irradiation-induced DNA methylation changes in NSCLC cells
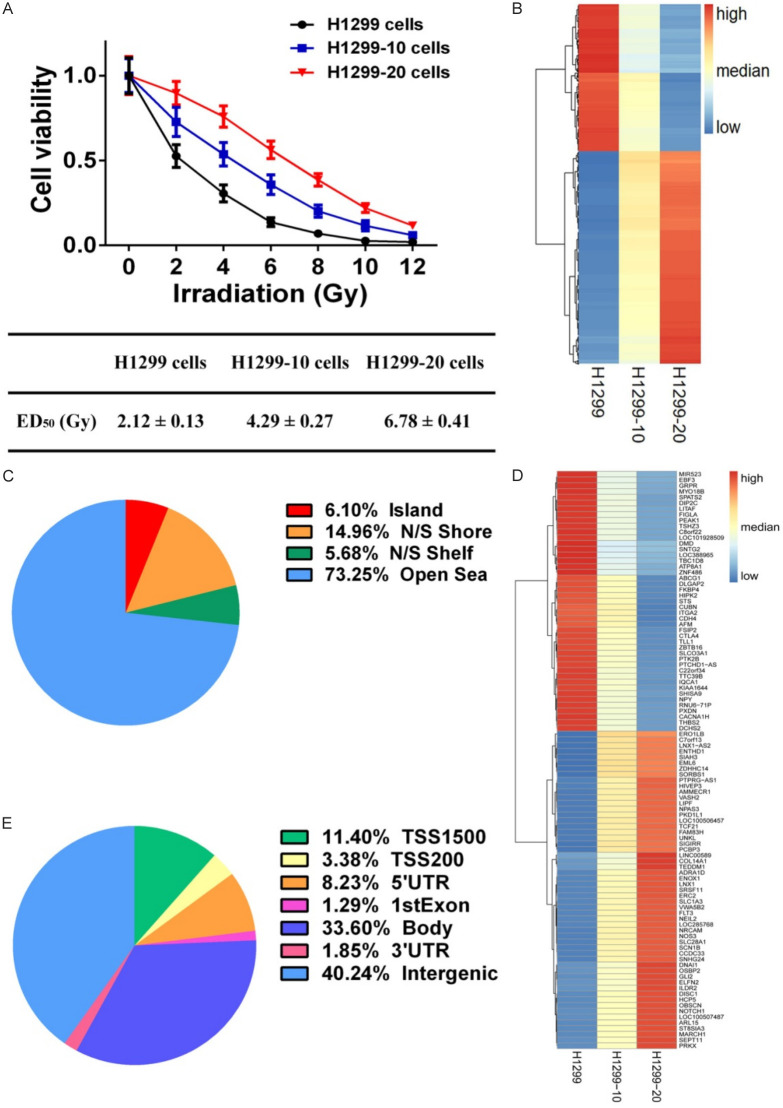
To evaluate the impact of radiation on cellular states, H1299 cells were subjected to 2 Gy of irradiation five times (total of 10 Gy, referred to as H1299-10 cells) and ten times (total of 20 Gy, referred to as H1299-20 cells) (Figure 1A). The irradiation response parameters for H1299, H1299-10, and H1299-20 cells were determined and expressed as ED50 (median effective dose) (Figure 1A). The ED50 values for H1299, H1299-10, and H1299-20 cells were 2.12 ± 0.13 Gy, 4.29 ± 0.27 Gy, and 6.78 ± 0.41 Gy, respectively, indicating the development of an irradiation-resistant phenotype and an increase in the degree of irradiation-resistance in H1299-10 and H1299-20 cells.
Figure 1.
Effects of irradiation on DNA methylation in NSCLC cells. A. Cell viability of H1299, H1299-10, and H1299-20 cells after different doses of irradiation treatment. B. Heatmap showing the differentially methylated probes (DMPs) among H1299, H1299-10, and H1299-20 cells. C. Neighborhood location of DMPs. D. Heatmap showing the 100 of 2259 differentially methylated genes (DMGs). E. Functional genomic distribution of DMPs.
We utilized a DNA methylation microarray to identify changes in DNA methylation induced by irradiation in H1299, H1299-10, and H1299-20 cells. To examine the DNA methylation profiles associated with increasing degree of irradiation-resistance, we established criteria for selecting differentially methylated probes (DMPs) based on an absolute difference of β-value (|Δβ|) ≥ 0.1 between H1299 and H1299-10 cells, and between H1299-10 and H1299-20 cells (Table S1). Among the 5735 DMPs induced by irradiation, 3391 DMPs exhibited a continuous increase in DNA methylation levels as the degree of irradiation-resistance increased, while 2344 DMPs showed a continuous decrease in DNA methylation levels with increasing irradiation-resistance (Figure 1B). The neighborhood locations of the 5735 DMPs is depicted in Figure 1C, with 6.1% of the DMPs located in CpG islands, 14.96% in shores (0-2 kb from the CpG islands), and 5.68% in shelves (2-4 kb from the CpG islands). Furthermore, a total of 2259 differentially methylated genes (DMGs) targeted by the 5735 DMPs were identified (Figure 1D), and the DMPs were found to be distributed differently in each region of the DMGs, with the promoter region (TSS1500, TSS200, 5’UTR, 1stExon) accounting for approximately 24.31% (Figure 1E).
Irradiation-induced DNA methylation changes upregulated HK1 in irradiation-resistant NSCLC cells
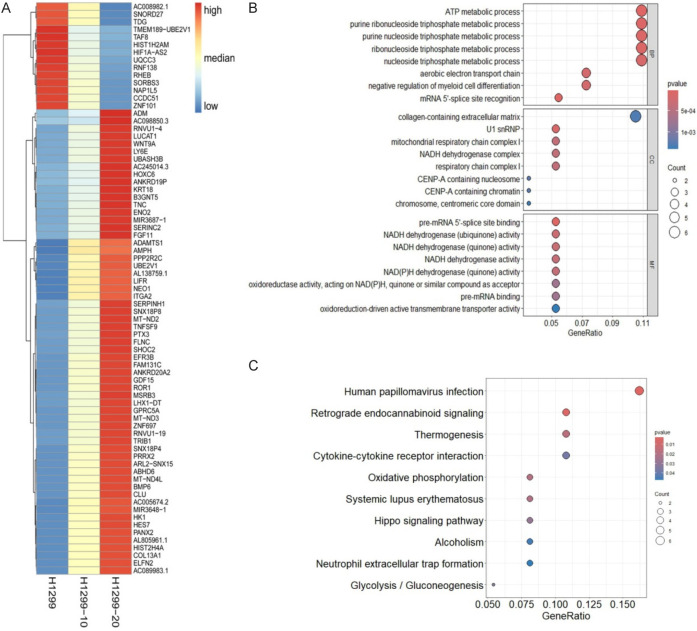
In order to investigate the potential impact of irradiation-induced DNA methylation changes on the transcriptional regulation of associated genes, transcriptomic sequencing was conducted to observe alterations in gene expression profiles in H1299, H1299-10, and H1299-20 cells. Differential gene expression analysis was performed using the criteria of an absolute log2fold-change ≥ 0.5 (P < 0.05) between H1299 and H1299-10 cells, and between H1299-10 and H1299-20 cells, to identify genes that exhibited varying expression levels with increasing degrees of irradiation-resistance (Table S2). Among the 75 differentially expressed genes (DEGs) regulated by irradiation, 61 DEGs showed a continuous increase in expression levels as the degree of irradiation-resistance increased, while 14 DEGs exhibited a continuous decrease in expression levels with increasing irradiation-resistance (Figure 2A). The top 8 Biological Process (BP), 8 Cellular Component (CC), and 8 Molecular Function (MF) terms from the Gene Ontology (GO) functional enrichment analysis of the 75 DEGs are presented in Figure 2B. Additionally, Kyoto Encyclopedia of Genes and Genomes (KEGG) pathway enrichment analysis revealed that these genes were closely associated with 10 significantly enriched pathways (P < 0.05) (Figure 2C).
Figure 2.
Effects of irradiation on gene expression in NSCLC cells. A. Heatmap showing the overview of differentially expressed genes (DEGs) among H1299, H1299-10, and H1299-20 cells. B. Significantly enriched GO terms in DEGs. C. Significantly enriched KEGG pathways in DEGs.
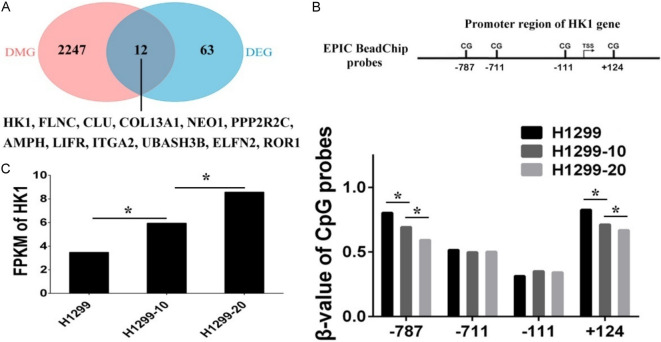
Subsequently, an integrated analysis of DNA methylation and gene expression profiles was conducted to investigate the transcriptional regulation of DEGs in response to irradiation-induced DNA methylation alterations. Here, we examined the overlap between DMGs and DEGs and identified a total of 12 DEGs that are associated with DMPs (Figure 3A). It is widely recognized that DNA methylation levels in the promoter region are inversely correlated with the expression of relevant genes. Among the 12 DEGs with associated DMPs, the HK1 gene exhibited a decrease in DNA methylation in its promoter region, leading to an increase in gene expression. The β-values of two CpG sites located at positions -787 and +124 around the HK1 promoter showed a consistent decrease with increasing levels of resistance to irradiation (Figure 3B). In contrast, the FPKM values of HK1 displayed a continuous increase with the degree of irradiation-resistance (Figure 3C). These findings indicate that reduced methylation of the HK1 promoter is associated with elevated expression levels of HK1.
Figure 3.
Integrated DNA methylation and gene expression analysis. A. Venn diagram showing the overlap between differentially methylated genes (DMG) and differentially expressed genes (DEG). B. The β-values of Illumina Methylation EPIC BeadChip probes mapping to the promoter regions of HK1 gene in H1299, H1299-10, and H1299-20 cells. C. The fragments per kilobase of exon per million reads mapped (FPKM) values of HK1 gene in H1299, H1299-10, and H1299-20 cells (*P < 0.05).
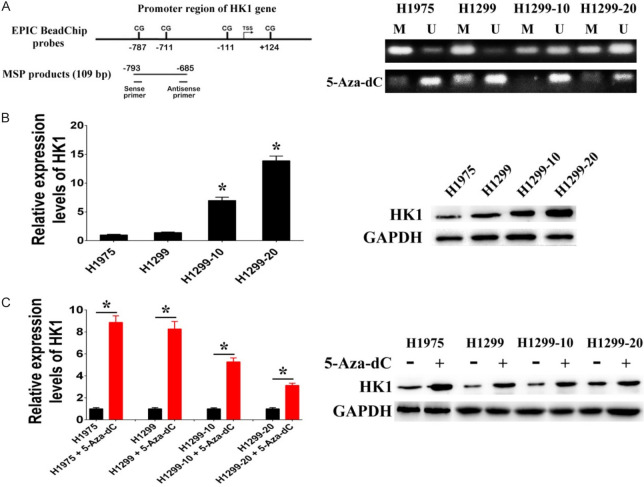
The study also confirmed the influence of DNA methylation on HK1 expression by examining the methylation status of the HK1 promoter. Initially, we assessed the methylation status of the HK1 promoter and the expression levels of HK1 in two irradiation-sensitive NSCLC cell lines (H1299 and H1975) and two irradiation-resistant NSCLC cell lines (H1299-10 and H1299-20). Methylation-specific PCR (MSP) analysis was conducted to determine the methylation status of two CpG sites (-787, +124) within the HK1 promoter region. The results revealed hypomethylation (methylation index < 0.5) of these CpG sites in H1299-10 and H1299-20 cells, while hypermethylation (methylation index ≥ 0.5) was observed in H1299 and H1975 cells (Figure 4A). Subsequently, western blotting and RT-PCR analyses demonstrated higher HK1 expression levels in H1299-10 and H1299-20 cells (hypomethylated) compared to H1299 and H1975 cells (hypermethylated) (Figure 4B). Treatment with the DNA methyltransferase inhibitor 5-aza-2’deoxycitidine (5-Aza-dC) to reduce HK1 promoter methylation levels resulted in upregulated HK1 expression in H1299 and H1975 cells (Figure 4A and 4C). These findings collectively suggest that hypomethylation of CpG sites within the HK1 promoter promotes HK1 expression, and alterations in DNA methylation induced by irradiation may represent a regulatory mechanism contributing to the activation of HK1 expression in irradiation-resistant NSCLC cells.
Figure 4.
HK1 expression regulated through DNA methylation. A. Representative methylation-specific PCR (MSP) data for the HK1 promoter region using the MSP primer pairs represented in the schematic. M, methylated allele; U, unmethylated allele. B. The mRNA and protein levels of HK1 in H1975, H1299, H1299-10, and H1299-20 cells. C. The mRNA and protein levels of HK1 after treatment with 5-aza-2’-deoxycytidine (5-Aza-dC) (*P < 0.05).
HK1 affects irradiation-resistance of NSCLC cells
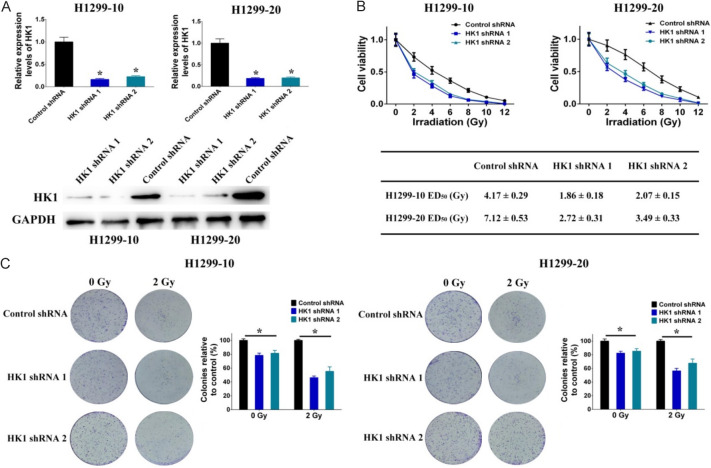
Based on the analysis and confirmation mentioned above, it was discovered that HK1 is upregulated through DNA methylation during the development of resistance to irradiation. This led to an investigation into how HK1 affects the irradiation-resistance of NSCLC cells. Initially, shRNAs were introduced into H1299-10 and H1299-20 cells to facilitate the knockdown of HK1 expression (Figure 5A). The investigation revealed that the knockdown of HK1 decreased irradiation-resistance in H1299-10 cells (the ED50 decreased from 4.17 ± 0.29 to 1.86 ± 0.18 Gy (shRNA 1) and 2.07 ± 0.15 Gy (shRNA2)) and H1299-20 cells (the ED50 decreased from 7.12 ± 0.53 to 2.72 ± 0.31 Gy (shRNA 1) and 3.49 ± 0.33 Gy (shRNA2)) (Figure 5B). Additionally, we assessed the ability of NSCLC cells with HK1 knockdown and control cells to form colonies after being exposed to 2 Gy of irradiation, compared to non-irradiated cells. The results showed a significant decrease in colony formation in irradiated cells compared to non-irradiated cells, and HK1 knockdown led to reduced colony formation in both non-irradiated and irradiated H1299-10 and H1299-20 cells (Figure 5C).
Figure 5.
Effects of HK1 on irradiation-resistance in NSCLC cells. A. The mRNA and protein levels of HK1 modulated through the use of shRNAs specifically designed to target HK1. B. Cell viability after different doses of irradiation treatment was decreased by HK1 shRNAs in H1299-10 and H1299-20 cells. C. Colony formation after different doses of irradiation treatment was decreased by HK1 shRNAs in H1299-10 and H1299-20 cells (*P < 0.05).
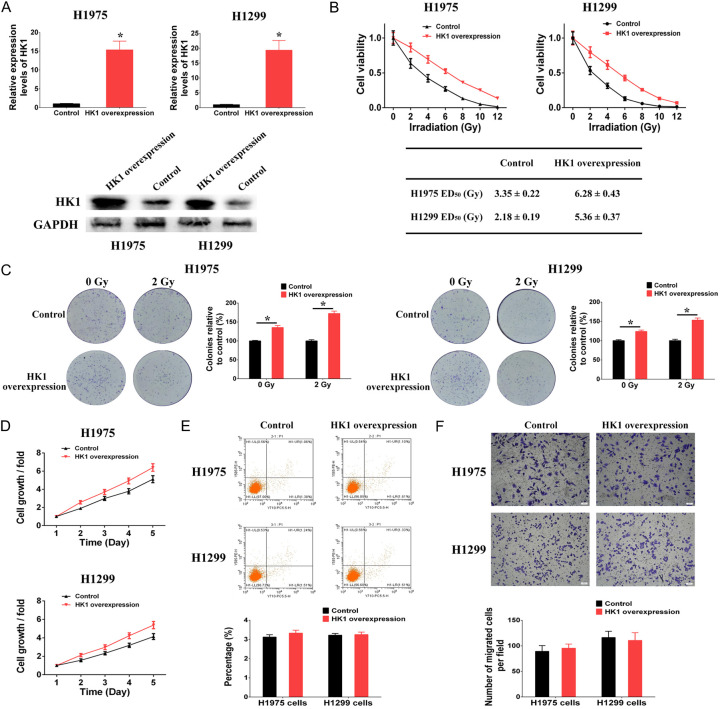
Subsequently, plasmids harboring an elevated level of HK1 were transfected into H1299 and H1975 cells to induce the overexpression of HK1 (Figure 6A). The outcomes revealed that the overexpression of HK1 in H1299 and H1975 cells led to enhanced resistance to irradiation, as evidenced by the ED50 values rising from 2.18 ± 0.19 to 5.36 ± 0.37 Gy in H1299 cells and from 3.35 ± 0.22 to 6.28 ± 0.43 Gy in H1975 cells (Figure 6B). Furthermore, the overexpression of HK1 resulted in elevated colony formation rates in both non-irradiated and irradiated H1299 and H1975 cells (depicted in Figure 6C). In addition, we examined the impact of HK1 on cell proliferation, apoptosis, and migration. The findings indicated that the overexpression of HK1 enhanced cell proliferation in H1299 and H1975 cells (Figure 6D). Conversely, the overexpression of HK1 did not influence apoptosis or migration in H1299 and H1975 cells (Figure 6E and 6F). While HK1 was associated with enhanced proliferative capacity in non-irradiated cells, our findings revealed a further reduction in colony formation of HK1 knockdown cells (Figure 5C) and an additional increase in colony formation of HK1 overexpression cells (Figure 6C) following irradiation, which was not attributable to proliferation changes in HK1 expression levels. Overall, the study suggests that abnormal DNA methylation induced by irradiation can regulate HK1 overexpression, which contributes to the development of irradiation-resistance in NSCLC cells.
Figure 6.
Effects of HK1 on irradiation-resistance in NSCLC cells. A. The mRNA and protein levels of HK1 modulated through the use of overexpression plasmids of HK1 gene. B. Cell viability after different doses of irradiation treatment was increased by HK1 overexpression in H1299 and H1975 cells. C. Colony formation after different doses of irradiation treatment was increased by HK1 overexpression in H1299 and H1975 cells. D. Cell proliferation was increased by HK1 overexpression in H1299 and H1975 cells. E. HK1 overexpression had no effect on cell apoptosis in H1299 and H1975 cells. F. HK1 overexpression had no effect on cell migration in H1299 and H1975 cells (*P < 0.05).
HK1 confers irradiation-resistance of NSCLC cells by promoting glycolysis
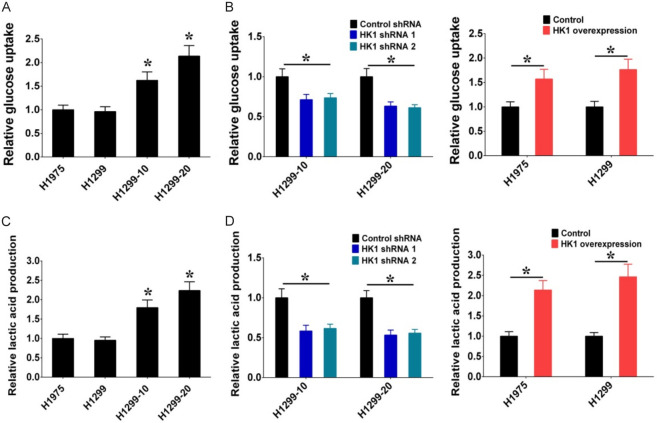
HK1 is an enzyme involved in glycolysis that facilitates the conversion of glucose to glucose-6-phosphate (G6P). We examined whether irradiation-induced HK1 could enhance glycolysis in radiation-resistant NSCLC cells, as it is responsible for the initial step of glycolysis. The outcomes depicted in Figure 7A illustrate a significant rise in glucose uptake in H1299-10 and H1299-20 cells (radiation-resistant) in contrast to H1299 and H1975 cells, aligning with the observation that HK1 expression levels were elevated in H1299-10 and H1299-20 cells compared to H1299 and H1975 cells. Furthermore, the knockdown of HK1 resulted in decreased glucose uptake in H1299-10 and H1299-20 cells, while the overexpression of HK1 led to increased glucose uptake in H1299 and H1975 cells (Figure 7B). Additionally, the assessment of glycolytic capacity was conducted by measuring the production of lactic acid, the primary product of glycolysis. The results indicated a heightened lactic acid production in H1299-10 and H1299-20 cells (radiation-resistant) in comparison to H1299 and H1975 cells (Figure 7C). Moreover, the knockdown of HK1 resulted in reduced lactic acid production in H1299-10 and H1299-20 cells, while the overexpression of HK1 induced lactic acid production in H1299 and H1975 cells (Figure 7D). These results indicate that HK1 contributes to promoting glycolysis in irradiation-resistant NSCLC cells.
Figure 7.
HK1 modulates irradiation-resistance through the regulation of glycolysis. A. Glucose uptake in H1975, H1299, H1299-10, and H1299-20 cells. B. Glucose uptake was decreased by HK1 shRNAs in H1299-10 and H1299-20 cells, and glucose uptake was increased by HK1 overexpression in H1975 and H1299 cells. C. Lactic acid production in H1975, H1299, H1299-10, and H1299-20 cells. D. Lactic acid production was decreased by HK1 shRNAs in H1299-10 and H1299-20 cells, and lactic acid production was increased by HK1 overexpression in H1975 and H1299 cells (*P < 0.05).
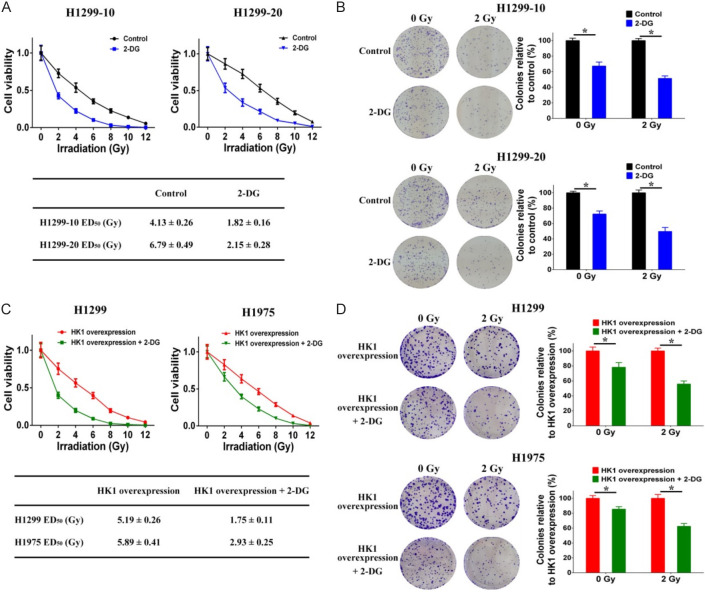
Next, we used the glycolysis inhibitor 2-deoxy-D-glucose (2-DG) to investigate the impact of glycolysis on resistance to irradiation. The findings showed that 2-DG treatment significantly reduced the resistance to irradiation in H1299-10 cells (the ED50 decreased from 4.13 ± 0.26 to 1.82 ± 0.16 Gy) and H1299-20 cells (the ED50 decreased from 6.79 ± 0.49 to 2.15 ± 0.28 Gy) (Figure 8A). Additionally, 2-DG treatment led to a decrease in the ability of both non-irradiated and irradiated H1299-10 and H1299-20 cells to form colonies (Figure 8B). Subsequently, we examined the impact of 2-DG on the irradiation resistance conferred by HK1 overexpression in H1299 and H1975 cell lines. The administration of 2-DG notably diminished both the irradiation resistance and the colony-forming capacity in HK1-overexpressing H1299 cells (the ED50 decreased from 5.19 ± 0.26 to 1.75 ± 0.11 Gy) and HK1-overexpressing H1975 cells (the ED50 decreased from 5.89 ± 0.41 to 2.93 ± 0.25 Gy) (Figure 8C and 8D). These results suggest that abnormal glycolytic metabolism plays a role in the resistance to radiation in NSCLC cells, and that HK1 contributes to irradiation-resistance through HK1-mediated regulation of glycolysis.
Figure 8.
HK1 modulates irradiation-resistance through the regulation of glycolysis. A. Cell viability after different doses of irradiation treatment was decreased by 2-DG treatment in H1299-10 and H1299-20 cells. B. Colony formation after different doses of irradiation treatment was decreased by 2-DG treatment in H1299-10 and H1299-20 cells. C. Cell viability after different doses of irradiation treatment was decreased by 2-DG treatment in HK1 overexpression H1299 and H1975 cells. D. Colony formation after different doses of irradiation treatment was decreased by 2-DG treatment in HK1 overexpression H1299 and H1975 cells (*P < 0.05).
Discussion
The primary obstacle in effectively treating NSCLC with radiotherapy is the development of resistance to irradiation. A comprehensive understanding of the underlying mechanisms responsible for this resistance is crucial for enhancing therapeutic approaches and ultimately improving survival rates.
An increasing number of studies have linked abnormal DNA methylation to cancer, including NSCLC [20]. Abnormal changes in DNA methylation, whether increases or decreases, play a role in cancer formation and tumor progression [21,22]. DNA methylation is widely recognized as a key regulator of gene expression, with hypermethylation and hypomethylation being major contributors to oncogenesis [23-25]. Furthermore, there is growing evidence that changes in DNA methylation frequently occur during radiotherapy and significantly impact the development of resistance to irradiation [26]. Therefore, analyzing methylation profiles could aid in the identification and treatment of radiotherapy resistance. This investigation primarily focuses on identifying the differentially expressed genes that are modulated by irradiation-induced DNA methylation changes in NSCLC cells. Among these genes, the HK1 gene exhibits reduced DNA methylation and increased gene expression in irradiation-resistant NSCLC cells compared to irradiation-sensitive NSCLC cells. Our findings also demonstrate that suppressing HK1 diminishes irradiation-resistance, while overexpressing HK1 enhances irradiation-resistance in NSCLC cells. Collectively, these results suggest that irradiation-induced alterations in DNA methylation may serve as a potential mechanism contributing to the epigenetic activation of HK1 and underscore the role of HK1 in the development of irradiation-resistance in NSCLC.
Research has shown that the atypical expression of HK1 plays a role in the progression of cancer by facilitating the growth and survival of cancer cells, and is considered an unfavorable prognostic factor [27-29]. HK1, an enzyme classified as a member of the Hexokinases family, is located on the outer membrane of mitochondria and is crucial in the catalytic process of glucose metabolism as the sole rate-limiting enzyme in glycolysis [30,31]. Glycolysis, the principal glucose metabolism pathway in cancer cells, provides many of the metabolic intermediates required for biosynthetic pathways, including ribose sugars, glycerol, citrate, nonessential amino acids, and NADPH [32,33]. In contrast to normal cells, cancer cells significantly increase their intake of glucose and glycolysis to generate higher levels of glycolytic metabolites and pyruvate, a phenomenon known as the Warburg effect [34]. By utilizing glycolysis, cancer cells transform glucose into pyruvic acid and then lactate in order to quickly generate energy and facilitate the progression of cancer [35,36]. Recent research has indicated that the abnormal glycolysis activity in cancer cells likely plays a role in regulating resistance to radiotherapy in malignant cancers [37-39]. Our study demonstrates that the upregulation of HK1 expression can enhance resistance to irradiation by sustaining high levels of glycolysis, suggesting that the HK1-mediated abnormal glycolysis activity may be a potential mechanism contributing to the irradiation-resistance of NSCLC cells.
In summary, the comprehensive examination of DNA methylation and gene expression patterns revealed significant DNA methylation-mediated control of transcription linked to resistance to irradiation. Specifically, the gene HK1 exhibited reduced DNA methylation and increased expression in irradiation-resistant NSCLC cells. Furthermore, our investigation established that HK1 played a role in promoting resistance to irradiation through the facilitation of glycolysis. Consequently, these results offer a fresh perspective on the molecular mechanisms underlying resistance to irradiation and present potential targets for the advancement of novel therapeutic approaches in the context of radiotherapy resistance.
Acknowledgements
The work was supported by Guangdong Basic and Applied Basic Research Foundation (2019A1515010680, 2022A1515012134) and Guangzhou Science and Technology Program (202102010043).
Disclosure of conflict of interest
None.
Table S1
Table S2
References
- 1.Siegel RL, Miller KD, Wagle NS, Jemal A. Cancer statistics, 2023. CA Cancer J Clin. 2023;73:17–48. doi: 10.3322/caac.21763. [DOI] [PubMed] [Google Scholar]
- 2.Wei W, Zeng H, Zheng R, Zhang S, An L, Chen R, Wang S, Sun K, Matsuda T, Bray F, He J. Cancer registration in China and its role in cancer prevention and control. Lancet Oncol. 2020;21:e342–e349. doi: 10.1016/S1470-2045(20)30073-5. [DOI] [PubMed] [Google Scholar]
- 3.Miller KD, Nogueira L, Devasia T, Mariotto AB, Yabroff KR, Jemal A, Kramer J, Siegel RL. Cancer treatment and survivorship statistics, 2022. CA Cancer J Clin. 2022;72:409–436. doi: 10.3322/caac.21731. [DOI] [PubMed] [Google Scholar]
- 4.Ganti AK, Klein AB, Cotarla I, Seal B, Chou E. Update of incidence, prevalence, survival, and initial treatment in patients with non-small cell lung cancer in the US. JAMA Oncol. 2021;7:1824–1832. doi: 10.1001/jamaoncol.2021.4932. [DOI] [PMC free article] [PubMed] [Google Scholar]
- 5.Wang M, Herbst RS, Boshoff C. Toward personalized treatment approaches for non-small-cell lung cancer. Nat Med. 2021;27:1345–1356. doi: 10.1038/s41591-021-01450-2. [DOI] [PubMed] [Google Scholar]
- 6.Dohopolski M, Gottumukkala S, Gomez D, Iyengar P. Radiation therapy in non-small-cell lung cancer. Cold Spring Harb Perspect Med. 2021;11:a037713. doi: 10.1101/cshperspect.a037713. [DOI] [PMC free article] [PubMed] [Google Scholar]
- 7.Vinod SK, Hau E. Radiotherapy treatment for lung cancer: current status and future directions. Respirology. 2020;25(Suppl 2):61–71. doi: 10.1111/resp.13870. [DOI] [PubMed] [Google Scholar]
- 8.Kang H, Kim B, Park J, Youn H, Youn B. The Warburg effect on radioresistance: survival beyond growth. Biochim Biophys Acta Rev Cancer. 2023;1878:188988. doi: 10.1016/j.bbcan.2023.188988. [DOI] [PubMed] [Google Scholar]
- 9.Wu Y, Song Y, Wang R, Wang T. Molecular mechanisms of tumor resistance to radiotherapy. Mol Cancer. 2023;22:96. doi: 10.1186/s12943-023-01801-2. [DOI] [PMC free article] [PubMed] [Google Scholar]
- 10.Olivares-Urbano MA, Griñán-Lisón C, Marchal JA, Núñez MI. CSC radioresistance: a therapeutic challenge to improve radiotherapy effectiveness in cancer. Cells. 2020;9:1651. doi: 10.3390/cells9071651. [DOI] [PMC free article] [PubMed] [Google Scholar]
- 11.Huang RX, Zhou PK. DNA damage response signaling pathways and targets for radiotherapy sensitization in cancer. Signal Transduct Target Ther. 2020;5:60. doi: 10.1038/s41392-020-0150-x. [DOI] [PMC free article] [PubMed] [Google Scholar]
- 12.Miousse IR, Kutanzi KR, Koturbash I. Effects of ionizing radiation on DNA methylation: from experimental biology to clinical applications. Int J Radiat Biol. 2017;93:457–469. doi: 10.1080/09553002.2017.1287454. [DOI] [PMC free article] [PubMed] [Google Scholar]
- 13.Sutton LP, Jeffreys SA, Phillips JL, Taberlay PC, Holloway AF, Ambrose M, Joo JE, Young A, Berry R, Skala M, Brettingham-Moore KH. DNA methylation changes following DNA damage in prostate cancer cells. Epigenetics. 2019;14:989–1002. doi: 10.1080/15592294.2019.1629231. [DOI] [PMC free article] [PubMed] [Google Scholar]
- 14.Cabrera-Licona A, Pérez-Añorve IX, Flores-Fortis M, Moral-Hernández OD, González-de la Rosa CH, Suárez-Sánchez R, Chávez-Saldaña M, Aréchaga-Ocampo E. Deciphering the epigenetic network in cancer radioresistance. Radiother Oncol. 2021;159:48–59. doi: 10.1016/j.radonc.2021.03.012. [DOI] [PubMed] [Google Scholar]
- 15.Zhu X, Wang Y, Tan L, Fu X. The pivotal role of DNA methylation in the radio-sensitivity of tumor radiotherapy. Cancer Med. 2018;7:3812–3819. doi: 10.1002/cam4.1614. [DOI] [PMC free article] [PubMed] [Google Scholar]
- 16.Danielsson A, Barreau K, Kling T, Tisell M, Carén H. Accumulation of DNA methylation alterations in paediatric glioma stem cells following fractionated dose irradiation. Clin Epigenetics. 2020;12:26. doi: 10.1186/s13148-020-0817-8. [DOI] [PMC free article] [PubMed] [Google Scholar]
- 17.Jiao X, Zhang S, Jiao J, Zhang T, Qu W, Muloye GM, Kong B, Zhang Q, Cui B. Promoter methylation of SEPT9 as a potential biomarker for early detection of cervical cancer and its overexpression predicts radioresistance. Clin Epigenetics. 2019;11:120. doi: 10.1186/s13148-019-0719-9. [DOI] [PMC free article] [PubMed] [Google Scholar]
- 18.Wen R, Zhou L, Jiang S, Fan H, Zheng K, Yu Y, Gao X, Hao L, Lou Z, Yu G, Yang F, Zhang W. DSTN hypomethylation promotes radiotherapy resistance of rectal cancer by activating the Wnt/β-Catenin signaling pathway. Int J Radiat Oncol Biol Phys. 2023;117:198–210. doi: 10.1016/j.ijrobp.2023.03.067. [DOI] [PubMed] [Google Scholar]
- 19.Li LC, Dahiya R. MethPrimer: designing primers for methylation PCRs. Bioinformatics. 2002;18:1427–1431. doi: 10.1093/bioinformatics/18.11.1427. [DOI] [PubMed] [Google Scholar]
- 20.Papanicolau-Sengos A, Aldape K. DNA methylation profiling: an emerging paradigm for cancer diagnosis. Annu Rev Pathol. 2022;17:295–321. doi: 10.1146/annurev-pathol-042220-022304. [DOI] [PubMed] [Google Scholar]
- 21.Kim M, Delgado E, Ko S. DNA methylation in cell plasticity and malignant transformation in liver diseases. Pharmacol Ther. 2023;241:108334. doi: 10.1016/j.pharmthera.2022.108334. [DOI] [PMC free article] [PubMed] [Google Scholar]
- 22.Sina AA, Carrascosa LG, Trau M. DNA methylation-based point-of-care cancer detection: challenges and possibilities. Trends Mol Med. 2019;25:955–966. doi: 10.1016/j.molmed.2019.05.014. [DOI] [PubMed] [Google Scholar]
- 23.Preissl S, Gaulton KJ, Ren B. Characterizing cis-regulatory elements using single-cell epigenomics. Nat Rev Genet. 2023;24:21–43. doi: 10.1038/s41576-022-00509-1. [DOI] [PMC free article] [PubMed] [Google Scholar]
- 24.Yousefi PD, Suderman M, Langdon R, Whitehurst O, Davey Smith G, Relton CL. DNA methylation-based predictors of health: applications and statistical considerations. Nat Rev Genet. 2022;23:369–383. doi: 10.1038/s41576-022-00465-w. [DOI] [PubMed] [Google Scholar]
- 25.Koch A, Joosten SC, Feng Z, de Ruijter TC, Draht MX, Melotte V, Smits KM, Veeck J, Herman JG, Van Neste L, Van Criekinge W, De Meyer T, van Engeland M. Analysis of DNA methylation in cancer: location revisited. Nat Rev Clin Oncol. 2018;15:459–466. doi: 10.1038/s41571-018-0004-4. [DOI] [PubMed] [Google Scholar]
- 26.Chi HC, Tsai CY, Tsai MM, Lin KH. Impact of DNA and RNA methylation on radiobiology and cancer progression. Int J Mol Sci. 2018;19:555. doi: 10.3390/ijms19020555. [DOI] [PMC free article] [PubMed] [Google Scholar]
- 27.Chen QT, Zhang ZY, Huang QL, Chen HZ, Hong WB, Lin T, Zhao WX, Wang XM, Ju CY, Wu LZ, Huang YY, Hou PP, Wang WJ, Zhou D, Deng X, Wu Q. HK1 from hepatic stellate cell-derived extracellular vesicles promotes progression of hepatocellular carcinoma. Nat Metab. 2022;4:1306–1321. doi: 10.1038/s42255-022-00642-5. [DOI] [PMC free article] [PubMed] [Google Scholar]
- 28.Xu S, Herschman HR. A tumor agnostic therapeutic strategy for hexokinase 1-null/hexokinase 2-positive cancers. Cancer Res. 2019;79:5907–5914. doi: 10.1158/0008-5472.CAN-19-1789. [DOI] [PubMed] [Google Scholar]
- 29.Yang M, Cai W, Lin Z, Tuohuti A, Chen X. Intermittent hypoxia promotes TAM-induced glycolysis in laryngeal cancer cells via regulation of HK1 expression through activation of ZBTB10. Int J Mol Sci. 2023;24:14808. doi: 10.3390/ijms241914808. [DOI] [PMC free article] [PubMed] [Google Scholar]
- 30.Heneberg P. Redox regulation of hexokinases. Antioxid Redox Signal. 2019;30:415–442. doi: 10.1089/ars.2017.7255. [DOI] [PubMed] [Google Scholar]
- 31.Rodríguez-Saavedra C, Morgado-Martínez LE, Burgos-Palacios A, King-Díaz B, López-Coria M, Sánchez-Nieto S. Moonlighting proteins: the case of the hexokinases. Front Mol Biosci. 2021;8:701975. doi: 10.3389/fmolb.2021.701975. [DOI] [PMC free article] [PubMed] [Google Scholar]
- 32.Farooq Z, Ismail H, Bhat SA, Layden BT, Khan MW. Aiding cancer’s “sweet tooth”: role of hexokinases in metabolic reprogramming. Life (Basel) 2023;13:946. doi: 10.3390/life13040946. [DOI] [PMC free article] [PubMed] [Google Scholar]
- 33.Ciscato F, Ferrone L, Masgras I, Laquatra C, Rasola A. Hexokinase 2 in cancer: a prima donna playing multiple characters. Int J Mol Sci. 2021;22:4716. doi: 10.3390/ijms22094716. [DOI] [PMC free article] [PubMed] [Google Scholar]
- 34.Icard P, Shulman S, Farhat D, Steyaert JM, Alifano M, Lincet H. How the Warburg effect supports aggressiveness and drug resistance of cancer cells? Drug Resist Updat. 2018;38:1–11. doi: 10.1016/j.drup.2018.03.001. [DOI] [PubMed] [Google Scholar]
- 35.Abbaszadeh Z, Çeşmeli S, Biray Avcı Ç. Crucial players in glycolysis: cancer progress. Gene. 2020;726:144158. doi: 10.1016/j.gene.2019.144158. [DOI] [PubMed] [Google Scholar]
- 36.Abdel-Wahab AF, Mahmoud W, Al-Harizy RM. Targeting glucose metabolism to suppress cancer progression: prospective of anti-glycolytic cancer therapy. Pharmacol Res. 2019;150:104511. doi: 10.1016/j.phrs.2019.104511. [DOI] [PubMed] [Google Scholar]
- 37.Liu LX, Heng JH, Deng DX, Zhao H, Zheng ZY, Liao LD, Lin W, Xu XE, Li EM, Xu LY. Sulconazole induces PANoptosis by triggering oxidative stress and inhibiting glycolysis to increase radiosensitivity in esophageal cancer. Mol Cell Proteomics. 2023;22:100551. doi: 10.1016/j.mcpro.2023.100551. [DOI] [PMC free article] [PubMed] [Google Scholar]
- 38.Zhang H, Zhang K, Qiu L, Yue J, Jiang H, Deng Q, Zhou R, Yin Z, Ma S, Ke Y. Cancer-associated fibroblasts facilitate DNA damage repair by promoting the glycolysis in non-small cell lung cancer. Biochim Biophys Acta Mol Basis Dis. 2023;1869:166670. doi: 10.1016/j.bbadis.2023.166670. [DOI] [PubMed] [Google Scholar]
- 39.Leimgruber A, Hickson K, Lee ST, Gan HK, Cher LM, Sachinidis JI, O’Keefe GJ, Scott AM. Spatial and quantitative mapping of glycolysis and hypoxia in glioblastoma as a predictor of radiotherapy response and sites of relapse. Eur J Nucl Med Mol Imaging. 2020;47:1476–1485. doi: 10.1007/s00259-020-04706-0. [DOI] [PubMed] [Google Scholar]
Associated Data
This section collects any data citations, data availability statements, or supplementary materials included in this article.


