Abstract
Total lung volume (TLV) at full inspiration is a parameter of significant interest in pulmonary physiology but requires computed tomography (CT) scanning of the full axial extent of the lung. There is a growing interest to infer TLV from cardiac CT scans, which are much more widely available in epidemiologic studies. In this study, we present an original approach to train a multi-view convolutional neural network (CNN) model to infer TLV from cardiac CT scans, which visualize about 2/3rd of the lung volume. Supervised learning is used, exploiting paired full-lung and cardiac CT scans in the Multi-Ethnic Study of Atherosclerosis (MESA). Our results show that our network outperforms existing regression models for TLV estimation, and achieves accuracy and reproducibility comparable to the scan-rescan reproducibility of TLV on full-lung CT.
Keywords: Lung volume, computed tomography, CNN
1. INTRODUCTION
Total lung capacity (TLC), defined as lung volume at full inspiration, is associated with chronic obstructive pulmonary disease (COPD) risk [1], disease severity [2], respiratory mortality [3-6]. TLC is usually measured by body plethysmography or tracer gas dilution in the pulmonary function laboratory, but accessibility compared with computed tomography (CT) is limited. Alternatively, total lung volume (TLV) can be measured on inspiratory full-lung computed tomography (CT) [7, 8]. TLV differs slightly from TLC due to technical factors [9, 10] but is highly correlated with TLC and informative of pathophysiology. Sample sizes for reference equations for TLV are already larger than most for TLC [11]; further, TLV is a critical component of CT-assessment of dysanapsis, defined as the ratio of airway caliber to TLV, which is the strongest known predictor of COPD [1] and is implicated in risk for and sequelae of respiratory infections, including potentially severe COVID-19 and post-acute sequelae of COVID-19 (PASC).
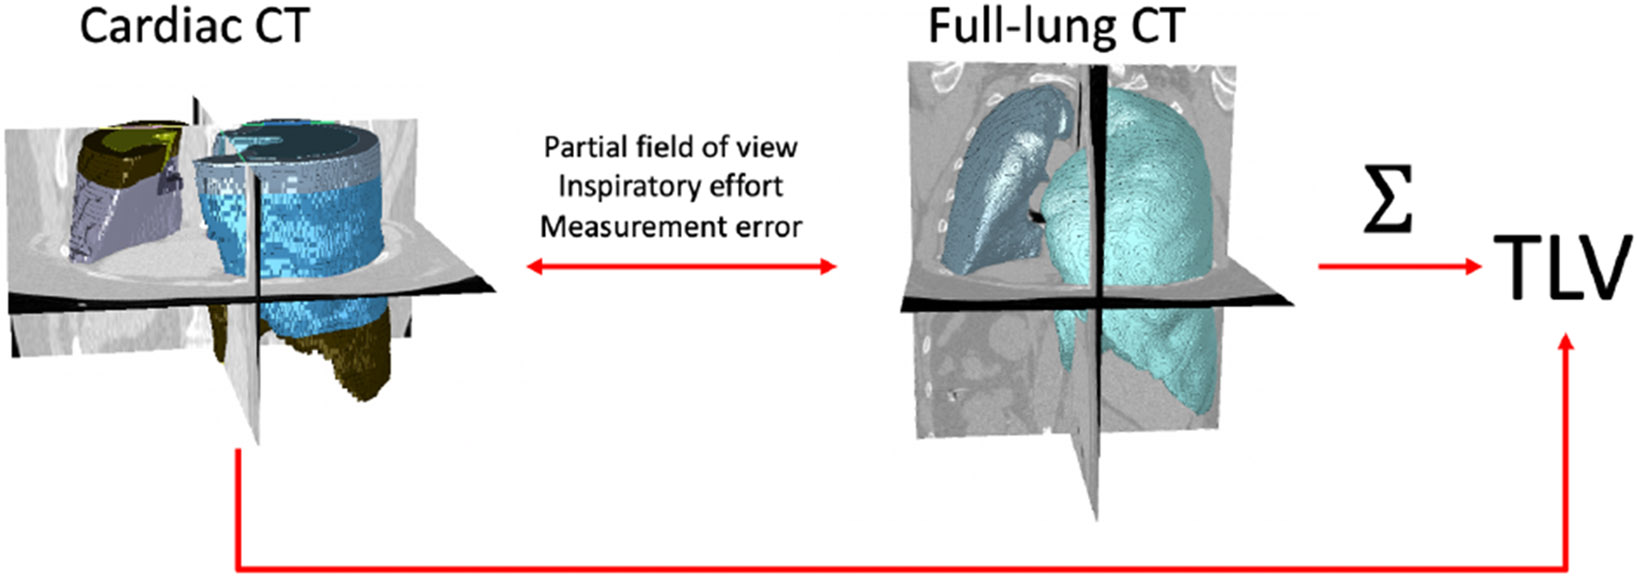
The Collaborative Cohort of Cohorts COVID-19 Study (C4R) has ascertained COVID-19 and PASC risk in 14 NIH-funded cohort studies comprising 53,143 participants [12]. The C4R CT study is measuring TLV and dysanapsis on CT scans acquired in 10 of these cohorts, comprising 12,459 full-lung CT scans and 13,752 cardiac scans with all but one cohort, the Multi-Ethnic Study of Atherosclerosis (MESA) [13], acquiring either full-lung or cardiac CT scans. In contrast to full-lung CT, cardiac CT scans are cropped to the pulmonary trunk superiorly and the cardiac apex interiorly, and include roughly 2/3 of the lung volume (Fig. 1) [14]. An accurate and reliable measure of TLV from cardiac CT scans would therefore approximately double the sample size for C4R CT investigations.
Figure 1.

3-D rendering of cardiac (left) and full-lung (right) CT scans for a representative MESA Exam 5 participant, with lung segmentations. Total lung volume (TLV) is calculated by summation over the lung mask on the full-lung scan.
While rough estimates of TLV have been demonstrated by least-squares regression of cardiac-CT-imaged lung volume against TLV with or without demographic covariates [14], this correlation is limited by scan-rescan variability in TLV [15], variation between cardiac and full-lung imaging protocols, and the unknown volume outside the cardiac field of view. A more accurate estimate of TLV from cardiac CT would be highly preferred; moreover, recent reports have shown that deep-learning models can effectively estimate TLV from chest radiographs [16], which is a simplified version of our use case where the full lung fields are visible. We therefore hypothesized that a deep-learned model for TLV estimation which uses the geometry of the imaged lung and anatomic cues from the cardiac scan will significantly outperform regression on the volume observed.
To that end, in this work we use the full-lung and cardiac CT scans acquired at the same imaging session in MESA Exam 5 to design and validate a multi-view CNN model for inferring TLV from lung silhouettes derived from cardiac scans. We additionally demonstrate the reproducibility of our TLV estimate on paired cardiac CT scans, and compare the performance of our model to both existing regression-based inference, and compare it to previously published reports TLV reproducibility on repeated full-lung inspiratory CT.
2. MATERIALS AND METHODS
2.1. Input data and pre-processing
MESA is a longitudinal, multicenter, population-based study that recruited 6,814 adults at six clinical centers ages 45-84 and free of clinical cardiovascular disease in 2000-2002. At Exams 1 (2000-2002) and 5 (2010-2012), cardiac computed tomography was acquired for all consenting study participants; two cardiac CT scans were acquired at the same scanning session at Exam 1. The MESA Lung Study acquired full-lung inspiratory CT in Exam 5 with isotropic in-plane resolution between [0.4668, 0.9810] mm, slice spacing of 0.5mm and slice thickness 0.625 or 0.75 mm. Cardiac CT scans were acquired with in-plane resolution between [0.5469, 0.7813] mm, and slice spacing 2.4 mm, 2.5 mm or 3.0 mm, equal to slice thickness, from the carina to the cardiac apex. Lung segmentation was performed for full-lung scans by VIDA Diagnostics, Inc. (Coralville, IA, USA).
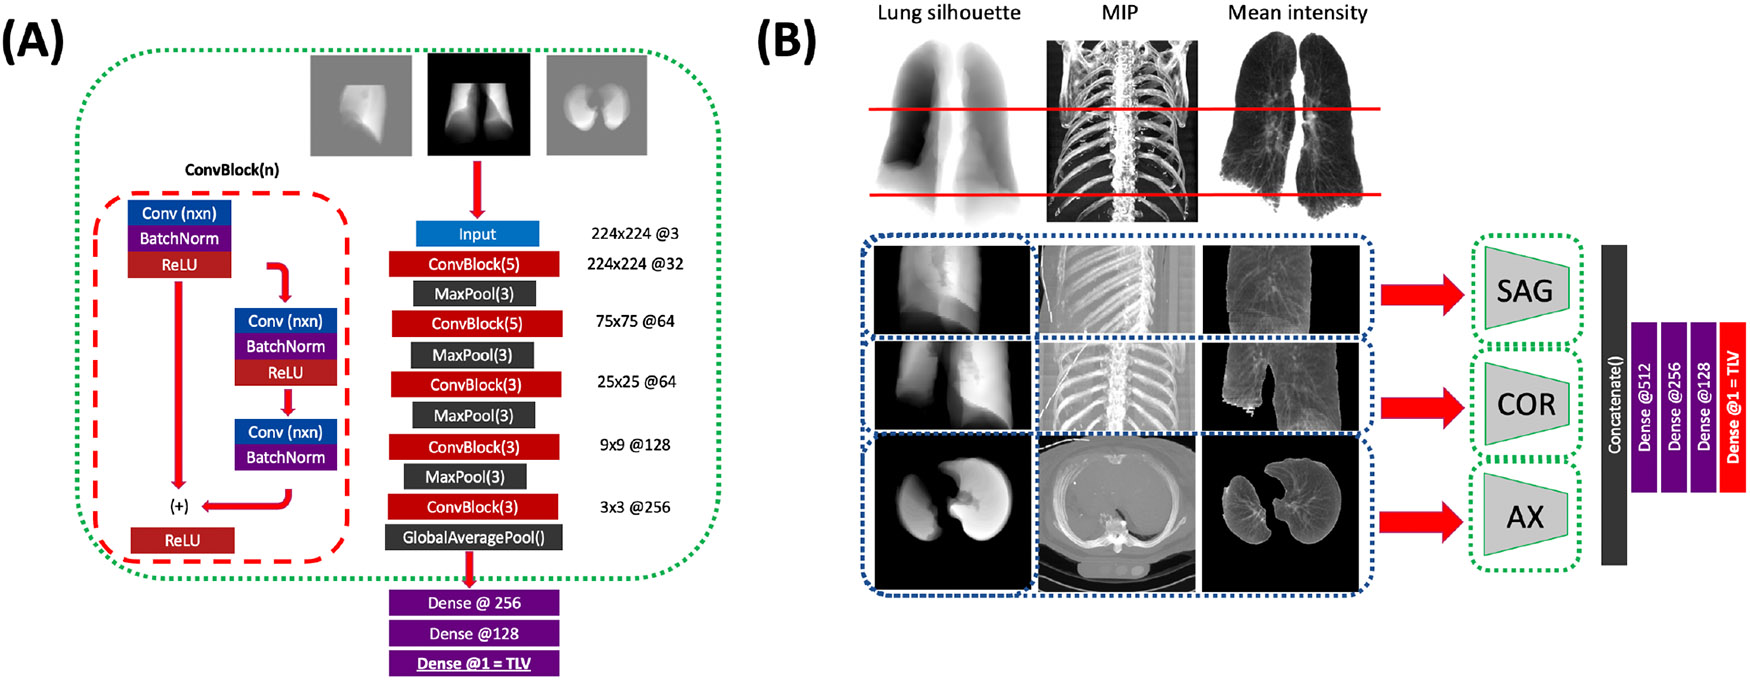
Available participants who had both cardiac and full-lung CT performed at Exam 5 (n=2,182), were allotted to training, validation, and test sets in a 3:1:1 split with stratification by study site and quintile of TLV. Each CT volume and lung mask were padded to the maximum physical dimensions observed in MESA Exam 5, then downsampled to an array size of 224x224x224 voxels. Hounsfield intensities were clipped to +/−1024 HU and rescaled linearly to [−1,1]. Training examples were augmented by translation and left-right flipping with probability 0.5. From the resulting volumes, a three-channel input image of size 224x224x3 was obtained for the axial, coronal and sagittal planes, consisting of separate channels containing (1) the binary lung mask sum, (2) the maximum intensity projection, and (3) the mean intensity over the lung fields (Fig. 2B). All available paired cardiac CT scans from MESA Exam 1 (n = 6,077) were pre-processed in a similar fashion.
Figure 2: Schematic of our multi-view CNN model.

(A) for each imaging plane, a separate CNN composed of alternating residual and max-pooling blocks is trained to estimate TLV from the single view. (B) The three planar CNNs are frozen (green dashes), and their bottleneck outputs are concatenated and passed to dense layers to generate the final TLV estimate. Models are trained on either the lung silhouette alone (input, left column) or on the lung silhouette, MIP (center), and lung mean intensity (right).
To compare cardiac and full-lung acquisitions, we aligned the image volumes along the superior-inferior axis using a previously described approach [17], cropped the full-lung scans to the cardiac field of view (Fig. 1), and calculated the cardiac-FOV lung volume on cropped full-lung scans.
2.2. Model architecture and training
A multi-view CNN model was trained in two stages (Fig. 2): (1) training convolutional feature extractors to independently estimate TLV in axial, sagittal, and coronal views, and (2) training a dense neural network to provide the final TLV estimate from the concatenated latent feature representations. The first stage (Fig. 2A) consists of residual convolutional blocks followed by max-pool downsampling. The convolutional section was followed by a global max-pooling operation and three fully-connected layers, and was trained to estimate TLV in liters. In the second stage (Fig. 2B), the weights of the convolutional layers were frozen, and the output of the global max-pooling layers in each view were concatenated and passed to four fully-connected layers again trained to estimate TLV. All components were trained using mean squared error loss function, ADAM optimizer and L2 regularization, and training for up to 200 epochs with early stopping conditioned on validation mean squared error. Learning rate and L2-weight were jointly optimized on the validation set by random search of 20 iterations for each single-view CNN and 30 iterations for the multi-view. Network depth and breadth were empirically tuned to optimize test-set performance.
2.3. Statistical analysis
Model performance is summarized by the mean and standard deviation of the residuals on the test set, as well as R2 between predicted and ground-truth TLV. We used Bland-Altman analysis to evaluate accuracy, and linear regression to quantify the association between percentage of the lung fields visible, volume discrepancy between cardiac and full-lung imaging, and TLV prediction error. Test-set residual mean/SD and correlation of the model was compared to linear regression of TLV against (1) cardiac lung mask volume and (2) cropped full-lung mask volume.
3. RESULTS
The test-set residual mean/standard deviation and Pearson correlation are presented in Table 1, for each component of our model, taking either the lung silhouette alone or all three channels as input. Relative performance of all models is determined by the residual standard deviation and Pearson correlation.
Table 1:
Test-set performance of our convolutional models in the axial, coronal, and sagittal planes, as well as the final multi-view output. Mean/standard deviation (SD) of residuals in mL, and R2 are reported.
| Model | Axial | Coronal | Sagittal | Multi-View | ||||
|---|---|---|---|---|---|---|---|---|
| Mean/SD | R2 | Mean/SD | R2 | Mean/SD | R2 | Mean/SD | R2 | |
| Silhouette alone | −34+/−562 | 0.803 | 2+/−543 | 0.816 | 6+/−523 | 0.830 | −26+/− 515 | 0.834 |
| Silhouette, MIP, mean | −29+/−530 | 0.830 | 65+/−538 | 0.826 | −10+/−522 | 0.829 | 0 +/− 486 | 0.855 |
In both the three-channel and silhouette-only models, the volume estimate derived from the multi-view network outperforms that of the axial, coronal, or sagittal views alone. Inclusion of anatomic context through the maximum-intensity and mean-intensity projections led to an appreciable performance improvement for the multi-view-CNN TLV estimate. Test-set residual standard deviation and R2 reached 0 +/− 486 mL and 0.855, respectively, for the best-performing model, outperforming correlation between cardiac and full-lung volumes in MESA Exam 5 (residual SD 656 mL, R2 = 0.689) and comparing favorably to literature reports on the reproducibility of TLV measured by repeated full-lung CT (Table 2).
Table 2:
Residual mean/SD and R2 for volumes computed in MESA Exam 5, and literature reference values for TLV reproducibility. “CAC” = cardiac scan; “FL” = “full-lung”.
| Comparison | Residual mean/ SD (mL) |
R2 |
|---|---|---|
| CAC vs. TLV, regression | 0 +/− 656 | 0.689 |
| Cropped FL vs. TLV, regression | 0 +/− 304 | 0.935 |
| CAC-estimated vs. ground-truth TLV | 0 +/− 486 | 0.855 |
| CAC vs. cropped FL volume, observed | −228 +/− 473 | 0.715 |
| TLV reproducibility, reported [18] | −10 +/− 440 | 0.818 |
We observe that volumes derived from the cropped full-lung scans are on average larger by 228 mL than those measured on cardiac scans, suggestive of a systematic difference in inspiratory effort between the cardiac and full-lung acquisitions. Among full-lung scans, correlation between TLV and the cropped volume was notably higher. The proportion of TLV outside of the cardiac field of view, as assessed on the full-lung scan, was not significantly associated with prediction error of our model (R2 = 0.008, p = 0.074). However, percent emphysema assessed by hidden Markov measure field segmentation [18] on the full-lung imaging significantly affected prediction error (−243+/−479 mL vs. 44+/−474 mL for cases above and below 5 percent emphysema, respectively, p < 10−5).
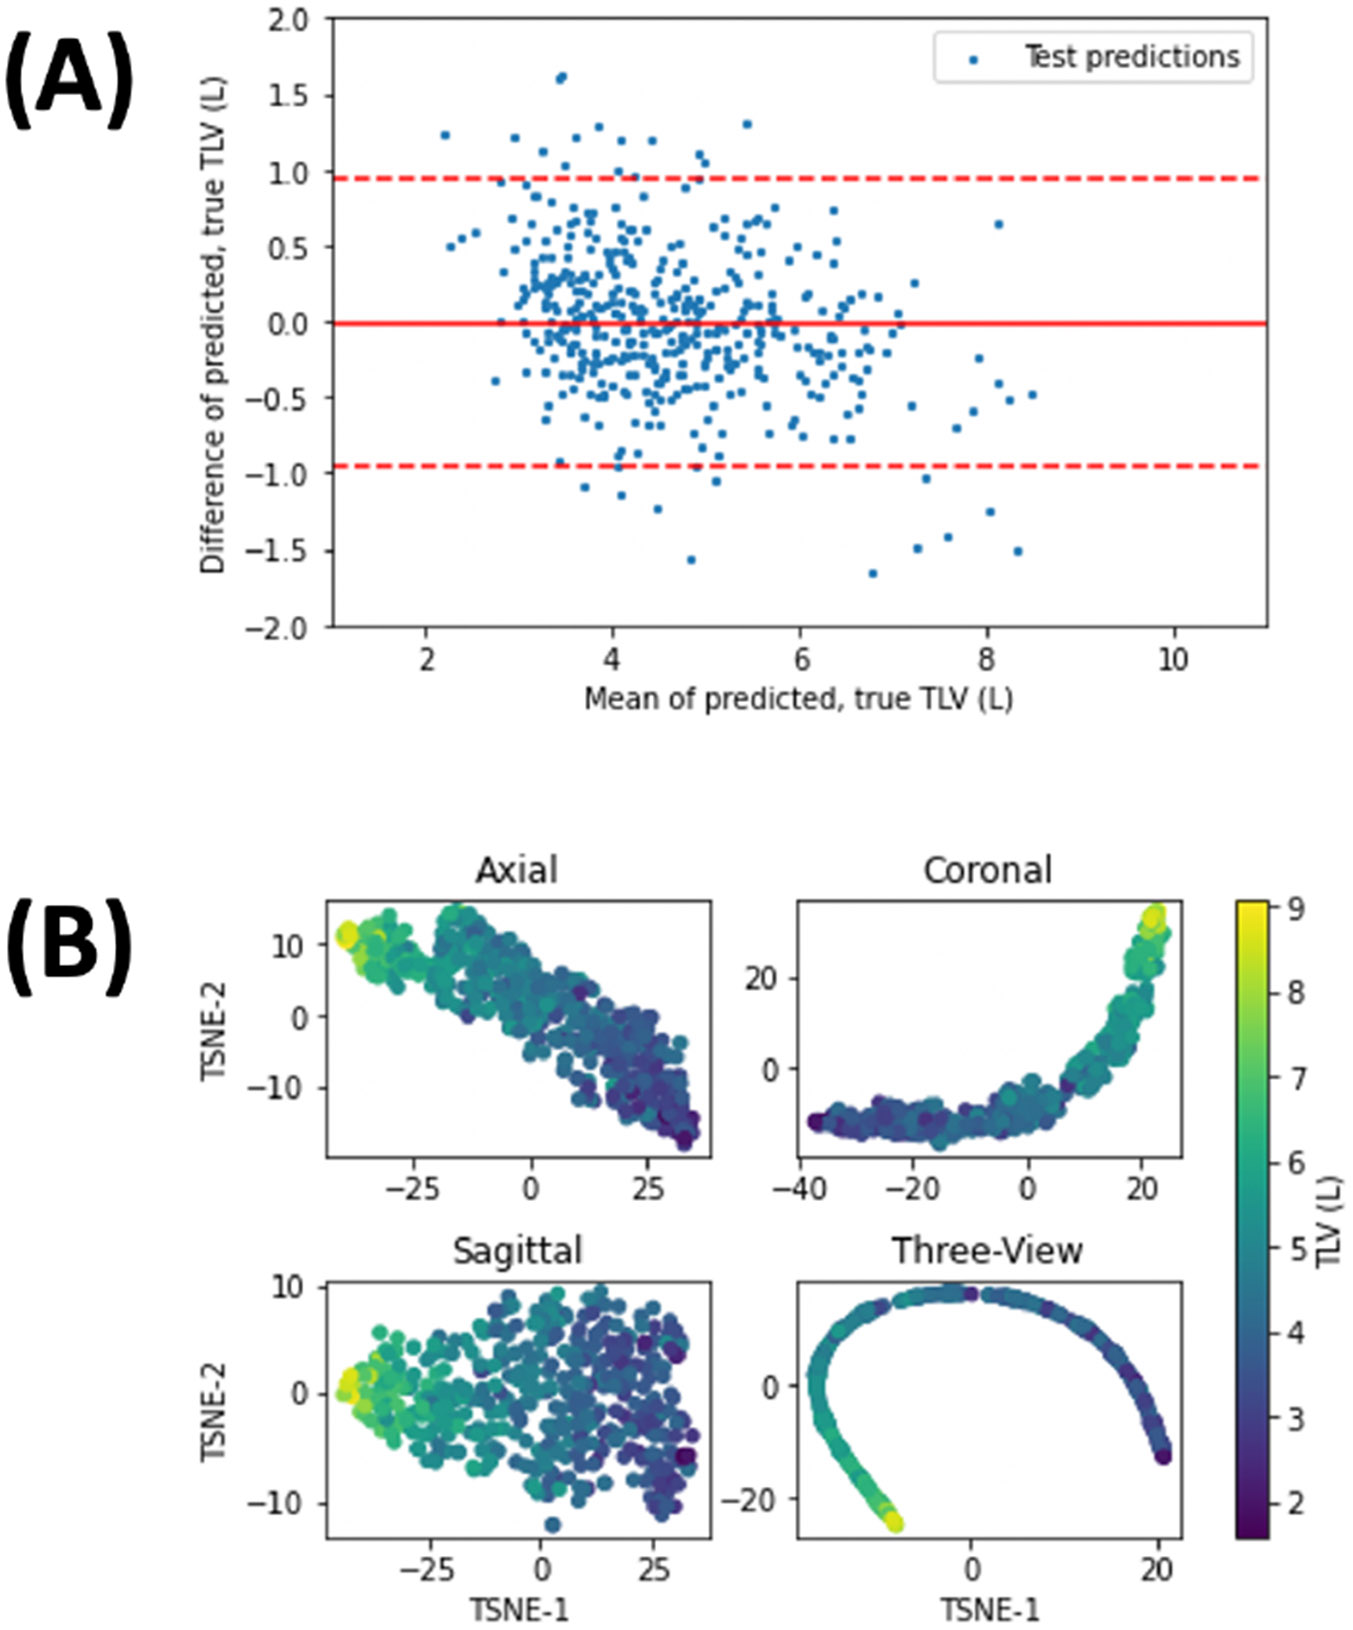
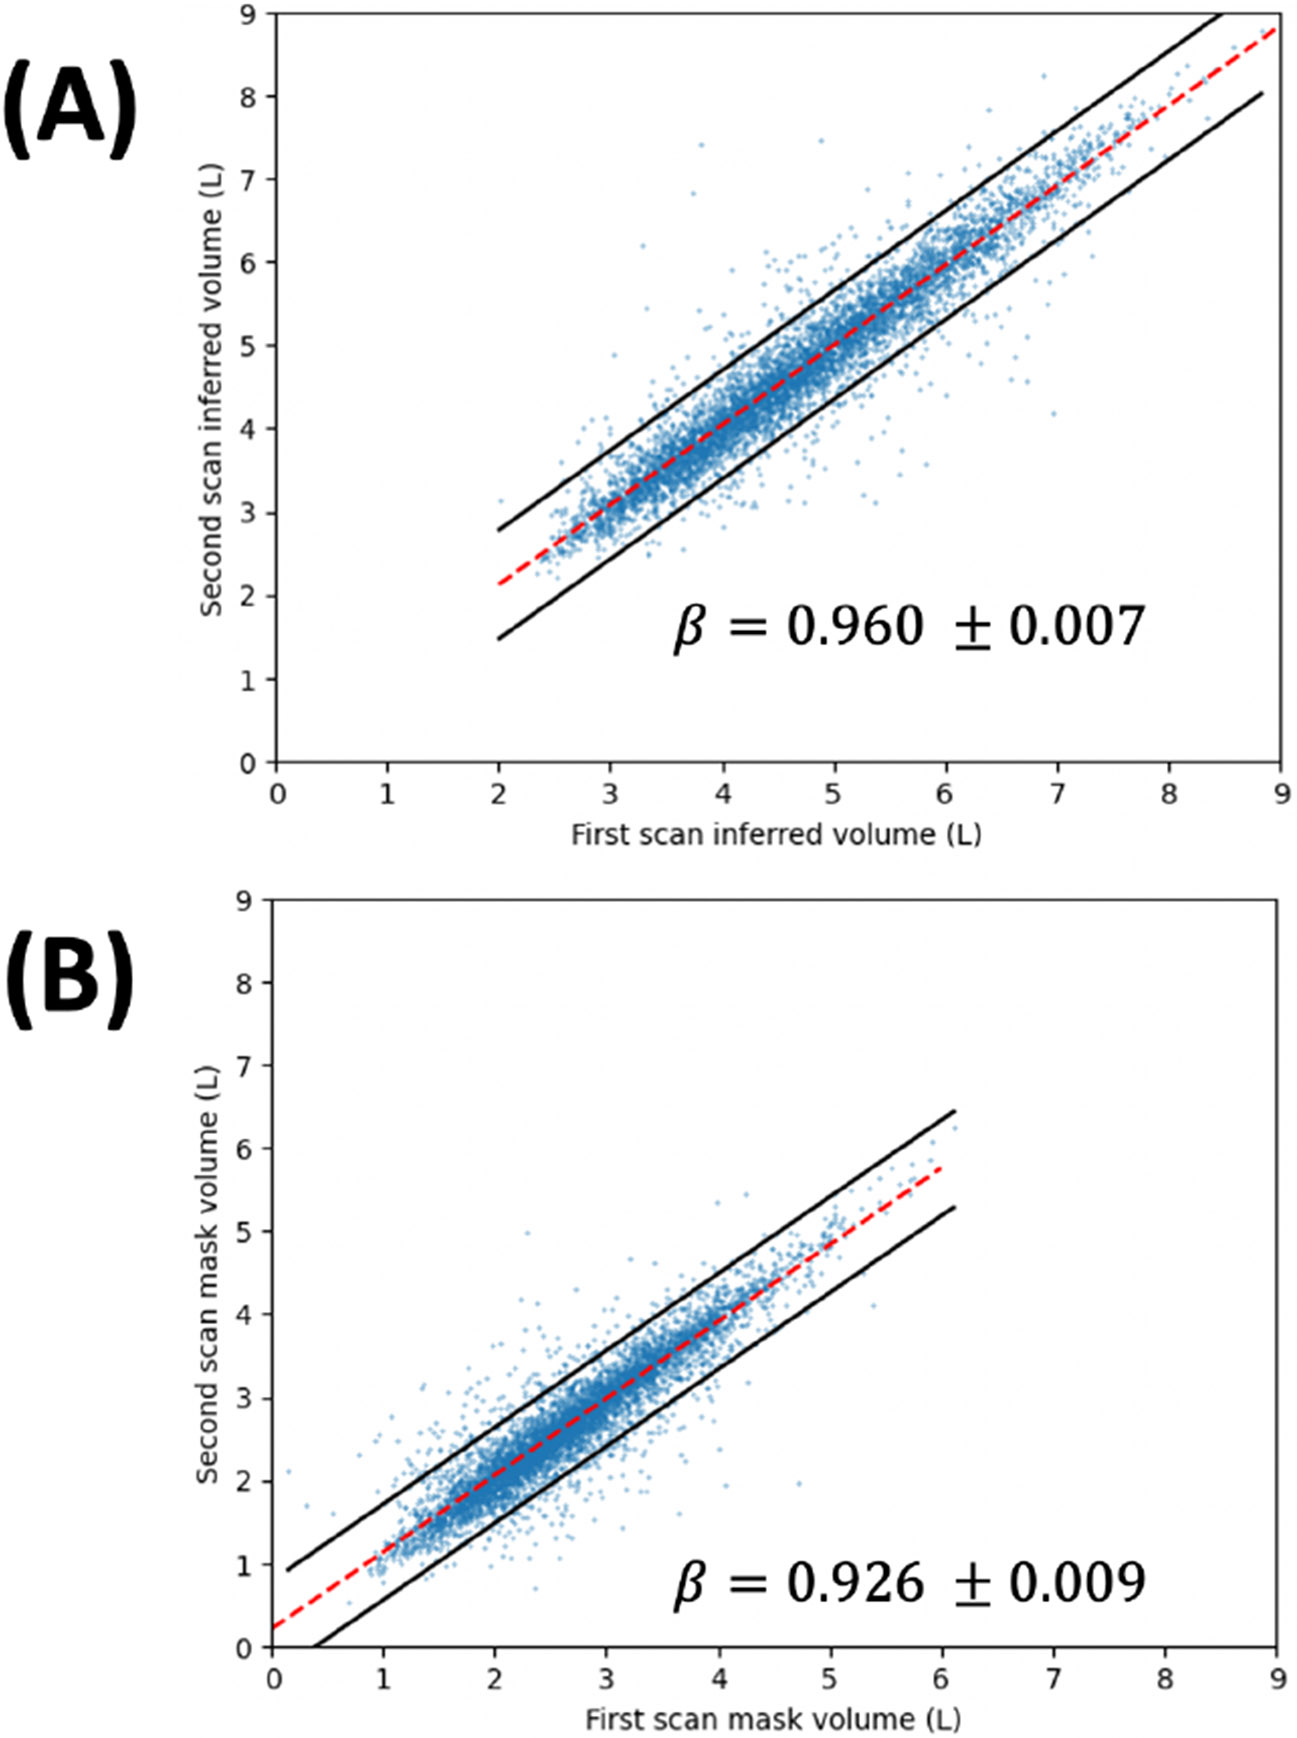
Bland-Altman analysis (Fig. 3A) illustrates minimal fixed bias, and low but statistically significant proportional bias (β = −0.1342+/−0.019, p < 10−11), leading to under- and over-estimation of TLV at high- and low-TLV outliers, respectively. The maximum prediction error, confidence bounds, and Pearson correlation all exceed the published performance of TLV estimates from chest radiography [16]. t-SNE plots of test-set examples (Fig. 3B) demonstrate that input images are ordered by TLV in a low-dimensional representation of the latent space of each branch of the network. Inference on repeated cardiac scans in MESA Exam 1, meanwhile, showed excellent reproducibility of the TLV estimate on repeat imaging (residual SD 337 mL, R2=0.910, Fig. 4), exceeding the reproducibility of the imaged lung volume (residual SD 300 mL, R2 = 0.858).
Figure 3:

(A) Bland-Altman plot for test-set predicted and ground-truth TLV (n = 431), from the best-performing network. Solid line denotes the mean residual, while dashed lines denote the 95% confidence interval. (B) t-SNE plots of the latent-space representation of test-set examples for the single views and the multi-view CNNs, color-coded by TLV.
Figure 4:

Scatter plot of (A) inferred TLV, (B) lung mask volume for paired MESA Exam 1 scans (n = 6,077). Dashed lines denote the least-squares fit, while the solid lines denote the 95% prediction interval on the fitted line. Regression slope is reported with 95% confidence interval for both cases.
4. DISCUSSION
In this work, we have designed a robust and reproducible deep-learned model for TLV estimation from cardiac CT scans which substantially outperforms regression methods. Our findings suggest that our TLV precision approaches the reproducibility of TLV from direct measurement on full-lung CT [15], and outperforms deep-learned TLV estimates from chest X-ray with full visualization of the lung fields [16].
Error in TLV estimation from cardiac CT can be decomposed into (1) uncertainty in TLV based on the partial image available in the cardiac scan, (2) protocol differences between the cardiac and full-lung acquisition, and (3) scan-rescan reproducibility of TLV due to varying inspiration levels. The strong correlation between TLV and cropped lung volume on full-lung scans (Table 2), as well as the independence of prediction error and the fraction of lung outside the scan field of view, suggest that the geometry of the full lung can be accurately inferred from a partial image. Any systematic protocol-specific variation between cardiac and full-lung scans can similarly be accounted for by our approach. Scan-rescan reproducibility, however, imposes a fundamental limit on the accuracy of the TLV estimate, as the uncertainty in the deep-learned measure will always equal or exceed the uncertainty in the measures used as ground-truth. An alternative training approach for TLV estimation would involve cropping and downsampling images obtained from full-lung HRCT, avoiding uncertainty in the ground-truth TLV used for training. However, in preliminary investigation, we found that this approach generalized poorly to cardiac CT data, most likely due to protocol incompatibility.
In our proposed framework, we observed a bias in volume estimates at very high and low TLV (Figure 3). This variance will be addressed in a future study. In addition, ablation studies, testing each combination of input channel and imaging plane, will enhance explainability by quantifying the contribution of each channel and view to the final TLV estimate. Perhaps most importantly, the relative underestimation of TLV in participants with significant emphysema highlights the need to characterize and correct for the effect of clinical and demographic covariates on estimated TLV. We will consider improving our model predictive power and generalizability by adjusting our estimated TLV for participant demographics, scanner manufacturer, pulmonary emphysema, and COPD status and severity.
5. COMPLIANCE WITH ETHICAL STANDARDS
Institutional review board approval was obtained for all study activities. Written informed consent was obtained from all participants.
ACKNOWLEDGMENTS
This research was supported by the American Lung Association and by grants R01-HL121270, R01-HL077612,R01-HL093081, R01 HL-130506 from the National Heart, Lung, and Blood Institute (NHLBI) and OT2HL156812 from the NIH. MESA was supported by contracts 75N92020D00001, HHSN268201500003I, N01-HC-95159, 75N92020D00005, N01-HC-95160, 75N92020D00002, N01-HC-95161, 75N92020D00003, N01-HC-95162, 75N92020D00006, N01-HC-95163, 75N92020D00004, N01-HC-95164, 75N92020D00007, N01-HC-95165, N01-HC-95166, N01-HC-95167, N01-HC-95168 and N01-HC-95169 from the NHLBI, and by grants UL1-TR-000040, UL1-TR-001079, and UL1-TR-001420 from the National Center for Advancing Translational Sciences (NCATS). The authors thank the other investigators, the staff, and the participants of the MESA study for their valuable contributions. A full list of participating MESA investigators and institutions can be found at http://www.mesa-nhlbi.org. This publication was developed under the Science to Achieve Results (STAR) research assistance agreements, No. RD831697 (MESA Air) and RD-83830001 (MESA Air Next Stage), awarded by the U.S Environmental Protection Agency (EPA). It has not been formally reviewed by the EPA. The views expressed in this document are solely those of the authors and the EPA does not endorse any products or commercial services mentioned in this publication. Dr. Hoffman is a shareholder in VIDA Diagnostics, Inc.
7. REFERENCES
- [1].Smith BM et al. "Association of Dysanapsis With Chronic Obstructive Pulmonary Disease Among Older Adults," JAMA, vol. 323, no. 22, pp. 2268–2280, Jun 9 2020, doi: 10.1001/jama.2020.6918. [DOI] [PMC free article] [PubMed] [Google Scholar]
- [2].Cardoso J, Coelho R, Rocha C, Coelho C, Semedo L, and Bugalho Almeida A, "Prediction of severe exacerbations and mortality in COPD: the role of exacerbation history and inspiratory capacity/total lung capacity ratio," Int J Chron Obstruct Pulmon Dis, vol. 13, pp. 1105–1113, 2018, doi: 10.2147/COPD.S155848. [DOI] [PMC free article] [PubMed] [Google Scholar]
- [3].French A, Balfe D, Mirocha JM, Falk JA, and Mosenifar Z, "The inspiratory capacity/total lung capacity ratio as a predictor of survival in an emphysematous phenotype of chronic obstructive pulmonary disease," Int J Chron Obstruct Pulmon Dis, vol. 10, pp. 1305–12, 2015, doi: 10.2147/COPD.S76739. [DOI] [PMC free article] [PubMed] [Google Scholar]
- [4].Casanova C et al. , "Inspiratory-to-total lung capacity ratio predicts mortality in patients with chronic obstructive pulmonary disease," Am J Respir Crit Care Med, vol. 171, no. 6, pp. 591–7, Mar 15 2005, doi: 10.1164/rccm.200407-867OC. [DOI] [PubMed] [Google Scholar]
- [5].Pedone C, Scarlata S, Chiurco D, Conte ME, Forastiere F, and Antonelli-Incalzi R, "Association of reduced total lung capacity with mortality and use of health services," Chest, vol. 141, no. 4, pp. 1025–1030, Apr 2012, doi: 10.1378/chest.11-0899. [DOI] [PubMed] [Google Scholar]
- [6].Best AC et al. , "Idiopathic pulmonary fibrosis: physiologic tests, quantitative CT indexes, and CT visual scores as predictors of mortality," Radiology, vol. 246, no. 3, pp. 935–40, Mar 2008, doi: 10.1148/radiol.2463062200. [DOI] [PubMed] [Google Scholar]
- [7].Iyer K, Grout R, Zamba G, and Hoffman E, "Repeatability and Sample Size Assessment Associated with Computed Tomography-Based Lung Density Metrics," Chronic Obstructive Pulmonary Diseases: Journal of the COPD Foundation, vol. 1,no. 1, pp. 97–104, 2014, doi: 10.15326/jcopdf.1.1.2014.0111. [DOI] [PMC free article] [PubMed] [Google Scholar]
- [8].Iyer KS, Grout RW, Egbert BP, Zamba G, Cook-Granroth J, and Hoffman EA, "Intra-Subject Repeatability Of CT Lung Density Measurements Following Single-Breath Hold Scans," in C73. LUNG IMAGING: NOVEL METHODOLOGIES AND QUALITY CONTROL: American Thoracic Society, 2011, pp. A5207–A5207. [Google Scholar]
- [9].Brown MS et al. , "Reproducibility of lung and lobar volume measurements using computed tomography," Acad Radiol, vol. 17, no. 3, pp. 316–22, Mar 2010, doi: 10.1016/j.acra.2009.10.005. [DOI] [PubMed] [Google Scholar]
- [10].Garfield JL, Marchetti N, Gaughan JP, Steiner RM, and Criner GJ, "Total lung capacity by plethysmography and high-resolution computed tomography in COPD," Int J Chron Obstruct Pulmon Dis, vol. 7, pp. 119–26, 2012, doi: 10.2147/COPD.S26419. [DOI] [PMC free article] [PubMed] [Google Scholar]
- [11].Hoffman EA et al. , "Variation in the percent of emphysema-like lung in a healthy, nonsmoking multiethnic sample. The MESA lung study," Ann Am Thorac Soc, vol. 11, no. 6, pp. 898–907, Jul 2014, doi: 10.1513/AnnalsATS.201310-364OC. [DOI] [PMC free article] [PubMed] [Google Scholar]
- [12].Oelsner EC et al. "Collaborative Cohort of Cohorts for COVID-19 Research (C4R) Study: Study Design," Am J Epidemiol, vol. 191, no. 7, pp. 1153–1173, Jun 27 2022, doi: 10.1093/aje/kwac032. [DOI] [PMC free article] [PubMed] [Google Scholar]
- [13].Bild DE et al. , "Multi-Ethnic Study of Atherosclerosis: objectives and design," Am J Epidemiol, vol. 156, no. 9, pp. 871–81, Nov 1 2002, doi: 10.1093/aje/kwf113. [DOI] [PubMed] [Google Scholar]
- [14].Hoffman EA et al. , "Reproducibility and validity of lung density measures from cardiac CT Scans--The Multi-Ethnic Study of Atherosclerosis (MESA) Lung Study," Acad Radiol, vol. 16, no. 6, pp. 689–99, Jun 2009, doi: 10.1016/j.acra.2008.12.024. [DOI] [PMC free article] [PubMed] [Google Scholar]
- [15].Nolan A et al. , "The repeatability of computed tomography lung volume measurements: Comparisons in healthy subjects, patients with obstructive lung disease, and patients with restrictive lung disease," Plos One, vol. 12, no. 8, 2017, doi: 10.1371/journal.pone.0182849. [DOI] [PMC free article] [PubMed] [Google Scholar]
- [16].Sogancioglu E, Murphy K, Th Scholten E, Boulogne LH, Prokop M, and van Ginneken B, "Automated estimation of total lung volume using chest radiographs and deep learning," Med Phys, vol. 49, no. 7, pp. 4466–4477, Jul 2022, doi: 10.1002/mp.15655. [DOI] [PMC free article] [PubMed] [Google Scholar]
- [17].Yang J et al. , "Emphysema Quantification on Cardiac CT Scans Using Hidden Markov Measure Field Model: The MESA Lung Study," Med Image Comput Comput Assist Interv, vol. 9901, pp. 624–631, Oct 2016, doi: 10.1007/978-3-319-46723-8_72. [DOI] [PMC free article] [PubMed] [Google Scholar]
- [18].Hame Y, Angelini ED, Hoffman EA, Barr RG, and Laine AF, "Adaptive quantification and longitudinal analysis of pulmonary emphysema with a hidden Markov measure field model," IEEE Trans Med Imaging, vol. 33, no. 7, pp. 1527–40, Jul 2014, doi: 10.1109/TMI.2014.2317520. [DOI] [PMC free article] [PubMed] [Google Scholar]


