

Abstract
The 2019 coronavirus (COVID-19) pandemic impaired global health, disrupted society, and slowed down the economy. Early detection of the infection using highly sensitive diagnostics is crucial in preventing the disease’s spread. In this paper, we demonstrate electrochemical sensors based on laser induced graphene (LIG) functionalized directly with gold (Au) nanostructures for the detection of SARS-CoV-2 with an outstanding limit of detection (LOD) of ~1.2 . To optimize the sensors, we explored various functionalization parameters to elucidate their impact on LOD, sensitivity, and linearity. Specifically, we investigated the effect of (i) gold precursor concentration, (ii) crosslinker chemistry, (iii) crosslinker and antibody incubation conditions, and (iv) antigen-sensor interaction (diffusion-dominated incubation vs. pipette-mixing), as no systematic study on these parameters have been reported thus far. Our benchmarking analysis highlights the critical role of the antigen-sensor interaction and crosslinker chemistry. We showed that pipette-mixing enhances sensitivity and LOD by more than 1.6-fold and 5.5-fold, respectively, and also enables multimodal readout compared to diffusion-dominated incubation. Moreover, the PBA/Sulfo-NHS: EDC crosslinker improves the sensitivity and LOD compared to PBASE. The sensors demonstrate excellent selectivity against other viruses, including HCoV-229E, HCoV-OC43, HCoV-NL63, and influenza H5N1. Beyond the ability to detect antigen fragments, our sensors enable detection of antigen-coated virion mimics (which are a better representative of the real infection) down to an ultralow concentration of ~5 .
Keywords: SARS-COV-2, biosensor, laser induced graphene, antigen, electrochemical
Graphical Abstract
1. Introduction
The 2019 coronavirus (COVID-19) pandemic led to a drastic loss of human life and presented unprecedented challenges to global health, society, and the economy. As of 2024, at least 6.8 million people have died from COVID-19 globally.1 At least 10% of infected individuals experience long COVID symptoms2 including heart problems,3 blood clot-related issues,4 diabetes, chronic fatigue syndrome, and postural orthostatic tachycardia syndrome (POTS)—affecting 65 million people worldwide. Moreover, the pandemic pushed an estimated 90 million people into extreme poverty in 2020, the largest increase in global inequality and poverty since 1990.5 Increased testing availability enabled tracking of disease spread,6 but several diagnostic challenges remain.
Conventional polymerase chain reaction (PCR) tests, while accurate, are slow, expensive, and require trained personnel, causing strain on healthcare systems as they struggled to meet testing demands.7 Commercial rapid point-of-care (POC) antigen tests offer a faster alternative but concerns about their sensitivity and high rates of false negatives—especially for asymptomatic individuals with low viral load—remain a hurdle to disease containment and treatment access.8 Moreover, these rapid tests provide a qualitative binary outcome—positive or negative—without providing information on the viral load. To address these challenges, electrochemical antigen sensors are a viable solution.9 These sensors enable quantitative measurements of viral load to facilitate assessment of disease severity, monitoring of disease progression, and evaluation of treatment efficacy.
Sensors detecting COVID antigens have advantages over antibody tests due to their capability to identify earlier stages of illness when viral loads are typically higher, facilitating timely intervention and containment methods. Antibodies often only become detectable during the late and recovery stages of infection, which can lead to false negatives.10 In antigen sensors, antigens bind to biorecognition molecules (such as immobilized antibodies, aptamers, etc.) on the sensor surface, leading to a measurable change in the sensor signal, such as Faradaic current,11-13 impedance,14-16 or surface potential/charge.17-19 An effective electrochemical sensor must have a large surface area for antigen immobilization and excellent electron transfer properties. Graphene supports both characteristics, making it a promising material for developing POC virus diagnostic devices.20-24 Various studies have capitalized on graphene’s excellent electrical, physical, and mechanical properties for electrochemical antigen detection. Quasi-free-standing epitaxial graphene-based biosensors, developed by Kim et al., showed real-time ultra-sensitive detection capability with a LOD of 1 ag. for spike protein antigen.25 Graphene ink printed on disposable paper substrates reported by Jaewjaroenwattana et al. offered a more cost-effective solution with high specificity and stability, achieving an LOD of 2.0 fg..26
Recently, laser-induced graphene (LIG) has gained significant attention in electrochemical sensing. LIG is a scaffold-like porous material made using readily available films, such as polyimide, through a simple CO2 laser processing, which carbonizes the substrate into graphene through photothermal and photochemical effects.27 Several diagnostic devices based on LIG have been developed to detect COVID-19. Torrente-Rodríguez et al. demonstrated a LIG-based multiplexed telemedicine platform for viral antigen nucleocapsid protein, IgM and IgG antibodies, and the inflammatory biomarker C-reactive protein.28 Cui et al. developed a field-effect transistor with a porous graphene channel to detect antigens at a concentration of 1 pg..29 Other studies have explored LIG biosensors functionalized with gold nanostructures to improve LOD. Alafeef et al. developed an electrochemical biosensor chip using graphene/paper functionalized with gold nanoparticles (AuNPs).30 The presence of AuNPs significantly improved the sensor's ability to detect the virus compared to without them, achieving a sensitivity of 231 copies. μ and a LOD of 6.9 copies. μ.30 Sadique et al. harnessed electrodeposited AuNPs to improve the electrochemical properties of graphene oxide for the detection of SARS-CoV-2 antigen, achieving a limit of detection of 3.99 ag..31 The literature employs various graphene modification methods, including AuNP functionalization, choice of crosslinkers, and parameters such as humidity, temperature, and incubation duration as summarized in Table S1. However, a direct comparison of these functionalization parameters is missing.
In this study, we optimized the functionalization process of Au-LIG electrochemical sensors for SARS-CoV-2 antigen detection. We explored the functionalization of LIG with AuNPs via direct CO2 laser processing (L-Au/LIG) as a means of improving sensor sensitivity, limit of detection (LOD), and selectivity. The study also investigates the impact of different functionalization parameters and compares two commonly used crosslinkers in graphene-based devices (PBASE vs. PBA/Sulfo-NHS: EDC) on the sensor’s sensitivity. The effect of crosslinker and antibody incubation conditions is also studied. Moreover, we evaluated the LOD and sensitivity of the sensors using two antigen-sensor interaction/incubation techniques (diffusion-dominated incubation vs. pipette-mixing), showing that the pipette-mixing not only improves the sensitivity and LOD, but also enables multimodal readout for more reliable testing. The sensor performance in artificial saliva is also demonstrated. Finally, as a more accurate model for the real infection, we tested the sensors with virion-like SARS-CoV-2 mimics and showed the ability to detect down to ~5 particles..
2. Results and Discussion
A. Characterization of material morphology, surface chemistry, and kinetic parameters
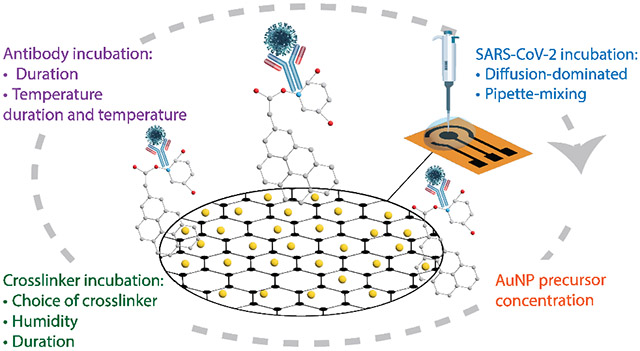
Fig. 1 depicts the fabrication steps of the Au-LIG SARS-CoV-2 antigen sensor and the overview of the parameters that are studied in order to optimize the sensor response (sensitivity, LOD, linearity, and noise). We first examine the direct laser functionalization of LIG with different concentrations of HAuCL4 (gold precursor solution) in DI water on the sensor's electrochemical properties. We also evaluate the influence of two commonly used crosslinkers in graphene-based devices (PBASE vs. PBA/Sulfo-NHS: EDC) on the sensor’s sensitivity. Moreover, we study the effect of crosslinker and antibody incubation conditions (humidity, temperature, duration) and antigen-sensor incubation process (diffusion-dominated incubation vs. pipette-mixing).
Figure 1. Fabrication of L-Au/LIG.
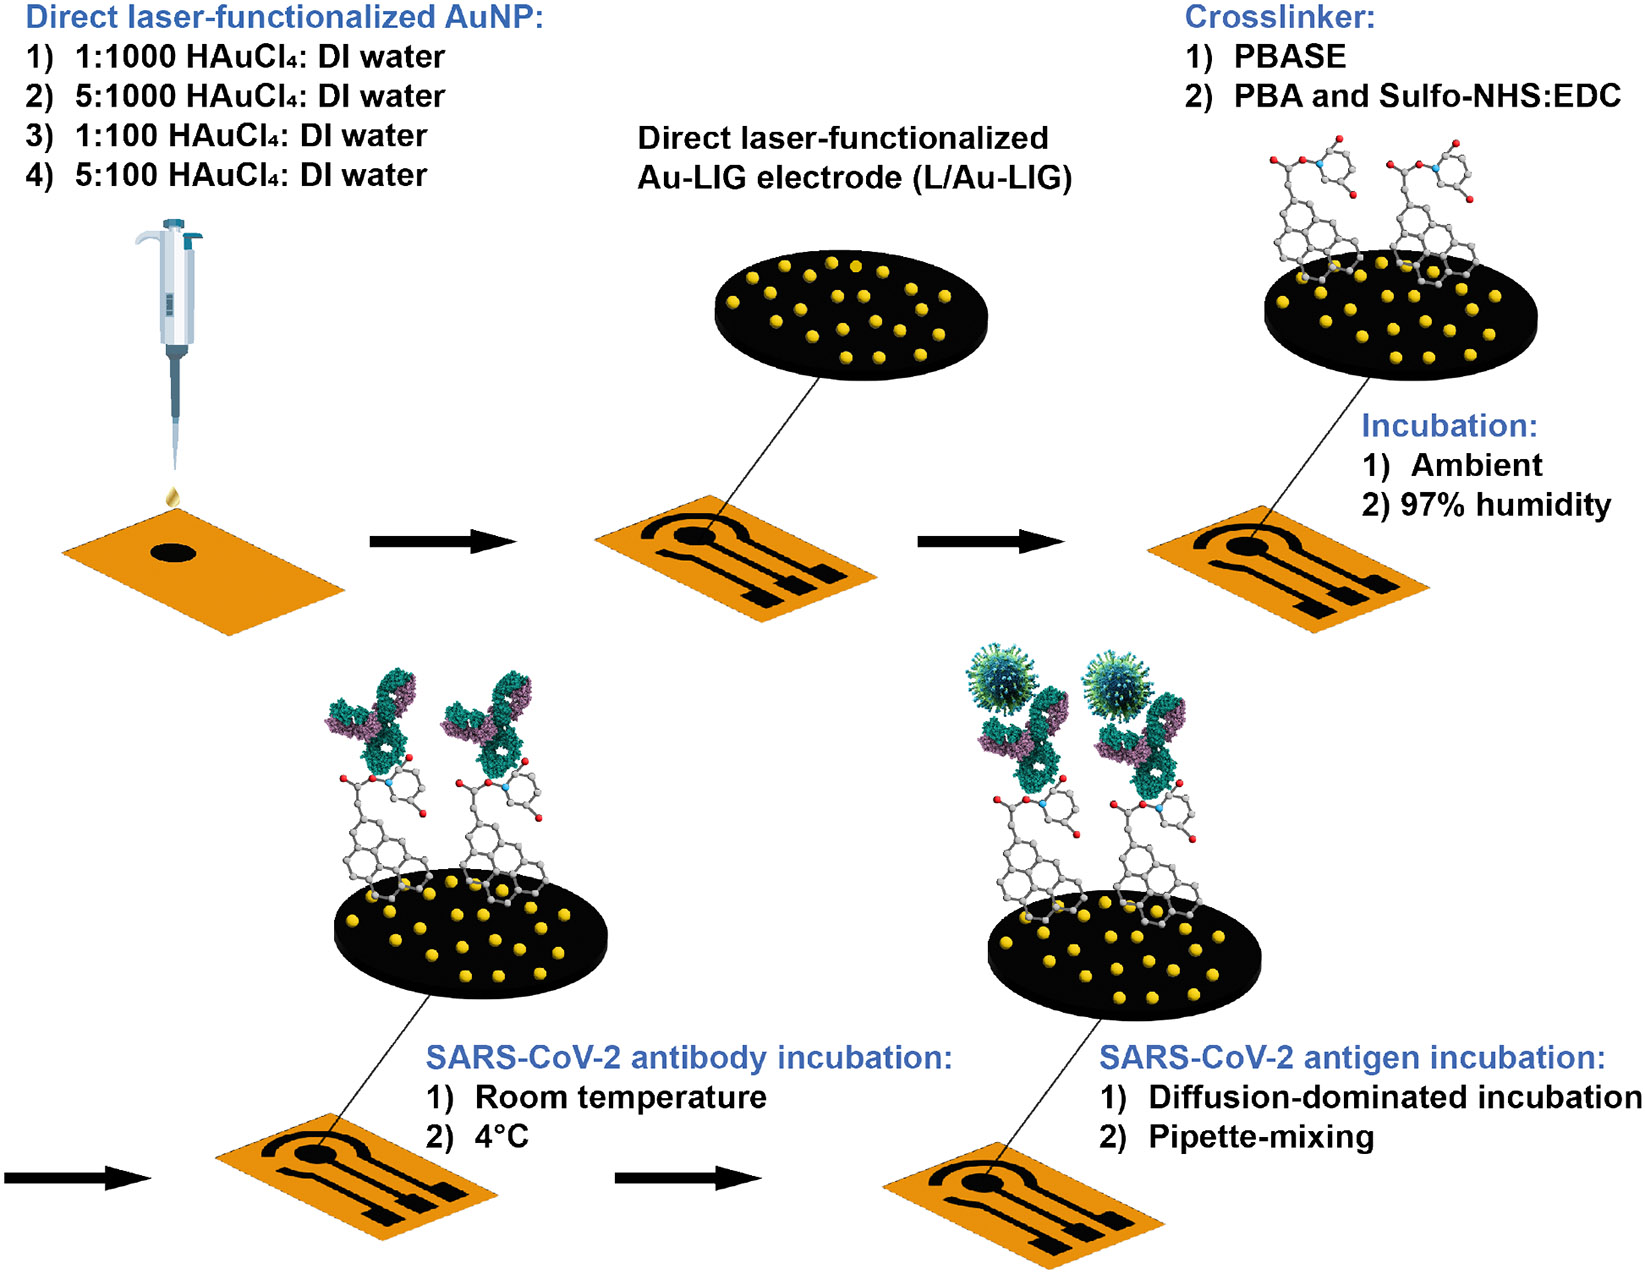
First, a CO2 laser carbonizes polyimide into laser induced graphene (LIG), patterning the working electrode (WE). Au is directly doped into LIG through a second lasing step to form L-Au/LIG. Effect of different Au concentrations is studied. Carboxylic groups are activated on the WE surface with PBASE or PBA/Sulfo-NHS: EDC as crosslinker. Effect of incubation humidity is studied. SARS-CoV Spike S2 antibody covalently bonds to the carboxylic groups. The effect of incubation temperature for this step is studied. Bovine serum albumin (BSA) is then used to block unbound sites, followed by testing with the virus samples. Specifically, two different antigen mixing techniques are investigated in this study.
First, we investigate the effect of Au precursor concentration on the electrochemical properties of LIG functionalized with AuNPs via CO2 laser processing. In this fabrication method, the CO2 laser reduces Au3+ ions in the HAuCL4 precursor solution, forming nanoparticles. The porous structure of LIG increases the surface area available for electrochemical reactions and protein immobilization, enhancing its effectiveness for sensing applications. To understand the effect of Au functionalization on the available surface area and kinetics of charge-transfer, we calculate electrochemically active surface area (ECSA) and the heterogeneous electron transfer rate constant, , as plotted in Fig. 2a and Fig. 2b for 1-pass LIG, 2-pass LIG, and L-Au/LIG functionalized with different concentrations of HAuCl4 in DI water. ECSA and of the working electrode (WE), with a geometric area of π mm2 are derived from cyclic voltammetry (CV) measurement data shown in Fig. S1a using the Randal-Sevcik equations (Eq. 1 and Eq. 2):
| Eq. 1 |
| Eq. 2 |
where is the peak current, is the number of transferred electrons in the redox event (here ), is Faraday’s constant, is the diffusion coefficient of the redox probe (here ), is the universal gas constant, is the absolute temperature, is the redox probe concentration, is the electrochemically active surface area, and is the oxidation-reduction peak separation in .
Figure 2. Electrochemical characterization of L-Au/LIG.
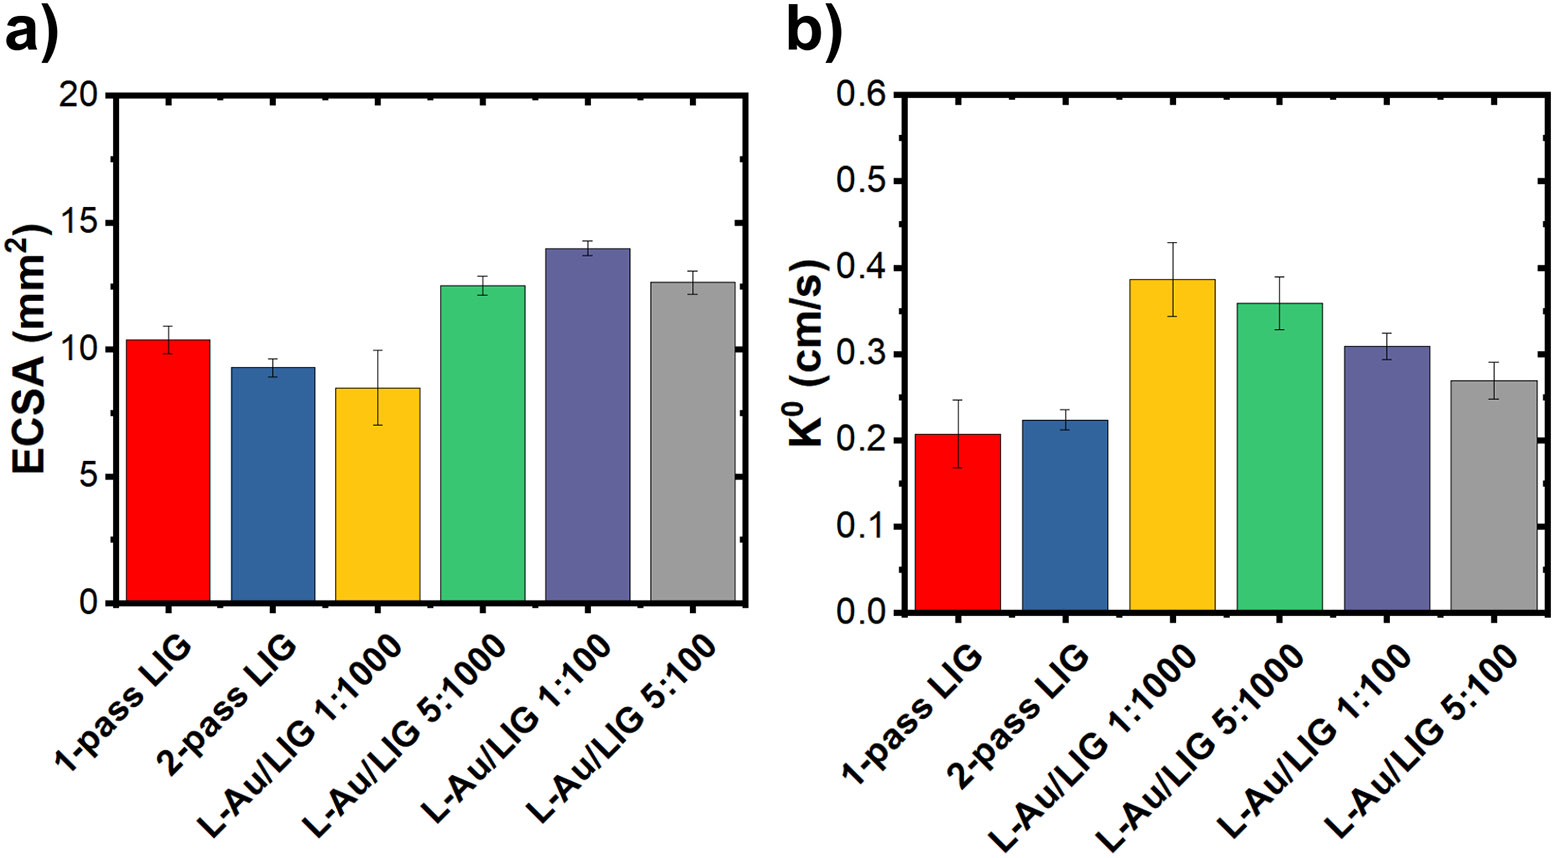
(a) Electrochemically active surface area (ECSA) of LIG and L-Au/LIG functionalized with different concentrations of HAuCl4 (the gold precursor solution). Data are presented as mean (n=9). Error bars are standard error of the mean. (b) of LIG and L-Au/LIG functionalized with different concentrations of HAuCl4. Data are presented as mean (n=9). Error bars are S.E.M.
The direct laser functionalization process involves two passes of the laser over the WE, resulting in a double-layer LIG WE. We measured the electrochemical properties of the double-written WE LIG (2-pass LIG) without the AuNPs, aiming to determine whether the observed enhancement in ECSA and of L-Au/LIG sensors primarily resulted from the 2-pass LIG or the presence of AuNPs. Our findings indicate that the enhancement primarily originates from the presence of AuNPs rather than the double-written structure itself. Despite the addition of the second lasing, the ECSA and did not exhibit significant changes compared to the single lasing WE sensor. This suggests that improvements can be attributed to the AuNPs rather than the 2-pass WE structure.
ECSA increases by a factor of 3.3 with bare LIG compared to the geometric area. The enhancement ranges from a factor of 4.0 to 4.5 (compared to the geometric area) for L-Au/LIG functionalized with different concentrations of HAuCl4 solution as shown in Table 1—the exception being 1:100 concentration of HAuCl4: DI water, which reduces the ECSA and interestingly has the highest . L-Au/LIG shows a 1.3× to 1.9× enhancement of the rate transfer constant compared to 2-pass LIG. These results confirm that the direct laser functionalization of AuNPs significantly improves the electrochemical properties of LIG—in particular the available surface area for immobilization of the biorecognition molecules. A 1:100 concentration of HAuCl4: DI water solution was chosen in the final design of the L-Au/LIG sensor given its most improved ECSA.
Table 1. Calculated electrochemically active surface area (ECSA) and .
The calculated ECSA and the heterogeneous electron transfer rate constant () and comparison between 1-pass LIG, 2-pass LIG, and L-Au/LIG. Data are presented as mean with n=9.
| 1-pass LIG | 10.38 | 0.208 |
| 2-pass LIG | 9.283 | 0.224 |
| L-Au/LIG 1:1000 | 8.48 | 0.386 |
| L-Au/LIG 5:1000 | 12.52 | 0.359 |
| L-Au/LIG 1:100 | 13.98 | 0.309 |
| L-Au/LIG 5:100 | 12.64 | 0.269 |
We also characterized the electrode surface morphology and chemical composition with scanning electron microscopy (SEM), Raman spectroscopy, and X-ray photoelectron spectroscopy (XPS). SEM reveals the porous 3D structure of LIG in Fig. 3a, a result of the rapid liberation of gaseous products during laser scribing.27 The average Raman spectrum of 1-pass and 2-pass LIG samples in Fig. 3b depicts the D peak at ~1,350 induced by defects or bent sp2-carbon bonds, the first order G peak at ~1,580 , and the 2D peak at ~2,700 originating from second order zone-boundary phonons.32 1-pass LIG produces a more crystalline graphene with less structural disorder and defects compared to the 2-pass LIG, as confirmed by its higher 2D band intensity and lower D peak intensity.33 The presence of Au 4f in the XPS spectrum in L-Au/LIG confirms the presence of Au on the graphene surface (Fig. 3c). In our previous work, X-ray diffraction (XRD) analysis of the L-Au/LIG material shows a slight peak of Au in the (111) plane, confirming the formation of crystalline gold structures. 34
Figure 3. Material characterization of LIG and L-Au/LIG sensor.
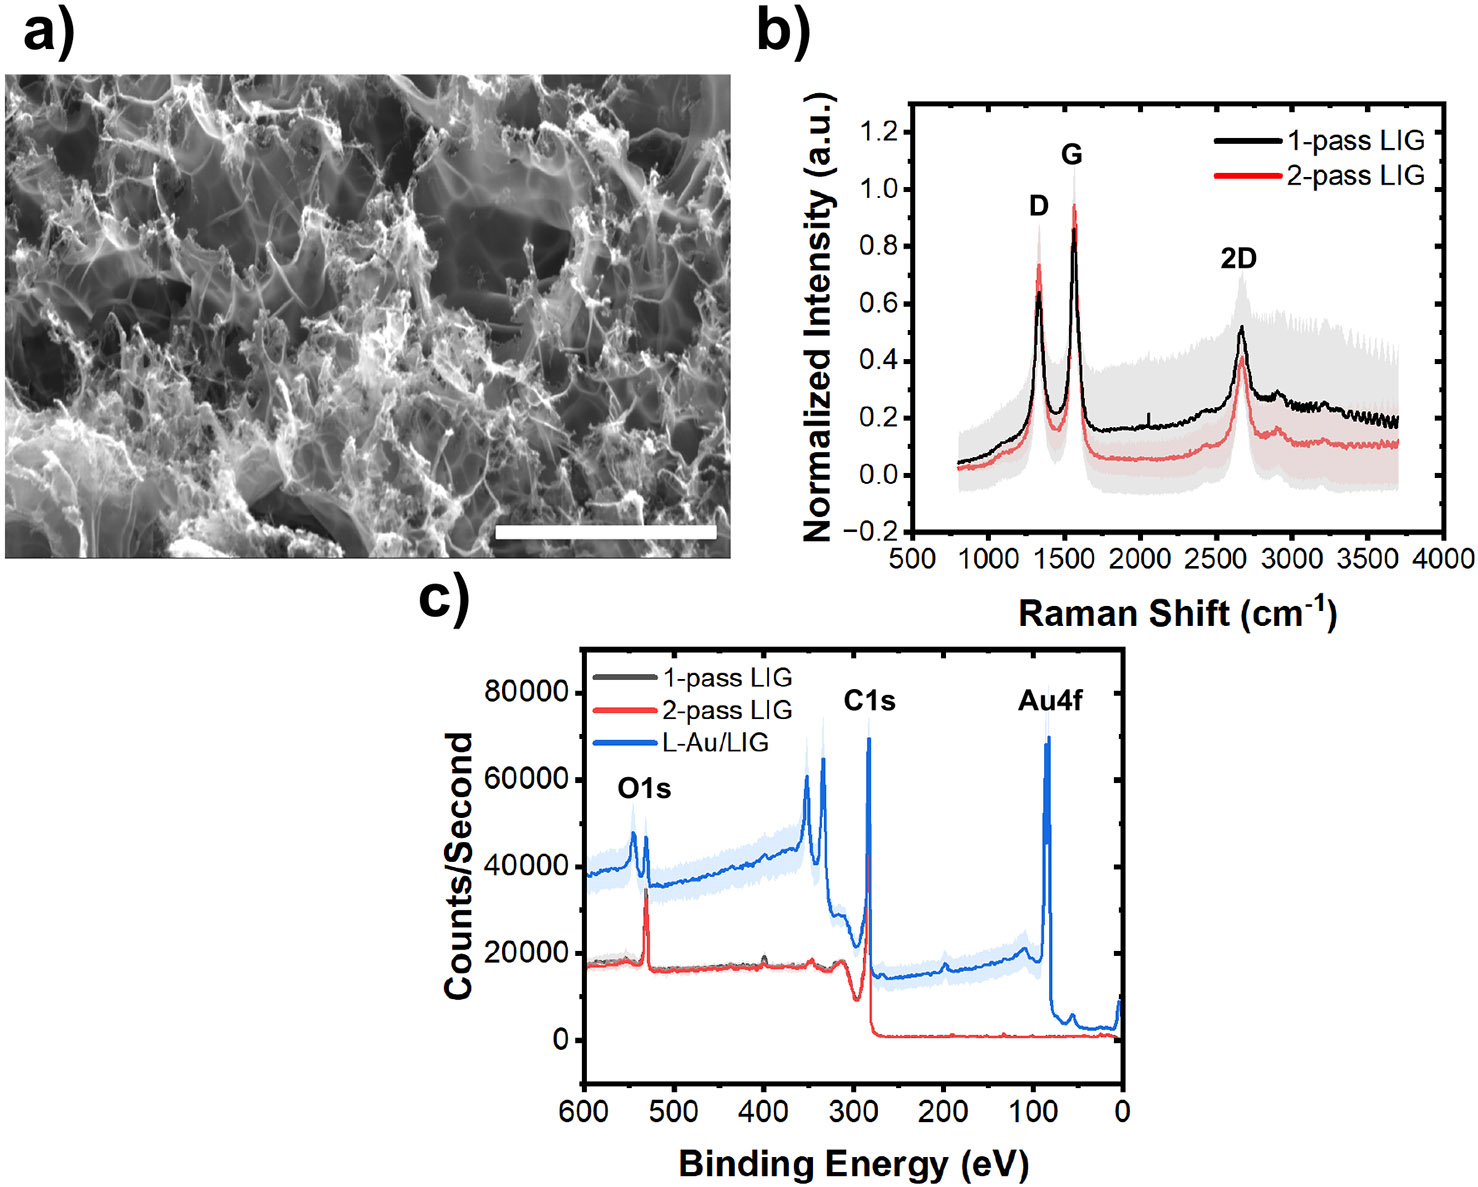
(a) SEM image of the LIG confirms the 3D porous structure of the material (with 6,500× magnification). Scale bar is 20 μm. (b) Average Raman spectra of the 1-pass (n=24) and 2-pass LIG sensor (n=8). Error bands are standard deviation (STD). (c) XPS results of 1-pass LIG (n=4), 2-pass LIG (n=4), and L-Au/LIG sensors (n=4) showing their chemical components. Error bands are STD.
Sensor optimization: Studying the effect of various functionalization parameters on sensitivity.
When more antigen molecules are immobilized on the surface of the electrode, the electron transfer kinetics change, resulting in a lower differential pulse voltammetry (DPV) current35 and a higher charge-transfer resistance, which is derived from the electrochemical impedance spectroscopy (EIS).36 Thus, the DPV peak current should decrease with increasing concentrations of antigen, and should increase with increasing the concentration of antigen. The data shown in Fig. 4a and 4b depict the DPV curves at each stage of the functionalization process using PBASE and PBA/Sulfo-NHS: EDC crosslinkers, respectively. Fig. 4c plots the DPV response of a representative sensor incubated with antigen concentrations ranging from 3 ag. to 300 ag.. As expected, the decreasing peak current after each functionalization step suggests that 1) both PBASE and PBA/Sulfo-NHS:EDC support activation of the carboxyl groups on the electrode surface; 2) the antibody cross-links to the carboxyl groups; 3) BSA blocks unbound sites on the electrode surface; and 4) the spike protein antigen is immobilized on the sensor surface. Fig. 4d and 4e depict after each functionalization step derived from the EIS Nyquist plots (an example shown in Fig. S1b). is extracted from the Nyquist plot by modeling the electrodesolution using an equivalent circuit shown in Fig. S1c. An increase in the after each stage of the functionalization process indicates surface modification at each step of the process, supporting the conclusions drawn from the DPV measurements.
Figure 4. L-Au/LIG electrochemical sensor performance.
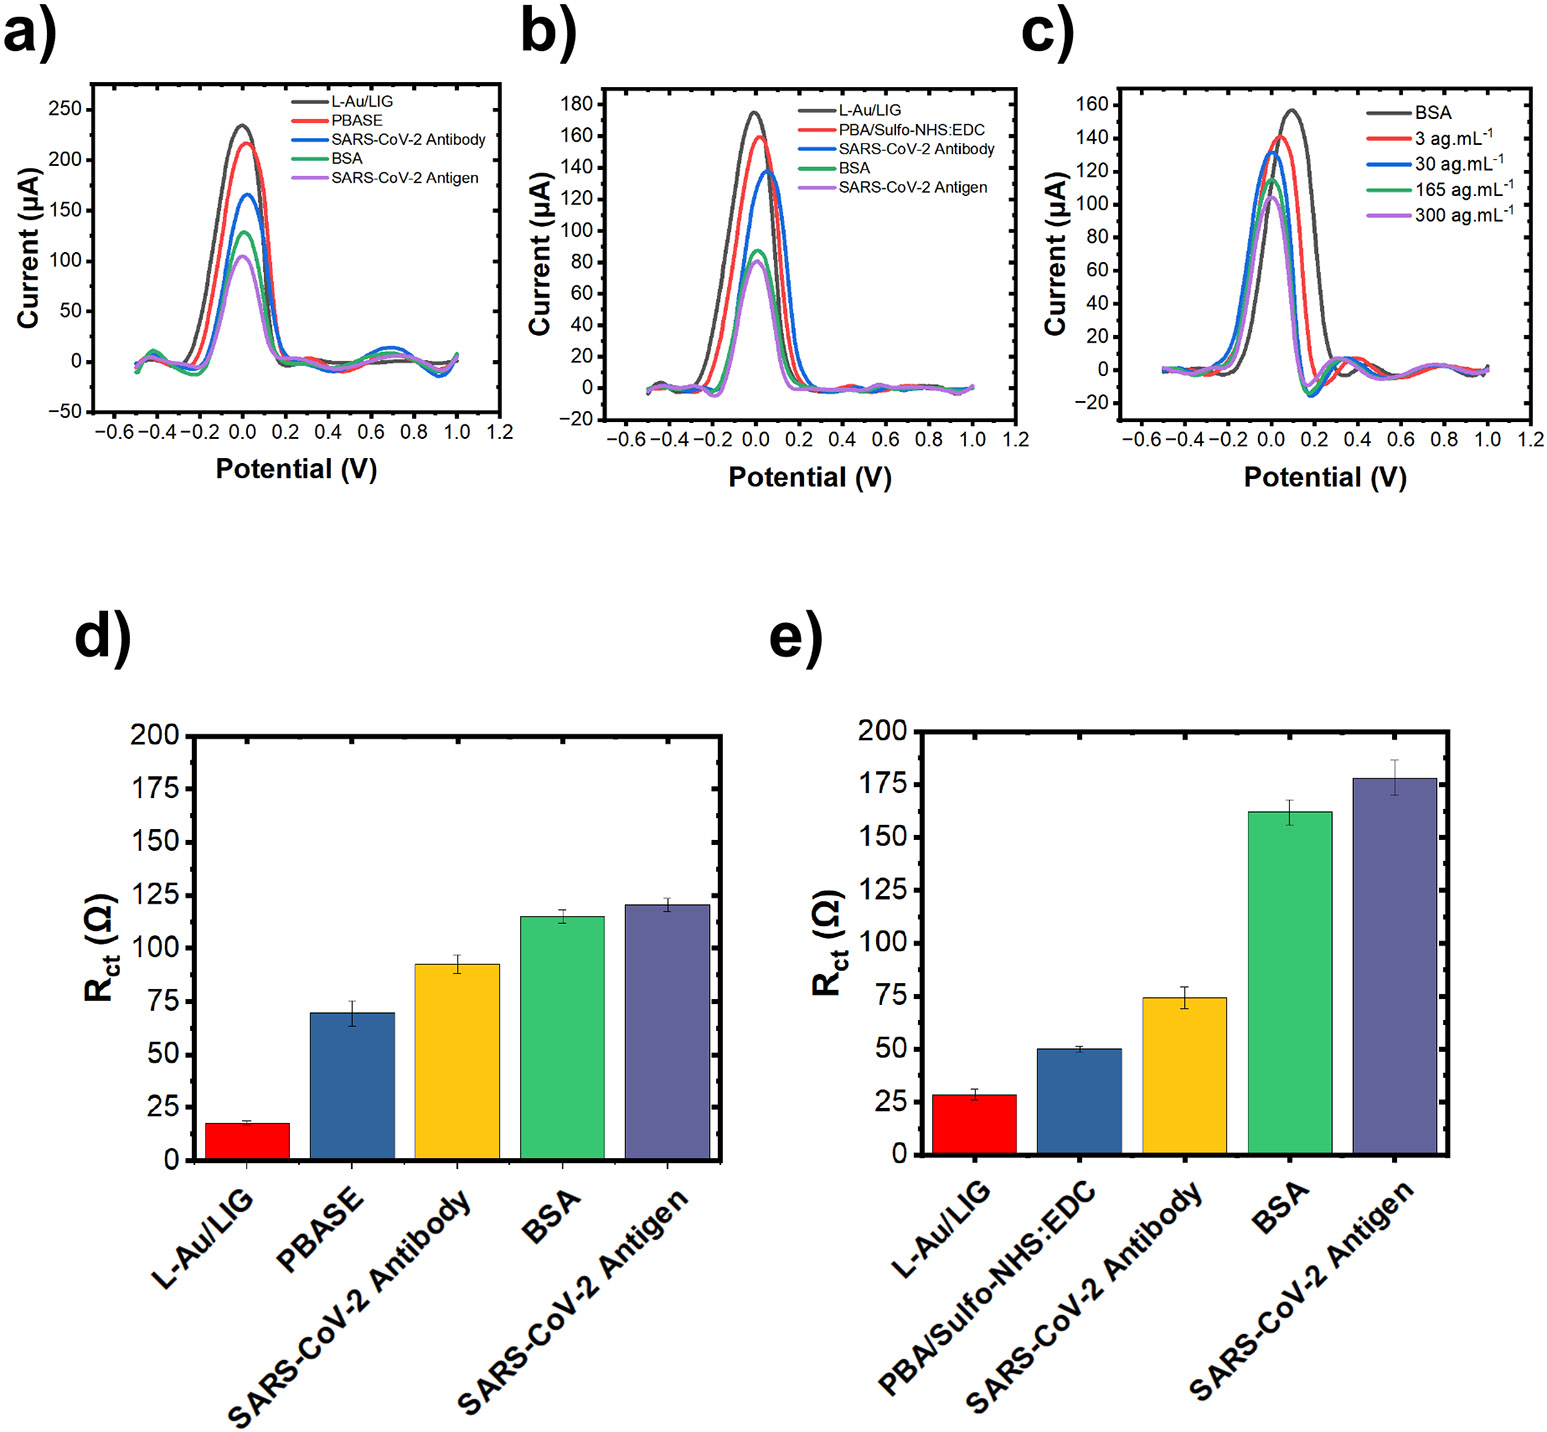
(a) Differential pulse voltammetry (DPV) curves after each step of functionalization process with PBASE crosslinker. Antigen concentration is 30 ng.. (b) Representative differential pulse voltammetry (DPV) curves after each step of functionalization process with PBA/Sulfo-NHS: EDC crosslinker. Antigen concentration is 30 ng.. (c) Representative DPV curves in response to varying concentrations of SARS-CoV-2 antigen. (d) The charge-transfer resistance () after each step of functionalization process for PBASE crosslinker. Antigen concentration is 30 ng.. Data are presented as mean with n = 3. Error bars are standard error of the mean. (e) The charge-transfer resistance () after each step of functionalization process for PBA/Sulfo-NHS: EDC crosslinker. Antigen concentration is 30 ng.. Data are presented as mean with n = 3. Error bars are standard error of the mean.
To optimize the L-Au/LIG sensor, we first investigate how functionalization parameters—humidity, temperature, and duration—of the PBASE crosslinker and SARS-CoV-2 antibody affect the density of surface-linked antibodies. Maximizing the attachment of receptor antibodies enhances sensor sensitivity. Incubation duration is a crucial parameter to study because it affects the crosslinker and amine-terminated protein (i.e. antibody) binding efficiency,37 thereby influencing sensor performance. In general, shorter incubation periods in bioconjugation might not provide sufficient binding time,38 which could lead to weakened sensor sensitivity. Conversely, longer incubation times allow for more complete binding38 but increase the risk of degradation (hydrolysis of crosslinkers or denaturing of antibodies39), both of which may lead to weakened sensitivity. Incubation humidity and temperature also play critical roles in crosslinker and antibody binding. High humidity/low temperature prevents a 10 μ crosslinker/antibody aliquot from evaporating before it can diffuse through the working electrode and bind to graphene. Moreover, antibodies are more stable at lower temperatures.40 From the DPV curves of L-Au/LIG modified with PBASE, SARS-CoV-2 antibody, and BSA (example shown in Fig. 4a and 4b), the amount of surface linked antibody can be evaluated using Eq. 3:37
| Eq. 3 |
Where is the exchanged charge in the redox event, is the number of exchanged electrons (here ), is Faraday’s constant, and is the ECSA (here ).
We first compare two common antibody incubation times from the literature: overnight (12 hours) and 3 hours (results summarized in Table S2). The PBASE crosslinker is incubated for an hour in ambient conditions, followed by incubation of the SARS-CoV-2 antibody for 3 hours/overnight and BSA for 1.5 hours at room temperature. Incubating the antibody for 3 hours compared to overnight increased the attachment density by 139% from 3.03 ± 1.23 × 10⁻¹⁰ mol. to 7.25 ± 1.67 × 10⁻¹⁰ mol.. In the next series of tests, we compare incubating PBASE for one hour under ambient conditions to a humidity chamber (97% humidity). There was no significant difference observed between them; however, we favored the 74% decrease in standard deviation of the humidity chamber. A similar experiment is performed to compare the incubation of SARS-CoV-2 antibodies at ambient room temperature versus refrigeration at 4°C. Incubating the antibody at 4°C increased attachment density by 1.55-fold. Finally, we examined various crosslinker incubation durations—1 hour, 1.5 hours, and 3 hours. Both 1 hour and 1.5 hours of incubation resulted in the highest antibody attachment densities. While there was no statistically significant difference between 1 hour and 1.5 hours of incubation, we favored the 2.85-fold lower standard deviation of 1.5 hours.
Using the optimized crosslinker/antibody incubation humidity/duration, we systematically studied the effect of crosslinker chemistry (PBASE vs. PBA/Sulfo-NHS) on antibody surface attachment density, given the lack of direct comparison in the literature. These crosslinkers are among the most studied functionalization methods in graphene-based sensors.18, 28, 41-46 In both crosslinkers, the aromatic pyrene group binds to the basal plane of graphene through pi-pi interactions.28, 45 In PBASE, the amine-reactive succinimide group covalently bonds to the antibody.45 PBA does not inherently contain this succinimide ester group. Instead, EDC first activates the graphene’s carboxyl group.47 Sulfo-NHS then reacts with the activated carboxyl group to form a Sulfo-NHS ester group that enables amide bonding to antibodies.47 These succinimide ester groups are prone to hydrolysis, which decreases their effective concentration and thus hinders the amidization process.47 Because the humidity chamber did not have a statistically significant effect on antibody attachment density for the PBASE crosslinker but reduced noise, we continued using a humid environment for PBA/Sulfo-NHS:EDC. However, due to the sensitivity of the succinimide ester to hydrolysis, we optimized the incubation duration of the Sulfo-NHS: EDC. An incubation time of 2 hours yielded the highest antibody attachment density of 1.86 ± 0.22 × 10⁻⁹ mol. (refer to Table S2), 78% higher than that of 1 hour—which may have not been enough time for complete bonding—and 142% higher than 3 hours—where hydrolysis evidently occurred.
We then evaluated the sensitivity and LOD of L-Au/LIG sensors functionalized with the optimized PBASE and PBA/Sulfo-NHS: EDC humidity/duration conditions showing a distinct advantage of PBA/Sulfo-NHS:EDC for graphene sensors. In Fig. 5a, present the (normalized w.r.t. of samples after BSA treatment) in response to varying concentrations of SARS-CoV-2 antigen (30—3 × 10³ ag.). PBA/Sulfo-NHS: EDC yields 34% better sensitivity and 22% lower LOD than the sensors functionalized with PBASE (results are summarized in Table S3). The superior performance of the sensor functionalized with PBA/Sulfo-NHS stems from the higher antibody attachment density achieved by this crosslinker; this higher density likely results from its lower susceptibility to hydrolysis compared to PBASE. These findings underscore the critical impact of crosslinker selection and functionalization conditions on the sensitivity of electrochemical sensors.
Figure 5. Studying the effect of crosslinker chemistry and antigen-sensor interaction (mixing method).
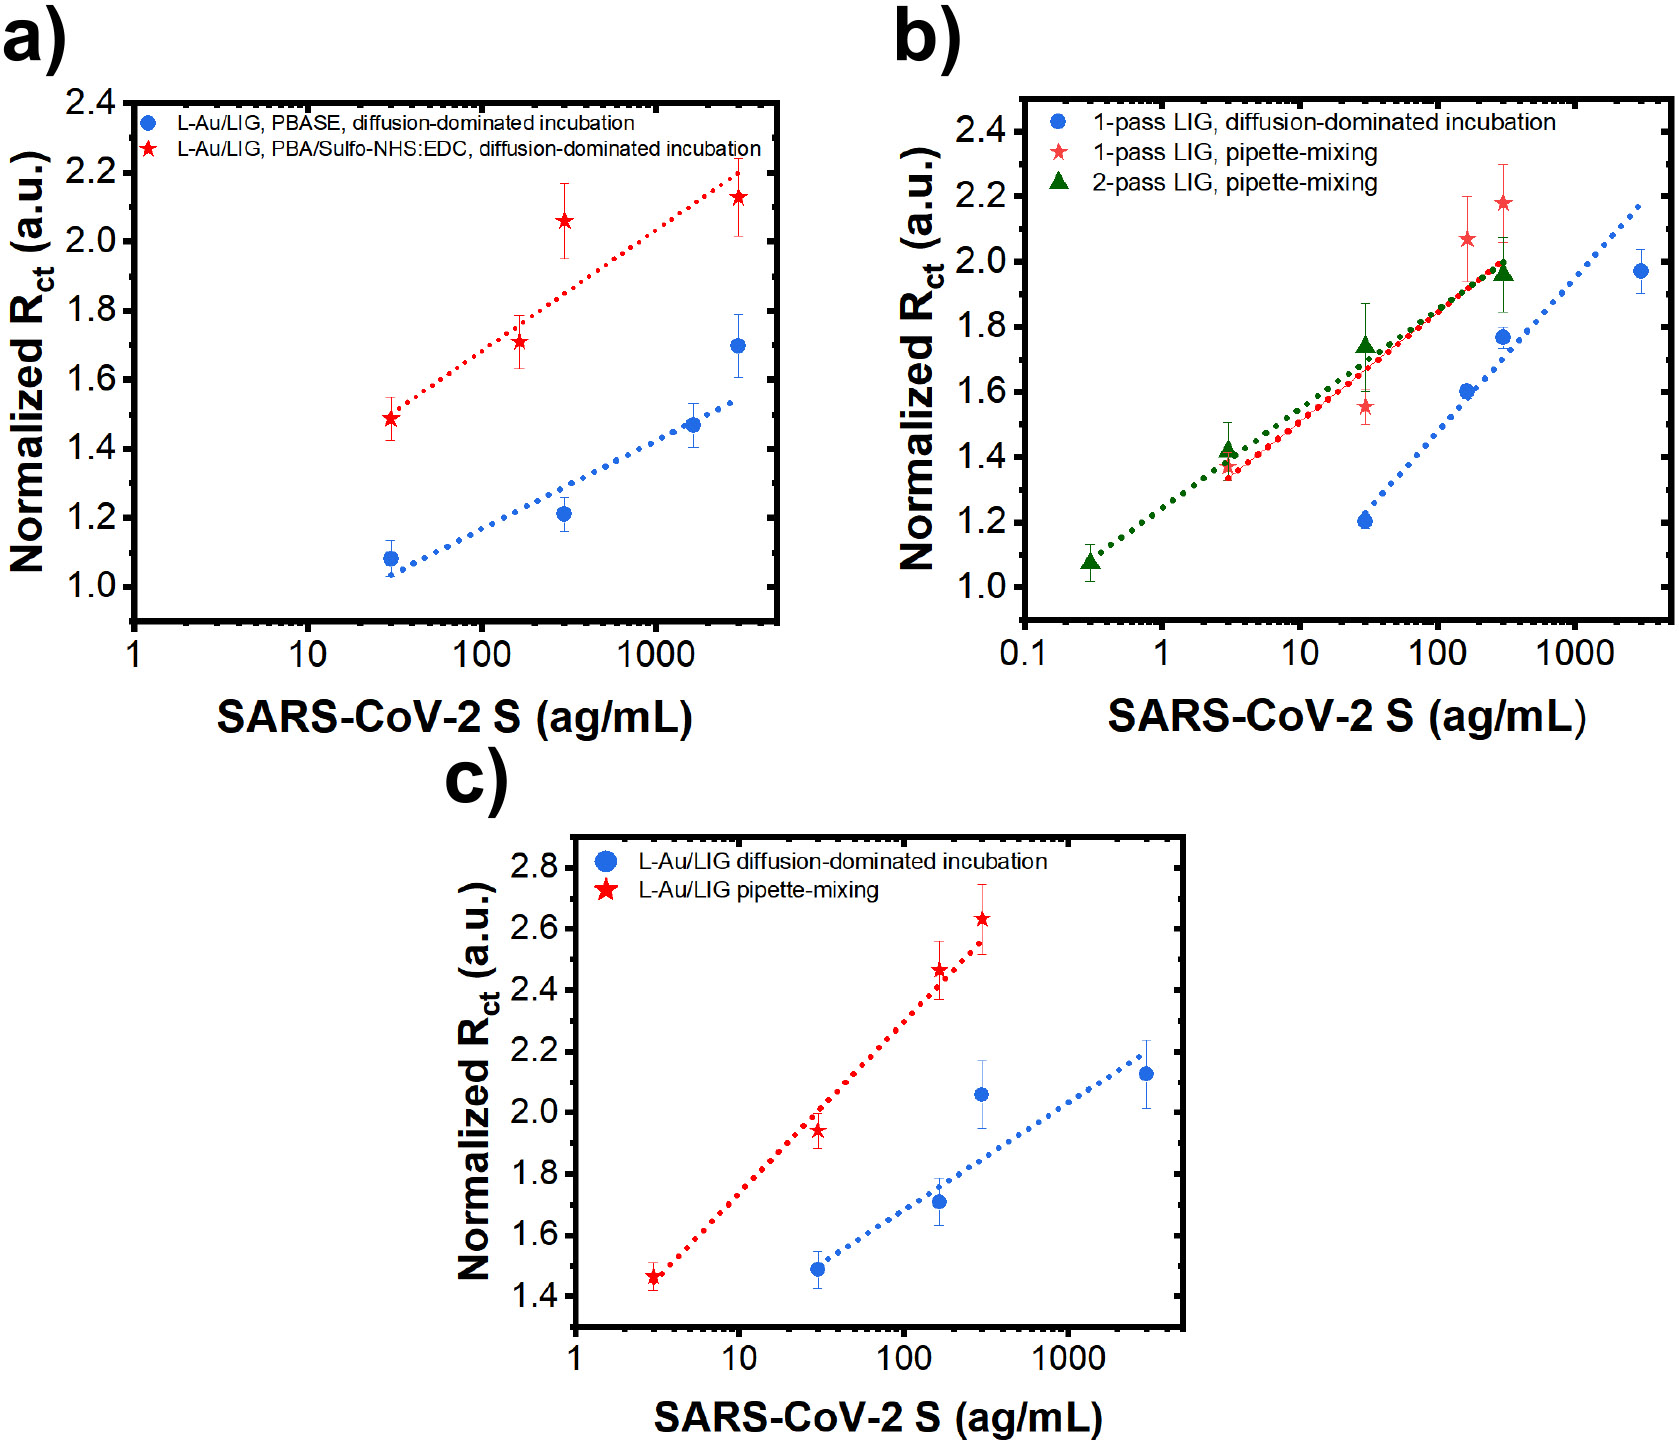
(a) Charge transfer resistance () of L-Au/LIG sensors (normalized w.r.t. of samples after BSA treatment) in response to various concentrations of SARS-CoV-2 antigen in PBS using PBASE vs. PBA/Sulfo-NHS: EDC crosslinkers. Sensors are incubated with antigen using the diffusion method. Data are presented as mean (n=12). Error bars are standard error of the mean (S.E.M.). (b) Normalized of 1-pass LIG and 2-pass LIG sensors (with PBA linker chemistry) in response to various concentrations of SARS-CoV-2 antigen in PBS using diffusion-dominated incubation vs. pipette-mixing methods. Data are presented as mean (n=12). Error bars are S.E.M. (c) Normalized of L-Au/LIG sensors in response to various concentrations of SARS-CoV-2 antigen in PBS using diffusion-dominated incubation vs. pipette-mixing methods. Data are presented as mean (n=12). Error bars are S.E.M.
Building upon the optimized functionalization parameters discussed above, we next investigate the effect of antigen-sensor interaction/incubation: diffusion-dominated incubation vs. pipettemixing. We hypothesize that the pipette-mixing would expedite the transport of antigens to the working electrode surface where the antibodies immobilize them. Our results show that diffusion-dominated incubation yields 42% better sensitivity and 13% lower LOD than pipette-mixing for 1-pass LIG sensors (Fig. 5b). On the other hand, the pipette-mixing method demonstrates 1.6-fold improvement in sensitivity and 5.5-fold lower LOD for L-Au/LIG sensors (Fig. 5c). Importantly, pipette-mixing not only significantly improves sensitivity and LOD of L-Au/LIG sensors compared to diffusion-dominated incubation, but it also yields a more linear response with lower noise (refer to Table S3). Ultimately, L-Au/LIG sensors utilizing pipette-mixing yield the highest sensitivity of all compared sensor conditions and an impressively low LOD of ~1.2 ag..
We believe diffusion-dominated incubation yields a better sensor response for 1-pass LIG and pipette-mixing yields a better response for L-Au/LIG because of the differences in how antibody-antigen immunocomplexes interact with their surface morphology. Antibodies bind to antigens through weak hydrogen bonds, electrostatic interactions and Van der Waals forces.48 Excessive mechanical disruption—via pipette mixing—can physically dislodge antigens from the sensor’s graphene surface, resulting in worsened sensitivity. On the other hand, graphene functionalized with AuNPs, which has a more complex topography and porosity, seems to benefit from mechanical mixing. L-Au/LIG has lower sensitivity than 1-pass LIG when relying on transporting antigens to the sensor surface with diffusion-dominated incubation alone, despite its larger ECSA and increase in available binding sites—perhaps due to its more complex topography and porosity. Pipette mixing may allow antigens to overcome the obstacles of the topography and better reach the available binding sites. Moreover, antibody-antigen immunocomplexes attached to this more complex surface may be more resilient to the mechanical agitation of pipette mixing.
It should be noted that we also initially investigated another Au-functionalization method, electroless deposition (E-Au/LIG). E-Au/LIG differs from L-Au/LIG in its method of AuNP formation. The LIG sensor is first submersed in a 1:100 ratio of HAuCl4: ethanol, causing Au3+ ions to adsorb to the sensor’s surface.49 Adding ascorbic acid to the mixture reduces the Au3+ ions to Au nanoparticles.49 Interestingly, while E-Au/LIG exhibits poor sensitivity and low yield (with 0 out of 4 sensors exhibiting good sensitivity) using the diffusion-dominated incubation (Fig. S2a), their performance was retrieved with 50% yield using pipette-mixing (Fig. S2b). These results underscore the importance of how antigens interact with sensors which is not usually clearly discussed in immunosensor literature. Moving forward, the results are collected using the optimum process, i.e. direct laser-functionalized AuNP LIG carboxylated with PBA/Sulfo-NHS: EDC and utilizing pipette-mixing during antigen incubation.
B. Testing in spiked saliva, selectivity analysis, interrogation with virion-like SARS-CoV-2 mimics
To demonstrate the suitability of the developed sensor for non-invasive detection of infection using saliva samples, we performed experiments using spiked artificial saliva. Human saliva naturally contains electrolytes, which could potentially disrupt molecular sensing.50 The artificial saliva mimicked the electrolyte concentration found in human saliva.51 Despite the presence of the electrolytes, the sensor maintained high sensitivity (S) and a strong linear correlation coefficient (R2), as evidenced by Fig. 6a.
Figure 6. Investigation of the sensor performance in saliva and with virion-like mimics.
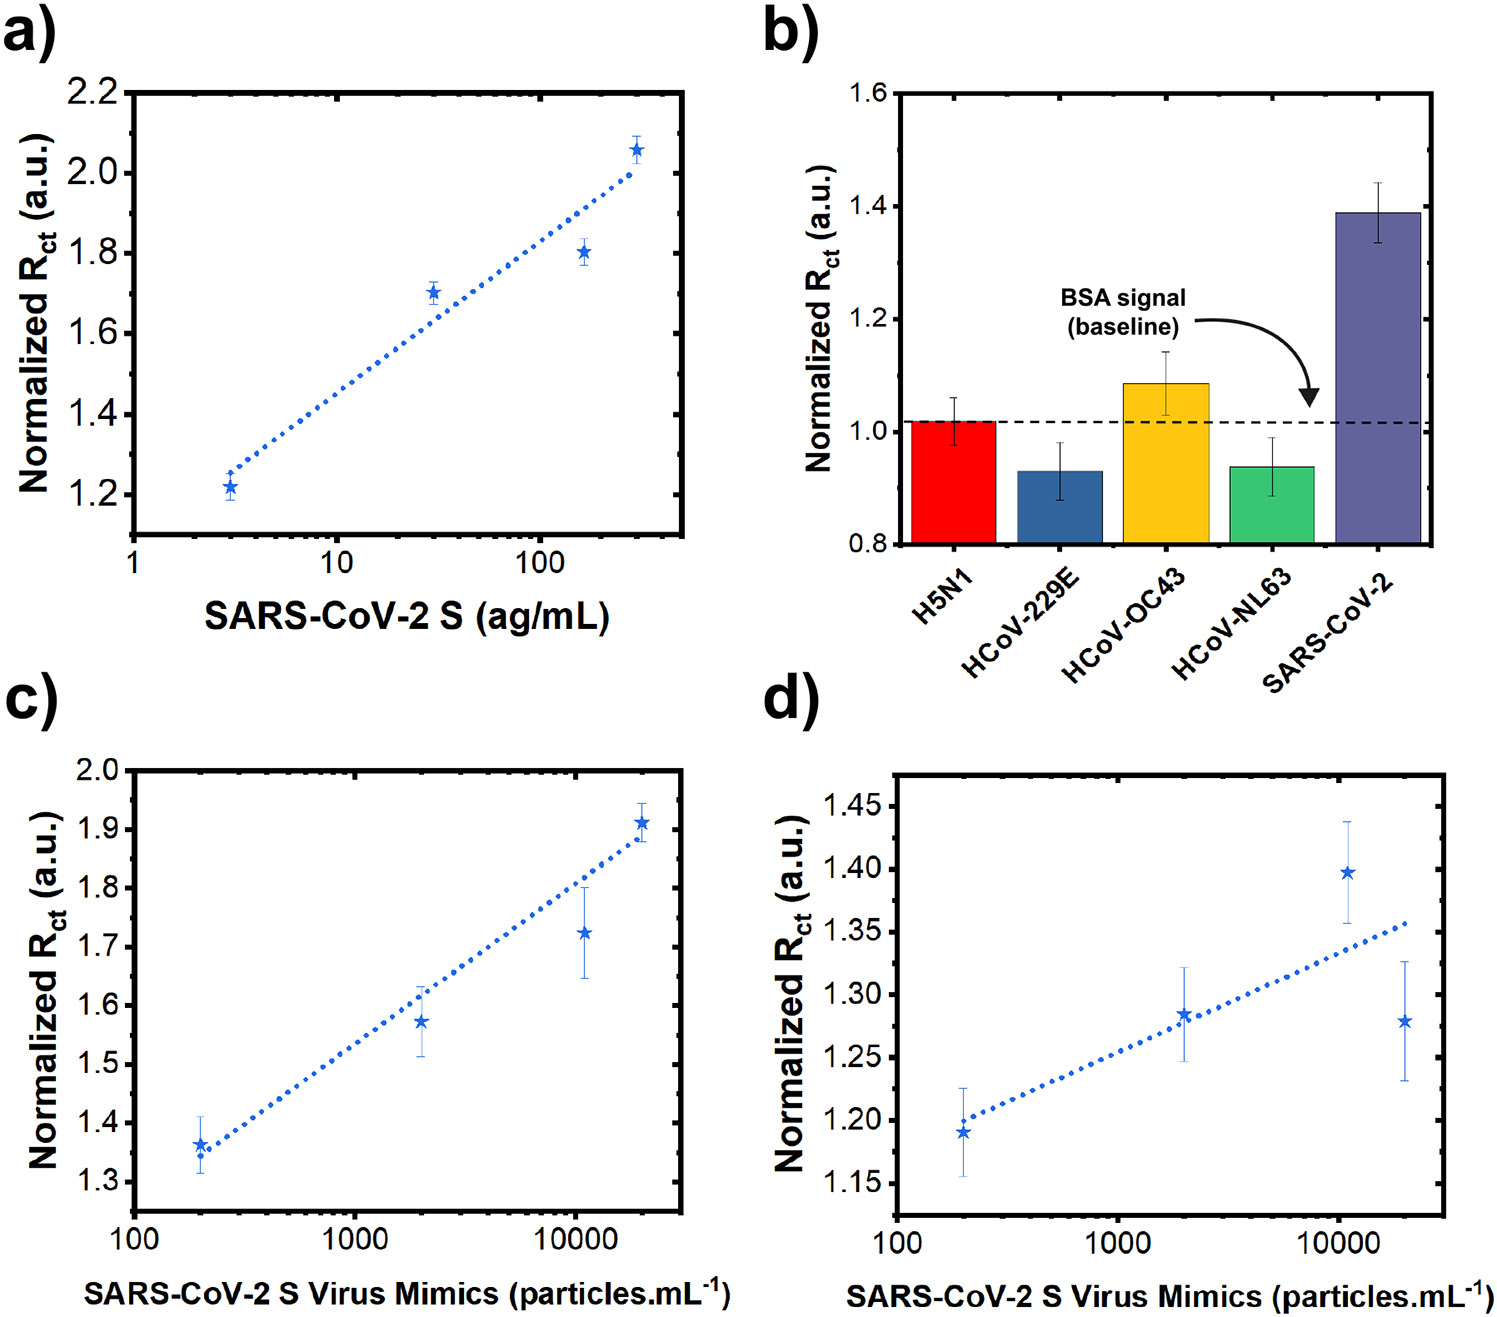
(a) Charge transfer resistance () derived from EIS data (normalized w.r.t. of samples after BSA treatment) after incubation with various concentrations of SARS-CoV-2 antigen in artificial saliva (3—300 ag.). Data are presented as mean (n=9). Error bars are standard error of the mean (S.E.M.). (b) Selective response of L-Au/LIG sensors against 30 ag. concentration of SARS-CoV-2 and non-target antigens. Data are presented as mean (n=9). Error bars are S.E.M. (c) after incubation with various concentrations of SARS-CoV-2 virus mimics in PBS (2 × 10² — 2 × 10⁴ ) using 2-pass WE LIG sensors. Data are presented as mean (n=12). Error bars are S.E.M. (d) after incubation with various concentrations of SARS-CoV-2 virus mimics in PBS (2 × 10²—2 × 10⁴ ) using L-Au/LIG sensors. Data are presented as mean (n=12). Error bars are S.E.M.
To demonstrate the selectivity of the sensors toward SARS-CoV-2, response against non-target molecules is illustrated in Fig. 6b and S4. We examined the specific binding of the SARS-CoV-2 antigen in comparison to similar coronaviruses with varying degrees of sequence homology, such as Influenza A subtype H5N1 (n.d.), HCoV-229E (30%), HCoV-OC43 (33%), HCoV-NL63 (28%), SARS-CoV S1 (76-79%), and MERS-CoV (42-50%).52,53 Notably, there was no significant cross-reaction with HCoV-229E, HCoV-OC43, HCoV-NL63—which are responsible for a large proportion of seasonal common cold infections.54 There is also no significant cross-reactivity with Influenza A subtype H5N1. However, we observed a measurable signal when testing with SARS-CoV S1 and MERS-CoV antigens, which is associated to a significant homology with SARS-CoV-2 spike protein (up to ~80% homology with SARS-CoV spike proteins and up to 50% homology with MERS-CoV). That said, such cross-reactivity is not a major cause for concern because there is not a current outbreak of these viruses.55
In addition, to validate the effectiveness in detecting the target virus particles (i.e. virions), we performed electrochemical tests using negatively-charged virus mimics made of Spike antigen-coated polymer beads with diameter of 100 (similar in size and charge to SARS-CoV-2 virus – See Zeta potential data in Fig. S3a). These mimics closely emulate the virus structure and functionality, offering a more accurate representation of the sensor's performance compared to just the antigen fragments. As shown in Fig. 6c and 6d and summarized in Table S4, ultralow counts of the virus down to ~5 particles/mL can be detected using the 2-pass LIG. On the other hand, the L-Au/LIG sensor has poor linearity (r2=0.26), and thus its sensitivity and LOD cannot be quantitatively determined. To elucidate why the response of the 2-pass LIG sensor to virus mimics is better than the L-Au/LIG sensor, we measured the Zeta potential of the two materials. Fig. S3b illustrates the more negatively charged surface of the L-Au/LIG sensor compared to the 2-pass sensor. Thus, the reason for poorer response of L-Au/LIG compared to LIG is believed to be due to electrostatic repulsion between negatively charged virion mimics and the Au-LIG surface.
Overall, as summarized in Table S5, the obtained LOD of the optimized Au-LIG sensor is superior compared to previously reported sensors for detecting antigen fragments. Moreover, compared to the existing reports which mostly just focus on antigen fragments, our work takes a step further by testing the sensors using virion-like particle mimics which better represent the real infection.
3. Conclusion
In this study, we demonstrate electrochemical sensors based on LIG functionalized with Au nanostructures using direct laser processing for the rapid and selective detection of SARS-CoV-2. By systematically exploring various functionalization parameters—such as gold precursor concentration, crosslinker chemistry, and incubation and antigen mixing conditions—we optimized the sensitivity and LOD of our sensors and obtained and ~1.2 , respectively. We found that a HAuCl4: DI water precursor concentration of 1:100 enhances the ECSA by 4.5-fold compared to the geometric area. Additionally, we found that PBA/Sulfo-NHS: EDC improves sensitivity and LOD by 34% and 22% compared to PBASE. Moreover, using pipette-mixing for antigen incubation (compared to diffusion-dominated mixing), we achieved sensitivity enhancement of 1.6-fold, LOD enhancement of 5.5-fold, and multimodal EIS and DPV readout. To demonstrate the ability to analyze real samples, we tested the sensors with artificial saliva as well as virion-like SARS-CoV-2 mimics (polymer beads coated with SARS-CoV-2 Spike protein and with a similar size and charge as the SARS-CoV-2 virions), which more accurately model the real infection compared to antigen fragments. This study offers valuable guidelines for researchers to optimize the fabrication of various graphene-based sensors (beyond just electrochemical devices) that utilize the immobilization of capture molecules (antibodies, DNA, fragments, aptamers, etc.) for a wide range of biological analytes (antigens, proteins, nucleic acids, neurotransmitters, etc.)
4. Experimental details
A. Materials and Reagents
Polyimide (PI) sheets were purchased from American Durafilm Co., Inc. (Kapton HN, 500 mils). Gold (III) chloride solution (CAS: 16903-35-8), sodium chloride (CAS: 7647-14-5), L-ascorbic acid (CAS: 50-81-7), calcium chloride (CAS: 10043-52-4), potassium chloride (CAS: 7447-40-7), citric acid (CAS: 77-92-9), potassium thiocyanate (CAS: 333-20-0), ammonium chloride (CAS: 12125-02-9), 1-Pyrenebutyric acid (CAS: 3443-45-6), Sulfo-NHS (N-Hydroxysulfosuccinimide sodium salt) (CAS: 106627-54-7), Bovine Serum Albumin (CAS: 9048-46-8), Tween 20 (CAS: 9005-64-5), N,N-Dimethylformamide (DMF) (CAS: 66-12-2), MES (CAS: 145224-94-8), Glycine (CAS: 56-40-6), and Sodium Azide (CAS: 26628-22-8) were purchased from Sigma Aldrich. EDC (1-ethyl-3-(3-dimethylaminopropyl) carbodiimide hydrochloride) (CAS: 22980) was purchased from Thermofisher. PBASE (1-Pyrenebutanoic Acid Succinimidyl Ester) was purchased from Chem Cruz. 2-propanol (IPA) was purchased from J.T. Baker (CAS: 67-63-0). DPBS (Dulbecco’s Phosphate buffered saline) (CAS: 20-030-CV) was purchased from Corning. Ethanol (Koptec, 200 proof) was purchased from Decon Labs (CAS: V1016). SARS-CoV-2 (2019 nCoV) Spike S2 Antibody Affinity Purified (CAS: 40590-T62), Influenza A H5N1 (A/Hubei/1/2010) Neuraminidase / NA (His Tag) (CAS: 40018-V07H), Human coronavirus (HCoV-229E) Spike/S1 Protein (S1 Subunit, His Tag) (CAS: 40601-V0BH), Human coronavirus (HCoV-OC43) Spike S1 Protein (His Tag) (CAS: 40607-V08H1), Human coronavirus (HCoV-NL63) Spike/S1 Protein (S1 Subunit, HIS Tag) (CAS: 40600-V08H), SARS-CoV Spike/S1 Protein (S1 Subunit, His Tag) (CAS: 40150-V08B1), MERS-CoV Spike/S1 Protein (S1 Subunit, aa 1-725, His Tag) (CAS: 40069-V0BH) were purchased from Sino Biological. SARS-CoV-2 S Protein HIS Tag (CAS: 103871-150) was purchased from VWR International, LLC. CML Latex Beads, 4% w/v, 0.1 um (CAS: C37479) were purchased from ThermoFisher Scientific (CAS: F8803). Ecoflex 5, Smooth-On, Inc. was purchased from Amazon. Silver conductive epoxy adhesive was purchased from MG Chemicals (CAS:8331D-14G).
B. Sensor preparation and functionalization of laser induced graphene (LIG)
We designed a three-electrode graphene sensor pattern with a working electrode (WE; L-Au/LIG), a counter electrode (CE; LIG), and a reference electrode (RE; Ag/AgCl paste on LIG) in AutoCAD. A 30-W CO2 laser engraving machine (VSL2.30, Universal Laser Systems) converts PI sheets to LIG. To prepare the polyimide sheet for laser writing, we rinsed it with 2-propanol (IPA), dried it with Kimwipes, and then fixed it to a glass substrate using double-sided adhesive tape. The laser ablates the PI sheets using the following fabrication parameters: 12.6% power, 5.5% speed, 1000 points per inch (PPI) resolution, in raster mode at a focused height of 0.040. For the fabrication of L-Au/LIG, different concentrations (1:1000, 5:1000, 1:100, 5:100) of HAuCl4 solution in DI water were prepared. After patterning the WE with the CO2 laser, we drop-cast a 5 μ aliquot of HAuCl4: DI water mixture onto the WE and dried with a fan for 10 minutes. Gold nanoparticles form as an additional laser scribing step prints a second layer of the WE over the first layer. We also patterned the CE and RE in this step. For the fabrication of E-Au/LIG, we submersed the three electrode LIG sensor in a 1:100 ratio of HAuCl4 in ethanol for 30 minutes. After adding ascorbic acid to the mixture to bring the concentration to 1 mM, we left the LIG sensor for an additional hour. Finally, we applied silicone (Ecoflex 5, Smooth-On, Inc.) between the sensor region and the electrical contact pads to passivate the sensor.
C. Characterization of the functionalized LIG electrodes
Scanning electron microscopy (SEM) micrographs were taken using a ThermoFisher Q250 instrument with a 6,500× magnification. X-ray photoelectron spectroscopy (XPS) measurements were carried out using a Physical Electronics VersaProbe II instrument (Chanhassen, MN). An Al Kα X-ray source was used at 45° takeoff angle. Charge neutralization was achieved using low energy (<5 eV) electrons and Ar ions. Raman spectroscopy was carried out using a Horiba LabRam instrument (Kyoto, Japan) with a 50× objective and 300 gr/mm grating. A 532 nm laser operating at 25% of 110mW was used. Raman spectra were analyzed using the LabSpec 6 software and XPS spectra were analyzed using CasaXPS.
D. Zeta potential of LIG electrodes
To determine the surface charge of the LIG and L-Au/LIG, graphene powder was prepared by scraping 2-pass LIG or L-Au/LIG from the polyimide surface, as previously described,56 and then suspended in DIW. 1 mL of the graphene powder suspension was injected into a capillary cell and its zeta potential measured using a Zetasizer Nano ZS apparatus (Malvern Instruments Ltd.) with an equilibrium time of 2 minutes at room temperature.
E. Electrode functionalization with PBASE crosslinker
To activate carboxylic groups on the electrode surface,32 we drop-cast 10 μ of 2.0 mM PBASE in methanol on the WE. After incubating the sensor for 1.5 hours in a humid chamber (97% humidity), we rinsed it with phosphate-buffered saline (PBS) to remove the unbound reagent. Next, we prepared a 1:2000 ratio of SARS-CoV-2 (2019 nCoV) Spike S2 Antibody to 0.1% Tween 20 detergent dissolved in PBS. We drop-cast 10 μ of this antibody solution onto the WE, and incubated the sensor for 3 hours at 4 °C. After incubation, we rinsed the sensors with PBS to remove excess and unbound proteins. We drop-cast 10 μ of 0.1 % BSA and 0.1% Tween 20 detergent in PBS on the WE and incubated the sensor for 1.5 hours in ambient room temperature to block unbound free sites on the surface of the electrode. We again rinsed the electrodes with PBS. Finally, the sensors were ready for limit of detection and sensitivity studies.
F. Electrode functionalization with PBA and Sulfo-NHS: EDC
To activate carboxylic groups on the electrode surface,57 we drop-cast 10 μ of 5.0 mM PBA in DMF on the graphene surface and incubated for 2 hours at room temperature in a humid chamber (97% humidity). After rinsing with DMF, IPA, and deionized (DI) water and then drying under nitrogen airflow, we drop-cast a 10 μ aliquot of a solution containing 0.4 M EDC and 0.1 M sulfo-NHS in 0.025 M MES (pH 6.5) on the WE. We incubated the sensor in a humid chamber for 35 minutes. The sensors were then functionalized with antibodies and BSA as described in the preceding section.
G. Preparation of artificial saliva
The artificial saliva was composed of 5 mM NaCl, 1 mM of CaCl2, 15 mM of KCL, 1 mM of citric acid, 1.1 mM of KSCN, and 4 mM of NH4Cl in DI water. HCL and NaOH were used to bring the pH to 6.7 (the pH of human saliva).58
H. Preparation of SARS-CoV-2 antigen-coated polymer mimics
We prepared virus mimics by first dissolving 10 μ of SARS-CoV-2 S protein with 600 μ concentration in 720 μL of 50 mM MES buffer (pH 6.0) to make a 0.1 mg. protein solution. We then added 270 μL of a 2% aqueous suspension of 100 carboxylate-modified microspheres to the protein solution and then left to incubate for 15 minutes. After incubation, we added 10 of EDAC into the mixture and then mixed initially via vortex and then for 2 h on a rocker orbital shaker. To mitigate agglomeration of the microsphere particles, we adjusted the pH to 6.5. At this point, we added glycine to achieve a concentration of 100 , which quenches the reaction. We then incubated the mixture for 30 minutes. Next, we centrifuged the protein-labeled microsphere particles from unreacted protein at 25,000 × for 30–60 minutes. After resuspending the pellet in 1 mL of 50 mM PBS by gentle vortex, we centrifuged again at 25,000 × for 30–60 minutes. This washing step was repeated twice more. After washing, the protein-conjugated microspheres were resuspended in 100 μL of 50 PBS with 1% BSA to form a stable suspension. Finally, we added sodium azide — a preservative59 — to achieve a concentration of 2 and stored the protein-conjugated microspheres at 4°C until use. The successful construction of the SARS-CoV-2 mimics were confirmed using Flow Cytometry (for details, see60).
I. Electrochemical testing
To prepare for electrochemical measurements with the multi-channel potentiostat (MultiPalmSens4, PalmSens), we painted Ag/AgCl paste on the RE. We electrochemically characterized the sensors using cyclic voltammetry (CV) with an applied window of −1 to 1 and a scan rate of 30 ; differential pulse voltammetry (DPV) measurements applied a potential window of −0.5 to 1 and a scan rate of 30 ; and electrochemical impedance spectroscopy (EIS) measurements applied a frequency range of 10 to 10,000 . We used 5 ferricyanide-ferrocyanide in DI water (12.9 . cm) as the redox probe.
The sensors were tested using varying concentrations of SARS-CoV-2 spike protein antigen or virion-like mimics via serial dilution. We exposed the sensors to the lowest concentration of the antigen first. 100 μ of the lowest concentration antigen solution was drop-casted on the working electrode of each sensor and was either left to incubate statically for 15 minutes (i.e. diffusion-dominated incubation) or was pipette-mixed for 30 every 5 minutes for a total of 15 minutes to transport the antigens to the WE surface. After 15 minutes, the sensor was rinsed with phosphate-buffered saline (PBS) to remove unbound antigens. Next, DPV and EIS tests were performed. Each test was scanned three times for replicability, as the current response/impedance response can vary between scans. After these electrochemical tests, the sensors were rinsed with PBS to remove electrolyte residue. Then, the next highest concentration of antigen was tested. Because the previous concentrations of antigen that the sensor was exposed is a minimum of one order of magnitude smaller than the concentration being tested, they do not interfere with the electrochemical tests.
Supplementary Material
Acknowledgment
The authors would like to acknowledge the partial support from the Center for Atomically Thin Multifunctional Coatings (ATOMIC, a National Science Foundation I/UCRC program, award #1540018) and National Institutes of Health (award# R21EB031354). The content of this report is solely the responsibility of the authors and does not necessarily represent the official views of the National Science Foundation (NSF) or National Institutes of Health (NIH). The authors declare no conflicts of interest.
Footnotes
Supporting Information. Comparison of surface modification, limit of detection, sensitivity, and selectivity among other graphene-based COVID-19 sensing platforms; electrochemical characterization of 1-pass LIG, 2-pass LIG, and L-Au/LIG; studies on effect of crosslinker and antibody incubation environment on antibody surface coverage density; studies on effect of mixing method for E-Au/LIG sensors; calibration curve values of sensors in response to antigen in buffer and artificial saliva, as well as virus mimics; cross-reactivity data for the optimized sensor's response to SARS-CoV S1 and MERS-CoV S1.
References
- (1).Coronavirus Disease (COVID-19). World Health Organization. https://www.who.int/health-topics/coronavirus (accessed 2023-11-20). [Google Scholar]
- (2).Davis HE; McCorkell L; Vogel JM; Topel EJ Long COVID: Major Findings, Mechanisms and Recommendations. Nat. Rev. Microbiol 2023, 21 (3), 1–14. 10.1038/s41579-022-00846-2. [DOI] [PMC free article] [PubMed] [Google Scholar]
- (3).Xie Y; Xu E; Bowe B; Al-Aly Z Long-Term Cardiovascular Outcomes of COVID-19. Nat. Med 2022, 28 (28), 1–8. 10.1038/s41591-022-01689-3. [DOI] [PMC free article] [PubMed] [Google Scholar]
- (4).Xie Y; Al-Aly Z Risks and Burdens of Incident Diabetes in Long COVID: a Cohort Study. Lancet Diabetes Endocrinol. 2022, 10 (5), 311–321. 10.1016/s2213-8587(22)00044-4. [DOI] [PMC free article] [PubMed] [Google Scholar]
- (5).Mahler DG; Yonzan N; Lakner C The Impact of COVID-19 on Global Inequality and Poverty. Policy Res. Work. Pap 2022. 10.1596/1813-9450-10198. [DOI] [Google Scholar]
- (6).Markandan K; Tiong YW; Sankaran R; Subramanian S; Markandan UD; Chaudhary V; Numan A; Khalid M; Walvekar R Emergence of Infectious Diseases and Role of Advanced Nanomaterials in Point-of-Care Diagnostics: A Review. Biotechnol. Genet. Eng. Rev 2022, 1–89. 10.1080/02648725.2022.2127070. [DOI] [PubMed] [Google Scholar]
- (7).Teymouri M. Recent Advances and Challenges of RT-PCR Tests for the Diagnosis of COVID-19. Pathol. Res. Pract 2021, 221, 153443. 10.1016/j.prp.2021.153443. [DOI] [PMC free article] [PubMed] [Google Scholar]
- (8).Høeg TB; Prasad V Rapid Antigen Testing for COVID-19: Decreasing Diagnostic Reliability, Potential Detrimental Effects and a Lack of Evidence to Support Continued Public Funding of Community-Based Testing. Public Health Pract. 2023, 6, 100451. 10.1016/j.puhip.2023.100451. [DOI] [PMC free article] [PubMed] [Google Scholar]
- (9).Jalandra R; Yadav AK; Verma D; Dalal N; Sharma M; Singh R; Kumar A; Solanki PR Strategies and Perspectives to Develop SARS-CoV-2 Detection Methods and Diagnostics. Biomed. Pharmacother 2020, 129, 110446. 10.1016/j.biopha.2020.110446. [DOI] [PMC free article] [PubMed] [Google Scholar]
- (10).Liu G; Rusling JF COVID-19 Antibody Tests and Their Limitations. ACS Sens. 2021, 6 (3), 593–612. 10.1021/acssensors.0c02621. [DOI] [PubMed] [Google Scholar]
- (11).Pagneux Q; Roussel A; Saada H; Cambillau C; Amigues B; Delauzun V; Engelmann I; Alidjinou EK; Ogiez J; Rolland AS; Faure E; Poissy J; Duhamel A; Boukherroub R; Devos D; Szunerits S SARS-CoV-2 Detection Using a Nanobody-Functionalized Voltammetric Device. Commun. Med 2022, 2 (1). 10.1038/s43856-022-00113-8. [DOI] [PMC free article] [PubMed] [Google Scholar]
- (12).Kowalczyk A; Demkow U; Kasprzak A; Ruzycka-Ayoush M; Grudzinski IP; Nowicka AM Ultrasensitive Voltammetric Detection of SARS-CoV-2 in Clinical Samples. Sens. Actuators B Chem 2022, 371, 132539. 10.1016/j.snb.2022.132539. [DOI] [PMC free article] [PubMed] [Google Scholar]
- (13).Liv L; Çoban G; Nakiboğlu N; Kocagöz T A Rapid, Ultrasensitive Voltammetric Biosensor for Determining SARS-CoV-2 Spike Protein in Real Samples. Biosens. Bioelectron 2021, 192, 113497. 10.1016/j.bios.2021.113497. [DOI] [PMC free article] [PubMed] [Google Scholar]
- (14).Kiewa L-V; Chang C-Y; Huang S-Y; Wang P-W; Hehi CH; Liu C-T; Cheng C-H; Lu Y-X; Chen Y-C; Huang Y-X; Chang S-Y; Tsa H-Y; Kung Y-A; Huang P-N; Hsu M-H; Leon B-F; Foo Y-Y; Su C-H; Hsu K-C; Huang P-H; Ngr C-J; Kamarulzaman A; Yuan C-J; Shieh D-B; Shih S-R; Chung L-Y; Chang C-C Development of Flexible Electrochemical Impedance Spectroscopy-Based Biosensing Platform for Rapid Screening of SARS-CoV-2 Inhibitors. Biosens. Bioelectron 2021, 183, 113213. 10.1016/j.bios.2021.113213. [DOI] [PMC free article] [PubMed] [Google Scholar]
- (15).Rashed MZ; Kopechek JA; Priddy MC Rapid Detection of SARS-CoV-2 Antibodies Using Electrochemical Impedance-Based Detector. Biosens. Bioelectron 2021, 171, 112709. 10.1016/j.bios.2020.112709. [DOI] [PMC free article] [PubMed] [Google Scholar]
- (16).Liao X; Qin Z; Fu H; Li T; Peng R; Li Z; Rini JM; Liu X Enhancing the Performance of Paper-Based Electrochemical Impedance Spectroscopy Nanobiosensors: An Experimental Approach. Biosens. Bioelectron 2021, 177, 112672. 10.1016/j.bios.2020.112672. [DOI] [PMC free article] [PubMed] [Google Scholar]
- (17).Wasfi A; Awwad F; Qamhieh N; Al Murshidi B; Palakkott AR; Gelovani JG Real-Time COVID-19 Detection via Graphite Oxide-Based Field-Effect Transistor Biosensors Decorated with Pt/Pd Nanoparticles. Sci. Rep 2022, 12 (1), 18155. 10.1038/s41598-022-22249-2. [DOI] [PMC free article] [PubMed] [Google Scholar]
- (18).Seo G; Lee MJ; Kim S-H; Choi M; Ku KB; Lee C-S; Jun S; Park D; Kim HG; Kim S-J; Lee J-O; Kim BT; Chang E; Park K; Kim SI Rapid Detection of COVID-19 Causative Virus (SARS-CoV-2) in Human Nasopharyngeal Swab Specimens Using Field-Effect Transistor-Based Biosensor. ACS Nano 2020, 14 (4), 5135–5142. 10.1021/acsnano.0c02823. [DOI] [PubMed] [Google Scholar]
- (19).Shahdeo D; Chauhan N; Majumdar A; Ghosh A; Gandhi S Graphene-Based Field-Effect Transistor for Ultrasensitive Immunosensing of SARS-CoV-2 Spike S1 Antigen. ACS Appl. Bio Mater 2022, 5 (7), 3563–3572. 10.1021/acsabm.2c00503. [DOI] [PubMed] [Google Scholar]
- (20).Wu S; He Q; Tan C; Wang Y; Zhang H Graphene-Based Electrochemical Sensors. Small 2013, 9 (8), 1160–1172. 10.1002/smll.201202896. [DOI] [PubMed] [Google Scholar]
- (21).Butler D; Sankhe CS; Khamsi PS; Gomez EW; Ebrahimi A Solution-Processed Graphene Films for Electrochemical Monitoring of Extracellular Nitric Oxide Released by Breast Cancer Cells. 2D Mater. 2023, 11 (1), 015021. 10.1088/2053-1583/ad1251. [DOI] [Google Scholar]
- (22).Zhou K; Kammarchedu V; Butler D; Khamsi PS; Ebrahimi A Electrochemical Sensors Based on MoSx-Functionalized Laser-Induced Graphene for Real-Time Monitoring of Phenazines Produced by Pseudomonas aeruginosa. Adv. Healthc. Mater 2022, 11 (19). 10.1002/adhm.202200773. [DOI] [PMC free article] [PubMed] [Google Scholar]
- (23).Chen H; Chen P; Huang J; Selegård R; Platt M; Palaniappan A; Aili D; Tok AIY; Liedberg B Detection of Matrilysin Activity Using Polypeptide Functionalized Reduced Graphene Oxide Field-Effect Transistor Sensor. Anal. Chem 2016, 88 (6), 2994–2998. doi: 10.1021/acs.analchem.5b04663. [DOI] [PubMed] [Google Scholar]
- (24).Asif M; Aziz A; Ashraf G; Iftikhar T; Sun Y; Xiao F Unveiling Microbiologically Influenced Corrosion Engineering to Transfigure Damages into Benefits: A Textile Sensor for H2O2 Detection in Clinical Cancer Tissues. Chem. Eng. J 2022, 427, 131398. 10.1016/j.cej.2021.131398. [DOI] [Google Scholar]
- (25).Kim S; Ryu H; Tai S; Pedowitz M; Rzasa JR; Pennachio DJ; Hajzus JR; Milton DK; Myers-Ward R; Daniels KM Real-Time Ultra-Sensitive Detection of SARS-CoV-2 by Quasi-Freestanding Epitaxial Graphene-Based Biosensor. Biosens. Bioelectron 2022, 197, 113803. 10.1016/j.bios.2021.113803. [DOI] [PMC free article] [PubMed] [Google Scholar]
- (26).Jaewjaroenwattana J; Phoolcharoen W; Pasomsub E; Teengam P; Chailapakul O Electrochemical Paper-Based Antigen Sensing Platform Using Plant-Derived Monoclonal Antibody for Detecting SARS-CoV-2. Talanta 2023, 251, 123783. 10.1016/j.talanta.2022.123783. [DOI] [PMC free article] [PubMed] [Google Scholar]
- (27).Lin J; Peng Z; Liu Y; Ruiz-Zepeda F; Ye R; Samuel ELG; Yacaman MJ; Yakobson BI; Tour JM Laser-Induced Porous Graphene Films from Commercial Polymers. Nat. Commun 2014, 5 (1), 5714. 10.1038/ncomms6714. [DOI] [PMC free article] [PubMed] [Google Scholar]
- (28).Torrente-Rodríguez RM; Lukas H; Tu J; Xu C; Rossiter HB; Gao W SARS-CoV-2 RapidPlex: A Graphene-Based Multiplexed Telemedicine Platform for Rapid and Low-Cost COVID-19 Diagnosis and Monitoring. Matter 2020, 3 (6), 1981–1998. 10.1016/j.matt.2020.09.027. [DOI] [PMC free article] [PubMed] [Google Scholar]
- (29).Cui T-R; Qiao Y-C; Gao J-W; Wang C-H; Zhang Y; Han L; Yang Y; Ren T-L Ultrasensitive Detection of COVID-19 Causative Virus (SARS-CoV-2) Spike Protein Using Laser Induced Graphene Field-Effect Transistor. Molecules 2021, 26 (22), 6947. 10.3390/molecules26226947. [DOI] [PMC free article] [PubMed] [Google Scholar]
- (30).Alafeef M; Dighe K; Moitra P; Pan D Rapid, Ultrasensitive, and Quantitative Detection of SARS-CoV-2 Using Antisense Oligonucleotides Directed Electrochemical Biosensor Chip. ACS Nano 2020, 14 (12), 17028–17045. 10.1021/acsnano.0c06392. [DOI] [PMC free article] [PubMed] [Google Scholar]
- (31).Sadique MA; Yadav S; Ranjan P; Khan R; Khan F; Kumar A; Biswas D Highly Sensitive Electrochemical Immunosensor Platforms for Dual Detection of SARS-CoV-2 Antigen and Antibody Based on Gold Nanoparticle Functionalized Graphene Oxide Nanocomposites. ACS Appl. Bio Mater 2022, 5 (5), 2421–2430. 10.1021/acsabm.2c00301. [DOI] [PubMed] [Google Scholar]
- (32).Ferrari AC; Meyer JC; Scardaci V; Casiraghi C; Lazzeri M; Mauri F; Piscanec S; Jiang D; Novoselov KS; Roth S; Geim AK Raman Spectrum of Graphene and Graphene Layers. Phys. Rev. Lett 2006, 97 (18), 187401. 10.1103/physrevlett.97.187401. [DOI] [PubMed] [Google Scholar]
- (33).De la Roche J; López-Cifuentes I; Jaramillo-Botero A Influence of Lasing Parameters on the Morphology and Electrical Resistance of Polyimide-Based Laser-Induced Graphene (LIG). Carbon Lett. 2022, 33 (2), 587–595. 10.1007/s42823-022-00447-2. [DOI] [Google Scholar]
- (34).Zhou K; Kammarchedu V; Ebrahimi A Direct Laser-Functionalized Au-LIG Sensors for Real-Time Electrochemical Monitoring of Response of Pseudomonas Aeruginosa Biofilms to Antibiotics. ECS Sensors Plus 2023, 2 (4), 041601. 10.1149/2754-2726/ad08d4. [DOI] [Google Scholar]
- (35).Fan R; Li Y; Park K-W; Du J; Chang LH; Strieter ER; Andrew TL A Strategy for Accessing Nanobody-Based Electrochemical Sensors for Analyte Detection in Complex Media. ECS Sensors Plus 2022, 1 (1), 010601. 10.1149/2754-2726/ac5b2e. [DOI] [PMC free article] [PubMed] [Google Scholar]
- (36).Magar HS; Hassan RYA; Mulchandani A Electrochemical Impedance Spectroscopy (EIS): Principles, Construction, and Biosensing Applications. Sensors 2021, 21 (19), 6578. 10.3390/s21196578. [DOI] [PMC free article] [PubMed] [Google Scholar]
- (37).Mishyn V; Hugo A; Rodrigues T; Aspermair P; Happy H; Marques L; Hurot C; Othmen R; Bouchiat V; Boukherroub R; Knoll W; Szunerits S The Holy Grail of Pyrene-Based Surface Ligands on the Sensitivity of Graphene-Based Field Effect Transistors. Sensors Diagn. 2022, 1 (2), 235–244. 10.1039/D1SD00036E. [DOI] [Google Scholar]
- (38).Schroeder B; Le Xuan H; Völzke JL; Weller MG Preactivation Crosslinking—An Efficient Method for the Oriented Immobilization of Antibodies. Methods Protoc. 2019, 2 (2), 35. 10.3390/mps2020035. [DOI] [Google Scholar]
- (39).Butreddy A; Janga KY; Ajjarapu S; Sarabu S; Dudhipala N Instability of Therapeutic Proteins — An Overview of Stresses, Stabilization Mechanisms and Analytical Techniques Involved in Lyophilized Proteins. Int. J. Biol. Macromol 2021, 167, 309–325. 10.1016/j.ijbiomac.2020.11.188. [DOI] [PubMed] [Google Scholar]
- (40).Reverberi R; Reverberi L Factors Affecting the Antigen-Antibody Reaction. Blood Transfus. 2007, 5 (4), 227–240. 10.2450/2007.0047-07. [DOI] [PMC free article] [PubMed] [Google Scholar]
- (41).Nguyen NHL; Kim S; Lindemann G; Berry V COVID-19 Spike Protein Induced Phononic Modification in Antibody-Coupled Graphene for Viral Detection Application. ACS Nano 2021, 15 (7), 11743–11752. 10.1021/acsnano.1c02549. [DOI] [PubMed] [Google Scholar]
- (42).Macchia E; Kovács-Vajna ZM; Loconsole D; Sarcina L; Redolfi M; Chironna M; Torricelli F; Torsi L A Handheld Intelligent Single-Molecule Binary Bioelectronic System for Fast and Reliable Immunometric Point-of-Care Testing. Sci. Adv 2022, 8 (27). 10.1126/sciadv.abo0881. [DOI] [PMC free article] [PubMed] [Google Scholar]
- (43).Yakoh A; Pimpitak U; Rengpipat S; Hirankarn N; Chailapakul O; Chaiyo S Paper-Based Electrochemical Biosensor for Diagnosing COVID-19: Detection of SARS-CoV-2 Antibodies and Antigen. Biosens. Bioelectron 2021, 176, 112912. 10.1016/j.bios.2020.112912. [DOI] [PMC free article] [PubMed] [Google Scholar]
- (44).Fenzl C; Nayak P; Hirsch T; Wolfbeis OS; Alshareef HN; Baeumner AJ Laser-Scribed Graphene Electrodes for Aptamer-Based Biosensing. ACS Sens. 2017, 2 (5), 616–620. 10.1021/acssensors.7b00066. [DOI] [PubMed] [Google Scholar]
- (45).Tsang DKH; Lieberthal TJ; Watts C; Dunlop IE; Ramadan S; del Rio Hernandez AE; Klein N Chemically Functionalised Graphene FET Biosensor for the Label-Free Sensing of Exosomes. Sci. Rep 2019, 9 (1), 13946. 10.1038/s41598-019-50412-9. [DOI] [PMC free article] [PubMed] [Google Scholar]
- (46).Maidin NNM; Rahim RA; Abdul Halim NH; Zainol Abidin AS; Ahmad NA; Lockman Z Interaction of Graphene Electrolyte Gate Field-Effect Transistor for Detection of Cortisol Biomarker. AIP Conf. Proc 2018. 10.1063/1.5080835. [DOI] [Google Scholar]
- (47).Lim CY; Owens NA; Wampler RD; Ying Y; Granger JH; Porter MD; Takahashi M; Shimazu K Succinimidyl Ester Surface Chemistry: Implications of the Competition between Aminolysis and Hydrolysis on Covalent Protein Immobilization. Langmuir 2014, 30 (43), 12868–12878. 10.1021/la503439g. [DOI] [PMC free article] [PubMed] [Google Scholar]
- (48).Janeway C. Immunobiology: The Immune System in Health and Disease, 5th ed.; Harcourt Brace & Company: London, 2001. [Google Scholar]
- (49).Dong P; Jiang B; Zheng J A Novel Acetylcholinesterase Biosensor Based on Gold Nanoparticles Obtained by Electroless Plating on Three-Dimensional Graphene for Detecting Organophosphorus Pesticides in Water and Vegetable Samples. Anal. Methods 2019, 11 (18), 2428–2434. 10.1039/c9ay00549h. [DOI] [Google Scholar]
- (50).Goldoni R; Farronato M; Connelly ST; Tartaglia GM; Yeo W-H Recent Advances in Graphene-Based Nanobiosensors for Salivary Biomarker Detection. Biosens. Bioelectron 2021, 171, 112723. 10.1016/j.bios.2020.112723. [DOI] [PMC free article] [PubMed] [Google Scholar]
- (51).Claver JB; Mirón MCV; Capitán-Vallvey LF Disposable Electrochemiluminescent Biosensor for Lactate Determination in Saliva. Analyst 2009, 134 (7), 1423–1432. 10.1039/B821922B. [DOI] [PubMed] [Google Scholar]
- (52).Okba NMA; Müller MA; Li W; Wang C; GeurtsvanKessel CH; Corman VM; Lamers MM; Sikkema RS; de Bruin E; Chandler FD; Yazdanpanah Y; Le Hingrat Q; Descamps D; Houhou-Fidouh N; Reusken CBEM; Bosch B-J; Drosten C; Koopmans MPG; Haagmans BL Severe Acute Respiratory Syndrome Coronavirus 2–Specific Antibody Responses in Coronavirus Disease 2019 Patients. Emerg. Infect. Dis 2020, 26 (7). 10.3201/eid2607.200841. [DOI] [PMC free article] [PubMed] [Google Scholar]
- (53).Lu R; Zhao X; Li J; Niu P; Yang B; Wu H; Wang W; Song H; Huang B; Zhu N; Bi Y; Ma X; Zhan F; Wang L; Hu T; Zhou H; Hu Z; Zhou W; Zhao L; Chen J; Meng Y; Wang J; Lin Y; Yuan J; Xie Z; Ma J; Liu WJ; Wang D; Xu W; Holmes EC; Gao GF; Wu G; Chen W; Shi W; Tan W Genomic Characterisation and Epidemiology of 2019 Novel Coronavirus: Implications for Virus Origins and Receptor Binding. Lancet 2020, 395 (10224), 565–574. 10.1016/s0140-6736(20)30251-8. [DOI] [PMC free article] [PubMed] [Google Scholar]
- (54).Li D; Li J Immunologic Testing for SARS-CoV-2 Infection from the Antigen Perspective. J. Clin. Microbiol 2020, JCM.02160-20. 10.1128/jcm.02160-20. [DOI] [PMC free article] [PubMed] [Google Scholar]
- (55).Jaimes JA; André NM; Chappie JS; Millet JK; Whittaker GR Phylogenetic Analysis and Structural Modeling of SARS-CoV-2 Spike Protein Reveals an Evolutionary Distinct and Proteolytically Sensitive Activation Loop. J. Mol. Biol 2020, 432 (10), 3309–3325. 10.1016/j.jmb.2020.04.009. [DOI] [PMC free article] [PubMed] [Google Scholar]
- (56).Singh SP; Li Y; Be'er A; Oren Y; Tour JM; Arnusch CJ Laser-Induced Graphene Layers and Electrodes Prevents Microbial Fouling and Exerts Antimicrobial Action. ACS Appl. Mater. Interfaces 2017, 9 (21), 18238–18247. 10.1021/acsami.7b04863. [DOI] [PubMed] [Google Scholar]
- (57).Hinnemo M; Zhao J; Ahlberg P; Hägglund C; Djurberg V; Scheicher RH; Zhang S-L; Zhang Z-B On Monolayer Formation of Pyrenebutyric Acid on Graphene. Langmuir 2017, 33 (15), 3588–3593. 10.1021/acs.langmuir.6b04237. [DOI] [PubMed] [Google Scholar]
- (58).Chicharro JL; Lucía A; Pérez M; Vaquero AF; Ureña R Saliva Composition and Exercise. Sports Med. 1998, 26 (1), 17–27. 10.2165/00007256-199826010-00002. [DOI] [PubMed] [Google Scholar]
- (59).Lichstein HC; Soule MH Studies of the Effect of Sodium Azide on Microbic Growth and Respiration. J. Bacteriol 1944, 47 (3), 221–230. 10.1128/jb.47.3.221-230.1944. [DOI] [PMC free article] [PubMed] [Google Scholar]
- (60).Khamsi PS; Kammarchedu V; Ebrahimi A Evaporation-Enhanced Redox Cycling for Rapid Detection of Attomolar SARS-CoV-2 Virions Using Nanolithography-Free Electrochemical Devices. 10.1149/osf.io/j5qxk [under review]. [DOI] [Google Scholar]
Associated Data
This section collects any data citations, data availability statements, or supplementary materials included in this article.