Abstract
Lymphocyte activating gene-3 (LAG3) is a distinctive T cell co-receptor that is expressed on the surface of lymphocytes. It plays a special inhibitory immune checkpoint role due to its unique domain and signaling pattern. Our aim is to explore the correlation between LAG3 in cancers and physiological processes related to a range of cancers, as well as build LAG3-related immunity and prognostic models. By comprehensively using of datasets and methods from TCGA, GTE-x and GEO databases, cBioPortal, HPA, Kaplan-Meier Plotter, Spearman, CellMinerTM, we delved deeper into the potential impact of the LAG3 in cancer development. These include expression differences, Localization of tumor cell subsets, immune infiltration, matrix infiltration, gene mutations, DNA methylation, signaling pathways and prognosis. Furthermore, we explored LAG3 interactions with different drugs. LAG3 is highly expressed in ACC (p < 0.001), BRCA (p < 0.001), DLBC (p < 0.001), ESCA (p < 0.001), GBM (p < 0.001), HNSC (p < 0.001), KIRC (p < 0.001), LGG (p < 0.001), LUAD (p < 0.01), LUSC (p < 0.001), PAAD (p < 0.001), PCPG (p < 0.01), SKCM (p < 0.001), STAD (p < 0.001), TGCT (p < 0.001) and THCA (p < 0.05), while lowly expressed in COAD (p < 0.001), LIHC (p < 0.05), OV (p < 0.001), PRAD (p < 0.001), READ (p < 0.001), UCEC (p < 0.001) and UCS (p < 0.001). High expression of LAG3 correlates with longer overall survival (OS) in BLCA (HR = 0.67, p < 0.05), CESC (HR = 0.3, p < 0.001), HNSC (HR = 0.67, p < 0.01), LUSC (HR = 0.71, p < 0.05), OV (HR = 0.65, p < 0.01), STAD (HR = 0.68, p < 0.05), and UCEC (HR = 0.57, p < 0.01). Conversely, in KIRC (HR = 1.85, p < 0.001), KIRP (HR = 2.81, p < 0.001), and THYM (HR = 8.92, p < 0.001), high LAG3 expression corresponds to shorter OS. Comprehensive results for recurrence-free survival (RFS) indicate that LAG3 acts as a protective factor in BLCA, CESC, OV, and UCEC. Moreover, LAG3 is widely expressed in tumor-associated lymphocytes, positively correlating with tumor immune scores and stromal scores, and significantly present in the C2 immune subtype across various tumors. High LAG3 expression correlates with increased immune infiltration. LAG3 shows associations with MSI, TMB, and the MMR system, participating in multiple signaling pathways including the T cell receptor pathway. It also demonstrates positive correlations with sensitivity to eleven different drugs. Unlike traditional inhibitory immune checkpoints, LAG3 exhibits dual roles in clinical and immune prognostication across pan-cancers, making it a significant predictive factor. In some cancers, LAG3 serves as a risk factor, indicating adverse clinical outcomes. Conversely, in BLCA, CESC, OV, and UCEC, LAG3 acts as a protective factor associated with longer patient survival. LAG3 demonstrates strong associations within tumor immunity, participating in a range of immune and inflammatory signaling pathways. Elevated levels of LAG3 are linked not only to T cell exhaustion but also to increased immune infiltration and polarization towards M1 macrophages.
Supplementary Information
The online version contains supplementary material available at 10.1038/s41598-024-74808-4.
Keywords: LAG3, Immune checkpoint, CD8+T cell, Pan-cancer, Prognosis
Subject terms: Cancer, Computational biology and bioinformatics, Immunology
Introduction
Malignant tumors, commonly referred to as cancer, persist as the most prevalent non-communicable affliction imperiling human well-being1,2. Epidemiological inquiries suggest a sustained escalation in the global incidence of new cancer cases, propelled by multifarious factors including pollution, tobacco, and alcohol, particularly accentuated in developing and underdeveloped nations3. Presently entrenched in clinical practice, interventional surgery, radiation therapy, and chemotherapeutic regimens stand as the foundational pillars of cancer management. Notwithstanding, these modalities exhibit inherent constraints, frequently proving ineffectual in the context of numerous advanced malignancies4,5. The advent of targeted therapy and immunotherapy has ushered in a paradigm shift, fundamentally reshaping conventional approaches to cancer treatment6–8. Notably, the applicability of targeted therapy is not universal, exemplified by its limitations in addressing triple-negative breast cancer9. Given its reliance on mutations within specific intracellular pathways, genetic-level mutation screening prior to treatment is imperative for the successful implementation of targeted interventions. On the other hand, the augmentation or facilitation of the adaptive immune response to counteract malignancies has emerged as a focal point of interest. In the realm of adaptive immunity, CD8+T lymphocytes assume a pivotal role owing to their cytotoxic prowess against neoplastic cells, thereby underpinning sophisticated therapeutic modalities like Chimeric Antigen Receptor T-cell (CAR-T) therapy10. Nevertheless, a myriad of factors contributes to immune evasion within the tumor microenvironment (TME), encompassing lactate accumulation, hypoxic niches, and the regulatory T cell subset (Treg). These intricacies elucidate the rapid progression of many cancers and the eventual precipitation of unfavorable clinical outcomes11–13.
The primary signal derived from the T cell receptor (TCR) and the major histocompatibility complex (MHC) in conjunction with the secondary signal emanating from co-stimulatory molecules on the surface of antigen-presenting cells (APCs) collectively orchestrate the activation of T cells. In order to prevent excessive T cell activation that may lead to autoimmunity, the immune checkpoint mechanisms, a category of transmembrane proteins ubiquitously expressed on the surfaces of tissue cells and immune cells, have been selectively engaged14,15. These checkpoints function as co-stimulatory signals modulating the downstream signaling of the T cell receptor complex (TCR-CD3)16–18. Categorized based on their impact on downstream signaling pathways, immune checkpoints can be delineated into stimulatory and inhibitory subsets. Canonical inhibitory immune checkpoints, such as programmed cell death protein 1 (PD-1), exert their suppressive effects on T cell activity by attenuating the downstream AKT and ERK pathways of the TCR-CD3 complex through interaction with their ligands PD-L1 and PD-L2, thereby contributing to immune evasion within certain neoplastic entities19–21. Despite the remarkable anticancer efficacy demonstrated by immune checkpoint inhibitors like PD-1 and CTLA-4 in both laboratory and clinical realms, challenges pertaining to tolerance persist22. Hence, the quest for novel prospective immune checkpoints and the substantiation of their clinical relevance stands as imperatives of pressing urgency.
Lymphocyte activation gene-3 (LAG-3) is located at the 12p13.32 locus on chromosome 12 in humans, encoding a type I transmembrane protein composed of 498 amino acids. As one of the newly discovered prominent immune checkpoint molecules, there is evidence suggesting its inhibitory role in T cell activity, and it has shown promising effects when used in combination with PD-1 inhibitors23–25. The novel LAG3 monoclonal antibody Relatlimab has been approved for the treatment of unresectable or metastatic malignant melanoma26,27. Notably, the LAG-3 molecule possesses a distinct molecular structure comprising four immunoglobulin superfamily (IgSF) domains (D1-D4), differentiating it from other immune checkpoint molecules28,29. Various ligands, including galectin-3 (GAL-3) and fibrinogen-like protein-1 (FGL-1), can bind to LAG-3 to modulate the functions of NK cells and CD8+T cells30,31. As an inhibitory immune checkpoint, LAG3 co-localizes with CD8 molecules on T cells, downregulating the calcium flux induced by the TCR and impeding the binding of the downstream kinase Lck to the TCR, resulting in immune exhaustion32–34. However, on the other hand, LAG3 exhibits functions similar to CD4 by interacting with MHC-II through its D1 domain, participating in downstream signal transduction. For instance, Tregs can inhibit dendritic cell (DC) maturation through the interaction between LAG3 and MHC-II28. Nevertheless, some research findings indicate that high expression of LAG3 has a positive impact on the prognosis of certain cancers, suggesting a more intricate regulatory mechanism of LAG3 within the immune system35,36. Given that the significance of LAG3 in cancer immunity and clinical outcomes remains incompletely elucidated, hindering its further clinical applications, this research comprehensively utilizes bioinformatics research methods to delineate the comprehensive expression and mutation profiles of LAG3 in 33 types of cancers. Additionally, it analyzes the positioning of LAG3 in the tumor microenvironment using existing single-cell sequencing sample databases. Subsequently, the research examines the correlations of LAG3 with immune infiltration, microsatellite instability (MSI), DNA mismatch repair (MMR), immune subtypes, TME scores, and other common clinical indicators. Finally, it assesses the predictive value of LAG3 in the clinical outcomes and diagnosis of these cancers. The full names and abbreviations of the 33 cancers involved in this research are recorded in (Table 1).
Table 1.
Cancer names and abbreviations used in this research.
| Cancer | Abbreviation |
|---|---|
| Adrenocortical Cancer | ACC |
| Bladder Cancer | BLCA |
| Breast Cancer | BRCA |
| Cervical Cancer | CESC |
| Bile Duct Cancer | CHOL |
| Colon Cancer | COAD |
| Large B-cell Lymphoma | DLBC |
| Esophageal Cancer | ESCA |
| Glioblastoma | GBM |
| Head and Neck Cancer | HNSC |
| Kidney Chromophobe | KICH |
| Kidney Clear Cell Carcinoma | KIRC |
| Kidney Papillary Cell Carcinoma | KIRP |
| Acute Myeloid Leukemia | LAML |
| Lower Grade Glioma | LGG |
| Liver Cancer | LIHC |
| Lung Adenocarcinoma | LUAD |
| Lung Squamous Cell Carcinoma | LUSC |
| Mesothelioma | MESO |
| Ovarian Cancer | OV |
| Pancreatic Cancer | PAAD |
| Pheochromocytoma & Paraganglioma | PCPG |
| Prostate Cancer | PRAD |
| Rectal Cance | READ |
| Sarcoma | SARC |
| Melanoma | SKCM |
| Stomach Cancer | STAD |
| Testicular Cancer | TGCT |
| Thyroid Cancer | THCA |
| Thymoma | THYM |
| Endometrioid Cancer | UCEC |
| Uterine Carcinosarcoma | UCS |
| Ocular melanomas | UVM |
Result and discussion
Expression profiles and mutations of LAG3 gene in pan-cancer
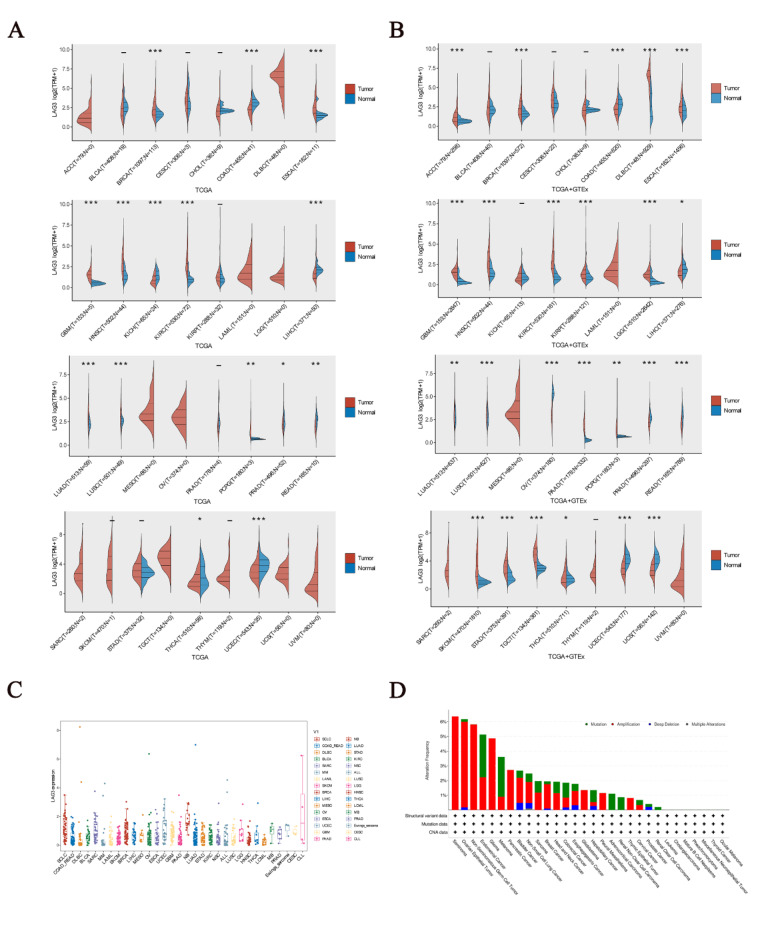
Firstly, we observed that LAG3 exhibits distinct expression patterns in cancer tissues and adjacent tissues. Analysis of transcriptomic data from the TCGA database revealed that, compared to adjacent tissues, LAG3 is highly expressed in BRCA (p < 0.001), ESCA (p < 0.001), GBM (p < 0.001), HNSC (p < 0.001), KIRC (p < 0.001), LUAD (p < 0.001), LUSC (p < 0.001) and PCPG (p < 0.01), and lowly expressed in COAD (p < 0.001), KICH (p < 0.001), LIHC (p < 0.001), PRAD (p < 0.05), READ (p < 0.01), THCA (p < 0.05) and UCEC (p < 0.001) (Fig. 1A). Besides, Analysis of transcriptomic data from the TCGA and GTE-x database revealed LAG3 is highly expressed in ACC (p < 0.001), BRCA (p < 0.001), DLBC (p < 0.001), ESCA (p < 0.001), GBM (p < 0.001), HNSC (p < 0.001), KIRC (p < 0.001), LGG (p < 0.001), LUAD (p < 0.01), LUSC (p < 0.001), PAAD (p < 0.001), PCPG (p < 0.01), SKCM (p < 0.001), STAD (p < 0.001), TGCT (p < 0.001) and THCA (p < 0.05), while lowly expressed in COAD (p < 0.001), LIHC (p < 0.05), OV (p < 0.001), PRAD (p < 0.001), READ (p < 0.001), UCEC (p < 0.001) and UCS (p < 0.001) (Fig. 1). Additionally, parallel transcriptomic data reveal distinct variations in LAG3 gene expression across different cancers. We observed that LAG3 gene is enriched to varying extents in SCLC, SARC, BRCA, UCEC, and NB compared to other cancers (Fig. 1C). The paired sample expression of LAG3 in the TCGA database is documented in (Fig. S1). Immunohistochemical findings from Human Protein Atlas (HPA) corroborate further the expression disparities of LAG3 between tumor and normal tissues across 18 cancer types (Fig. S2). Besides, the analysis results of gene mutations showed that LAG3 gene mutations in cancer were mainly mutation, amplification, deep deletion and multiple alterations. Further, the category in OV, Seminoma, Non-Seminomatous Germ Cell Tumors and glioma is mainly amplification. And the category in UCEC and SKCM is mainly mutation (Fig. 1D).
Fig. 1.
(A) Differential expression of the LAG3 gene in cancer based on the TCGA database. (B) Differential expression of the LAG3 gene in cancer based on the TCGA and GTE-x database. (C) Parallel analysis of the LAG3 gene in a variety of cancers. (D) Analysis of mutations in the LAG3 gene.
Given the varied tissue origins and mutational landscapes inherent to cancers, the expression profiles of immune checkpoint genes exhibit substantial heterogeneity across different malignancies, profoundly impacting the efficacy of targeted immune checkpoint therapies. LAG3 molecule exhibits widespread expression across various immune cells, including CD4+T cells, CD8+T cells, Tregs, B cells, and NK cells. Compared to widely used immune checkpoint molecules such as CTLA-4 and PD-1/PD-L1, LAG3 exerts a more intricate and comprehensive inhibitory role32. Several studies confirm that enrichment of LAG3 is often associated with high PD-1 expression and immune suppression, and dual blockade of LAG3 and PD-1 significantly enhances anti-tumor immune function37. Despite significant clinical efficacy achieved by PD-1 inhibitors, effectively prolonging survival in cancer patients, many cancers exhibit limited sensitivity to existing PD-1 blockade38,39. As a promising next-generation immune checkpoint molecule, we integrated genomic information from TCGA and GTE-x datasets and arrived at practical conclusions. Specifically, we discerned significant disparities in LAG3 expression across 24 distinct cancer and adjacent normal tissue types. Notably, the incorporation of GTE-x data alongside TCGA markedly revised outcomes such as ACC, DLBC, KICH, KIRP, LGG, PAAD, SKCM, and STAD. This divergence stems from GTE-x encompassing a broader spectrum of transcriptomic templates sourced from healthy human tissues, thereby heightening analytical precision beyond that attainable through exclusive reliance on the TCGA tumor repository. These revelations offer enhanced strategic direction for the clinical deployment of LAG3. Moreover, some studies support our conclusions. In a clinical follow-up, immunohistochemical results from 65% of LIHC patients showed high expression of LAG3 in tumor-infiltrating lymphocytes rather than tumor cells, indicating a restricted presence of LAG3 in lymphocytes40. Another research reported the existence of a subgroup within PRAD characterized by low LAG3 expression. This mutual confirmation aligns with our conclusion that LAG3 expression is lower in PRAD41. Considering the significant expression differences of LAG3 across different cancers, genetic testing for LAG3 prior to treatment is deemed necessary.
Single-cell cluster analysis of LAG3
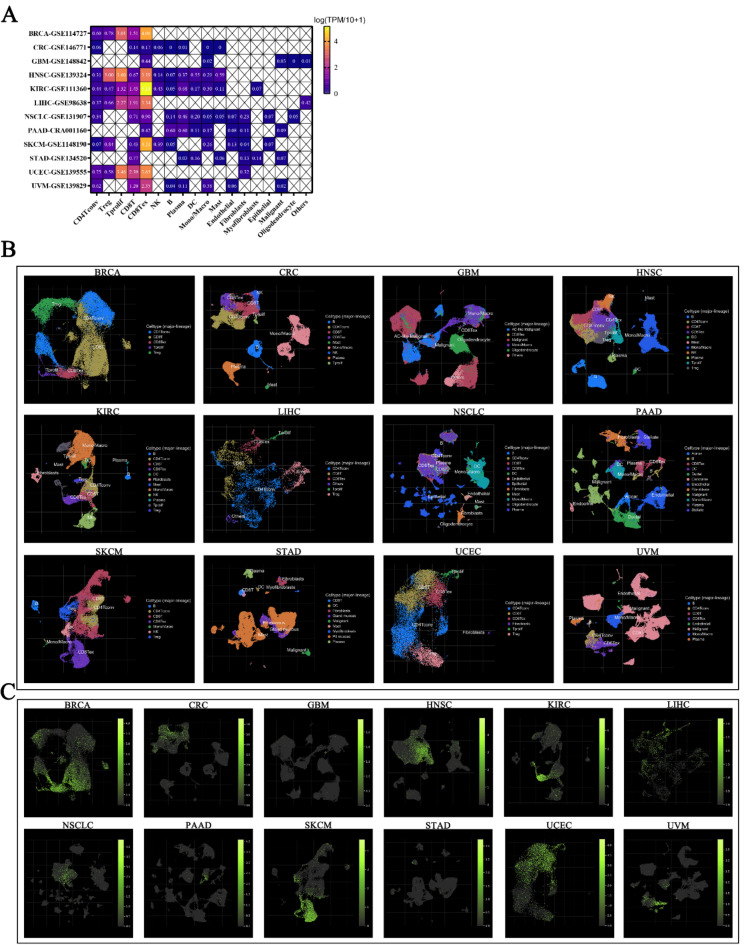
Based on the expression of marker genes, we categorized the cells in TME into CD4+T cells, Tregs, Tprolif, CD8+T cells, CD8+Tex cells, NK cells, B cells, Plasma cells, DCs, Mono/Macros, Mast cells, Endothelial cells, Fibroblasts, Myofibroblasts, Epithelial cells, Malignant cells, and Oligodendrocytes (Fig. S3). We found that LAG3 is predominantly expressed in lymphocytes, with minimal detection in fibroblasts, myofibroblasts, epithelial cells, malignant cells, and oligodendrocytes. In HNSC (log (TPM/10 + 1) = 3.00), Tregs have been detected and show high expression. In BRCA (log (TPM/10 + 1) = 3.01), HNSC (log (TPM/10 + 1) = 3.60), LIHC (log (TPM/10 + 1) = 2.27) and UCEC (log (TPM/10 + 1) = 3.46), Tprolif have been detected and show high expression. In UCEC (log (TPM/10 + 1) = 2.39) CD8+T cell have been detected and show high expression. And in BRCA (log (TPM/10 + 1) = 4.06), HNSC (log (TPM/10 + 1) = 3.39), KIRC (log (TPM/10 + 1) = 5.14), LIHC (log (TPM/10 + 1) = 3.34), SKCM (log (TPM/10 + 1) = 4.21), UCEC (log (TPM/10 + 1) = 3.65) and UVM (log (TPM/10 + 1) = 2.35) CD8+Tex cell have been detected and show high expression (Fig. 2A, C).
Fig. 2.
(A) The expression of LAG3 in tumor-associated cells across 12 types of cancer. (B) Dimensionality reduction clustering results of high-throughput sequencing datasets corresponding to 12 types of cancers, where each color region in the graph represents a distinct cellular subgroup. (C) The expression of LAG3 in tumor-associated cellular subgroups, where a greater number of green fluorescence dots indicate stronger LAG3 expression.
The TME comprises tumor cells, tumor-associated cells (such as cancer-associated fibroblasts (CAFs), tumor-associated macrophages (TAMs)), and the extracellular matrix, nourished by a specialized circulatory system42,43. Immune checkpoints, pivotal in regulating tumor immunity, play essential roles in the dynamic interplay between TME and tumor-infiltrating immune cells (TIICs). To evaluate LAG3 distribution in the TME and its cellular localization within tumor-associated populations, we analyzed 12 tumor sequencing samples without prior immune checkpoint blockade therapy from the GEO database. Employing dimensionality reduction clustering techniques, we pinpointed the localization of LAG3 and garnered significant insights. Our findings reveal widespread presence of lymphocytes, epithelial cells, and fibroblasts across multiple cancer types. Additionally, LAG3 predominantly localizes within CD8+T cells, dendritic cells, macrophages, and Tregs. Particularly noteworthy is the depletion of CD8+T cells observed in BRCA, HNSC, KIRC, LIHC, SKCM, UCEC, and UVM cancers, coinciding with pronounced LAG3 localization and heightened expression levels, strongly implicating LAG3 in T cell exhaustion dynamics. Recent studies underscore the pervasive expression in infiltrating immune cells of LIHC, concomitant with substantial CD8+ T cell suppression, further corroborating our conclusions44. Furthermore, we note limited LAG3 expression in tumor-associated epithelial cells and CAFs. Studies suggest LAG3 correlates with E-cadherin and Caspase-3 expression, influencing tumor cell migration. Besides, the association of LAG3 with immune cell and epithelial-mesenchymal transition phenomena underscores its intricate interplay with tumor-associated cellular, which necessitating comprehensive further investigation45,46.
The correlation between LAG3 and immune infiltration
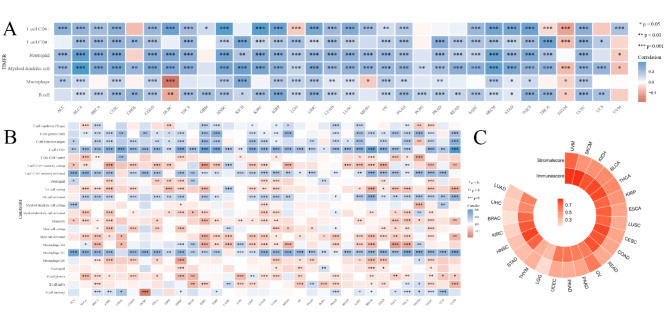
The results of immune score and stromal score indicate that the levels of LAG3 are highly positively correlated (correlation coefficient > 0.5) with TME immune scores in BLCA, BRCA, CESC, COAD, ESCA, HNSC, KICH, KIRC, KIRP, LIHC, LUAD, LUSC, OV, PAAD, PRAD, STAD, SKCM, READ, THCA, UCEC and UVM. Meanwhile in LGG and THYM, there is a moderately strong positive correlation (0.3 < < 0.5) with immune scores. Additionally, LAG3 expression shows a highly positive correlation with TME stromal scores in BLCA, KICH, KIRP, OV, SKCM, THCA and UVM, as well as a moderately strong positive correlation in CESC, COAD, ESCA, LUSC, PAAD, PRAD, STAD, READ, THYM and UCEC (Fig. 3C, Fig. S4).
Fig. 3.
(A) Correlation of LAG3 with tumor immune cell infiltration by TIMER database. Blue represents a positive correlation and Red represents a negative correlation. (B) Correlation of LAG3 with tumor immune cell infiltration by CIBERSORT database. Blue represents a positive correlation and Red represents a negative correlation. (C) LAG3 and its correlation heatmap with immune scores and stromal scores, with numerical values representing correlation coefficients.
The subsequent analysis reveals correlations between LAG3 levels and TIICs. Utilizing the TIMER algorithm, findings indicate a significant positive association of LAG3 with six immune cell types—comprising CD8+T cells, CD4+T cells, Neutrophils, Myeloid dendritic cells, Macrophages, and B cells—across the majority of cancers, with notable exceptions in DLBC, LGG, MESO, THCA, THYM, and UVM. Furthermore, employing the CIBERSORT algorithm, which incorporates comprehensive classification attributes, underscores a prevalent positive correlation pattern between LAG3 and TIICs in most cancer types. Specifically regarding CD8+T cells, LAG3 demonstrates a positive infiltration correlation across cancer categories, excluding THYM (Fig. 3A and B). The immune infiltration results from the X-CELL, EPIC, MCPCOUNTER, and QUANTISEQ algorithms are presented in (Fig. S5).
To further assess the association of LAG3 expression with levels of immune and stromal cells within tumors, and to elucidate its deeper connection with TME, we employed the ESTIMATE algorithm to generate correlation maps between LAG3 and immune scores as well as stromal scores across 23 cancer types. The positive correlation observed between LAG3 levels and both scores in these cancers indicates that high LAG3 expression is associated with elevated levels of immune infiltration, underscoring its potential in immunotherapeutic applications. Results from immune infiltration algorithms further illustrate the functional role of LAG3. Notably, a strong positive correlation was identified between LAG3 expression and CD8+T cell infiltration across most cancers outside THYM, suggesting that upregulation of CD8+T cell infiltration is associated with high LAG3 gene expression. This contrasts with findings for inhibitory immune checkpoints such as PD-1 or CTLA-4, where the opposite effect is observed. Additionally, the association of LAG3 with CD4+T cells, potentially modulating their activation, presence of naive cells, and infiltration of resting cells, suggests interactions possibly mediated through its ligand MHCII. In addition to directly modulating T cells, immune checkpoint molecules can also intervene in the presentation of tumor antigens through other pathways. Previous research has confirmed that the use of immune checkpoint inhibitors alters the function of tumor-infiltrating macrophages, promoting their differentiation into the M1 phenotype to exert anti-tumor effects47,48. In our research, examination of LAG3 correlation patterns with APC infiltration revealed a negative association with M2-polarized MACs and a positive correlation with M1-polarized MACs, indicating that elevated LAG3 expression favors antigen presentation by macrophages and activation of CD8+T cells. Furthermore, our analysis uncovered a positive co-expression landscape between LAG3 and NK cells across most cancers, where LAG3 upregulation is linked to regulatory rather than cytotoxic NK cell phenotypes, influencing dynamics of tumor immunity. Recent studies suggest that LAG3 overexpression reshapes the TME, reducing DC abundance and enhancing immune suppression49.
Vary from traditional inhibitory immune checkpoints, LAG3 exhibits positive correlations with most functional immune cells. We propose a plausible hypothesis: upregulation of LAG3 in TIICs enhances immune cell infiltration during early tumor stages, yet as tumors progress, LAG3 begins exerting inhibitory effects, contributing to immune exhaustion. This aligns with the concept of “hot” tumors characterized by extensive immune cell infiltration and elevated expression of terminal differentiated T cells and inhibitory immune checkpoints50–52. These findings substantiate our hypothesis, explaining the positive correlation between LAG3 and widespread immune cell infiltration alongside concurrent T cell exhaustion. In a short word, deeper longitudinal studies are imperative in the cause of comprehensively exploring these dynamics.
Expression disparities of LAG3 across cancer immune subtypes
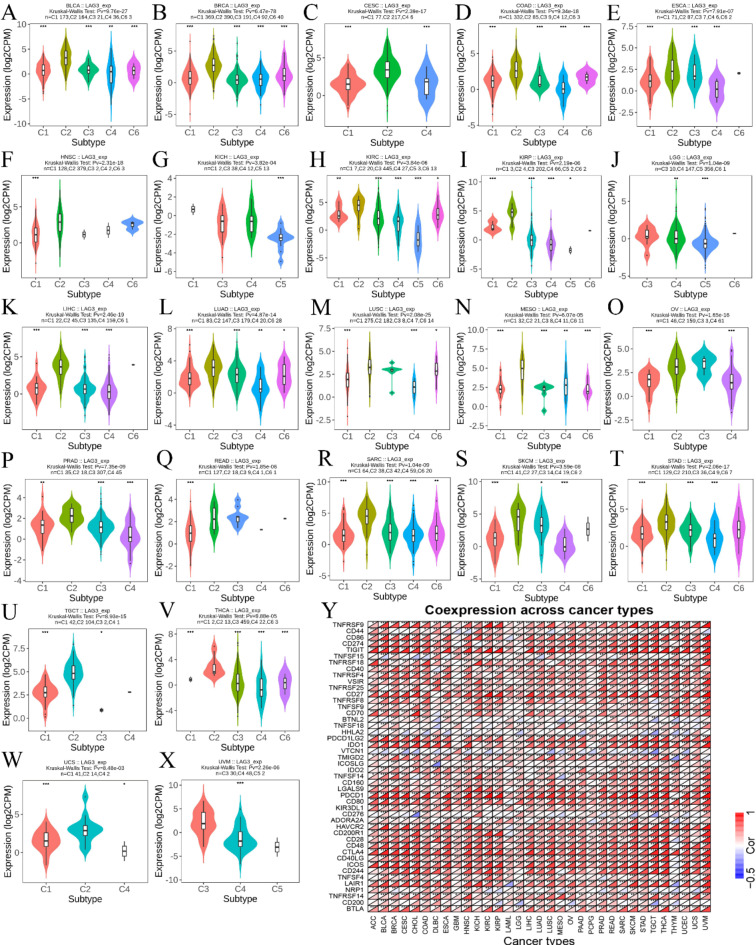
Results from the analysis of TCGA cancer samples using the TISIDB database indicate differential expression patterns of LAG3 across various immune subtypes of cancer. Specifically, LAG3 shows higher expression levels in the C2 immune subtype of several cancers, including BLCA, BRCA, CESC, COAD, ESCA, HNSC, KIRC, KIRP, LIHC, LUAD, LUSC, MESO, OV, PRAD, READ, SARC, SKCM, STAD, TGCT, THCA and UCS (Fig. 4A and X). Furthermore, our analysis revealed that LAG3 demonstrates extensive positive co-expression with 42 immune checkpoints across a majority of cancer types. Notably, exceptions to this pattern were observed with Tnsfs15, Btnl2, Vtcn1, and Cd276 (Fig. 4Y).
Fig. 4.
(A–X) Correlation of LAG3 with cancer immunophenotyping. (Y) Co-expression of LAG3 with other immune checkpoint genes. Red represents a positive correlation and blue represents a negative correlation.
Based on the expression of immune-related genes in TME and the types of interactions between tumor cells and immune cells, tumors can be classified into six immune subtypes: wound healing (C1), IFN-γ dominant (C2), inflammatory (C3), lymphocyte depleted (C4), immunologically quiet (C5), and TGF-β dominant (C6)53. Analyzing the correlations within these tumor immune subtypes helps clarify the association between immune checkpoints and the immune landscape. Our research results indicate that LAG3 expression levels are highest in the C2 subtype across most cancers. Specifically, this manifests as a high differentiation rate of M1 macrophages, upregulation of CD8 signaling transduction, and increased TCR diversity. This conclusion corroborates findings from immune infiltration analyses, suggesting that high LAG3 expression typically correlates with stronger immune activity. Furthermore, it further reveals the dual role of LAG3 in tumor immunity. On one hand, inhibiting T cell activity, and on the other hand, correlating with heightened immune levels.
The correlation between LAG3 and clinical molecular markers in cancer
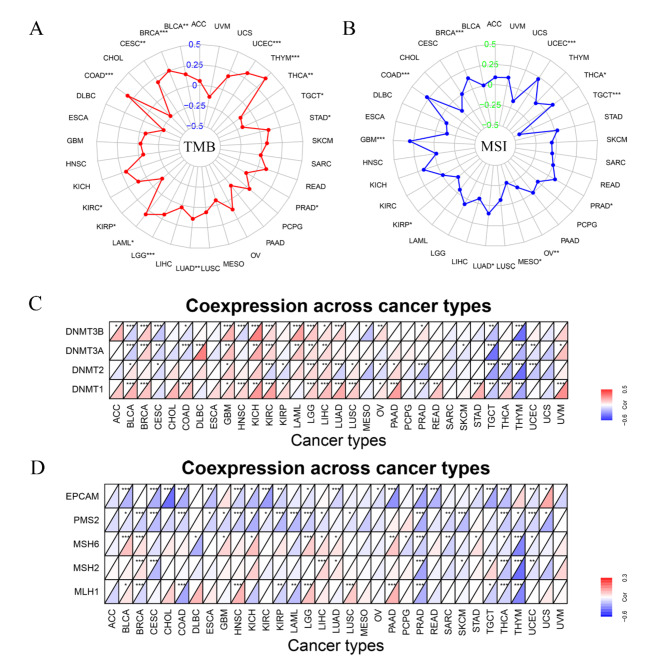
The correlation analysis of tumor mutational burden (TMB) indicates that LAG3 is positively correlated with BLCA (p < 0.01), BRCA (p < 0.001), CESC (p < 0.01), COAD (p < 0.001), LAML (p < 0.05), LGG (p < 0.001), LUAD (p < 0.01), STAD (p < 0.05), THYM (p < 0.001) and UCEC (p < 0.001), while negatively correlated with PRAD (p < 0.05), TGCT (p < 0.05) and THCA (p < 0.01) (Fig. 5A). Moreover, in the results of MSI, we discovered that LAG3 is positively correlated with BRCA (p < 0.001), COAD (p < 0.001), GBM (p < 0.001), LUAD (p < 0.05), PRAD (p < 0.05), THCA (p < 0.05) and UCEC (p < 0.001), and negatively correlated with KIRP (p < 0.05), MESO (p < 0.05), OV (p < 0.01) and TGCT (p < 0.001) (Fig. 5B). Additionally, the analysis of the correlation between LAG3 expression and four genes from the DNMT family (Dnmt3b, Dnmt3a, Dnmt2, and Dnmt1) in the methylation pathway, as well as five genes from the MMR system (Epacm, Pms2, Msh6, Msh2, and Msh1), shows that LAG3 expression is positively correlated with levels of genes involved in the methylation in certain cancers, including BRCA, GBM, KICH, LAML, LGG, LIHC, LUSC, PAAD, READ, STAD and UVM. Conversely, while negatively correlated with CESC, MESO, SKCM, TGCT, THYM and UCEC. Besides, the negatively correlation of LAG3 with five MMR genes is discovered in CESC, COAD, DLBC, ESCA, KIRC, KIRP, LAML, PAAD, READ, SARC, SKCM, THCA, THYM and UCEC (Fig. 5C and D).
Fig. 5.
(A) Correlation of LAG3 with TMB. (B) Correlation of LAG3 with MSI. (C) Correlation of LAG3 with Methylation-related genes. Red represents a positive correlation and blue represents a negative correlation. (D) Correlation of LAG3 with MMR-related genes. Red represents a positive correlation, and blue represents a negative correlation.
Although immune checkpoint therapy fundamentally reverses immune suppression within TME, tumor immunity also relies on tumor cells or antigen-presenting cells (APCs) activating CD8+T cells through MHCI-TCR interactions54. A crucial step in this process involves the ubiquitination of abnormal antigens generated by tumor cell mutations, followed by their recombination within the endoplasmic reticulum to form MHCI-antigen peptide complexes. Therefore, the level of genetic mutations within tumor cells serves as a critical determinant for assessing the efficacy of immune checkpoint therapies55–57. Specifically, TMB reflects the potential of tumor cells to produce neoantigens, which correlates with the MMR system at the genetic level. When MMR is defective or impaired, stable microsatellite replication sequences cannot be repaired from errors, leading to extensive mutation sequences in the coding regions of tumor cell DNA and the production of frameshift peptides (FMPs) as tumor antigens. Thus, MMR deficiency results in MSI and high TMB within tumors, upregulating T cell-mediated cellular immunity and impacting immune checkpoint therapies57–59. In our research, the correlation between LAG3 and TMB and MSI was initially identified. LAG3 showed a positive correlation with indicators of TMB and MSI in certain cancers such as BRCA, COAD, and LUDA, supporting the link between genetic mutations and immune checkpoint therapies. However, in cancers represented by CESC, KIRP, LAML, and THYM, we found that while LAG3 was negatively correlated with MMR, indicating an association between high LAG3 expression and MMR deficiency, MSI did not show a significant upregulation.
While MSI has been utilized as a predictive biomarker for therapeutic responses, clinical predictions using MMR are rare, with limited studies describing how MMR deficiency affects potential molecular and clinical factors. A pan-cancer research has indicated that the loss of MMR-related genes such as MLH1/PMS2 correlates with low levels of TMB. Methylation of the MLH1 promoter may contribute to tumor heterogeneity, thereby influencing the relationship between MMR and MSI outcomes60. Compensation following the loss of certain MMR-related proteins (e.g., PMS2-PMS1 complementation, MSH6-MSH3 complementation) could also lead to these outcomes57,60. Evidence suggests that certain microRNAs are involved in lineage mutations of MLH1, resulting in low MSI, but further research is needed to substantiate this finding61. In summary, understanding the correlation between LAG3 and the MMR system, MSI, and TMB contributes to further supporting its predictive value in the effectiveness of tumor immune checkpoint therapies.
GSEA enrichment analysis of LAG3-related genes
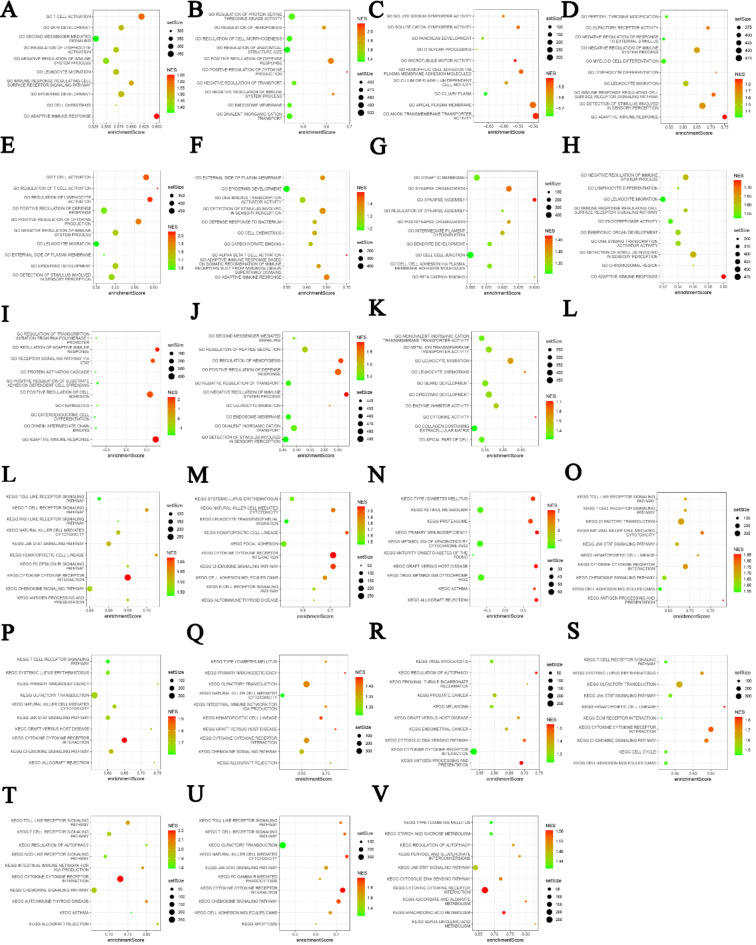
With the purpose of further elucidating the association of LAG3 with intracellular signaling pathways, we employed Kyoto Encyclopedia of Genes and Genomes (KEGG) and Gene Ontology (GO) enrichment analysis methods to identify pathways related to LAG362–64. We found that these pathways primarily include immune-related signaling pathways, inflammation-related signaling pathways, and other signaling transduction pathways. Specifically, T cell receptor signaling pathway, toll-like receptor signaling pathway, lymphocyte activation pathway, and chemokine signaling pathway are highly correlated with the LAG3 gene (Fig. 6). These pathways play crucial roles in the activation of specific immune responses, further supporting the importance of LAG3 in tumor immune modulation. Additionally, the LAG3 gene is involved in inflammation-related signaling pathways such as the JAK-STAT pathway. Studies have indicated that the application of immune checkpoint receptor blockers can reduce inflammation reactions in TME65. Upregulation of immune checkpoint molecules like LAG3 correlates positively with tumor inflammation responses, suggesting another mechanism of immune suppression. In melanoma, activation of the JAK-STAT signaling pathway promotes tumor metastasis and correlates with LAG3 expression66. These findings emphasize that LAG3 is involved in complex aspects of cancer immune regulation beyond simply acting as an inhibitory immune checkpoint. The specific signaling transduction mechanisms on which it depends warrant further in-depth research.
Fig. 6.
(A–K) GO analysis of signaling pathways associated with LAG3 in ACC, BLCA, CESC, HNSC, KIRC, KIRP, LAML, LGG, OV, SKCM and THYM. (L–V) KEGG analysis of signaling pathways associated with LAG3 in ACC, BLCA, CESC, HNSC, KIRC, KIRP, LAML, LGG, OV, SKCM and THYM. Bubble plot where setSize represents the number of genes included in the expression dataset of the GO term, enrichmentScore represents the enrichment score, and NES represents the normalized enrichment score (NES) after correction.
LAG3 in the diagnosis and prognosis of cancer
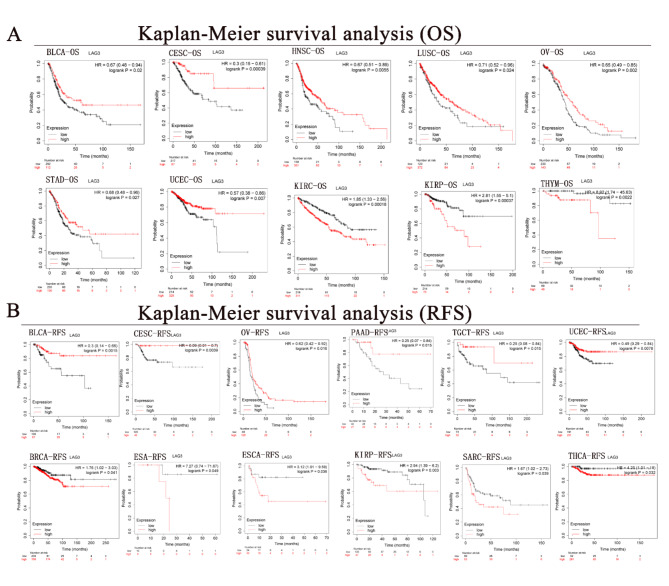
The survival curve analysis of overall survival (OS) across eight cancer types reveals that LAG3 functions as a protective factor in malignancies such as BLCA (HR = 0.67, p < 0.05), CESC (HR = 0.3, p < 0.001), HNSC (HR = 0.67, p < 0.01), LUSC (HR = 0.71, p < 0.05), OV (HR = 0.65, p < 0.01), STAD (HR = 0.68, p < 0.05) and UCEC (HR = 0.57, p < 0.01). In contrast, LAG3 acts as an adverse prognostic indicator in three cancers, which includes KIRC (HR = 1.85, p < 0.001), KIRP (HR = 2.81, p < 0.001), and THYM (HR = 8.92, p < 0.001) (Fig. 7A). Further investigation reveals that LAG3 acts as a protective factor in disease-free survival (RFS) curves across six types of cancer. Specifically, higher levels of LAG3 expression are associated with longer RFS in BLCA (HR = 0.3, p < 0.01), CESC (HR = 0.08, p < 0.01), OV (HR = 0.62, p < 0.05), PAAD (HR = 0.25, p < 0.05), TGCT (HR = 0.25, p < 0.05), and UCEC (HR = 0.49, p < 0.01). Conversely, LAG3 functions as a risk factor in six other cancers including BRCA (HR = 1.76, p < 0.05), ESA (HR = 7.27, p < 0.05), ESCA (HR = 3.12, p < 0.05), KIRP (HR = 2.94, p < 0.01), SARC (HR = 1.67, p < 0.05), and THCA (HR = 4.25, p < 0.05) (Fig. 7B).
Fig. 7.
(A) Correlation of LAG3 with overall survival of cancer. Red represents LAG3 high expression and black represents low expression. (B) Correlation of LAG3 with Recurrence-free survival of cancer. Red represents LAG3 high expression and black represents low expression.
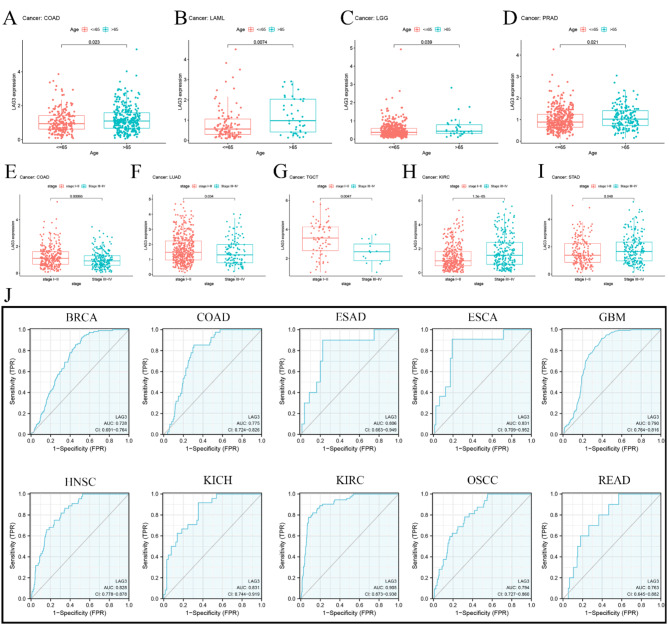
LAG3 has showed a significant correlation with patient age in four cancers. For example, in COAD, LAML, LGG and PRAD, LAG3 get higher expression in patients older than 65 years. In addition, among the five cancers, LAG3 possesses a strong correlation with clinical stage. Comparing to stage I and stage II, LAG3 has lower expression in stage III and stage IV of three cancers including COAD, LUAD and TGCT. But in KIRC and STAD, this result is reversed (Fig. 8A and I). Furthermore, Diagnostic ROC analysis results indicate that levels of LAG3 have good predictive performance across 12 types of cancer, including BRCA (AUC = 0.728), COAD (AUC = 0.775), ESAD (AUC = 0.806), ESCA (AUC = 0.831), GBM (AUC = 0.790), HNSC (AUC = 0.828), KICH (AUC = 0.831), KIRC (AUC = 0.905), OSCC (AUC = 0.794) and READ (AUC = 0.763) (Fig. 8J).
Fig. 8.
(A–I) Correlation of LAG3 with age of cancer onset. (J) Correlation of LAG3 with cancer diagnosis and AUC greater than 0.7 indicates diagnostic significance.
Although LAG3 acts as an inhibitory immune checkpoint, promoting immune escape in tumors and indicating a poor prognosis risk factor, there is limited research on its differential impact on cancer prognosis across different types. To assess LAG3 predictive role in cancer clinical outcomes, we evaluated OS and RFS curves and obtained significant conclusions. LAG3 serves as a protective factor in certain cancers, notably BLCA, CESC, OV, and UCEC. High expression of LAG3 correlates with longer OS and RFS in patients with these four types of cancers. Studies indicate LAG3 as an independent prognostic factor in SKCM and significantly associated with favorable prognosis in it67. Furthermore, histological studies suggest that high LAG3 expression correlates with longer OS in patients with gastric adenocarcinoma, further supporting our research findings68.
The correlation between LAG3 and drug sensitivity
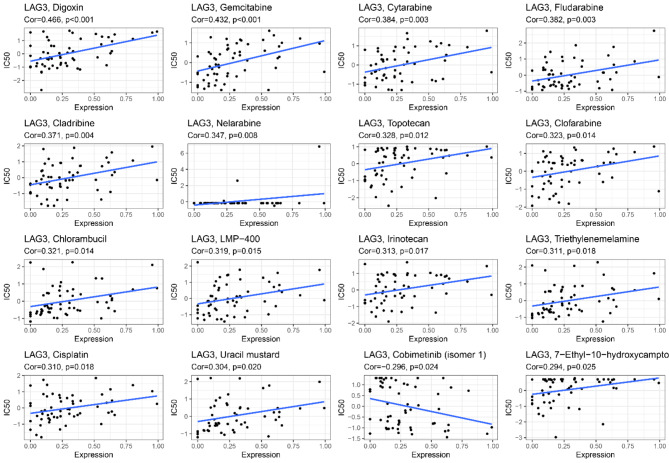
Our results indicate that the expression levels of LAG3 in pan-cancer are moderately positively correlated with the sensitivity to 14 drugs. These drugs include Digoxin (R = 0.466, p < 0.001), Gemcitabine (R = 0.432, p < 0.001), Cytarabine (R = 0.384, p < 0.01), Fludarabine (R = 0.382, p < 0.01), Cladribine (R = 0.371, p < 0.01), Nelarabine (R = 0.347, p < 0.01), Topotecan (R = 0.328, p < 0.05), Clofarabine (R = 0.323, p < 0.05), Chlorambucil (R = 0.321, p < 0.05), LMP-400 (R = 0.319, p < 0.05), Irinotecan (R = 0.313, p < 0.05), Triethylenemelamine (R = 0.311, p < 0.05), Cisplatin (R = 0.310, p < 0.05), and Uracil mustard (R = 0.304, p < 0.05). Additionally, Cobimetinib (R = −0.296, p < 0.05) and 7-Ethyl-10-hydroxycamptothecin (R = 0.294, p < 0.05) show weaker correlations with LAG3 (Fig. 9).
Fig. 9.
Correlation of LAG3 with drug sensitivity.
Conclusion
Our investigation reveals that relative to normal tissues, LAG3 displays distinct patterns of expression and mutational profiles in tumor tissues, predominantly manifesting in tumor-associated lymphocytes. Elevated LAG3 expression correlates positively with immune and stromal scores within TME and exhibits favorable associations with the infiltration of various immune cell subsets such as CD8+T cells, M1-polarized macrophages, and NK cells. Notably, LAG3 demonstrates its highest expression levels in the C2 immune subtype across diverse tumor types. At a molecular level, LAG3 is intricately linked with the MMR system, MSI, and TMB, participating actively in multiple signaling pathways including those related to T cell receptor signaling. LAG3 functions not only as a predisposing factor in certain cancers but also as a protective element in malignancies such as BLCA, CESC, OV, and UCEC. This underscores its dualistic role in cancer immunity and prognostication, potentially serving as a valuable biomarker.
Further exploration into LAG3 involvement in immune modulation, its interactions with the MMR system, MSI, and its diverse clinical prognostic implications is imperative to broaden its utility in immune checkpoint therapy.
Materials and methods
Sample information
The basic data of this research were derived from 15,901 normal tissue samples and 10,201 cancer tissue samples in TCGA (https://www.genome.gov/Funded-Programs-Projects/Cancer-Genome-Atlas) and GTE-x (https://www.genome.gov/Funded-Programs-Projects/Genotype-Tissue-Expression-Project) databases, these included LAG3 gene expression data, clinical cases, and survival data in order to evaluate the expression level of it in 33 cancers and clinical outcomes. In addition, we obtained a high-channel dataset of 12 cancers from the National Institutes of Health for LAG3 localization analysis in tumor cell subsets. Besides, the HPA was utilized to present the human protein expression models in normal and tumor tissues, and the expression pattern of LAG3 protein in normal and tumor tissues was obtained by means of immunohistochemistry images.
RNA and protein expression of LAG3 in pan-cancer
RNA-sequencing expression profiles and corresponding clinical information for LAG3 were downloaded from the TCGA and GTE-x dataset. All the analysis methods and R package were implemented by R version 4.0.3. If not stated otherwise, two-group data performed by wilcox test.
Single-cell transcriptomic analysis of LAG3
We obtained the raw data of single-cell transcriptome profiling from the Gene Expression Omnibus (GEO) database (https://www.ncbi.nlm.nih.gov/geo/). This includes GSE114727, GSE146771, GSE148842, GSE139324, GSE111360, GSE98638, GSE131907, CRA001160, GSE148190, GSE134520, GSE139555 and GSE139829. And by the using of “Seurat package”, we could generate the object and filtered out cells with poor quality. Then, we conducted standard data preprocessing, where we calculated the percentage of the gene numbers, cell counts and mitochondria sequencing count. The genes which expressed less than only 3 cells were detected and disregarded cells with less than 200 detected gene numbers. As description in the “Seurat package”. The top 100 variable genes were extracted for principal component analysis (PCA). The top principal components were kept for T-SNE visualization and clustering, which by using of the “FindClusters” function implemented in the “Seurat package”. LAG3 expression in each cell is then assessed.
Analyses of LAG3 in pan-cancer for prognosis and clinicopathological association
To further investigate the link between LAG3 expression and clinical outcome, we gathered survival data for each from the TCGA and GTE-x database. All the important metrics were calculated, including OS and RFS. The survival analysis was evaluated using the Kaplan-Meier method and log-rank test. The cut-off value was determined by using the median expression level as the basis. This allowed for the classification of patients into high-risk and low-risk categories. In addition, we conducted a COX analysis in order to evaluate the relationship between LAG3 expression and the prognosis of pan-cancer.
Correlation between mutations and LAG3 in pan-cancer
The TCGA provided the MSI and TMB score. By the using of the “cor. test” command, we built the correlation analysis between tumor microenvironment and cancer gene expression and MSI and TMB. The relationship between MMR-related gene and LAG3 expression was analyzed by the Spearman technique. The “FMB” package in R was used to create the visuals.
Correlation of LAG3 with tumor immune microenvironment and immune cell infiltration in pan-cancer
The R packages “estimate” and “limma” were used to generate immune cells and stromal cell scores. These scores were then used to predict tumor purity as well as the presence of infiltrating stroma and immune cells in cancer tissues. The R packages “ggplot2,” “ggpubr,” and “ggExtra” were used to examine the correlation between LAG3 expression and the immunological microenvironment of the tumor as well as the infiltration of immune cells. The CIBERSORT database was adopted for a more comprehensive analysis of immune cell infiltration in pan-cancer.
Co-expression analysis of immune-related genes and pathway analysis of LAG3 in pan-cancer
Perl software was used to perform co-expression analysis of LAG3 with other immune-related genes in TCGA and GTE-x databases. The R package “limma” was used to perform the co-expression analysis, and the R packages “reshape2” and “R color Brewer” were used to show the results. The KEGG and GO gene sets were found on the website named Gene Set Enrichment Analysis (GSEA).
Drug sensitivity of LAG3 in pan-cancer
Downloaded NCI-60 compound activity data and RNA-seq expression files with Call Miner-TM to analyze and visualize chemosensitivity in pan-cancer (https://discover.nci.nih.gov/cellminer/home.do). The drugs which were approved by FDA or clinically were selected for analysis.
Statistical analysis
Wilcoxon test is used to calculate the intergroup expression differences in pan-cancer as well as the expression of LAG3 in immune subgroups. Log-rank and COX regression are employed to examine the differences in survival curves between high and low LAG3 expression groups. Spearman correlation analysis is used to assess the correlation of LAG3 expression with immune scores, stromal scores, and immune cell infiltration. All data are transformed into logarithmic form, p-value less than 0.05 is considered statistically significant.
Electronic supplementary material
Below is the link to the electronic supplementary material.
Acknowledgements
The authors thank the Key Laboratory of Molecular Diagnostics and Precision Medicine for Surgical Oncology in Gansu Province and the DaVinci Surgery System Database (DSSD, www.davincisurgerydatabase.com) for their help and support in the methodology and pan-cancer analysis process.
Author contributions
YW, YZ and GZ were the co-first authors. YW and YZ conceived and designed the research and revised the manuscript. GZ, YL, SC, CF, LG, KL, SY, YY, LF, JZ and JH conducted all data collection and analysis and compiled charts. GZ, CF and HW were involved in the revision of the manuscript and the reproduction of the figures. HC provided financial support for this research. All authors read and approved the final manuscript.
Funding
This work was funded by the 2021 Central-Guided Local Science and Technology Development Fund (ZYYDDFFZZJ-1), GanSu Joint Scientific Research Fund Major Project under Grant (No.23JRRA1537), National Natural Science Foundation of China (No. 82360498), Gansu Da Vinci robot high-end diagnosis and treatment team construction project, Gansu Province Excellent Doctor Fund Project (23JRRA1320), Natural Science Foundation of Gansu Province (No. 21JR1RA038) and Research project of Traditional Chinese Medicine of Gansu province (GZKZ-2022-6).
Data availability
The analyzed data sets generated during the research are available from the corresponding author upon reasonable request.
Declarations
Competing interests
The authors declare no competing interests.
Footnotes
Publisher’s note
Springer Nature remains neutral with regard to jurisdictional claims in published maps and institutional affiliations.
Contributor Information
Yuan Yuan, Email: lanzhouyy@163.com.
Jin He, Email: hejin1978@163.com.
Hui Cai, Email: caialonteam@163.com.
References
- 1.Bray, F. et al. Global cancer statistics 2018: GLOBOCAN estimates of incidence and mortality worldwide for 36 cancers in 185 countries. CA Cancer J. Clin.68, 394–424. 10.3322/caac.21492 (2018). [DOI] [PubMed] [Google Scholar]
- 2.Torre, L. A., Islami, F., Siegel, R. L., Ward, E. M. & Jemal, A. Global cancer in women: Burden and trends. Cancer Epidemiol. Biomark. Prev.26, 444–457. 10.1158/1055-9965.EPI-16-0858 (2017). [DOI] [PubMed] [Google Scholar]
- 3.Sasco, A. J., Secretan, M. B. & Straif, K. Tobacco smoking and cancer: A brief review of recent epidemiological evidence. Lung Cancer45(Suppl 2), 3–9. 10.1016/j.lungcan.2004.07.998 (2004). [DOI] [PubMed] [Google Scholar]
- 4.Papiez, M. A. & Krzysciak, W. Biological therapies in the treatment of cancer-update and new directions. Int. J. Mol. Sci.10.3390/ijms222111694 (2021). [DOI] [PMC free article] [PubMed] [Google Scholar]
- 5.Yamamoto, S. et al. Randomized phase II study of docetaxel versus paclitaxel in patients with esophageal squamous cell carcinoma refractory to fluoropyrimidine- and platinum-based chemotherapy: OGSG1201. Eur. J. Cancer. 154, 307–315. 10.1016/j.ejca.2021.06.035 (2021). [DOI] [PubMed] [Google Scholar]
- 6.Waarts, M. R., Stonestrom, A. J., Park, Y. C. & Levine, R. L. Targeting mutations in cancer. J. Clin. Invest.13210.1172/JCI154943 (2022). [DOI] [PMC free article] [PubMed]
- 7.Rui, R., Zhou, L. & He, S. Cancer immunotherapies: Advances and bottlenecks. Front. Immunol.14, 1212476. 10.3389/fimmu.2023.1212476 (2023). [DOI] [PMC free article] [PubMed] [Google Scholar]
- 8.Corrado, M. & Pearce, E. L. Targeting memory T cell metabolism to improve immunity. J. Clin. Invest.13210.1172/JCI148546 (2022). [DOI] [PMC free article] [PubMed]
- 9.Deepak, K. G. K. et al. Tumor microenvironment: Challenges and opportunities in targeting metastasis of triple negative breast cancer. Pharmacol. Res.153, 104683. 10.1016/j.phrs.2020.104683 (2020). [DOI] [PubMed] [Google Scholar]
- 10.Sterner, R. C. & Sterner, R. M. CAR-T cell therapy: Current limitations and potential strategies. Blood Cancer J.11, 69. 10.1038/s41408-021-00459-7 (2021). [DOI] [PMC free article] [PubMed] [Google Scholar]
- 11.Zhang, L. & Romero, P. Metabolic control of CD8(+) T cell fate decisions and antitumor immunity. Trends Mol. Med.24, 30–48. 10.1016/j.molmed.2017.11.005 (2018). [DOI] [PubMed] [Google Scholar]
- 12.Park, J., Hsueh, P. C., Li, Z. & Ho, P. C. Microenvironment-driven metabolic adaptations guiding CD8(+) T cell anti-tumor immunity. Immunity. 56, 32–42. 10.1016/j.immuni.2022.12.008 (2023). [DOI] [PubMed] [Google Scholar]
- 13.Ghoneim, H. E., Zamora, A. E., Thomas, P. G. & Youngblood, B. A. Cell-intrinsic barriers of T cell-based immunotherapy. Trends Mol. Med.22, 1000–1011. 10.1016/j.molmed.2016.10.002 (2016). [DOI] [PMC free article] [PubMed] [Google Scholar]
- 14.Darvin, P., Toor, S. M., Sasidharan Nair, V. & Elkord, E. Immune checkpoint inhibitors: Recent progress and potential biomarkers. Exp. Mol. Med.50, 1–11. 10.1038/s12276-018-0191-1 (2018). [DOI] [PMC free article] [PubMed]
- 15.Heinhuis, K. M. et al. Enhancing antitumor response by combining immune checkpoint inhibitors with chemotherapy in solid tumors. Ann. Oncol.30, 219–235. 10.1093/annonc/mdy551 (2019). [DOI] [PubMed] [Google Scholar]
- 16.Agrawal, B., Gupta, N. & Konowalchuk, J. D. MUC1 mucin:A putative regulatory (checkpoint) molecule of T cells. Front. Immunol.9, 2391. 10.3389/fimmu.2018.02391 (2018). [DOI] [PMC free article] [PubMed] [Google Scholar]
- 17.Sharpe, A. H. & Pauken, K. E. The diverse functions of the PD1 inhibitory pathway. Nat. Rev. Immunol.18, 153–167. 10.1038/nri.2017.108 (2018). [DOI] [PubMed] [Google Scholar]
- 18.Pardoll, D. M. The blockade of immune checkpoints in cancer immunotherapy. Nat. Rev. Cancer. 12, 252–264. 10.1038/nrc3239 (2012). [DOI] [PMC free article] [PubMed] [Google Scholar]
- 19.Dolina, J. S., Van Braeckel-Budimir, N., Thomas, G. D. & Salek-Ardakani, S. CD8(+) T cell exhaustion in cancer. Front. Immunol.12, 715234. 10.3389/fimmu.2021.715234 (2021). [DOI] [PMC free article] [PubMed] [Google Scholar]
- 20.Abdeladhim, M., Karnell, J. L. & Rieder, S. A. In or out of control: Modulating regulatory T cell homeostasis and function with immune checkpoint pathways. Front. Immunol.13, 1033705. 10.3389/fimmu.2022.1033705 (2022). [DOI] [PMC free article] [PubMed] [Google Scholar]
- 21.Okoye, I. S., Houghton, M., Tyrrell, L., Barakat, K. & Elahi, S. Coinhibitory receptor expression and Immune checkpoint blockade: Maintaining a balance in CD8(+) T cell responses to chronic viral infections and cancer. Front. Immunol.8, 1215. 10.3389/fimmu.2017.01215 (2017). [DOI] [PMC free article] [PubMed] [Google Scholar]
- 22.Kalbasi, A. & Ribas, A. Tumour-intrinsic resistance to immune checkpoint blockade. Nat. Rev. Immunol.20, 25–39. 10.1038/s41577-019-0218-4 (2020). [DOI] [PMC free article] [PubMed] [Google Scholar]
- 23.Qin, S. et al. Novel immune checkpoint targets: Moving beyond PD-1 and CTLA-4. Mol. Cancer18, 155. 10.1186/s12943-019-1091-2 (2019). [DOI] [PMC free article] [PubMed] [Google Scholar]
- 24.Tawbi, H. A. et al. Relatlimab and Nivolumab versus Nivolumab in untreated advanced Melanoma. N. Engl. J. Med.386, 24–34. 10.1056/NEJMoa2109970 (2022). [DOI] [PMC free article] [PubMed] [Google Scholar]
- 25.Graydon, C. G., Mohideen, S. & Fowke, K. R. LAG3’s enigmatic mechanism of action. Front. Immunol.11, 615317. 10.3389/fimmu.2020.615317 (2020). [DOI] [PMC free article] [PubMed] [Google Scholar]
- 26.Paik, J. Nivolumab plus relatlimab: First approval. Drugs82, 925–931. 10.1007/s40265-022-01723-1 (2022). [DOI] [PubMed] [Google Scholar]
- 27.Su, J. et al. Relatlimab: A novel drug targeting immune checkpoint LAG-3 in melanoma therapy. Front. Pharmacol.14, 1349081. 10.3389/fphar.2023.1349081 (2023). [DOI] [PMC free article] [PubMed] [Google Scholar]
- 28.Hu, S., Liu, X., Li, T., Li, Z. & Hu, F. LAG3 (CD223) and autoimmunity: Emerging evidence. J. Autoimmun.112, 102504. 10.1016/j.jaut.2020.102504 (2020). [DOI] [PubMed] [Google Scholar]
- 29.Ruffo, E., Wu, R. C., Bruno, T. C., Workman, C. J. & Vignali, D. A. A. lymphocyte-activation gene 3 (LAG3): The next immune checkpoint receptor. Semin. Immunol.42, 101305. 10.1016/j.smim.2019.101305 (2019). [DOI] [PMC free article] [PubMed] [Google Scholar]
- 30.Bae, J. et al. Targeting LAG3/GAL-3 to overcome immunosuppression and enhance anti-tumor immune responses in multiple myeloma. Leukemia36, 138–154. 10.1038/s41375-021-01301-6 (2022). [DOI] [PMC free article] [PubMed] [Google Scholar]
- 31.Huang, J. et al. Fibrinogen like protein-1 knockdown suppresses the proliferation and metastasis of TU-686 cells and sensitizes laryngeal cancer to LAG-3 blockade. J. Int. Med. Res.50, 3000605221126874. 10.1177/03000605221126874 (2022). [DOI] [PMC free article] [PubMed] [Google Scholar]
- 32.Workman, C. J., Dugger, K. J. & Vignali, D. A. Cutting edge: molecular analysis of the negative regulatory function of lymphocyte activation gene-3. J. Immunol.169, 5392–5395. 10.4049/jimmunol.169.10.5392 (2002). [DOI] [PubMed] [Google Scholar]
- 33.Workman, C. J. & Vignali, D. A. The CD4-related molecule, LAG-3 (CD223), regulates the expansion of activated T cells. Eur. J. Immunol.33, 970–979. 10.1002/eji.200323382 (2003). [DOI] [PubMed] [Google Scholar]
- 34.Hannier, S., Tournier, M., Bismuth, G. & Triebel, F. CD3/TCR complex-associated lymphocyte activation gene-3 molecules inhibit CD3/TCR signaling. J. Immunol.161, 4058–4065 (1998). [PubMed] [Google Scholar]
- 35.Perez-Pena, J. et al. A Transcriptomic Immunologic Signature predicts favorable outcome in neoadjuvant chemotherapy treated triple negative breast tumors. Front. Immunol.10, 2802. 10.3389/fimmu.2019.02802 (2019). [DOI] [PMC free article] [PubMed] [Google Scholar]
- 36.Sidaway, P. Breast cancer: LAG3 expression indicates favourable outcomes. Nat. Rev. Clin. Oncol.1410.1038/nrclinonc.2017.164 (2017). [DOI] [PubMed]
- 37.Turnis, M. E., Andrews, L. P. & Vignali, D. A. Inhibitory receptors as targets for cancer immunotherapy. Eur. J. Immunol.45, 1892–1905. 10.1002/eji.201344413 (2015). [DOI] [PMC free article] [PubMed] [Google Scholar]
- 38.Hodi, F. S. et al. Improved survival with ipilimumab in patients with metastatic melanoma. N. Engl. J. Med.363, 711–723. 10.1056/NEJMoa1003466 (2010). [DOI] [PMC free article] [PubMed] [Google Scholar]
- 39.Topalian, S. L. et al. Safety, activity, and immune correlates of anti-PD-1 antibody in cancer. N Engl. J. Med.366, 2443–2454. 10.1056/NEJMoa1200690 (2012). [DOI] [PMC free article] [PubMed] [Google Scholar]
- 40.Yarchoan, M. et al. Characterization of the immune microenvironment in hepatocellular carcinoma. Clin. Cancer Res.23, 7333–7339. 10.1158/1078-0432.CCR-17-0950 (2017). [DOI] [PMC free article] [PubMed] [Google Scholar]
- 41.Yu, G. et al. Identification of metabolism-related gene-based subgroup in prostate cancer. Front. Oncol.12, 909066. 10.3389/fonc.2022.909066 (2022). [DOI] [PMC free article] [PubMed] [Google Scholar]
- 42.Bilotta, M. T., Antignani, A. & Fitzgerald, D. J. Managing the TME to improve the efficacy of cancer therapy. Front. Immunol.13, 954992. 10.3389/fimmu.2022.954992 (2022). [DOI] [PMC free article] [PubMed] [Google Scholar]
- 43.Zhu, D., Wu, Z. H., Xu, L. & Yang, D. L. Single sample scoring of hepatocellular carcinoma: A study based on data mining. Int. J. Immunopathol. Pharmacol.35, 20587384211018388. 10.1177/20587384211018389 (2021). [DOI] [PMC free article] [PubMed] [Google Scholar]
- 44.Hsu, C. L. et al. Exploring markers of exhausted CD8 T cells to predict response to Immune checkpoint inhibitor therapy for hepatocellular carcinoma. Liver Cancer10, 346–359. 10.1159/000515305 (2021). [DOI] [PMC free article] [PubMed] [Google Scholar]
- 45.Ye, L. et al. In vivo CRISPR screening in CD8 T cells with AAV-sleeping beauty hybrid vectors identifies membrane targets for improving immunotherapy for glioblastoma. Nat. Biotechnol.37, 1302–1313. 10.1038/s41587-019-0246-4 (2019). [DOI] [PMC free article] [PubMed] [Google Scholar]
- 46.Ji, S., Xu, M., Cai, C. & He, X. MESP1-knockdown inhibits the proliferation and epithelial mesenchymal transition of hepatocellular carcinoma and enhances the tumor-suppressive effect of 5-fluorouracil. Biochem. Biophys. Res. Commun.670, 1–11. 10.1016/j.bbrc.2023.05.036 (2023). [DOI] [PubMed] [Google Scholar]
- 47.Li, W. et al. Correlation between PD-1/PD-L1 expression and polarization in tumor-associated macrophages: A key player in tumor immunotherapy. Cytokine Growth Factor. Rev.67, 49–57. 10.1016/j.cytogfr.2022.07.004 (2022). [DOI] [PubMed] [Google Scholar]
- 48.Gordon, S. R. et al. PD-1 expression by tumour-associated macrophages inhibits phagocytosis and tumour immunity. Nature. 545, 495–499. 10.1038/nature22396 (2017). [DOI] [PMC free article] [PubMed] [Google Scholar]
- 49.Kim, R. et al. Early tumor-immune microenvironmental remodeling and response to first-line fluoropyrimidine and platinum chemotherapy in advanced gastric cancer. Cancer Discov.12, 984–1001. 10.1158/2159-8290.CD-21-0888 (2022). [DOI] [PMC free article] [PubMed] [Google Scholar]
- 50.Zhang, J., Huang, D., Saw, P. E. & Song, E. Turning cold tumors hot: From molecular mechanisms to clinical applications. Trends Immunol.43, 523–545. 10.1016/j.it.2022.04.010 (2022). [DOI] [PubMed] [Google Scholar]
- 51.Jansen, C. S. et al. An intra-tumoral niche maintains and differentiates stem-like CD8 T cells. Nature. 576, 465–470. 10.1038/s41586-019-1836-5 (2019). [DOI] [PMC free article] [PubMed] [Google Scholar]
- 52.Chihara, N. et al. Induction and transcriptional regulation of the co-inhibitory gene module in T cells. Nature. 558, 454–459. 10.1038/s41586-018-0206-z (2018). [DOI] [PMC free article] [PubMed] [Google Scholar]
- 53.Thorsson, V. et al. The immune landscape of cancer. Immunity48, 812–830. 10.1016/j.immuni.2018.03.023 (2018). [DOI] [PMC free article] [PubMed] [Google Scholar]
- 54.Nakayama, M., Hori, A., Toyoura, S. & Yamaguchi, S. I. Shaping of T cell functions by trogocytosis. Cells. 10.3390/cells10051155 (2021). [DOI] [PMC free article] [PubMed] [Google Scholar]
- 55.Palmeri, M. et al. Real-world application of tumor mutational burden-high (TMB-high) and microsatellite instability (MSI) confirms their utility as immunotherapy biomarkers. ESMO Open7, 100336. 10.1016/j.esmoop.2021.100336 (2022). [DOI] [PMC free article] [PubMed] [Google Scholar]
- 56.Picard, E., Verschoor, C. P., Ma, G. W. & Pawelec, G. Relationships between Immune landscapes, genetic subtypes and responses to Immunotherapy in colorectal cancer. Front. Immunol.11, 369. 10.3389/fimmu.2020.00369 (2020). [DOI] [PMC free article] [PubMed] [Google Scholar]
- 57.McCarthy, A. J. et al. Heterogenous loss of mismatch repair (MMR) protein expression: A challenge for immunohistochemical interpretation and microsatellite instability (MSI) evaluation. J. Pathol. Clin. Res.5, 115–129. 10.1002/cjp2.120 (2019). [DOI] [PMC free article] [PubMed] [Google Scholar]
- 58.Baretti, M. & Le, D. T. DNA mismatch repair in cancer. Pharmacol. Ther.189, 45–62. 10.1016/j.pharmthera.2018.04.004 (2018). [DOI] [PubMed] [Google Scholar]
- 59.Svrcek, M. et al. MSI/MMR-deficient tumor diagnosis: Which standard for screening and for diagnosis? Diagnostic modalities for the colon and other sites: Differences between tumors. Bull. Cancer106, 119–128. 10.1016/j.bulcan.2018.12.008 (2019). [DOI] [PubMed] [Google Scholar]
- 60.Salem, M. E. et al. Relationship between MLH1, PMS2, MSH2 and MSH6 gene-specific alterations and tumor mutational burden in 1057 microsatellite instability-high solid tumors. Int. J. Cancer. 147, 2948–2956. 10.1002/ijc.33115 (2020). [DOI] [PMC free article] [PubMed] [Google Scholar]
- 61.Yamamoto, H. et al. Interrelationship between microsatellite instability and microRNA in gastrointestinal cancer. World J. Gastroenterol.18, 2745–2755. 10.3748/wjg.v18.i22.2745 (2012). [DOI] [PMC free article] [PubMed] [Google Scholar]
- 62.Kanehisa, M. & Goto, S. KEGG: Kyoto encyclopedia of genes and genomes. Nucleic Acids Res.28, 27–30. 10.1093/nar/28.1.27 (2000). [DOI] [PMC free article] [PubMed] [Google Scholar]
- 63.Kanehisa, M. Toward understanding the origin and evolution of cellular organisms. Protein Sci.28, 1947–1951. 10.1002/pro.3715 (2019). [DOI] [PMC free article] [PubMed] [Google Scholar]
- 64.Kanehisa, M., Furumichi, M., Sato, Y., Kawashima, M. & Ishiguro-Watanabe, M. KEGG for taxonomy-based analysis of pathways and genomes. Nucleic Acids Res.51, D587–D592. 10.1093/nar/gkac963 (2023). [DOI] [PMC free article] [PubMed] [Google Scholar]
- 65.Voorwerk, L. et al. Immune induction strategies in metastatic triple-negative breast cancer to enhance the sensitivity to PD-1 blockade: The TONIC trial. Nat. Med.25, 920–928. 10.1038/s41591-019-0432-4 (2019). [DOI] [PubMed] [Google Scholar]
- 66.Zhang, C., Dang, D., Cong, L., Sun, H. & Cong, X. Pivotal factors associated with the immunosuppressive tumor microenvironment and melanoma metastasis. Cancer Med.10, 4710–4720. 10.1002/cam4.3963 (2021). [DOI] [PMC free article] [PubMed] [Google Scholar]
- 67.Peng, J., Du, Z., Sun, Y. & Zhou, Z. A combined analysis of multi-omics data reveals the prognostic values and immunotherapy response of LAG3 in human cancers. Eur. J. Med. Res.28, 604. 10.1186/s40001-023-01583-9 (2023). [DOI] [PMC free article] [PubMed] [Google Scholar]
- 68.Relationship between LAG-3 FGL1 MHC-II expression and prognosis in gastric antrum cancer tissue. China Oncol. Clin.. 51, 64–69. 10.12354/j.issn.1000-8179.2024.20231251 (2024). [Google Scholar]
Associated Data
This section collects any data citations, data availability statements, or supplementary materials included in this article.
Supplementary Materials
Data Availability Statement
The analyzed data sets generated during the research are available from the corresponding author upon reasonable request.


