

Abstract
The incorporation of digital pathology in clinical practice will require the training of pathologists in digital skills. Our study aimed to assess the reliability among pathologists in determining tumor percentage in whole slide images (WSI) of non-small cell lung cancer (NSCLC) using digital image analysis, and study how the results correlate with the molecular findings. Pathologists from nine centers were trained to quantify epithelial tumor cells, tumor-associated stromal cells, and non-neoplastic cells from NSCLC WSI using QuPath. Then, we conducted two consecutive ring trials. In the first trial, analyzing four WSI, reliability between pathologists in the assessment of tumor cell percentage was poor (intraclass correlation coefficient (ICC) 0.09). After performing the first ring trial pathologists received feedback. The second trial, comprising 10 WSI with paired next-generation sequencing results, also showed poor reliability (ICC 0.24). Cases near the recommended 20% visual threshold for molecular techniques exhibited higher values with digital analysis. In the second ring trial reliability slightly improved and human errors were reduced from 5.6% to 1.25%. Most discrepancies arose from subjective tasks, such as the annotation process, suggesting potential improvement with future artificial intelligence solutions.
Supplementary Information
The online version contains supplementary material available at 10.1038/s41598-024-75175-w.
Subject terms: Non-small-cell lung cancer, Translational research, Image processing
Introduction
Pathology departments are steadily beginning to incorporate digital pathology into clinical practice, digitalizing histopathological slides to be diagnosed by a pathologist on a computer. Moreover, digital pathology allows for a myriad of uses besides solely replacing microscopes. For instance, we can analyze the whole slide images (WSI) to obtain morphometric information or apply different artificial intelligence algorithms to improve workflows. However, pathologists are not yet routinely trained in digital skills, which may hinder the adoption of digital pathology.
In this context, INGENIO is a multicenter Spanish study that, among other objectives, aims to standardize digital pathology for routine clinical care. Each participating center will analyze clinical, radiological, molecular, and pathological data of advanced stage non-small cell lung cancer (NSCLC) patients. For this purpose, radiomics, next-generation sequencing (NGS) and digital pathology techniques will be used.
Regarding digital pathology, the first objective is to study the tumor percentage in WSI and correlate the results with the molecular findings obtained by NGS. This technique plays an important role for the detection of alterations which may be therapeutically targeted1. The percentage of tumor present in a sample is paramount for the correct performance of NGS. Current guidelines recommend a minimum of 20–30% of tumor cells for NGS studies2. Nowadays, pathologists evaluate tumor percentage by visual examination on hematoxylin-eosin (HE) slides3, with the subjectivity that this entails4–6. In this regard, different studies have investigated the use of digital pathology for a better tumor percentage estimation, showing less variability and good correlation with visual examination. In fact, previous publications have reported better reproducibility when pathologists are aided by a digital pathology solution. For example, Luchini et al.7 performed a systematic review and meta-analysis of the assessment of a proliferation marker, Ki67, in pancreatic neuroendocrine neoplasms, reporting very high concordance between digital and visual quantification (94% global concordance). Hamilton et al.8 compared a digital solution, TissueMark, with the manual assessment of tumor percentage in NSCLC, finding strong correlation. Kazdal et al.9 also estimated tumor cell content in NSCLC using two digital solutions (QuPath10 and HALO) and visual assessment. They found better agreement between the two pieces of software compared to visual assessment. However, most studies compare the visual evaluation performed by various pathologists against the digital analysis performed by one individual9,11–13.
This study aimed to evaluate the reliability among pathologists in the determination of tumor percentage in WSI using digital image analysis. We also studied how the assessment of tumor content may affect NGS results. For these purposes, we trained participant pathologists in digital image analysis and designed two consecutive ring trials.
Materials and methods
Pathologists training and digital analysis
Standard operation procedures (SOPs) were developed describing the digital analysis to be carried out step-by-step. After sending these SOPs to the participating pathologists, online training sessions were performed using an example NSCLC HE WSI.
The digital analysis was performed in QuPath10, an open-source software for digital pathology image analysis. Firstly, HE WSI were imported to QuPath projects. In each WSI, after performing the color deconvolution with the built-in QuPath tool, tumor and non-tumor areas were annotated, excluding artefacts, keratin, carbon deposits and necrosis14. The tumor area was defined as epithelial tumor cells and their associated stroma, while non-tumor area encompassed those normal structures usually encountered in lung biopsies, such as cartilage, alveoli, or bronchial epithelium. After the annotations, cell segmentation was performed in the tumor annotation using the built-in QuPath tool. These cells were then classified as epithelial tumor cells and tumor-associated stromal cells using the QuPath built-in object classifier. Finally, cells were segmented in the normal annotation (non-neoplastic cells). The number of epithelial tumor cells (TC), tumor-associated stromal cells, and non-neoplastic cells of each WSI was obtained. A case was considered high in tumor content when it had > 20% TC2.
Sample cohort
The Hospital Universitario 12 de Octubre Ethics Committee approved the INGENIO project (23/237), and informed consent obtained. The study was performed in accordance with the Declaration of Helsinki. Representative advanced NSCLC cases were selected, comprising different histopathological subtypes. These cases were visually evaluated to determine TC percentage by an expert thoracic pathologist (AB).
The first ring trial consisted of 4 NSCLC HE WSI. After performing the first ring trial, pathologists received feedback on their performance and human errors were corrected.
The second ring trial comprised 10 NSCLC HE WSI with paired NGS results, half of them presenting molecular alterations. NGS was performed using Oncomine Focus Assay (ThemoFisher Scientific). This technique is routinely performed in advanced stage NSCLC. Thus, the results were retrieved from the electronic health records. No additional clinical information was collected.
To further study the relationship between low and high TC percentage and NGS alterations we additionally analyzed all cases included in the INGENIO project to date by one of the participating centers. These cases are from advanced stage NSCLC patients with valid NGS results. One pathologist performed the QuPath analysis after the second ring trial, as previously described. NGS results and visual TC percentage were retrieved from the electronic health records.
Statistical analysis
Data generated from the digital analysis were centrally analyzed using R 4.1.015. The reliability between pathologists in the determination of TC percentage was measured with the intraclass correlation coefficient (ICC). Correlation between visual and QuPath analysis was measured with the Pearson correlation coefficient. They were calculated using the R packages irr16 and ggpubr17.
Results
Interobserver agreement in the first ring trial
Nine centers participated in the first ring trial. The HE of each WSI and a representative digital analysis are shown in Fig. 1. The summary statics are provided in Supplemental Table 1. The percentage of TC assigned to each WSI by QuPath and visual examination are presented in Fig. 2. The reliability between pathologists using QuPath to determine the cell percentage was poor, with 0.09 ICC.
Fig. 1.
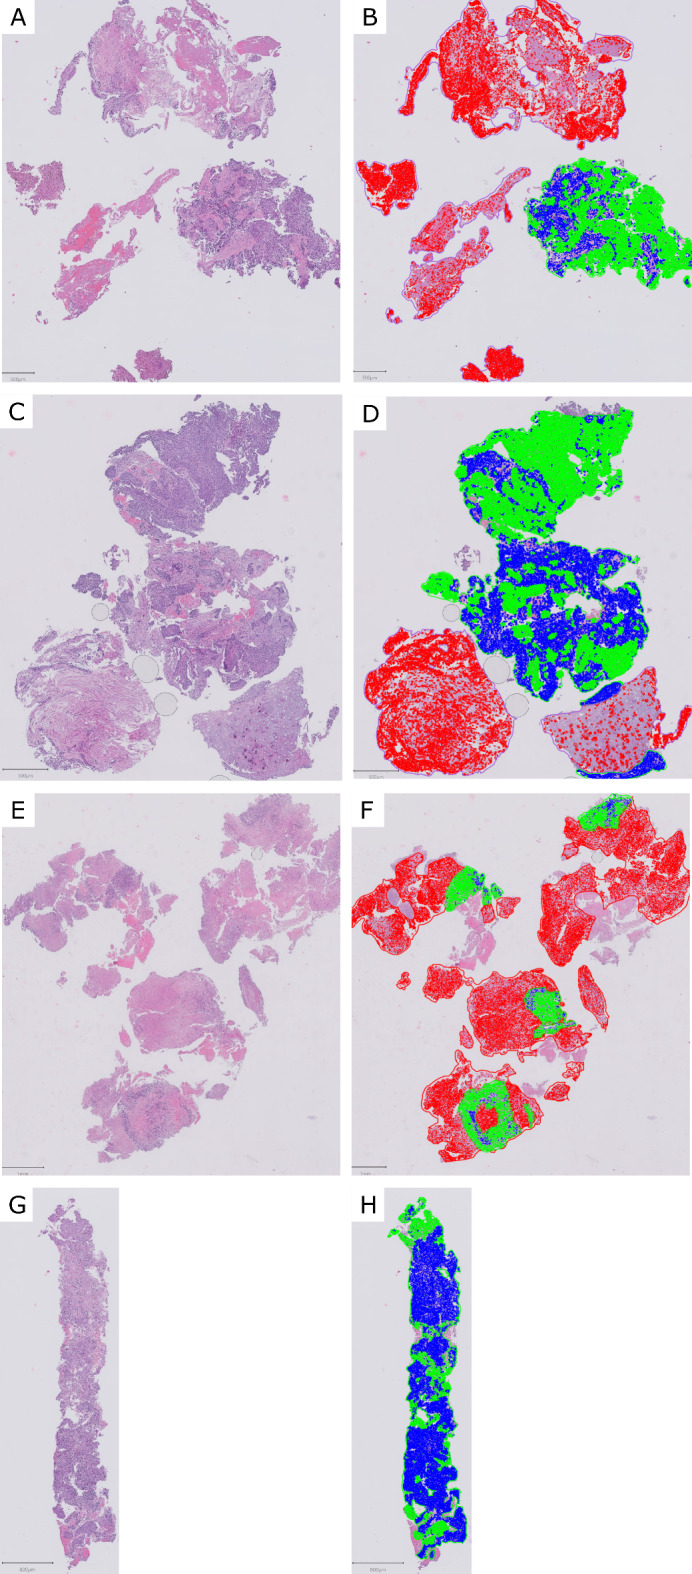
Cases used in the first ring trial, before and after digital analysis. (A-B) WSI 1, (C-D) WSI 2, (E-F) WSI 3, (G-H) WSI 4. Green: epithelial tumor cell; blue: tumor-associated stromal cell; red: non-neoplastic cell.
Fig. 2.

Boxplots with the percentage of cells detected in each WSI in the first ring trial. The diamonds represent the percentage of cells assigned by visual assessment.
The assignation of low TC percentage in WSI 2 by one center was due to human error, in which the pathologist performed the cell segmentation of non-neoplastic cells in the whole WSI instead of just inside the normal tissue annotation. The outlier in WSI 4 was due to the pathologists giving very little training examples to classify TC and tumor-associated stromal cells, thus resulting in a suboptimal classification. WSI 3 presented the highest variability. It contained high levels of necrosis (Fig. 1-E), which some pathologists excluded altogether, and others classified as normal.
To summarize, out of 36 digital analyses with QuPath (4 WSI by 9 pathologists), only 2 discordances (5.6%) were due to human errors (WSI 2 and WSI 4), while the rest were due to the annotation process.
Interobserver agreement in the second ring trial
Eight centers participated in the second ring trial. The percentage of TC assigned to each WSI are presented in Fig. 3. The summary statics are provided in Supplemental Table 2. Some WSI and their digital analyses are shown in Fig. 4. The reliability between pathologists slightly improved, but was again poor, with 0.24 ICC. Of note, cases with high TC percentage by visual examination, like WSI 8 or WSI 4, were assigned lower values by QuPath; while those with low TC percentage were assigned higher values (WSI 9 or WSI 10) (Figs. 3 and 5).
Fig. 3.

Boxplots with the percentage of cells detected in each WSI in the second ring trial. The diamonds represent the percentage of cells assigned by visual assessment.
Fig. 4.

Some examples of discordances. (A-C) WSI 2, with significant differences in the cell classification. (B) 12% tumor cell percentage, (C) 44.3% tumor cell percentage. (D-F) WSI 3, a poorly differentiated carcinoma (inset) with differences both in the annotations and cell classification. (E) 35.1% tumor cell percentage, (F) 14.3% tumor cell percentage. (G-I) WSI 5 with differences in cell classification. (H) 47.5% tumor cell percentage, I) 9% tumor cell percentage. (J-L) WSI 9, (K) 41.5% tumor cell percentage, with sub-optimal cell classification, (L) 45.4% tumor cell percentage, where due to a human error non-neoplastic cells were classified as tumor cells. Green: epithelial tumor cell; blue: tumor-associated stromal cell; red: non-neoplastic cell.
Fig. 5.

Bland-Altman plot of tumor cell percentage by QuPath versus visual assessment. The horizontal black line shows the mean of the differences between both techniques, and the doted red horizontal lines show the upper and lower 95% limits of agreement (mean of the differences ± 1,96*standard deviation).
A human error was detected in only one (1.25%) out of 80 analyses (10 WSI analyzed by 8 pathologists), which resulted in a disagreement. In this case, one center classified all non-neoplastic cells of WSI 9 as TC, thus obtaining 45.4% TC percentage (Fig. 4-L). The remaining discrepancies were due to differences in the annotations and in the examples given for the classification of TC versus tumor-associated stromal cells.
Tumor content and NGS results
The second ring trial contained five consecutive cases with molecular alterations detected by NGS (WSI 1, WSI 2, WSI 3, WSI 9 and WSI 10) and five consecutive cases without molecular alterations (WSI 4, WSI 5, WSI 6, WSI 7 and WSI 8). Three cases with low TC (≤ 20%) by visual assessment presented NGS alterations (WSI 2, WSI 9 and WSI 10). Using QuPath, WSI 9 and WSI 10 were assigned > 20% TC by 62.5% and 50% centers, respectively. The mean TC percentage in WSI 9 was 27% (excluding the center with the human error). The mean TC percentage in WSI 10 was 39%. Regarding WSI 2, 37.5% centers assigned > 20% TC, with a mean TC percentage of 19.6% (Supplemental Table 2).
To further assess how tumor content affects NGS results, we analyzed 41 cases included in the INGENIO project by one of the participating centers. We found a positive correlation between visual assessment and QuPath (R = 0.7) (Fig. 6). We did not find molecular alterations in eight cases (19.5%). All of these had ≥ 30% TC by visual assessment, and all but one > 25% TC by QuPath. Three cases (7.3%) had low TC (= 20%) by visual assessment, and all of them presented NGS alterations. Using QuPath, the TC of these cases was 17.5%, 30.1% and 19.8%.
Fig. 6.

Scatter plot of the percentage of tumor cell percentage by visual assessment versus QuPath analysis. Cases with NGS alterations are represented with a blue triangle, while cases without NGS alterations are represented with a red circle.
Discussion
To our knowledge, this is the first report of a digital pathology ring trial for tumor content assessment using QuPath, a free open-source software for digital image analysis10. We trained pathologists from different Spanish centers to obtain the percentage of TC in NSCLC HE WSI. We found that the agreement between pathologists was poor. This was mostly due to the subjectivity of some tasks, like the annotation phase and the classification of TC and tumor-associated stromal cells.
In the first ring trial, two outliers were due to human errors (5.6% of all analyses, in WSI 2 and WSI4); while only one was found in the second ring trial (1.25% of all analyses, in WSI 9 (Fig. 4-L)). Thus, the training between both ring trials greatly reduced human errors. This may explain the better agreement results in the second ring trial results, from 0.09 ICC in the first ring trial to 0.24 ICC in the second one. In this regard, a previous study18 on the reproducibility of TC content by visual examination of colon and lung carcinoma reported an improvement in successive trials, thanks to a better definition of tumor cellularity.
To face the subjectivity issue, in the future, we plan to apply artificial intelligence tools to perform the annotations. The distinction of tumor versus normal in lung cancer WSI using machine learning and deep learning has been previously reported with good results19,20. Thus, we will train models with annotations made by different pathologists in WSI from different scanners, as well as exploring commercial solutions.
A distinctive aspect of our study is the evaluation of HE WSI by different pathologists using digital analysis against the visual assessment by one pathologist. Most published studies report good correlation between manual and digital assessment of different tasks, usually comparing visual assessment by various pathologists against digital analysis by one pathologist. In fact, in this study, we observed strong correlation (R = 0.7) between visual assessment and QuPath in the 41 INGENIO cases. For example, Naso et al.11 reported a concordance correlation coefficient of 92.5% in the assessment of PDL1 in NSCLC between the visual assessment by three pathologists and one pathologist using QuPath. As mentioned in the introduction, Kazdal et al.9 analyzed the agreement in the estimation of TC content of 120 NSCLC between 19 visual raters and two software, QuPath and Halo. Using HE, they obtained 0.87 ICC between both platforms. The ICC decreased to 0.48 when comparing the results obtained by the 19 visual raters. Moreover, when comparing the average TC content of the software against that of the visual raters, the ICC was 0.78. Ruiter et al.12 studied the number of CD57 positive cells in head and neck squamous cell carcinoma, comparing two visual raters against QuPath. While the concordance between the two visual raters was excellent (ICC 0.92), the concordance between each of them and QuPath was moderate to good (ICC 0.74 and 0.84). These slightly worse results were due to background staining and artifacts, resulting in outliers when analyzing with QuPath. Lastly, Cieslak et al.13 analyzed CD30 and CD3 expression in mycosis fungoides samples, comparing 3 visual raters against QuPath and found a strong correlation between both (R = 0.93). However, they do not provide ICC values and it seems that QuPath assigns higher CD30/CD3 scores than the raters. In any case, it would be interesting to explore the concordance between different QuPath users in these tasks.
In this regard, Loughrey et al.21 studied the concordance of three reviewers (a pathologist, a biochemist and a computer scientist) using QuPath in the evaluation of p53 and CD3 in tissue microarrays. In their case, discordances were mostly due to applying different QuPath parameters and thresholds, probably because the cores of tissue microarrays do not require such delicate annotations as WSI.
A dilemma we encountered while designing the digital analysis methodology was related to perfection versus accessibility. As INGENIO is a multicenter study, we opted for the latter. For instance, some pathologists are familiarized with more precise cell segmentation methods, like Stardist22. However, Stardist requires Groovy scripts for it to work, making its use more difficult than QuPath’s built-in cell detection tool. Thus, the built-in cell detection tool is more accessible to pathologists, as they are not usually trained in programming skills. In addition, Stardist also requires more computing power and running time, as it is based on a deep learning method, and the computers used by pathologists are usually not suited for high-performance. In this context, a recent article23 describes the use of a QuPath script (QuANTUM) to assess tumor cellular fraction in NSCLC HE WSI. They follow a similar process for digital analysis as the one used in this study, with the implementation of Stardist for cell detection. It might have the disadvantages of scripting and computer power described above, but the use of on-screen instructions make it more user friendly. Moreover, in this article23 they also study how TC percentage affects copy number variations (CNVs) calling. They found a 24% difference in detected CNVs when using the TC percentage from QuANTUM compared to visual assessment, underscoring the need for a more reliable TC percentage evaluation.
Regarding molecular alterations, in our study, three cases with ≤ 20% TC by visual assessment presented NGS alterations (WSI 2 20% TC, WSI 9 10% TC and WSI 10 20% TC). When studying them with QuPath, the mean TC percentage of WSI 9 and WSI 10 were 27% (excluding the center with the human error) and 39%, respectively, while for WSI 2 it was 19.6%. These are all cases near the visual detection threshold recommended for molecular techniques2, and these low TC percentage cases were frequently assigned higher values by QuPath than by visual assessment. In these cases, setting the cutoff with a digital estimate greater than or equal to 20% would be more appropriate than with the visual assessment since they would be accepted as cases suitable for routine diagnosis of NGS. This is in contrast to the findings of L’Imperio et al.23. , who report higher TC percentage by visual assessment. Interestingly, when studying 41 cases included in the INGENIO project, we found that those with lowest TC (both by visual assessment and by QuPath) did present molecular alterations. These cases with a percentage higher than 20% by digital analysis with no alterations by NGS, can be considered as “flat profile” or without mutations cases. However, it is recognized that low TC might yield false negative NGS results. For example, Patel et al.24 reported a primary colorectal cancer with driver mutations in ATM and TP53, both not detected in the liver metastases with 10% TC. Another study found that in samples with at least 3% TC, the coverage is acceptable, and genomic alterations with therapeutic potential are identified. They also describe this scenario in samples with at least a surface area of 10 mm225. In this regard, it has been suggested that tumor area might have a greater impact on NGS results than TC percentage26. In this study26, they report that small biopsies with less than 10 mm2 usually had low TC percentage and high NGS fail rate, thus the area being a confounding factor. In this context, digital pathology can be an aid, as it offers a straightforward means of measuring areas, and its results can be easily combined with TC percentage. In this way, we can make a better selection of cases in which to perform NGS.
The main limitation of this study is the scarce number of cases. We chose to send only four WSI in the first ring trial due to the learning curve, as most pathologists had no previous experience performing digital analysis. The second ring trial served mainly to gain experience and speed, both of which will be needed as each center will analyze their own 150 cases in the INGENIO project.
In view of these results, we can conclude that when digital pathology relies on manual methods it still has some degree of subjectivity. However, with the advent of artificial intelligence solutions, we will be able to face this limitation and support pathologists in their tasks.
Electronic supplementary material
Below is the link to the electronic supplementary material.
Author contributions
Conceptualization: PG, MJLC, JP; Methodology: ICB, MJLC, JP; Formal analysis and investigation: ICB, LP, AI, DC, FLR, AE, JC, SGA, DCQ, RN, IER, ISG, AB; Writing - original draft preparation: ICB, JP; Writing - review and editing: ICB, LP, AI, DC, FLR, AE, JC, SGA, DCQ, RN, IER, ISG, ADR, JEO, PG, MJLC, AB, JP; Funding acquisition: JP; Resources: JP; Supervision: JP.
Funding
This work has been supported by CIBERONC (grant CB16/12/00316), by Instituto de Salud Carlos III (ISCIII) through the project “PI22/01892”, by the European Union. Developed with the financial support of Immune4ALL Project (PMP22/00054), with European funds of the Recovery, Transformation and Resilence Plan; and by the Spanish Ministry of Science, Innovation and Universities under grants PID2022-141493OB-I00 and PDC2022-133865-I00 (10.13039/501100011033/MCIN/AEI/ERDF, UE) - NextGenerationEU. FLR also acknowledges the support of Fundacion Mutua Madrileña (AP18051-2022), Instituto de Salud Carlos III (ISCIII) (PI22-01700, co-funded by the European Union) and the Comunidad de Madrid iLUNG Program (P2022/BMD-7437). CÓDIGO DE PROYECTO: PMP21/00107 - TÍTULO: “INtegrative GENomic, digital Imaging and clinical information towards Precision Oncology Optimization – INGENIO” - IP: LUIS PAZ-ARES RODRIGUEZ “ENTIDAD FINANCIADORA: INSTITUTO DE SALUD CARLOS III (ISCIII). PROYECTO “FINANCIADO CON CARGO A FONDOS NEXTGENERATIONEU, QUE FINANCIAN LAS ACTUACIONES DEL MRR”.
Data availability
The datasets generated during and/or analyzed during the current study are available from the corresponding author on reasonable request.
Declarations
Competing interests
PG declares consultancy/honoraria from Abbvie, Amgen, AstraZeneca, Bayer, BMS, Boehringer Ingelheim, Daiichi Sankyo, GlaxoSmithKline, Janssen, Lilly, MSD, Novartis, Pfizer, Roche, Sanofi and Takeda. Direct funding from Medscape and Touch Medical.The remaining authors declare no competing interests. The remaining authors declare no competing interests.
Footnotes
Publisher’s note
Springer Nature remains neutral with regard to jurisdictional claims in published maps and institutional affiliations.
References
- 1.Hendriks, L. E. et al. Oncogene-addicted metastatic non-small-cell lung cancer: ESMO Clinical Practice Guideline for diagnosis, treatment and follow-up☆. Ann. Oncol. 34, 339–357 (2023). [DOI] [PubMed] [Google Scholar]
- 2.Garrido, P. et al. Updated guidelines for predictive biomarker testing in advanced non-small-cell lung cancer: A National Consensus of the Spanish Society of Pathology and the Spanish Society of Medical Oncology. Clin. Transl Oncol. 22, 989–1003 (2020). [DOI] [PMC free article] [PubMed] [Google Scholar]
- 3.Dufraing, K. et al. Neoplastic cell percentage estimation in tissue samples for molecular oncology: Recommendations from a modified Delphi study. Histopathology. 75, 312–319 (2019). [DOI] [PMC free article] [PubMed] [Google Scholar]
- 4.Dacic, S. et al. International Association for the study of lung cancer study of reproducibility in assessment of pathologic response in resected lung cancers after neoadjuvant therapy. J. Thorac. Oncol. 18, 1290–1302 (2023). [DOI] [PubMed] [Google Scholar]
- 5.Thunnissen, E. et al. Defining morphologic features of invasion in pulmonary nonmucinous adenocarcinoma with lepidic growth: A proposal by the International Association for the Study of Lung Cancer Pathology Committee. J. Thorac. Oncol. 18, 447–462 (2023). [DOI] [PubMed] [Google Scholar]
- 6.Smits, A. J. J. et al. The estimation of tumor cell percentage for molecular testing by pathologists is not accurate. Mod. Pathol. 27, 168–174 (2014). [DOI] [PubMed] [Google Scholar]
- 7.Luchini, C. et al. Ki-67 assessment of pancreatic neuroendocrine neoplasms: systematic review and meta-analysis of manual vs. digital pathology scoring. Mod. Pathol. 35, 712–720 (2022). [DOI] [PMC free article] [PubMed] [Google Scholar]
- 8.Hamilton, P. W. et al. Automated tumor analysis for molecular profiling in lung cancer. Oncotarget. 6, 27938–27952 (2015). [DOI] [PMC free article] [PubMed] [Google Scholar]
- 9.Kazdal, D. et al. Conventional and semi-automatic histopathological analysis of tumor cell content for multigene sequencing of lung adenocarcinoma. Transl Lung Cancer Res. 10, 1666–1678 (2021). [DOI] [PMC free article] [PubMed] [Google Scholar]
- 10.Bankhead, P. et al. QuPath: Open source software for digital pathology image analysis. Sci. Rep. 7, 16878 (2017). [DOI] [PMC free article] [PubMed] [Google Scholar]
- 11.Naso, J. R. et al. Automated PD-L1 scoring for non-small cell lung carcinoma using open-source software. Pathol. Oncol. Res. 27, 609717 (2021). [DOI] [PMC free article] [PubMed] [Google Scholar]
- 12.de Ruiter, E. J. et al. Assessing the prognostic value of tumor-infiltrating CD57 + cells in advanced stage head and neck cancer using QuPath digital image analysis. Virchows Arch. 481, 223–231 (2022). [DOI] [PMC free article] [PubMed] [Google Scholar]
- 13.Cieslak, C., Mitteldorf, C., Krömer-Olbrisch, T., Kempf, W. & Stadler, R. QuPath analysis for CD30 + cutaneous T-cell lymphoma. Am. J. Dermatopathol. 45, 93–98 (2023). [DOI] [PubMed] [Google Scholar]
- 14.Humphries, M. P. et al. Critical appraisal of programmed death ligand 1 reflex diagnostic testing: Current standards and future opportunities. J. Thorac. Oncol. 14, 45–53 (2019). [DOI] [PMC free article] [PubMed] [Google Scholar]
- 15.R Core Team. R: A language and environment for statistical computing. (2022).
- 16.Gamer, M., Lemon, J. & Fellows, I. irr: Various Coefficients of Interrater Reliability and Agreement. (2019).
- 17.Kassambara, A. ggpubr. ‘ggplot2’ Based Publication Ready Plots. (2023).
- 18.Lhermitte, B. et al. Adequately defining tumor cell proportion in tissue samples for molecular testing improves interobserver reproducibility of its assessment. Virchows Arch. 470, 21–27 (2017). [DOI] [PubMed] [Google Scholar]
- 19.Yu, K. H. et al. Predicting non-small cell lung cancer prognosis by fully automated microscopic pathology image features. Nat. Commun. 7, 12474 (2016). [DOI] [PMC free article] [PubMed] [Google Scholar]
- 20.Coudray, N. et al. Classification and mutation prediction from non-small cell lung cancer histopathology images using deep learning. Nat. Med. 24, 1559–1567 (2018). [DOI] [PMC free article] [PubMed] [Google Scholar]
- 21.Loughrey, M. B. et al. Validation of the systematic scoring of immunohistochemically stained tumour tissue microarrays using QuPath digital image analysis. Histopathology. 73, 327–338 (2018). [DOI] [PubMed] [Google Scholar]
- 22.Schmidt, U., Weigert, M., Broaddus, C. & Myers, G. Cell detection with star-convex polygons. In Medical Image Computing and Computer Assisted Intervention – MICCAI 2018 (eds. Frangi, A. F., Schnabel, J. A., Davatzikos, C., Alberola-López, C. & Fichtinger, G.). 265–273 10.1007/978-3-030-00934-2_30 (Springer, 2018).
- 23.L’Imperio, V. et al. Digital counting of tissue cells for molecular analysis: The QuANTUM pipeline. Virchows Arch. 10.1007/s00428-024-03794-9 (2024). [DOI] [PubMed] [Google Scholar]
- 24.Patel, S. B. et al. Recommendations for specimen and therapy selection in colorectal cancer. Oncol. Ther. 9, 451–469 (2021). [DOI] [PMC free article] [PubMed] [Google Scholar]
- 25.Morris, S. et al. Performance of next-generation sequencing on small tumor specimens and/or low tumor content samples using a commercially available platform. PLoS One. 13, e0196556 (2018). [DOI] [PMC free article] [PubMed] [Google Scholar]
- 26.Goswami, R. S. et al. Identification of factors affecting the success of next-generation sequencing testing in solid tumors. Am. J. Clin. Pathol. 145, 222–237 (2016). [DOI] [PubMed] [Google Scholar]
Associated Data
This section collects any data citations, data availability statements, or supplementary materials included in this article.
Supplementary Materials
Data Availability Statement
The datasets generated during and/or analyzed during the current study are available from the corresponding author on reasonable request.