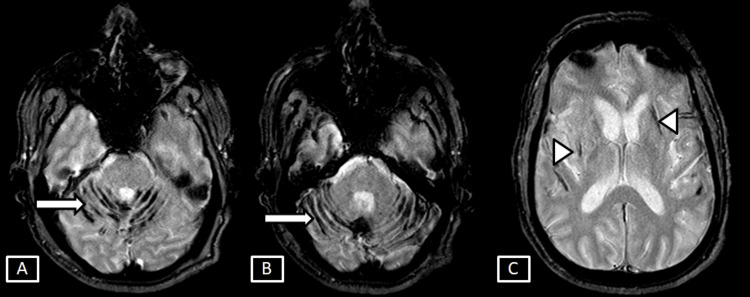
Figure 11. Case 3 MRI brain T2 GRE sequences.
Images show symmetrical linear areas of blooming along the bilateral cerebellar foliae and vermis (A, B) represented by the white arrows. Also, hemosiderin deposition is seen along the chronic infarct changes of the right lentiform nucleus and left external capsule represented by the white arrowheads.
GRE: Gradient Echo

