

Abstract
Objectives
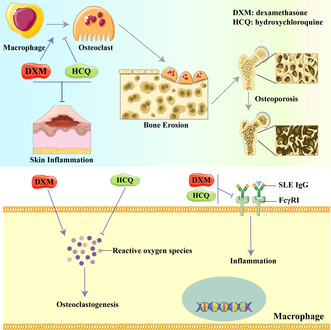
Systemic lupus erythematosus (SLE) is a chronic and severe autoimmune disease characterised by persistent inflammation. Hydroxychloroquine (HCQ) and glucocorticoids (GCs) are the primary agents commonly used in combination as the first‐line treatment for SLE. Nevertheless, the specific mechanisms responsible for the effectiveness of this combined therapy with HCQ and GCs have not been fully elucidated. This study aimed to reveal the mechanism behind combined HCQ and GC treatment in lupus.
Methods
An SLE IgG‐induced inflammation model was used to investigate the anti‐inflammatory effects of HCQ and dexamethasone (DXM). A glucocorticoid‐induced osteoporosis (GIOP) model was used to investigate the inhibitory effect of HCQ on osteoclastogenesis. Inflammation was assessed by haematoxylin and eosin staining. Bone metabolism was determined structurally via microcomputer tomography and in bone marrow‐derived osteoclast cultures.
Results
An SLE IgG‐induced inflammation model demonstrated that HCQ could not ameliorate inflammation alone but could enhance the anti‐inflammatory effect of GCs by decreasing the expression of FcγRI on macrophages. HCQ inhibited osteoclastogenesis induced by GCs and RANKL by upregulating nuclear factor erythroid 2‐related factor 2 and limiting reactive oxygen species formation, which mitigated GC‐induced bone loss.
Conclusion
The results indicate that HCQ improved the anti‐inflammatory effects of GCs and inhibits the osteoclastogenesis in experimental lupus. This study offers valuable insights into the mechanisms underlying the combined treatment of lupus with HCQ and GCs.
Keywords: glucocorticoids, hydroxychloroquine, inflammation, osteoporosis, ROS, systemic lupus erythematosus
Our results suggest that hydroxychloroquine (HCQ) cannot ameliorate the acute inflammation induced by lupus IgG but inhibits osteoclastogenesis in experimental lupus. The mechanism underlying the inhibition of dexamethasone‐induced osteoclastogenesis by HCQ is through the regulation of nuclear factor erythroid 2‐related factor 2 expression and reactive oxygen species production.
Introduction
Systemic lupus erythematosus (SLE) is a severe inflammatory autoimmune disease. The disease is characterised by a high level of autoantibodies and damage to multiple organs, including the kidneys, skin, joints, heart, brain and lungs. 1 , 2 , 3 The prevalence of SLE ranges from 30 to 150 per 100 000, with the incidence ranging from 2.2 to 23.1 per 100 000 per year worldwide. 4 Skin damage is the second most common manifestation of SLE. 5
Hydroxychloroquine (HCQ) is an antimalarial drug commonly recommended as background therapy for SLE, except in cases where contraindications exist. 6 Numerous clinical studies have shown the beneficial and potentially curative effects of antimalarials, particularly HCQ, in SLE, with reports indicating a reduction in mortality by more than 50%. 7 , 8 , 9 While HCQ toxicity can be minimised at doses lower than 5 mg kg−1 per day, 10 it cannot be completely avoided through weight‐based dosing. The mechanism of HCQ action is complex and not fully understood. 10 Research has suggested that HCQ partially inhibits the effects of toll‐like receptors 7 and 9 by accumulating in the lysosomes and autophagosomes of phagocytic cells, thereby altering local pH levels. 10 , 11 , 12 Additionally, HCQ inhibits the activity of cyclic GMP‐AMP synthase, which plays a critical role in suppressing interferon‐1 (IFN‐1) production. 13 HCQ also mitigates inflammation by inhibiting various inflammatory cytokines, including interleukin‐1 (IL‐1), interleukin‐6 (IL‐6), interferon‐γ (IFN‐γ) and tumor necrosis factor‐α (TNF‐α). 14 , 15 Furthermore, HCQ may prevent the fusion of autophagosomes with lysosomes, leading to the inhibition of autoantigen presentation. 12
Glucocorticoids (GCs) are the first‐line treatment for SLE. GCs exert a strong anti‐inflammatory effect and rapidly improve SLE symptoms. 7 However, the use of GCs has various side effects, 16 with a high dose administered only in the acute phase. Glucocorticoid‐induced osteoporosis (GIOP) is a common side effect, and more than 10% of patients receiving long‐term GC therapy are diagnosed with a fracture. 17 However, a recent prospective observational study with over 28 years of follow‐up reported that fragility fractures were not directly dependent on the dose of GCs used in SLE patients, 18 which highlights the mechanism of GIOP.
Fc gamma receptors (FcγRs) are responsible for recognising IgG‐coated targets. FcγRI, a high‐affinity activating FcγR, is predominantly expressed on the surfaces of monocytes/macrophages and dendritic cells. 19 The intracellular subunit of FcγRI contains an immunoreceptor tyrosine‐based activation motif (ITAM), which transduces IgG‐induced activating signals, recruiting the spleen tyrosine kinase. 19 Our previous studies have shown that FcγRI‐activated monocytes/macrophages contribute to the deposition of autoantibodies in organs in SLE, leading to damage in various organs and tissues, including the skin, liver, spleen and joints. 20 , 21 , 22 , 23 , 24 FcγRs are highly expressed in osteoclasts, the key functional cells involved in bone remodelling. Together with the receptor activator of nuclear factor‐κB ligand (RANKL), FcγRs facilitate the development of osteoclasts from monocytes/macrophages. 25
Reactive oxygen species (ROS), including oxygen free radicals and nonradical oxidants, are involved in several physiological and pathological processes. 26 Several studies have reported that ROS mediate bone modelling and remodelling and also promote osteoclast differentiation. 27 , 28 , 29
This study explored the mechanisms involved in the combined use of HCQ and GCs as a first‐line treatment for SLE. The findings revealed that HCQ did not directly alleviate acute inflammation and did not influence the anti‐inflammatory effects of GCs on inflammation triggered by SLE IgG. However, HCQ was effective in inhibiting osteoclastogenesis and the development of osteoporosis induced by GCs.
Results
HCQ does not inhibit SLE IgG‐induced inflammation
Although HCQ is the most common first‐line agent for SLE treatment, especially for cutaneous lupus treatment, 4 , 30 the mechanism underlying its action in SLE remains unclear. Since our previous studies demonstrated that the deposition of SLE IgG on tissues plays a crucial role in multiorgan and tissue damage in SLE, 31 we investigated whether HCQ inhibits inflammation induced by SLE IgG. We used animal models of skin inflammation induced by intradermal injections of SLE IgG. The results revealed a nonsignificant difference in the severity of skin inflammation between the mice treated with HCQ and the control mice treated with normal saline (Figure 1a and b).
Figure 1.
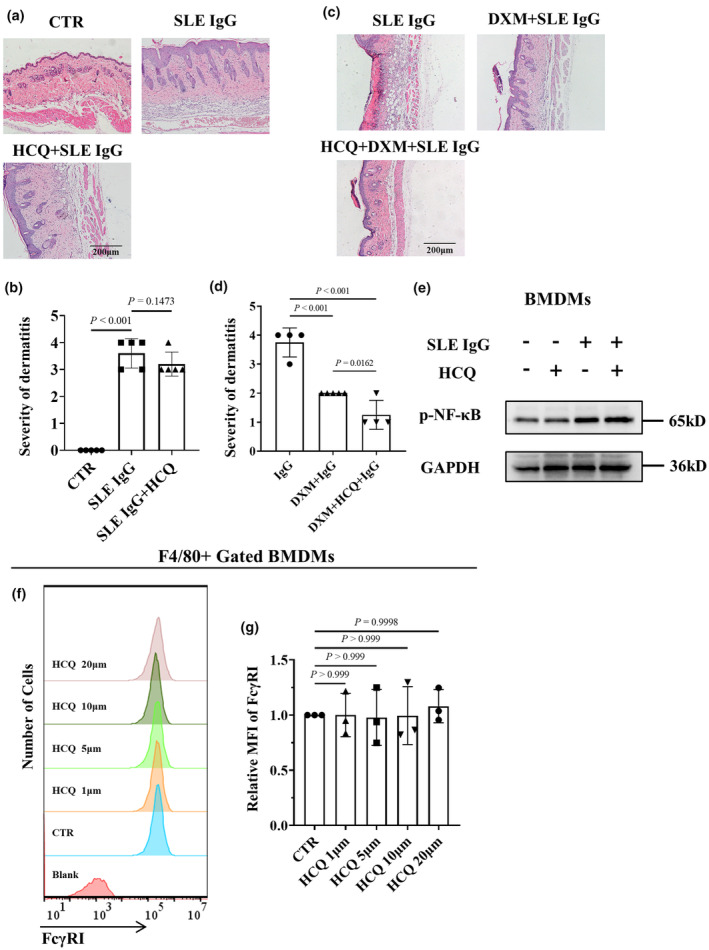
Effect of hydroxychloroquine (HCQ) on systemic lupus erythematosus (SLE) IgG‐induced inflammation. (a) Representative histopathological images of skin inflammation in 8‐week‐old male C57BL/6 mice 3 days after intradermal injection of SLE IgG and with or without HCQ treatment. Scale bar, 200 μm. These data are based on only one unreplicated experiment. (b) Statistical analysis of the severity of skin inflammation in mice injected with SLE IgG (n = 5 per group). (c) Representative histopathological images of skin inflammation in 8‐week‐old male C57BL/6 mice 3 days after intradermal injection of SLE IgG and with or without dexamethasone (DXM) and/or HCQ treatment. Scale bar, 200 μm. These data are based on only one unreplicated experiment. (d) Statistical analysis of the severity of skin inflammation in mice treated with SLE and/or DXM and HCQ (n = 5 per group). (e) Representative images of phosphorylated NF‐κB (p‐NF‐κB) and total NF‐κB protein levels regulated by SLE IgG and/or HCQ in BMDMs, as detected via western blotting. These data are based on only one unreplicated experiment. (f) Flow cytometry–based FcγRI expression in F4/80+ BMDMs treated with various doses of HCQ for 24 h. The data shown are representative of one of three experiments. (g) Relative MFI of FcγRI in the HCQ group compared with that in the CTR group (n = 3 per group). In b, d, g, statistical analyses were performed using one‐way ANOVA for multiple comparisons.
A previously published study demonstrated that SLE IgG could upregulate NF‐κB expression in the dermal region 32 ; therefore, we determined whether HCQ suppresses NF‐κB activation induced by SLE IgG in macrophages. The results indicated that HCQ failed to inhibit NF‐κB phosphorylation induced by SLE IgG in bone marrow–derived macrophages (BMDMs) (Figure 1e).
Our previous studies demonstrated that monocytes/macrophages are crucial in mediating skin inflammation induced by SLE IgG. FcγRI (CD64) serves as the primary regulator of the inflammatory signalling pathway triggered by SLE IgG in these monocytes/macrophages. 22 , 24 , 32 We investigated the effect of HCQ on monocytes/macrophages in vitro. First, it was determined whether HCQ regulates FcγRI expression. Flow cytometry data indicated that HCQ did not regulate FcγRI expression (Figure 1f and g). It was subsequently investigated whether HCQ affects the effect of SLE IgG on FcγRI expression in BMDMs and splenic macrophages. The results indicated that HCQ did not affect the effect of SLE IgG on FcγRI expression in BMDMs or splenic macrophages (Figure 2a, b, e and f).
Figure 2.
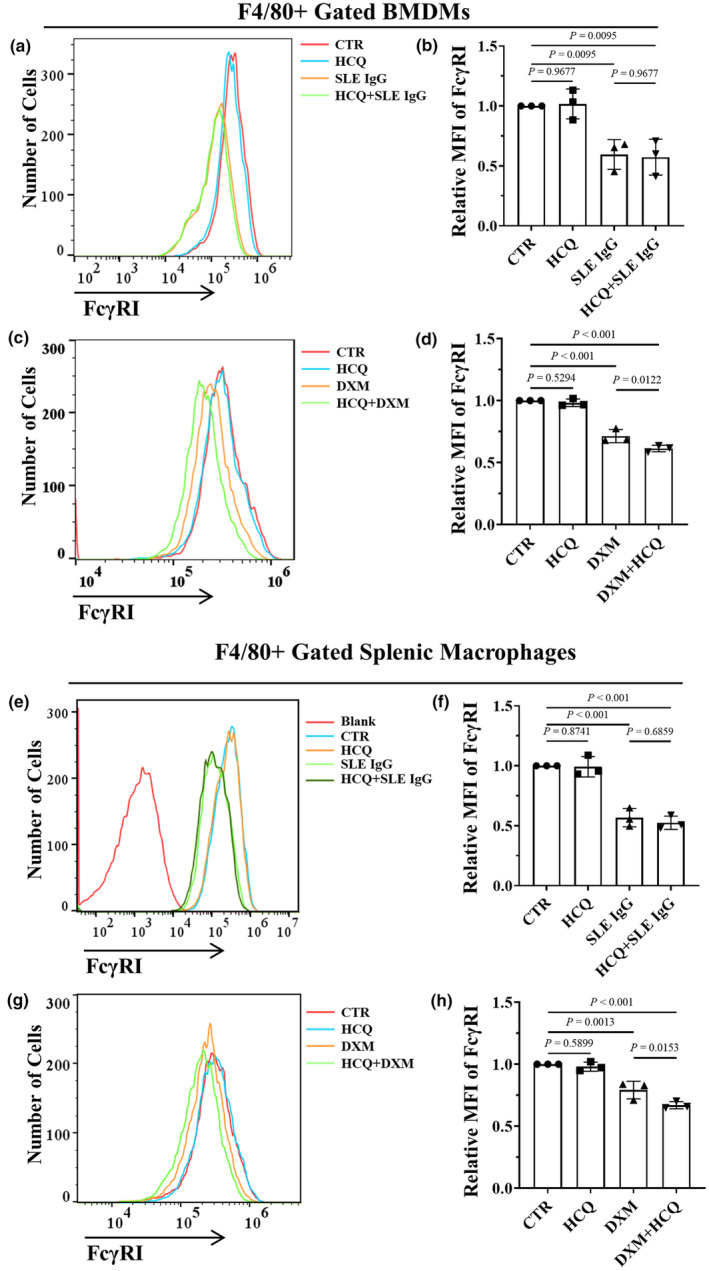
Effect of hydroxychloroquine (HCQ) on FcγRI expression in BMDMs and splenic macrophages. (a) Flow cytometry–based FcγRI expression in F4/80+ BMDMs treated with 10 μM HCQ and/or 100 μg mL−1 systemic lupus erythematosus (SLE) IgG for 24 h. The data shown are representative of one of three experiments. (b) Relative MFI of FcγRI in F4/80+ BMDMs treated with HCQ and/or SLE IgG, as indicated, compared with that in the CTR group (n = 3 per group). (c) Flow cytometry–based FcγRI expression in F4/80+ BMDMs treated with 10 μM HCQ and/or 10 μM dexamethasone (DXM) for 24 h. The data shown are representative of one of three experiments. (d) Relative MFI of FcγRI in F4/80+ BMDMs treated with HCQ and DXM compared with those in the CTR group (n = 3 per group). (e) Flow cytometry–based FcγRI expression in F4/80+ splenic macrophages treated with 10 μM HCQ and/or 100 μg mL−1 SLE IgG for 24 h. The data shown are representative of one of three experiments. (f) Relative MFI of FcγRI in F4/80+ splenic macrophages treated with HCQ and/or SLE IgG compared with those in the CTR group (n = 3 per group). (g) Flow cytometry–based FcγRI expression in F4/80+ splenic macrophages treated with 10 μM HCQ and/or 10 μM DXM for 24 h. The data shown are representative of one of three experiments. (h) Relative MFI of FcγRI in F4/80+ BMDMs treated with HCQ and/or DXM compared with that in the CTR group (n = 3 per group). In b, d, f and h, a one‐way ANOVA multiple‐comparison test was used.
These results indicate that HCQ cannot directly inhibit the activation of the SLE IgG/FcγRI/NF‐κB signalling pathway in monocytes/macrophages and cannot ameliorate the acute skin inflammation induced by SLE IgG.
HCQ does not regulate the inhibitory effect of DXM on SLE IgG‐induced inflammation
Hydroxychloroquine alone is insufficient to reduce skin inflammation induced by SLE IgG. GCs, commonly combined with HCQ for SLE treatment, include DXM, a long‐acting GC with potent anti‐inflammatory properties. The anti‐inflammatory effect of the HCQ and DXM combination was investigated, and the results showed that DXM significantly inhibited SLE IgG‐induced skin inflammation, with HCQ slightly enhancing the anti‐inflammatory effect of DXM (Figure 1c and d).
To explore the reasons behind HCQ's moderate enhancement of DXM's anti‐inflammatory effect, the impact of HCQ and DXM on FcγRI expression was further evaluated. Flow cytometry results revealed that DXM reduced FcγRI expression in BMDMs and splenic macrophages in vitro (Figure 2c, d, g and h), suggesting that DXM may inhibit SLE IgG‐induced inflammation by decreasing FcγRI expression. Additionally, HCQ was found to amplify the effect of DXM on FcγRI expression (Figure 2c, d, g and h), indicating that HCQ may facilitate the reduction in FcγRI expression induced by DXM. Consequently, HCQ does not diminish and may slightly enhance the anti‐inflammatory effect of DXM in SLE.
Inhibition of RANKL‐ and DXM‐induced osteoclastogenesis by HCQ in vitro
Glucocorticoids are commonly used for SLE treatment and do not cause severe osteoporosis in some patients with SLE. The possible reason could be that SLE patients are generally premenopausal females, but therapeutic drugs (such as HCQ) may also be involved. On the basis of these findings, we hypothesised that HCQ may have an inhibitory effect on GC‐induced osteoclastogenesis. To test this hypothesis, we first investigated whether HCQ inhibits RANKL‐induced osteoclastogenesis. 33 The results indicated that HCQ efficiently inhibited RANKL‐induced osteoclastogenesis in a dose‐dependent manner; however, HCQ alone had no significant effect on monocyte/macrophage differentiation (Figure 3a and b).
Figure 3.
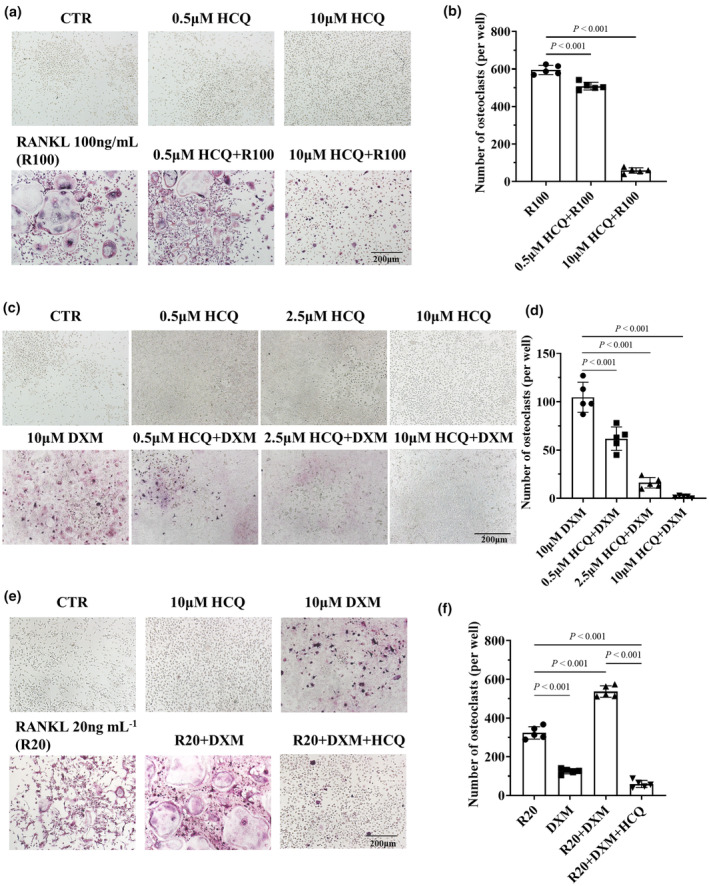
Hydroxychloroquine (HCQ)‐mediated inhibition of osteoclastogenesis induced by dexamethasone (DXM) and/or RANKL in vitro. (a) Representative tartrate‐resistant acid phosphatase (TRAP)‐stained images of osteoclasts differentiated from BMDMs by the administration of various doses of HCQ and/or 100 ng mL−1 RANKL (R100) for 3 days. Scale bar, 200 μm. The data shown are representative of one of five experiments. (b) Statistical analysis of osteoclast numbers (per well) in BMDMs treated with HCQ and/or RANKL (n = 5 per group). (c) Representative TRAP‐stained images of osteoclasts differentiated from BMDMs after the administration of various doses of HCQ and/or 10 μM DXM for 9 days. Scale bar, 200 μm. The data shown are representative of one of five experiments. (d) Statistical analysis of osteoclast numbers (per well) in BMDMs treated with HCQ and/or DXM (n = 5 per group). (e) Representative TRAP‐stained images of osteoclasts differentiated from BMDMs by the administration of RANKL (20 ng mL−1, as R20) and/or 10 μM DXM, as well as 10 μM HCQ, for 9 days. Scale bar, 200 μm. The data shown are representative of one of five experiments. (f) Statistical analysis of osteoclast numbers (per well) in BMDMs treated with RANKL and/or DXM and HCQ (n = 5 per group). In panels b, d and f, a one‐way ANOVA multiple‐comparison test was used.
Second, we determined whether HCQ suppresses GC‐induced osteoclastogenesis. Tartrate‐resistant acid phosphatase (TRAP) staining revealed that DXM‐induced osteoclastogenesis; in contrast, HCQ did not induce the differentiation of BMDMs into osteoclasts (Figure 3c and d). However, HCQ significantly inhibited GC‐induced osteoclastogenesis in a dose‐dependent manner (Figure 3c and d).
Finally, an investigation was conducted to determine whether HCQ inhibits the combined effects of RANKL and DXM on osteoclastogenesis. The results indicated that HCQ effectively suppressed the superimposed effects of DXM and RANKL on osteoclastogenesis (Figure 3e and f).
These results confirmed the inhibitory effect of HCQ on DXM‐induced osteoclastogenesis.
Mitigation of DXM‐induced GIOP by HCQ in vivo
Hydroxychloroquine inhibited DXM‐induced osteoclastogenesis; therefore, we investigated whether HCQ prevents GIOP induced by DXM in vivo.
The GIOP model was established in mice through DXM injection. The experimental schedule is displayed in Figure 4a. Osteoporosis was evaluated in the femurs of mice treated with DXM or DXM + HCQ via micro‐CT. The results indicated that DXM caused cortical bone thinning and bone trabeculae reduction in the mice (Figure 4b). The ratio of bone volume/tissue volume (BV/TV) revealed a lower bone mass in the mice treated with DXM than in those treated with normal saline. No such reduction was found in the DXM + HCQ group compared with the normal saline group (Figure 4c). The trabecular number (Tb.N) was lower in the DXM‐treated mice than in the normal saline‐treated mice; however, the Tb.N was greater in the DXM + HCQ‐treated mice than in the normal saline‐treated mice (Figure 4d). Trabecular separation (Tb.Sp) was greater in DXM‐treated mice than in normal saline‐treated mice; however, the separation did not increase in DXM + HCQ‐treated mice compared with normal saline‐treated mice (Figure 4e).
Figure 4.
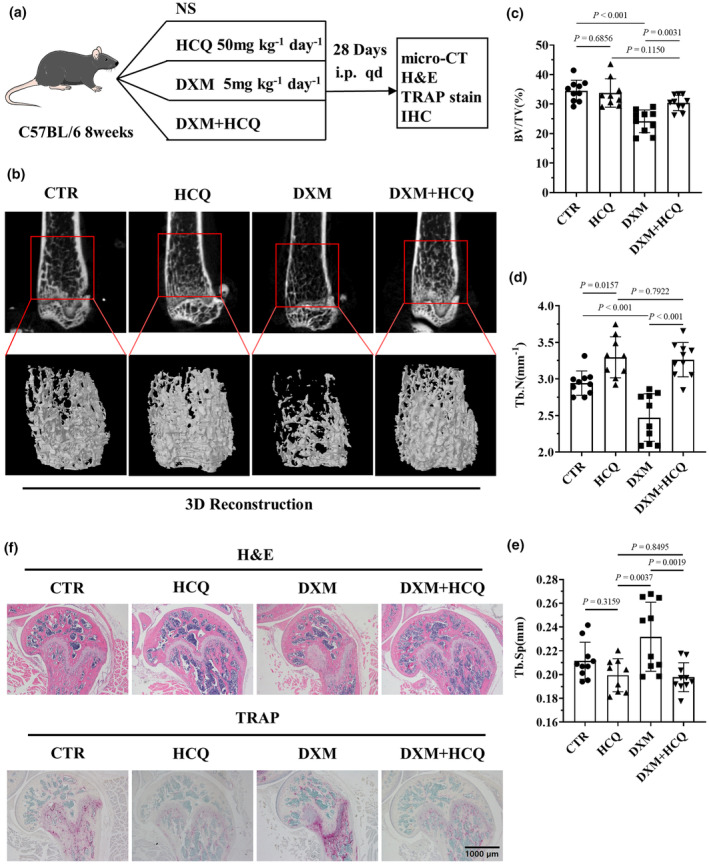
Hydroxychloroquine (HCQ) mitigated dexamethasone (DXM)‐induced GIOP in vivo. (a) Schematic of HCQ‐mediated inhibition of DXM‐induced glucocorticoid‐induced osteoporosis (GIOP). (b) Representative 3D reconstruction images of mouse femurs and trabeculae after the administration of DXM (5 mg kg−1 per day) and/or HCQ (50 mg kg−1 per day) for 28 days; images were reconstructed from micro‐CT scanning data. These data are based on only one unreplicated experiment (n = 10 per group in the CTR, DXM and HCQ + DXM groups; n = 9 in the HCQ group). (c) Statistical analysis of the ratio of bone volume to tissue volume (BV/TV; n = 10 per group in the CTR, DXM and HCQ + DXM groups; n = 9 in the HCQ group). (d) Statistical analysis of the number of trabeculae (Tb.N; n = 10 per group in the CTR, DXM and HCQ + DXM groups; n = 9 in the HCQ group). (e) Statistical analysis of trabecular separation (Tb.Sp; n = 10 per group in the CTR, DXM and HCQ + DXM groups; n = 9 in the HCQ group). (f) Representative haematoxylin and eosin and tartrate‐resistant acid phosphatase (TRAP) staining images of the femur. Scale bar, 200 μm. These data are based on only one unreplicated experiment. (n = 10 per group in the CTR, DXM and HCQ + DXM groups; n = 9 in the HCQ group). In panels c–e, a one‐way ANOVA multiple‐comparison test was used.
To determine whether DXM promotes osteoclastogenesis and whether HCQ inhibits osteoclastogenesis in experimental mice, TRAP staining was performed on femur sections obtained from experimental mice. The results revealed a significant increase in osteoclastogenesis in the femurs of DXM‐treated mice compared with those in the femurs of normal saline‐treated mice. A nonsignificant increase in osteoclastogenesis was observed in the mice treated with DXM + HCQ (Figure 4f).
Taken together, these findings established that HCQ inhibited osteoclastogenesis and osteoporosis induced by DXM.
ROS reduction by HCQ inhibits DXM‐induced osteoclastogenesis
Since ROS regulate bone metabolism and promote osteoclast proliferation and differentiation, 29 we investigated whether DXM induces osteoclastogenesis by increasing ROS in BMDMs. The results indicated that DXM increased the ROS level in BMDMs in a time‐dependent manner (Figure 5a and b). We subsequently sought to determine whether HCQ inhibits DXM‐induced osteoclastogenesis through reducing ROS levels. Flow cytometry analysis indicated that HCQ inhibited DXM‐induced ROS in BMDMs (Figure 5c and d). To identify the role of ROS in osteoclastogenesis, BMDMs were stimulated with RANKL and DXM in the presence or absence of acetylcysteine (NAC), an ROS inhibitor. The results indicated that NAC inhibited osteoclastogenesis induced by RANKL and DXM (Figure 5e and f).
Figure 5.
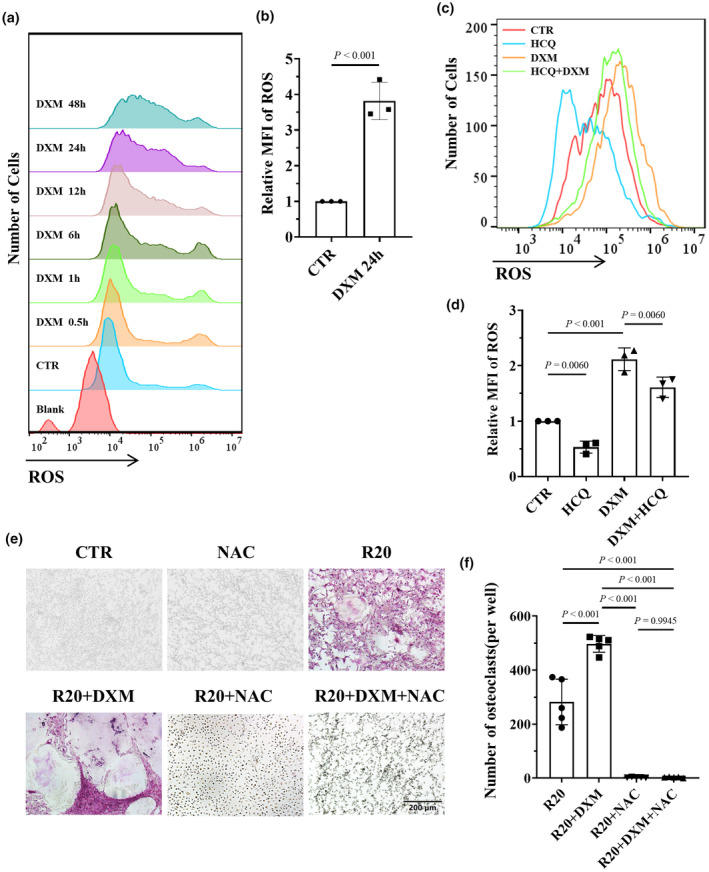
Hydroxychloroquine (HCQ) inhibited osteoclastogenesis by reducing dexamethasone (DXM)‐induced reactive oxygen species (ROS). (a) Flow cytometry–based ROS levels in BMDMs treated with 10 μM DXM at different time points. The data shown are representative of one of three experiments. (b) Relative MFI of ROS in BMDMs treated with DXM for 24 h, as indicated, compared with that in the CTR group (n = 3 per group). (c) Flow cytometry–based ROS levels in BMDMs treated with DXM (10 μM) and/or HCQ (10 μM). The data shown are representative of one of three experiments. (d) Relative MFI of ROS in BMDMs treated with DXM and/or HCQ, as indicated, compared with that in the CTR group (n = 3 per group). (e) Representative tartrate‐resistant acid phosphatase (TRAP)‐stained images of osteoclasts differentiated from BMDMs treated with RANKL (20 ng mL−1, R20) or DXM (10 μM) in the presence or absence of NAC. Scale bar, 200 μm. The data shown are representative of one of five experiments. (f) Statistical analysis of osteoclast numbers (per well) in BMDMs treated with RANKL, DXM, and/or NAC (n = 5 per group). In b, the Student's t‐test was used. In d, f, one‐way ANOVA was used for multiple comparisons.
Nuclear factor erythroid 2‐related factor 2 (NRF2) is the key transcription factor for antioxidative stress. NRF2 regulates the expression of antioxidative enzymes and reduces oxidative stress to inhibit osteoclast differentiation. 34 Therefore, we investigated whether HCQ regulates NRF2 expression. The results indicated that HCQ increased NRF2 expression and that DXM and RANKL reduced NRF2 expression in BMDMs (Figure 6a and b). In addition, HCQ suppressed the superimposed inhibitory effects of RANKL and DXM on NRF2 expression (Figure 6c). Moreover, NRF2 expression was lower in the mice treated with DXM than in those treated with normal saline; however, NRF2 expression was increased in the mice treated with HCQ (Figure 6d and e). To identify the role of NRF2 in osteoclastogenesis induced by RANKL and DXM, we knocked down NRF2 in BMDMs (Figure 7a). The results showed that knocking down NRF2 promoted osteoclastogenesis induced by a low dose of RANKL (20 ng mL−1) (Figure 7b and c). Additionally, knocking down NRF2 increased the number of osteoclasts induced by DXM (Figure 7d and e).
Figure 6.
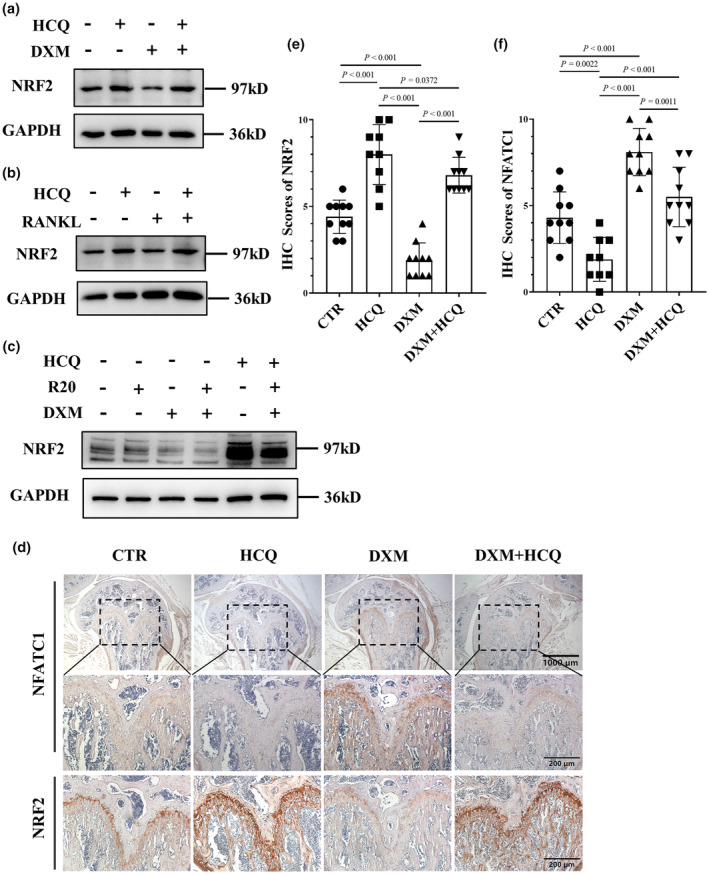
Regulation of nuclear factor erythroid 2‐related factor 2 (NRF2) and nuclear factor of activated T cells cytoplasmic 1 (NFATC1) expression by hydroxychloroquine (HCQ) in BMDMs. (a) Representative images of NRF2 protein levels in BMDMs treated with dexamethasone (DXM) (10 μM) and/or HCQ (10 μM), as detected via western blotting. These data are based on only one unreplicated experiment. (b) Representative images of NRF2 protein levels in BMDMs treated with RANKL (100 ng mL−1) and/or HCQ (10 μM), as detected via western blotting. These data are based on only one unreplicated experiment. (c) Representative images of NRF2 protein levels in BMDMs treated with RANKL (20 ng mL−1) and/or DXM (10 μM) in the presence or absence of HCQ (10 μM), as detected via western blotting. These data are based on only one unreplicated experiment. (d) Representative immunohistochemistry images of NFATC1 and NRF2 in mouse femurs. Scale bars, 1000 μm and 200 μm. These data are based on only one unreplicated experiment (n = 10 per group in the CTR, DXM and HCQ + DXM groups; n = 9 in the HCQ group). (e) Immunohistochemistry (IHC) scores of NRF2 in femur sections related to (d) (n = 10 per group in the CTR, DXM and HCQ + DXM groups; n = 9 in the HCQ group). (f) IHC scores of NFATC1 in femur sections related to (d) (n = 10 per group in the CTR, DXM and HCQ + DXM groups; n = 9 in the HCQ group). In e, f, one‐way ANOVA was used for multiple comparisons.
Figure 7.
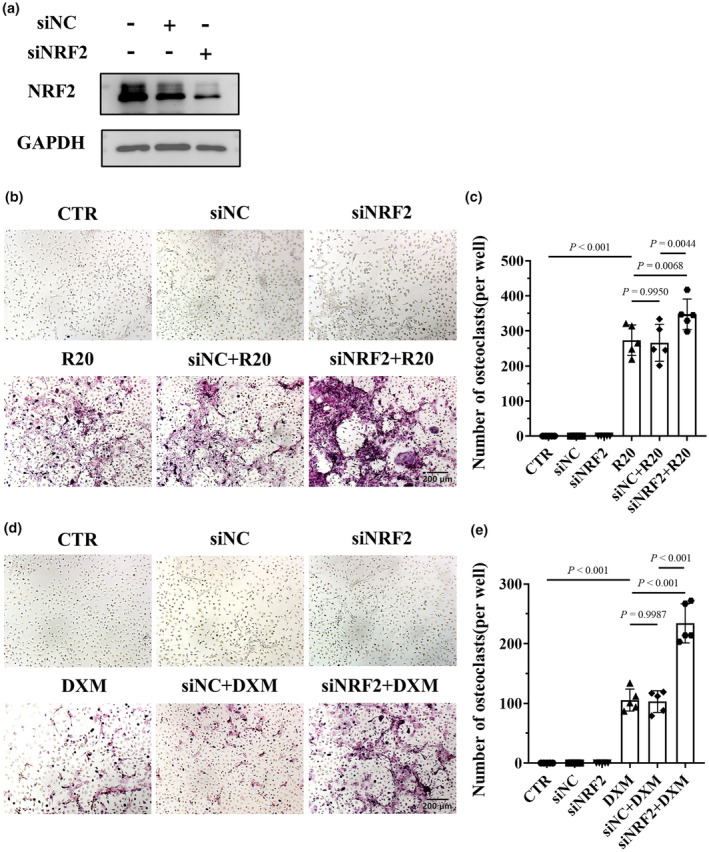
Knocking down nuclear factor erythroid 2‐related factor 2 (NRF2) in BMDMs promoted osteoclastogenesis induced by RANKL and dexamethasone (DXM). (a) Representative images of NRF2 protein levels in BMDMs by regulating the expression of NRF2, as detected via western blotting. These data are based on only one unreplicated experiment. (b) Representative tartrate‐resistant acid phosphatase (TRAP)‐stained images of osteoclasts differentiated from BMDMs treated with RANKL (20 ng mL−1, R20) after NRF2 knockdown. Scale bar, 200 μm. The data shown are representative of one of five experiments. (c) Statistical analysis of osteoclast numbers (per well) in BMDMs treated with RANKL (20 ng mL−1, R20) after NRF2 knockdown (n = 5 per group). (d) Representative TRAP‐stained images of osteoclasts differentiated from BMDMs treated with DXM (10 μM) after NRF2 knockdown. Scale bar, 200 μm. The data shown are representative of one of five experiments. (e) Statistical analysis of osteoclast numbers (per well) in BMDMs treated with DXM (10 μM) after NRF2 was knocked down (n = 5 per group). In c, e, one‐way ANOVA was used for multiple comparisons.
Since the nuclear factor of activated T cells cytoplasmic 1 (NFATC1) is the key regulator of osteoclastogenesis, 35 we evaluated whether HCQ regulates NFATC1 expression in mice treated with HCQ + DXM. The results indicated that NFATC1 expression was greater in the femurs of DXM‐treated mice than in those of normal saline‐treated mice. However, a nonsignificant increase in expression was observed in the mice treated with HCQ + DXM compared with those treated with normal saline (Figure 6d and f). Therefore, it can be asserted that DXM promotes osteoclastogenesis by increasing the level of ROS, which can be inhibited by HCQ.
Discussion
Antimalarial drugs, especially HCQ, are used as the first‐line agents in the treatment of rheumatic diseases, including SLE, with satisfactory therapeutic effects. 12 Although researchers have suggested many mechanisms, the exact mechanism underlying HCQ action still remains unclear. 10 First, we determined the mechanism underlying HCQ action by using a model of skin inflammation induced by SLE IgG, as described in our previous studies. 22 , 32 However, HCQ did not ameliorate dermatitis induced by SLE IgG. SLE IgG‐induced dermatitis is an acute form of inflammation that occurs 3 h after injection, 22 whereas HCQ has a long half‐life and acts slowly. 12 We hypothesised that the effects of HCQ and SLE IgG could not coexist over a long time. Therefore, HCQ was prophylactically injected for 1 week before intradermal SLE IgG injection to induce dermatitis. These results indicate that HCQ alone does not inhibit acute inflammation and should be administered in combination with GCs and other agents to combat SLE flares. Second, we evaluated the effect of combining HCQ and GCs. These results indicate that HCQ does not decrease or even slightly enhance the anti‐inflammatory effect of DXM. This finding elucidated why combined treatment with HCQ and GCs is the most common first‐line therapy for SLE.
Our previous study demonstrated that FcγRI expressed on macrophages is essential for SLE IgG‐induced dermatitis. 24 FcγRs are required for SLE IgG to activate inflammatory signals and induce the secretion of inflammatory cytokines in monocytes/macrophages. 19 , 36 , 37 A recent study reported that IgG‐containing immune complexes mediate macrophage metabolic reprogramming through FcγRs in lupus nephritis. 38 DXM reduced FcγRI expression on macrophages, thereby abrogating SLE IgG‐mediated inflammation. In addition, HCQ may enhance DXM‐induced FcγRI reduction to further inhibit the inflammation induced by SLE IgG. Several studies have reported that ROS are involved in the proinflammatory signals activated by FcγRs in autoimmune diseases. 39 , 40 FcγR signalling promotes IL‐6 secretion, thereby inducing ROS production in BMDMs. 41 In this study, HCQ reduced the ROS level, which could mechanistically explain the slight enhancement of the anti‐inflammatory effect of HCQ in GCs. How HCQ regulates the ROS produced by FcγR signalling requires further investigation.
Owing to their strong anti‐inflammatory effects, GCs are the most common agent used to treat autoimmune diseases, especially in the acute stage. 6 , 42 However, severe side effects limit the application of GCs, 43 , 44 with GIOP being the most severe side effect of GCs. 17 The primary mechanism underlying GIOP involves osteoclast activation, during which GCs raise RANKL levels and extend the lifespan of osteoclasts. 17 The findings from this study showed that GCs activated osteoclasts through an increase in ROS levels, thereby identifying a new potential target for GIOP therapy.
A recent study reported that fragility fractures were not associated with the GC dose in patients with SLE. 18 HCQ is the most common combination agent used with GCs. 6 The finding that HCQ inhibits DXM‐induced osteoclastogenesis and prevents DXM‐induced GIOP in an animal model suggests that fragility fractures are not related to the GC dose. HCQ may exert a potential protective effect on bone loss induced by GCs. Therefore, HCQ can be used as a background treatment for SLE in combination with GCs. HCQ may also be a potential agent for treating GIOP. However, these conclusions are drawn from a single mouse model, so there might be certain limitations, and the results need to be confirmed in other animal models or clinical patients. Further studies are also needed to confirm the association observed in this investigation.
Conclusion
Our study demonstrated that HCQ cannot inhibit the acute inflammation induced by SLE IgG or decrease the anti‐inflammatory effect of GCs in patients with lupus. Furthermore, HCQ inhibited DXM‐induced osteoclastogenesis and osteoporosis. The mechanism underlying the inhibition of DXM‐induced osteoclastogenesis by HCQ involves the regulation of NRF2 expression and ROS production.
Methods
Reagents and animals
The following antibodies were used: PE‐conjugated anti‐CD64 (X54‐5/7.1, Cat. 139303; Biolegend, California, USA), FITC‐conjugated anti‐F4/80 (CI: A3‐1, Cat. E‐AB‐F0995C; Elabscience, Wuhan, China), anti‐phospho‐NF‐κB p65 (Ser536) (Cat. 3033; Cell Signaling Technology, Boston, USA), anti‐NF‐κB p65 (10745‐1‐AP; Proteintech, Wuhan, China), anti‐human IgG (Abcam, Cambridge, UK), anti‐NRF2 (Cat. A21508; ABclonal, Wuhan, China) and anti‐GAPDH (Cat. AC033; ABclonal, Wuhan, China). Recombinant mouse M‐CSF (416‐ML; R&D, California, USA) and mouse RANKL (462‐TEC; R&D, California, USA) proteins were used. MEM α (Gibco, California, USA) supplemented with 10% fetal bovine serum (FBS; Gibco, California, USA) and H2DCFDA dye (Cat. HY‐D0940; MCE, New Jersey, USA) was used.
C57BL/6 mice (male, 8 weeks old) were purchased from SHUBEILI (Wuhan, China). In total, 104 C57BL/6 mice were used in the experiments. The mice were kept under standard pathogen‐free conditions and provided food and water ad libitum with a 12‐h light/dark cycle.
Separation and purification of SLE IgG from patients with lupus
Serum samples were collected from patients who presented to the Department of Rheumatology and Immunology of Wuhan Union Hospital. Patients were classified as having SLE in accordance with the revised 1997 American College of Rheumatology standards. These SLE patients were hospitalised for SLE disease activity (SLEDAI > 4), and these patients had skin or mucosa involvement. The serum was collected before treatment.
First, the serum samples were separated from whole blood through centrifugation. Subsequently, SLE IgG was separated and purified from the serum samples according to the Melon Gel IgG Purification Kit (Cat. 45212; Thermo Fisher, Massachusetts, USA) protocol. The concentration of purified SLE IgG was determined via a Human IgG ELISA Kit (Nanjing Camillo, Nanjing, China).
Skin inflammation model induced via SLE IgG injections
In the experimental group, male C57BL/6 mice (mean weight 25 g, 8 weeks old) were intradermally injected with 100 μg of SLE IgG (each mouse was injected with IG from a different patient source), whereas the control (CTR) group was injected with 100 μL of normal saline. The HCQ + SLE IgG group was intraperitoneally injected with 50 mg kg−1 HCQ for 7 days, followed by intradermal injections of SLE IgG. The DXM + SLE IgG group was intraperitoneally injected with 5 mg kg−1 DXM daily after SLE IgG injection. The HCQ + DXM + SLE IgG group was intraperitoneally injected with DXM after SLE IgG injection according to the protocol used for the HCQ group. All specimens were acquired 3 days after SLE IgG injection.
Haematoxylin and eosin staining, immunohistochemistry and tartrate‐resistant acid phosphatase staining of femur sections
All the skin samples were fixed in 4% paraformaldehyde and embedded in paraffin. All femur samples were decalcified in EDTA decalcifying solution for 20 days before paraffin embedding. The tissue sections were subsequently subjected to haematoxylin and eosin staining and immunohistochemistry (IHC) according to a routine protocol. Skin inflammation was evaluated as described in our previous report. 45 IHC scores were evaluated by two independent researchers at a scale of 0–10 points, and the final score was averaged. The IHC score of negative staining was 0 point, and the strongest staining among all the samples was 10 points.
The femur sections were subjected to TRAP according to the TRAP/ALP staining kit (Cat. 294‐67001: WAKO, Japan) protocol. The sections were stained with TRAP solution for 1 h, after which the nuclei were stained with 1% methyl green solution (Cat. G1670: Solarbio, Beijing, China).
Bone marrow–derived macrophage and splenic macrophage production: differentiation and identification of osteoclasts in vitro
To obtain BMDMs, 6‐week‐old male C57BL/6 mice were sacrificed. The bone marrow was acquired and centrifuged to isolate bone marrow cells, which were cultured in MEM with 10% FBS, 1% penicillin–streptomycin and 25 ng mL−1 M‐CSF for 6 days. The culture medium was replaced every 3 days. To obtain splenic macrophages, the mouse spleen was ground with gauze. The obtained splenic cells were cultured for 3 h to remove the suspended lymphocytes. Splenic macrophages were cultured in MEM α supplemented with 10% FBS, 1% penicillin–streptomycin and 10 ng mL−1 M‐CSF for 6 days, and the culture medium was replaced every 3 days.
To induce BMDM differentiation into osteoclasts via DXM, BMDMs were treated with DXM (10 μM) and/or HCQ (0.5–10 μM) 3 days after isolation. The culture medium and agents were replaced every 3 days. BMDMs were treated with DXM or HCQ for 9 days.
To induce BMDM differentiation into osteoclasts using RANKL, BMDMs were treated with RANKL (100 ng mL−1 R100) 3 days after isolation, followed by continuous culture for 3 days. The other groups were treated with the corresponding agents according to the culture protocol of the RANKL group.
To induce BMDM differentiation into osteoclasts by using a low dose of RANKL and/or DXM, BMDMs were treated with RANKL (20 ng mL−1 as R20) and/or DXM (10 μM), as well as HCQ (10 μM) and NAC (10 μM), 3 days after isolation. The culture medium and drugs were replaced every 3 days. BMDM treatment was performed for 9 days.
To identify osteoclasts, TRAP staining was performed according to the TRAP kit (Cat. 387A; Sigma, Missouri, USA) protocol. The cells were fixed in 4% paraformaldehyde in plates, followed by staining with TRAP solution for 20 min at 37°C.
Western blotting
The cells were treated with the indicated agents 3 days after isolation. Whole‐cell protein lysates were produced via the use of a radioimmunoprecipitation solution with protease and phosphatase inhibitors to lyse cells after cell debris removal. The cell lysates were mixed with sodium dodecyl sulfate (SDS) loading buffer, followed by heating at 100°C for 10 min. After the separation of the cell lysates on SDS–PAGE gels, the proteins were transferred to polyvinylidene fluoride membranes (Millipore, USA). The membranes were blocked with 5% bovine serum albumin for 1 h and incubated with the corresponding primary antibodies overnight. The membranes were subsequently incubated with the corresponding secondary antibodies for 1 h. To detect the proteins, chemiluminescence was performed using a ChemiDoc Touch Imaging System (Bio‐Rad, California, USA).
Flow cytometry and ROS detection
Bone marrow–derived macrophages and splenic macrophages were collected and suspended in PBS at a concentration of 106 cells per 100 μL after treatment with the indicated agents. The samples were subsequently stained with anti‐CD64 and anti‐F4/80 antibodies for 45 min and resuspended in 150 μL of PBS after staining. Flow cytometric analysis of the stained cells was performed via a flow cytometer (Accuri C6 Plus; BD, New Jersey, USA). Gated monocytes/macrophages were identified on the basis of forward/sideward light scatter patterns and F4/80 expression. About 1 × 10⁴ F4/80+ cells were collected to analyse CD64 expression. The flow cytometry gating strategy is shown in Supplementary figure 1a.
To detect the ROS level, BMDMs were treated with the indicated agents 3 days after isolation, followed by staining with H2DCFDA dye for 20 min. The stained cells were collected and resuspended in 150 μL of PBS. Flow cytometric analysis was performed on the stained cells via a flow cytometer. On the basis of forward/sideward light scatter patterns, 104 cells were collected; the ROS level was analysed via the FITC channel. The flow cytometry gating strategy is shown in Supplementary figure 1b.
All flow cytometry data were analysed via FlowJo 10 (BD, New Jersey, USA).
HCQ‐treated GIOP models, micro‐CT scanning, 3D reconstruction and analysis
In this study, 8‐week‐old male C57BL/6 mice were divided into the CTR, HCQ, DXM and DXM + HCQ groups. The mice were intraperitoneally injected with 200 μL of normal saline or the indicated agents daily. The CTR group was injected with normal saline, the HCQ group with 50 mg kg−1 per day HCQ, the DXM group with 5 mg kg−1 per day DXM and the DXM + HCQ group with HCQ and DXM. The treatments were performed for 28 days, and the femurs were collected.
To demonstrate osteoporosis, the femurs were scanned using micro‐CT (SkyScan 1176; Bruker, Massachusetts, USA) with an Al 0.5 filter. Original scan data were used to reconstruct 3D models using NRecon (Bruker), and the 3D reconstruction results were analysed via CTAn (Bruker).
Ethics
Serum collection from patients with SLE was approved by the Institutional Review Board of Wuhan Union Hospital (number: 0267‐01). The animal experiments were approved by the Institutional Animal Care and Use Committee of Huazhong University of Science and Technology (IACUC number: 2484).
Statistics
All the data, including those from at least three independent experiments, are presented as the means ± standard errors of the means. The data were analysed via the Student's t‐test for two‐group comparisons and one‐way analysis of variance (ANOVA) for multigroup comparisons (≥ 3 groups) using GraphPad Prism 8.
Author contributions
G‐MD and WQ: design of research plan and experiments; analysis of results; writing of the manuscript. WQ, XH and TY: conduction of major experiments; analysis of results. LJ, XW, RF, XD, YT, MIB and HY: contribution of the data to the manuscript. All the authors contributed to the article and approved the submitted version.
Conflict of interest
The authors declare that the research was conducted in the absence of any commercial or financial relationships that could be construed as potential conflicts of interest.
Supporting information
Supplementary figure 1
Acknowledgments
This study was supported by the National Natural Science Foundation of China (NSFC) (GM Deng, 82171786 and Xiaoru Duan, 82103731). The funders provided financial support for this study, but the funders did not participate in the study design, experiments, data collection or analysis. We thank the Medical Subcenter of HUST Analytical & Testing Center for data acquisition for micro‐CT scanning and the Laboratory Animal Center of HUST for the animal experiments.
Data availability statement
The data that support the results of this study are available from the corresponding author (Guo‐Min Deng) upon reasonable request.
References
- 1. Barber MRW, Drenkard C, Falasinnu T et al. Global epidemiology of systemic lupus erythematosus. Nat Rev Rheumatol 2021; 17: 515–532. [DOI] [PMC free article] [PubMed] [Google Scholar]
- 2. Tsokos GC. Systemic lupus erythematosus. N Engl J Med 2011; 365: 2110–2121. [DOI] [PubMed] [Google Scholar]
- 3. Rahman A, Isenberg DA. Systemic lupus erythematosus. N Engl J Med 2008; 358: 929–939. [DOI] [PubMed] [Google Scholar]
- 4. Durcan L, O'Dwyer T, Petri M. Management strategies and future directions for systemic lupus erythematosus in adults. Lancet 2019; 393: 2332–2343. [DOI] [PubMed] [Google Scholar]
- 5. Vera‐Recabarren MA, Garcia‐Carrasco M, Ramos‐Casals M, Herrero C. Comparative analysis of subacute cutaneous lupus erythematosus and chronic cutaneous lupus erythematosus: Clinical and immunological study of 270 patients. Br J Dermatol 2010; 162: 91–101. [DOI] [PubMed] [Google Scholar]
- 6. Fanouriakis A, Kostopoulou M, Alunno A et al. 2019 update of the EULAR recommendations for the management of systemic lupus erythematosus. Ann Rheum Dis 2019; 78: 736–745. [DOI] [PubMed] [Google Scholar]
- 7. Ruiz‐Irastorza G, Bertsias G. Treating systemic lupus erythematosus in the 21st century: New drugs and new perspectives on old drugs. Rheumatology (Oxford) 2020; 59: v69–v81. [DOI] [PMC free article] [PubMed] [Google Scholar]
- 8. Ruiz‐Irastorza G, Egurbide MV, Pijoan JI et al. Effect of antimalarials on thrombosis and survival in patients with systemic lupus erythematosus. Lupus 2006; 15: 577–583. [DOI] [PubMed] [Google Scholar]
- 9. Alarcon GS, McGwin G, Bertoli AM et al. Effect of hydroxychloroquine on the survival of patients with systemic lupus erythematosus: Data from LUMINA, a multiethnic US cohort (LUMINA L). Ann Rheum Dis 2007; 66: 1168–1172. [DOI] [PMC free article] [PubMed] [Google Scholar]
- 10. Dima A, Jurcut C, Chasset F, Felten R, Arnaud L. Hydroxychloroquine in systemic lupus erythematosus: Overview of current knowledge. Ther Adv Musculoskelet Dis 2022; 14: 1759720X211073001. [DOI] [PMC free article] [PubMed] [Google Scholar]
- 11. Kuznik A, Bencina M, Svajger U, Jeras M, Rozman B, Jerala R. Mechanism of endosomal TLR inhibition by antimalarial drugs and imidazoquinolines. J Immunol 2011; 186: 4794–4804. [DOI] [PubMed] [Google Scholar]
- 12. Schrezenmeier E, Dörner T. Mechanisms of action of hydroxychloroquine and chloroquine: Implications for rheumatology. Nat Rev Rheumatol 2020; 16: 155–166. [DOI] [PubMed] [Google Scholar]
- 13. An J, Woodward JJ, Lai W et al. Inhibition of cyclic GMP‐AMP synthase using a novel antimalarial drug derivative in Trex1‐deficient mice. Arthritis Rheumatol 2018; 70: 1807–1819. [DOI] [PubMed] [Google Scholar]
- 14. van den Borne BE, Dijkmans BA, de Rooij HH, le Cessie S, Verweij CL. Chloroquine and hydroxychloroquine equally affect tumor necrosis factor‐alpha, interleukin 6, and interferon‐gamma production by peripheral blood mononuclear cells. J Rheumatol 1997; 24: 55–60. [PubMed] [Google Scholar]
- 15. Sperber K, Quraishi H, Kalb TH, Panja A, Stecher V, Mayer L. Selective regulation of cytokine secretion by hydroxychloroquine: Inhibition of interleukin 1 alpha (IL‐1‐alpha) and IL‐6 in human monocytes and T cells. J Rheumatol 1993; 20: 803–808. [PubMed] [Google Scholar]
- 16. Ugarte A, Danza A, Ruiz‐Irastorza G. Glucocorticoids and antimalarials in systemic lupus erythematosus: An update and future directions. Curr Opin Rheumatol 2018; 30: 482–489. [DOI] [PubMed] [Google Scholar]
- 17. Buckley L, Humphrey MB. Glucocorticoid‐induced osteoporosis. N Engl J Med 2018; 379: 2547–2556. [DOI] [PubMed] [Google Scholar]
- 18. Garelick D, Pinto SM, Farinha F, Pires T, Khan E, Isenberg D. Fracture risk in systemic lupus erythematosus patients over 28 years. Rheumatology (Oxford) 2021; 60: 2765–2772. [DOI] [PubMed] [Google Scholar]
- 19. Bruhns P, Jonsson F. Mouse and human FcR effector functions. Immunol Rev 2015; 268: 25–51. [DOI] [PubMed] [Google Scholar]
- 20. Fang X, Zaman MH, Guo X et al. Role of hepatic deposited immunoglobulin G in the pathogenesis of liver damage in systemic lupus erythematosus. Front Immunol 2018; 9: 1457. [DOI] [PMC free article] [PubMed] [Google Scholar]
- 21. Zhang Q, Xiang L, Zaman MH, Dong W, He G, Deng GM. Predominant role of immunoglobulin G in the pathogenesis of splenomegaly in murine lupus. Front Immunol 2019; 10: 3020. [DOI] [PMC free article] [PubMed] [Google Scholar]
- 22. Liu L, Xu G, Dou H, Deng GM. The features of skin inflammation induced by lupus serum. Clin Immunol 2016; 165: 4–11. [DOI] [PubMed] [Google Scholar]
- 23. Qiao W, Ding H, Zuo Y et al. Lupus IgG deposition causes arthritis but inhibits bone destruction through competitive occupation of FcγRI and reduced RANKL signalling. Clin Transl Immunology 2020; 9: e1174. [DOI] [PMC free article] [PubMed] [Google Scholar]
- 24. Jiang L, Han X, Qiu W et al. Amelioration of lupus serum‐induced skin inflammation in CD64‐deficient mice. Front Immunol 2022; 13: 824008. [DOI] [PMC free article] [PubMed] [Google Scholar]
- 25. Koga T, Inui M, Inoue K et al. Costimulatory signals mediated by the ITAM motif cooperate with RANKL for bone homeostasis. Nature 2004; 428: 758–763. [DOI] [PubMed] [Google Scholar]
- 26. Zorov DB, Juhaszova M, Sollott SJ. Mitochondrial reactive oxygen species (ROS) and ROS‐induced ROS release. Physiol Rev 2014; 94: 909–950. [DOI] [PMC free article] [PubMed] [Google Scholar]
- 27. Garrett IR, Boyce BF, Oreffo RO, Bonewald L, Poser J, Mundy GR. Oxygen‐derived free radicals stimulate osteoclastic bone resorption in rodent bone in vitro and in vivo. J Clin Invest 1990; 85: 632–639. [DOI] [PMC free article] [PubMed] [Google Scholar]
- 28. Ohyama Y, Ito J, Kitano VJ, Shimada J, Hakeda Y. The polymethoxy flavonoid sudachitin suppresses inflammatory bone destruction by directly inhibiting osteoclastogenesis due to reduced ROS production and MAPK activation in osteoclast precursors. PLoS One 2018; 13: e0191192. [DOI] [PMC free article] [PubMed] [Google Scholar]
- 29. Agidigbi TS, Kim C. Reactive oxygen species in osteoclast differentiation and possible pharmaceutical targets of ROS‐mediated osteoclast diseases. Int J Mol Sci 2019; 20: 3576. [DOI] [PMC free article] [PubMed] [Google Scholar]
- 30. Kiriakidou M, Ching CL. Systemic lupus erythematosus. Ann Intern Med 2020; 172: ITC81–ITC96. [DOI] [PubMed] [Google Scholar]
- 31. Qiu W, Yu T, Deng GM. The role of organ‐deposited IgG in the pathogenesis of multi‐organ and tissue damage in systemic lupus erythematosus. Front Immunol 2022; 13: 924766. [DOI] [PMC free article] [PubMed] [Google Scholar]
- 32. Deng GM, Liu L, Kyttaris VC, Tsokos GC. Lupus serum IgG induces skin inflammation through the TNFR1 signaling pathway. J Immunol 2010; 184: 7154–7161. [DOI] [PMC free article] [PubMed] [Google Scholar]
- 33. Qu Z, Zhang B, Kong L et al. Receptor activator of nuclear factor‐κB ligand‐mediated osteoclastogenesis signaling pathway and related therapeutic natural compounds. Front Pharmacol 2022; 13: 1043975. [DOI] [PMC free article] [PubMed] [Google Scholar]
- 34. Sun YX, Xu AH, Yang Y, Li J. Role of Nrf2 in bone metabolism. J Biomed Sci 2015; 22: 101. [DOI] [PMC free article] [PubMed] [Google Scholar]
- 35. Ono T, Nakashima T. Recent advances in osteoclast biology. Histochem Cell Biol 2018; 149: 325–341. [DOI] [PubMed] [Google Scholar]
- 36. Nimmerjahn F, Ravetch JV. Fcγ receptors as regulators of immune responses. Nat Rev Immunol 2008; 8: 34–47. [DOI] [PubMed] [Google Scholar]
- 37. Bournazos S, Gupta A, Ravetch JV. The role of IgG fc receptors in antibody‐dependent enhancement. Nat Rev Immunol 2020; 20: 633–643. [DOI] [PMC free article] [PubMed] [Google Scholar]
- 38. Jing C, Castro‐Dopico T, Richoz N et al. Macrophage metabolic reprogramming presents a therapeutic target in lupus nephritis. Proc Natl Acad Sci USA 2020; 117: 15160–15171. [DOI] [PMC free article] [PubMed] [Google Scholar]
- 39. Lu CH, Li KJ, Wu CH et al. The FcγRIII engagement augments PMA‐stimulated neutrophil extracellular traps (NETs) formation by granulocytes partially via cross‐talk between Syk‐ERK‐NF‐κB and PKC‐ROS signaling pathways. Biomedicine 2021; 9: 1127. [DOI] [PMC free article] [PubMed] [Google Scholar]
- 40. Gilljam KM, Holm KL, Zahoor M, Centonze FG, Farhan H, Blomhoff HK. Differential effects of reactive oxygen species on IgG versus IgM levels in TLR‐stimulated B cells. J Immunol 2020; 204: 2133–2142. [DOI] [PubMed] [Google Scholar]
- 41. Franchini AM, Hunt D, Melendez JA, Drake JR. FcγR‐driven release of IL‐6 by macrophages requires NOX2‐dependent production of reactive oxygen species. J Biol Chem 2013; 288: 25098–25108. [DOI] [PMC free article] [PubMed] [Google Scholar]
- 42. Straub RH, Cutolo M. Glucocorticoids and chronic inflammation. Rheumatology (Oxford) 2016; 55: ii6–ii14. [DOI] [PubMed] [Google Scholar]
- 43. Huscher D, Thiele K, Gromnica‐Ihle E et al. Dose‐related patterns of glucocorticoid‐induced side effects. Ann Rheum Dis 2009; 68: 1119–1124. [DOI] [PubMed] [Google Scholar]
- 44. Oray M, Abu Samra K, Ebrahimiadib N, Meese H, Foster CS. Long‐term side effects of glucocorticoids. Expert Opin Drug Saf 2016; 15: 457–465. [DOI] [PubMed] [Google Scholar]
- 45. Deng GM, Liu L, Tsokos GC. Targeted tumor necrosis factor receptor I preligand assembly domain improves skin lesions in MRL/lpr mice. Arthritis Rheum 2010; 62: 2424–2431. [DOI] [PMC free article] [PubMed] [Google Scholar]
Associated Data
This section collects any data citations, data availability statements, or supplementary materials included in this article.
Supplementary Materials
Supplementary figure 1
Data Availability Statement
The data that support the results of this study are available from the corresponding author (Guo‐Min Deng) upon reasonable request.