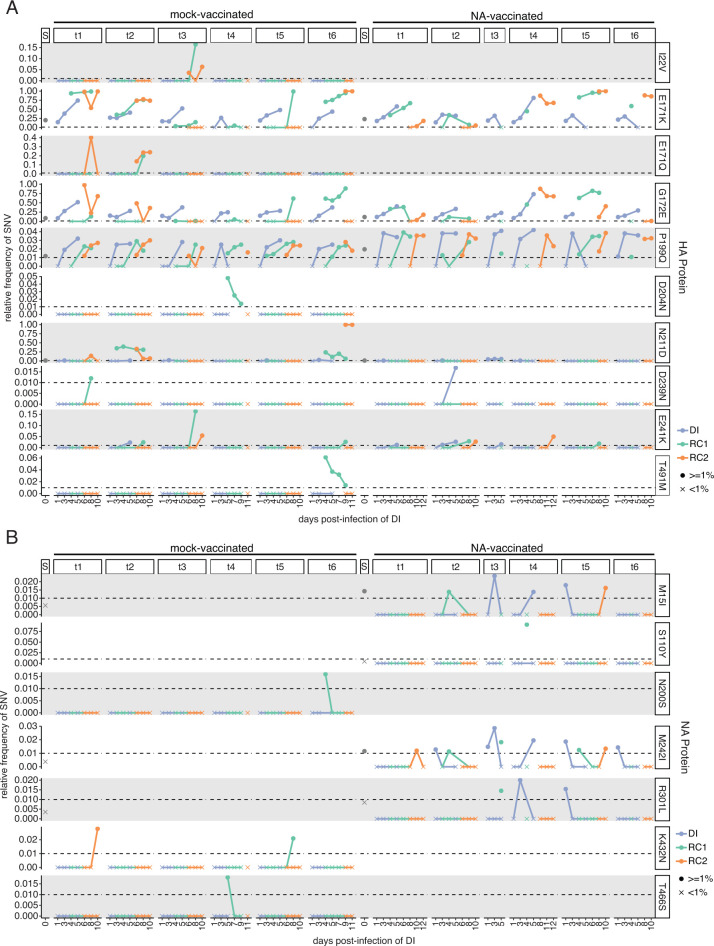
Fig 6.
Non-synonymous mutations in the HA and NA proteins identified in two or more ferrets during sequential transmission. The displayed mutations were selected based on the criteria of being non-synonymous and occurring at frequencies of 1% (0.01) or higher in at least two samples, one of which had to be an RC1 sample collection. The relative frequency (y-axis) of (A) HA SNVs and (B) NA SNVs across the days of the experiment (x-axis). For both plots, data are grouped by the six mock-vaccinated and six NA-vaccinated transmission chains (t1–t6, across) and variants (down). The S column heading denotes the frequency of a variant in the viral stock used for infection. The point shape depicts if the variant is ≥1% (0.01, circle) or <1% (0.01, “X”) in the sample. The color of each point and line indicates the ferret in each transmission pair. DI = directly infected, RC1 = respiratory contact 1, and RC2 = respiratory contact 2. If the mutation is not observed in any of the six transmission chains for a given vaccination group, the plots will be empty. HA mutations are based on numbering from the H1 start codon.

