

Abstract
Localized sources of morphogens, called signalling centres, play a fundamental role in coordinating tissue growth and cell fate specification during organogenesis. However, how these signalling centres are established in tissues during embryonic development is still unclear. Here we show that the main signalling centre orchestrating development of rodent incisors, the enamel knot (EK), is specified by a cell proliferation-driven buildup in compressive stresses (mechanical pressure) in the tissue. Direct mechanical measurements indicate that the stresses generated by cell proliferation are resisted by the surrounding tissue, creating a circular pattern of mechanical anisotropy with a region of high compressive stress at its centre that becomes the EK. Pharmacological inhibition of proliferation reduces stresses and suppresses EK formation, and application of external pressure in proliferation-inhibited conditions rescues the formation of the EK. Mechanical information is relayed intracellularly through YAP protein localization, which is cytoplasmic in the region of compressive stress that establishes the EK and nuclear in the stretched anisotropic cells that resist the pressure buildup around the EK. Together, our data identify a new role for proliferation-driven mechanical compression in the specification of a model signalling centre during mammalian organ development.
The formation of organs during embryonic development requires a tight spatiotemporal coordination of cell behaviours throughout the tissue1,2. Morphogen gradients are known to provide key position-dependent instructive cues that guide cells during embryonic development and determine tissue patterning2,3. Establishment of these gradients occurs when cells in specific regions, known as signalling centres, secrete molecular signals that spread through the tissue. Examples of signalling centres abound throughout development, including the Spemann–Mangold organizer in amphibians4,5, Hensen’s node in chicks6, the zone of polarizing activity during vertebrate limb formation7, the isthmus organizer during brain development8 and the initiation knot (IK) and enamel knot (EK) during mammalian tooth formation9-12. The spatial location of such signalling centres is key to organogenesis, as the secreted molecules form specific gradients that provide essential information for correct patterning and growth of cells during organ formation. Previous studies have identified biochemical mechanisms involved in establishing signalling centres5,13,14 and in some cases, such as the Spemann–Mangold organizer, suggested a mechanical contribution5,15. However, the mechanisms specifying the location of signalling centres during organ formation and a potential role for endogenous tissue mechanics in this process remain unclear.
Development of the murine incisor, a model ectodermal organ, initiates with the formation of a three-dimensional (3D) epithelial bud that progressively grows into the adjacent mesenchyme (Fig. 1a,b), a process orchestrated by two signalling centres that arise de novo in a sequential manner9,16. The IK (embryonic day (E)11.5–12.5; Fig. 1a) regulates the initial epithelial budding11, and the EK (E13.5–14.5; Fig. 1a) controls further incisor growth from the late bud stage onwards10. The EK consists of a group of non-proliferating cells in the epithelium that express the cell-cycle inhibitor P2110 (Fig. 1c), as well as key signalling genes such as Shh (Fig. 1d), Fgfs, Wnts and Bmps17-19. These factors coordinate cell behaviours and morphogenetic events in the tissue, guiding the transition of the tooth from the late bud into the cap stage at E14.5. While expression of Bmp4, Pax9, Eda, Sostdc1 and β-catenin in the adjacent non-EK dental epithelium or mesenchyme have been implicated in the development of the EK10,20-24, perturbation or inhibition of any one of these pathways does not cause loss of EK formation. In contrast, deletion of the adherens junction component αE-catenin (encoded by Ctnna1) in the dental epithelium upregulates the activity of the mechanotransducer YAP/TAZ and completely abolishes EK formation25, suggesting that endogenous tissue mechanics may be an important factor in the establishment of the EK. However, the mechanisms that enable only a few cells at a specific location of the incisor epithelium to stop proliferating and become a signalling centre remain unknown. Here we address this question by performing mechanical, structural and molecular measurements, as well as mechanical and molecular perturbations, in the developing incisor bud to reveal the mechanism of EK formation.
Fig. 1 ∣. Emergence of a circular pattern of structural anisotropy in the embryonic mouse incisor.
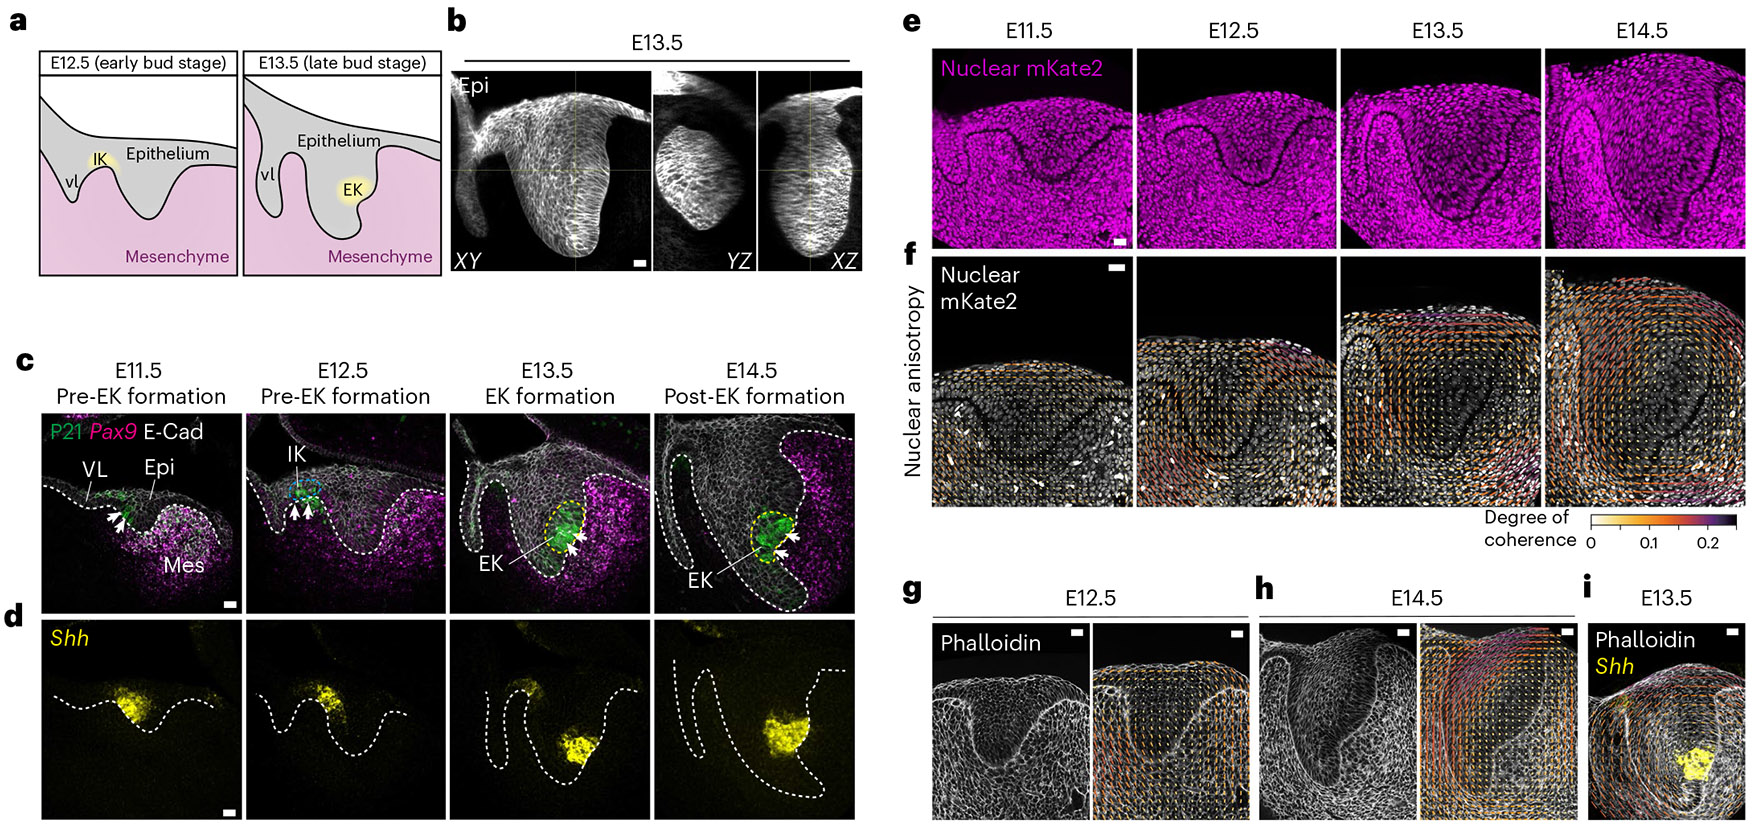
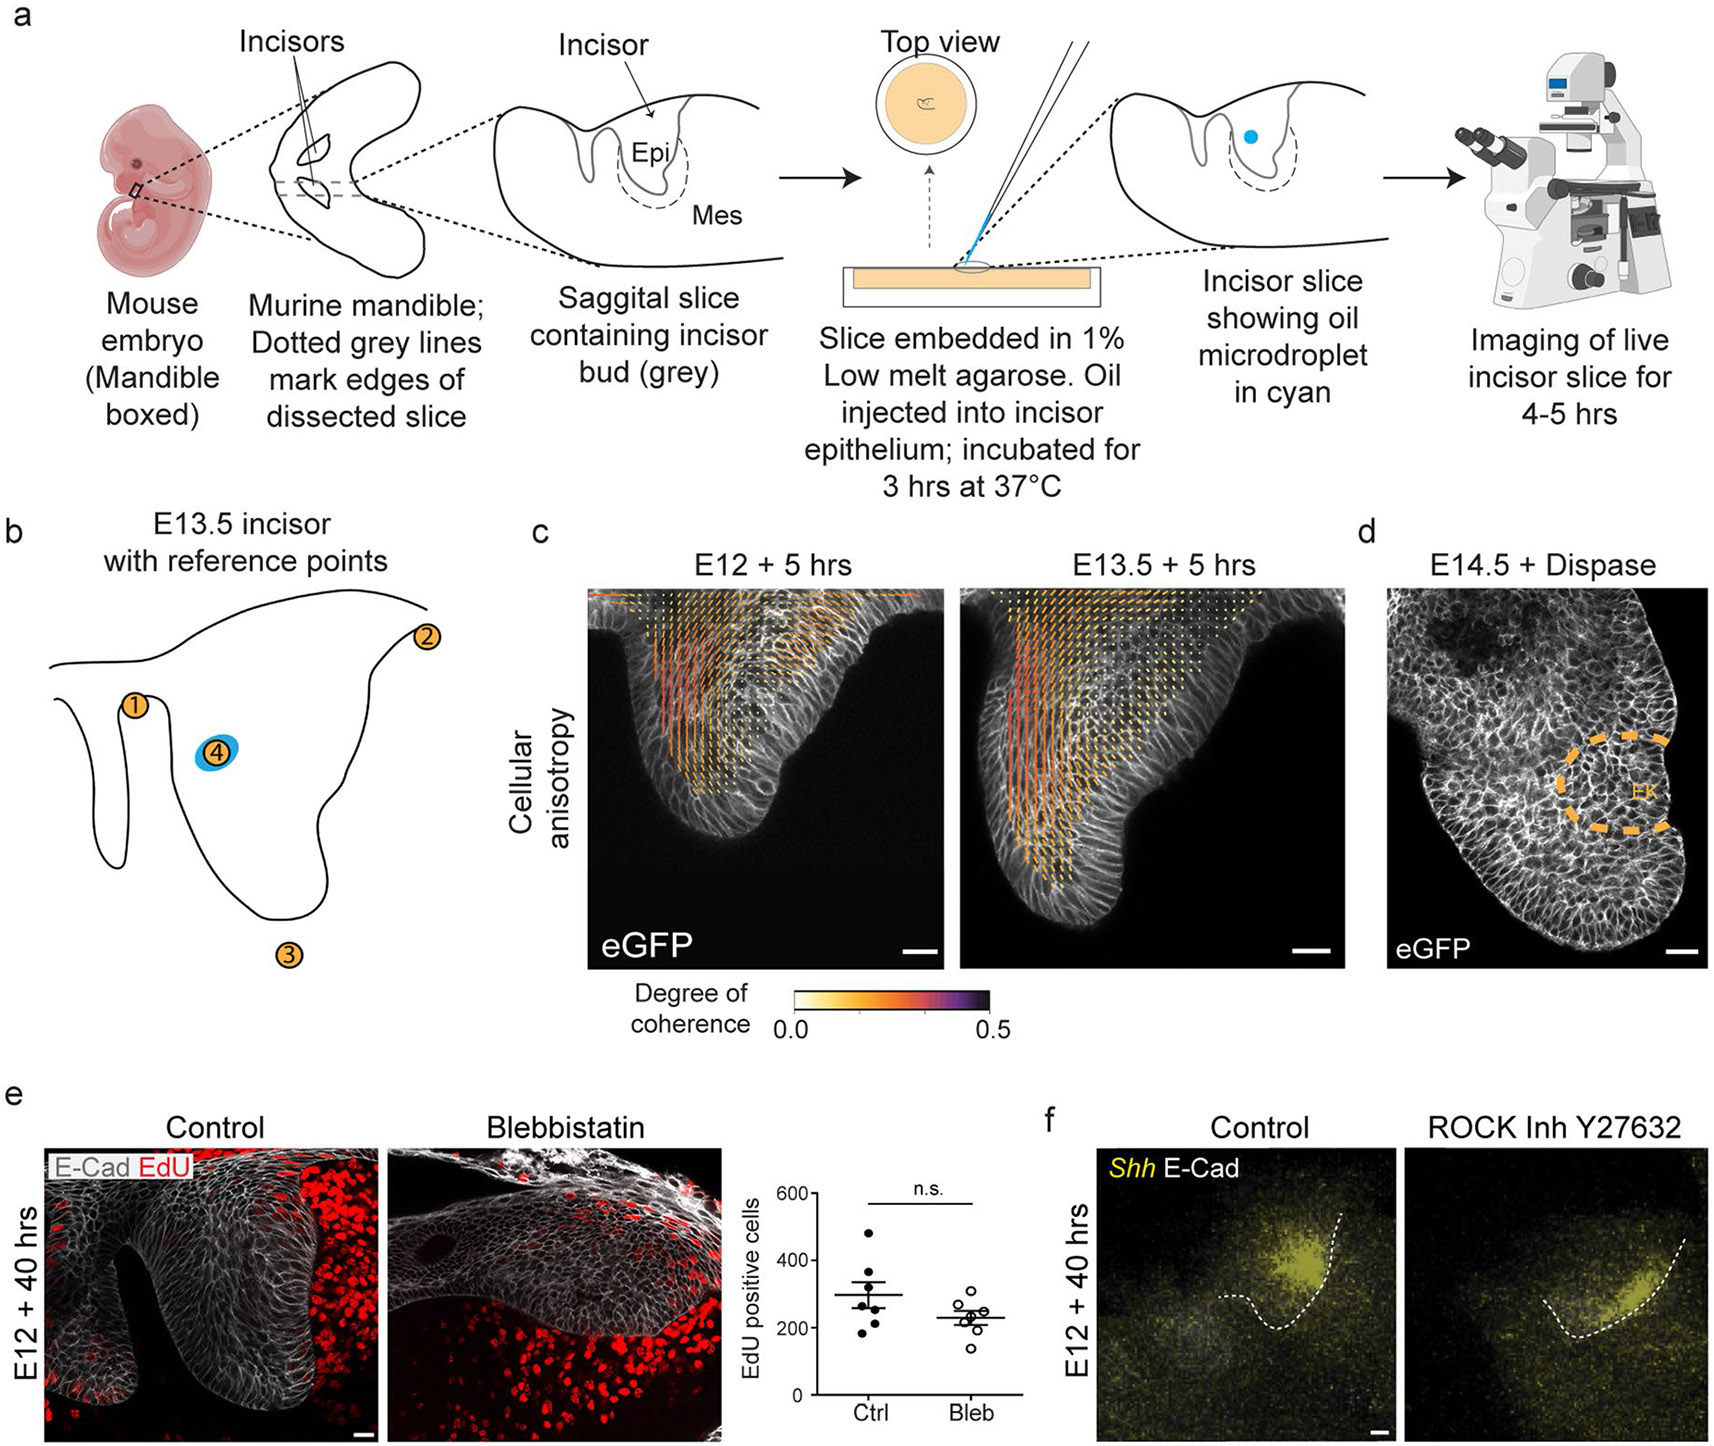
a, Schematic illustrating the early developmental stages of the mouse incisor. vl, vestibular lamina; IK, initiation knot; EK, enamel knot. b, Whole mount E13.5 K14Cre;R26mTmG/mTmG incisor showing the 3D bud in XY, YZ and XZ. c, P21 and E-Cad immunostaining and Pax9 RNAscope in E11.5–14.5 paraffin sections depicting the early development of the mouse incisor and formation of the EK (outlined by a yellow dashed line). The arrows indicate P21 staining (n = 3). epi, epithelium; mes, mesenchyme. d, Shh RNAscope in E11.5–14.5 paraffin sections during early development of the mouse incisor. The white dashed line outlines the incisor in c and d (n = 3). e, Representative fixed agarose sections of the mouse incisor from E11.5–E14.5 R26-pCAG-nuc-3x mKate2 embryos showing nuclei in the dental epithelium and mesenchyme (n = 4). f, Nuclear anisotropy (orientation) analysis of R26-pCAG-nuc-3x mKate2 mouse incisors from E11.5 to E14.5, showing the emergence of a circular anisotropy pattern in the tissue. g,h, Representative phalloidin staining and actin spatial distribution anisotropy of fixed agarose slices of E12.5 (g) and E14.5 (h) mouse incisor (n = 3). i, Overlay of E13.5 phalloidin (actin) anisotropy analysis and E13.5 Shh RNAscope image from d. Scale bar, 25 μm. The bar colour and length for f–i represent the coherence/degree of anisotropy. A representative 2D central plane is shown in c–i. Each n represents the number of embryos, with one incisor measured per embryo.
Results
Emergence of mechanical anisotropy during incisor growth
To determine a potential role for mechanics in the developing incisor, we first characterized its structural tissue anisotropy (Fig. 1e). Nuclear anisotropy was largely random in the dental tissue at E11.5. In contrast, nuclei started locally orienting and a tissue-scale circular pattern of nuclear anisotropy began to emerge at E12.5 (observed in two-dimensional (2D) confocal sections and confirmed in a 2.5D and 3D analysis; Extended Data Fig. 1a,b and Methods). This pattern intensified at E13.5, which is when the EK starts to form (Fig. 1f and Extended Data Fig. 1c). The nuclei at the centre of the circular anisotropy pattern remained randomly oriented, and this region coincided with the location of the EK itself (E13.5, Fig. 1d,f). This anisotropy pattern, which continued through E14.5, was also observed in the supracellular organization of F-actin (Fig. 1g,h, Extended Data Fig. 1d and Methods), again with the EK forming at the centre of the circular anisotropy pattern (Fig. 1i and Extended Data Fig. 1e). Analysis of epithelial cellular anisotropy using cell segmentation also showed that cell shape anisotropy follows the same circular anisotropy pattern at supracellular scales (Extended Data Fig. 2a,b and Methods). The anisotropy pattern observed in 2D confocal sections occurred in all sections passing through the EK, indicating that the 2D circular pattern results from a 3D concentric spherical pattern of mechanical anisotropy in the tissue. These findings demonstrate a correlation between the pattern of structural anisotropy in the developing tooth and the location of the emerging EK.
To understand what causes the circular anisotropy pattern in the tissue, we measured the local anisotropic mechanical stresses in situ, within the developing incisor bud, using oil microdroplets26 (Fig. 2a, Extended Data Fig. 3a,b and Methods). The shape of single droplets injected into the tissue enabled us to quantify both the local mechanical stresses at supracellular scales (ellipsoidal mode; Fig. 2a,a’) and the droplet ellipsoidal elongation axis (Fig. 2b) at different stages, as previously established27-29 (Methods). It has been shown that droplets elongate perpendicularly to the local tissue anisotropy (defined by cell/nuclear elongation) when contractile tensile stresses, such as actomyosin force generation, are dominant within the tissue29,30 (Fig. 2c). In contrast, if the tissue/cells and droplets both mechanically resist an applied force, then droplet elongation should preferentially occur in the same direction as local tissue anisotropy (Fig. 2c′). To determine whether the observed circular anisotropy was due to active contractile stresses along circular paths or associated with other forces, we characterized the angular difference (ψ) between the local orientation angle (ϕ) of structural tissue anisotropy and the angle (θ) of droplet elongation, namely ψ = ϕ–θ (Fig. 2b and Methods), throughout the dental epithelium before (E12) and after (E13.5) the formation of the EK. We found that droplets located in regions of the tissue with low coherence (LC) in structural anisotropy (Fig. 2d,e, Extended Data Fig. 3c and Methods) displayed no well-defined orientation, indicating either a lack of stress anisotropy in this region or that our structural anisotropy measurements are too low and noisy. In contrast, droplets located in regions of high coherence (HC) within the circular anisotropy pattern (Fig. 2d,e and Extended Data Fig. 3c) oriented in the same direction as the local tissue structural anisotropy (Fig. 2f,g). Furthermore, the magnitude of supracellular anisotropic stresses in the region of high tissue anisotropy (HC) increased from E12.5 to E13.5, mirroring the increase in structural tissue anisotropy (Fig. 1f), while it did not change during the same period in low anisotropy regions (LC; Fig. 2h). These results indicate that it is unlikely that the circular pattern of mechanical anisotropy is caused by actomyosin contraction along circular paths but rather arises from tissue resistance to some other stresses in the system, with the magnitude of resistive stress anisotropy increasing with structural anisotropy in the tissue from E12 to E13.5.
Fig. 2 ∣. Circular anisotropy pattern arises from mechanical resistance in the tissue.

a, Representative image of an oil microdroplet in a live E12 K14Cre;R26mTmG/mTmG incisor at 5 h after injection. The insets show a zoom-in of droplet (top) and ellipsoid fitting (bottom). a′, 3D reconstruction of the droplet in a showing the measured tissue-scale stress anisotropy (ellipsoidal mode). b, Sketch showing ϕ (the angle between the cell longitudinal axis and the horizontal axis), θ (the angle between the droplet longitudinal axis and the horizontal axis) and ψ (the difference between ϕ and θ). c,c′, Sketch showing how the relative angle between droplet and local cell orientation is an indicator of the origin of the stresses – actomyosin driven (c) or passive resistance to external forces (c′). d,e, Representative image and analysis of epithelial cell anisotropy (average) in live E12 (d) and E13.5 (e) incisors, 5 h after droplet injection (n = 6). f,g, Difference between droplet and local cell orientation in different regions of live E12 (f) and E13.5 (g) incisors. Compilation of average data from 3 to 6 h after injection. Each ellipse represents one droplet/incisor. n = 15 in LC and n = 14 in HC for f. n = 18 in LC and n = 17 in HC for g. h, Quantification of tissue stress anisotropy in the E12 and E13.5 incisors in the LC and HC regions of tissue anisotropy defined in d and e. n = 15 in LC and n = 16 in HC for E12. n = 18 in LC and n = 18 in HC for E13.5. i, Representative E13.5 incisor epithelium separated from the mesenchyme after 45 min dispase treatment (n = 5). j, Shh whole mount in situ and E-Cad immunostaining in E12 incisors cultured with DMSO or blebbistatin for 40 h (n = 5). The dashed white line outlines the incisor. epi, epithelium; mes, mesenchyme. Scale bars, 25 μm. A representative 2D central plane is shown in a, d, e, i and j. The data are presented as mean ± s.e.m. The statistical analysis was done using the unpaired two-tailed Student’s t test (assuming unequal variance) with Welch’s correction for f and g and two-way ANOVA for h. Source data are available for all plots. Each n represents the number of embryos, with one incisor measured per embryo.
Since mechanical tissue resistance cannot be achieved in the absence of a cohesive tissue that enables the transmission of forces, we physically separated the mesenchymal tissue from the epithelium (Methods), effectively cutting through the circular anisotropy pattern. Removal of the mesenchyme resulted in the complete loss of the epithelial cell anisotropy observed in the intact tissue (Fig. 2i and Extended Data Fig. 3d), indicating that mechanical resistance of the tissue is the likely cause of the circular anisotropy pattern. Finally, we inhibited non-muscle myosin II function using blebbistatin to further test a potential role of actomyosin force generation in the establishment of the EK (Methods). We found that, while inhibition of myosin activity in the whole tissue affected tooth bud shape, it did not affect cell proliferation (Extended Data Fig. 3e). Importantly, formation of the EK was unaffected, as shown by expression of Shh (Methods), indicating that actomyosin-driven stresses are not required for EK formation (Fig. 2j). The same results were observed upon inhibiting the myosin II light-chain activator, ROCK, using Y27632 (Extended Data Fig. 3f). These data indicate that the observed circular pattern of mechanical anisotropy is not caused by actomyosin-driven contraction along circular paths but rather arises from mechanical resistance of the tissue to some forces within it.
Proliferation-driven pressure causes mechanical anisotropy
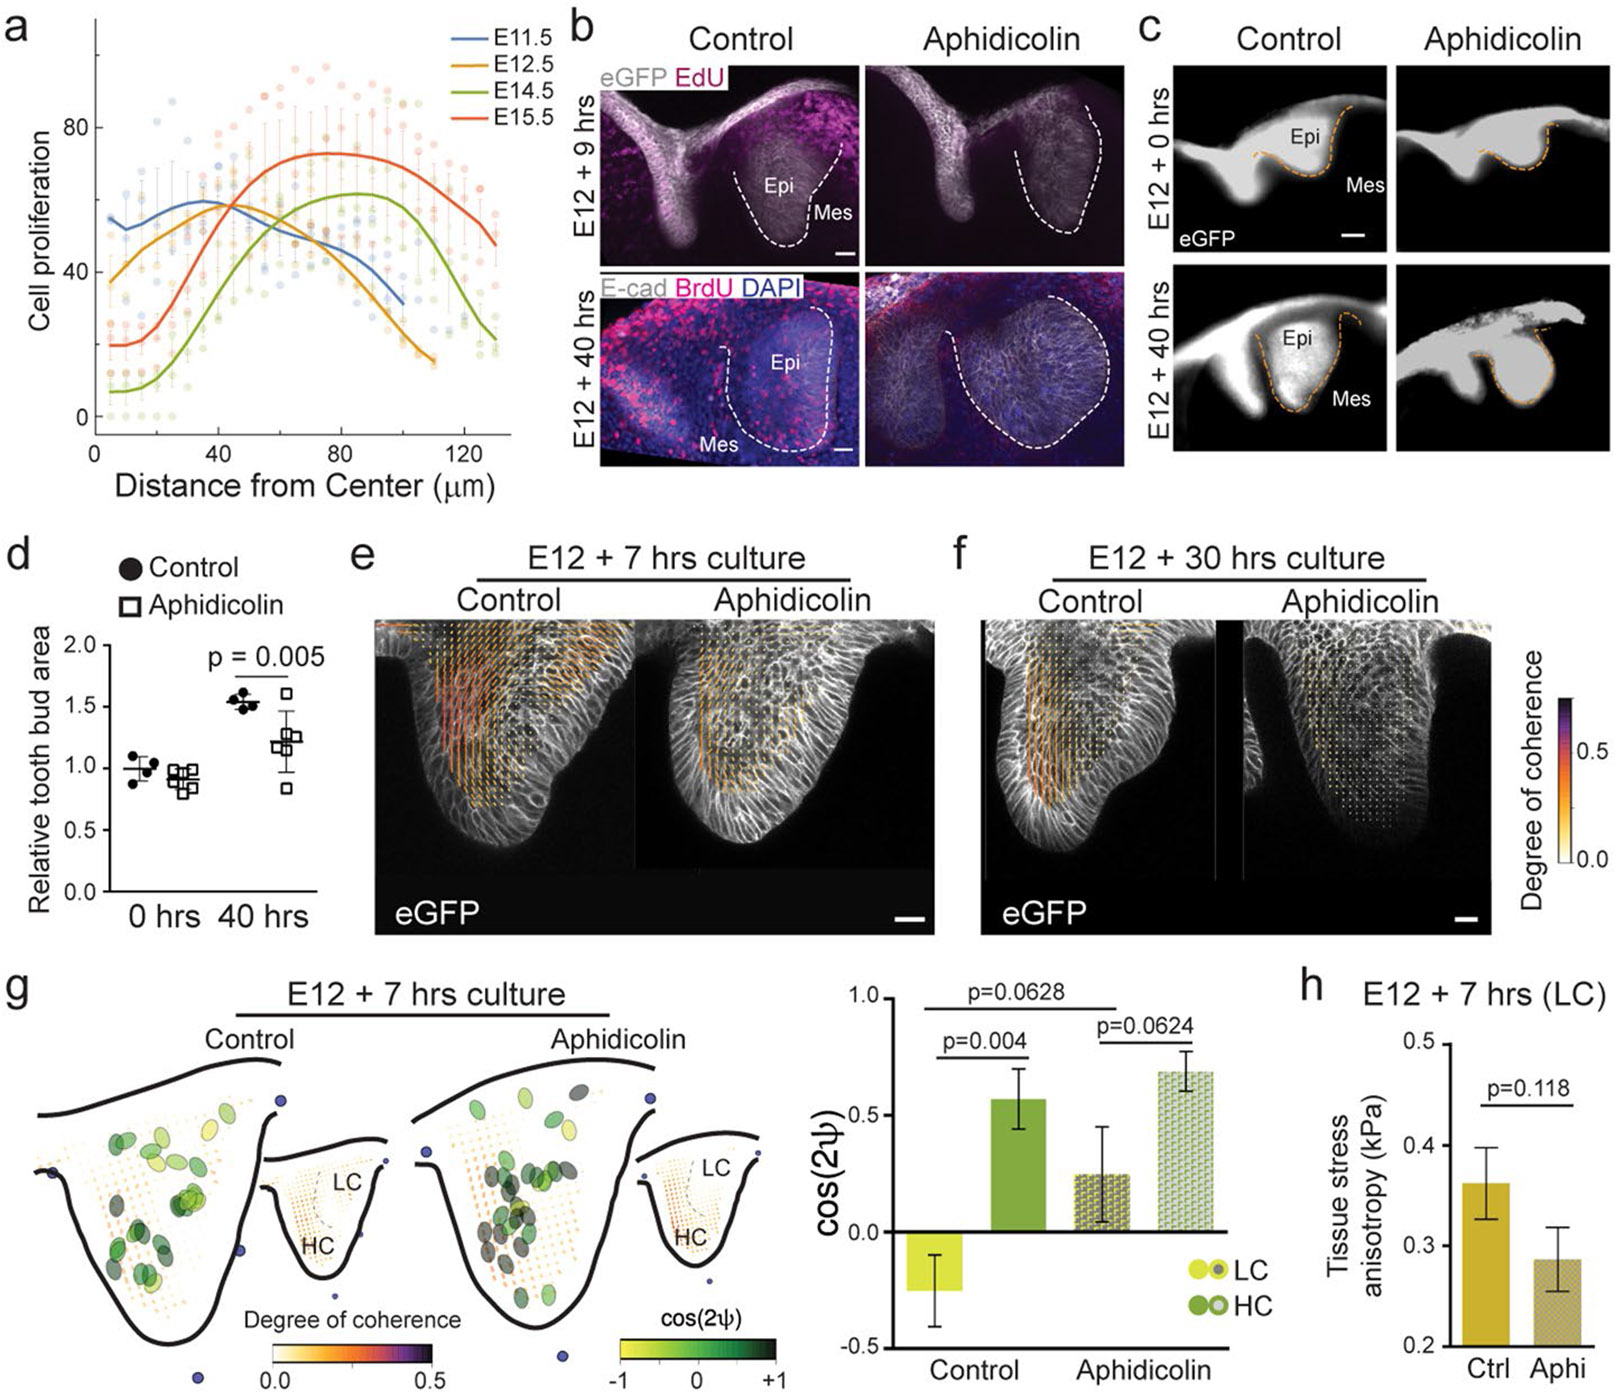
The circular nature of the mechanical resistance suggested that the stresses driving it could be isotropic in nature. Since tissue growth could potentially generate such isotropic stresses, we explored the possibility that proliferation underlies the stress buildup in the tissue. At early stages of incisor bud formation (E11.5), cell proliferation was highest in the dental epithelium and immediate surrounding mesenchyme, decaying away from this region, generating a radial proliferation gradient (Extended Data Fig. 4a and Methods). As the bud developed further (Fig. 3a), proliferating cells were predominantly found in a circular arrangement spanning the dental epithelium and part of the adjacent mesenchyme, and proliferation in its centre in the epithelium was reduced at E12.5 and nearly completely suppressed at E13.5 and E14.5 (Fig. 3a and Extended Data Fig. 4a). Three-dimensional imaging of the tissue showed that this circular proliferation pattern observed in 2D confocal sections corresponded to a hollow sphere of cell proliferation, with the non-proliferating EK at its centre within the epithelium (Fig. 3b).
Fig. 3 ∣. Circular mechanical and structural anisotropy depend on cell proliferation in the incisor during EK formation.
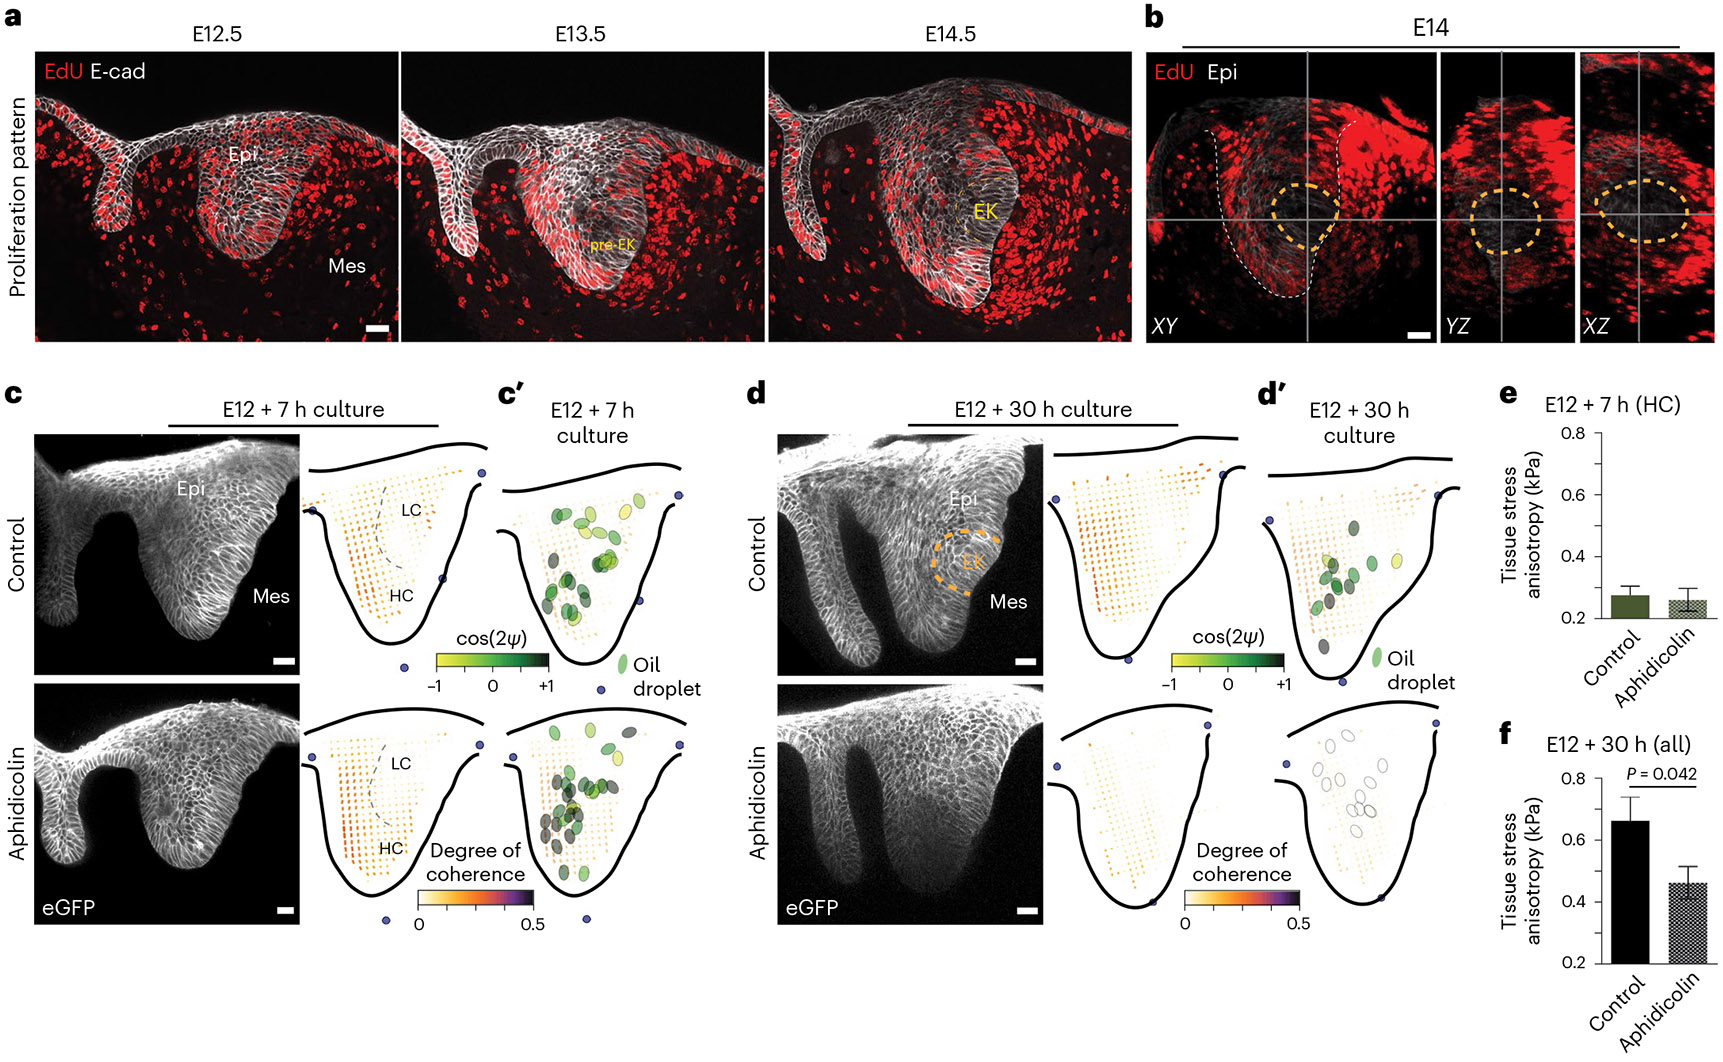
a, EdU and E-Cad immunostaining after a 1 h EdU chase in the developing incisor from E12.5 through E15.5 (n = 4). b, XY, YZ and XZ sections of an EdU-stained E14 incisor (outlined in the dashed grey line) showing the 3D sphere formed by the proliferating cells with a non-proliferating region at the location of the EK (outlined in the dashed yellow line). Planes are marked by the solid grey lines (n = 4). c,d, Representative image and anisotropy analysis (average) in live E12 incisors cultured for 7 h (c) and 30 h (d) with DMSO or aphidicolin. n = 5 for 7 h and n = 3 for 30 h for control and aphidicolin, respectively. c′,d′, Difference between droplet and local cell orientation in live E12 incisors cultured for 7 h (c′) and 30 h (d′) with DMSO or aphidicolin. Compilation of average data from 3 to 6 h after injection. Each ellipse represents one droplet/incisor. Lack of coherence in cell anisotropy at E12 + 30 h prevented the quantification of the ψ between droplet and tissue anisotropies. e,f, Tissue stress anisotropy in E12 incisors cultured for 7 h (e) and 30 h (f) with DMSO or aphidicolin. Droplets in the HC region used for 7 h (n = 16 for control and n = 14 for aphidicolin) and all droplets throughout the incisor used for 30 h quantifications (n = 10 for control and n = 12 for aphidicolin). c (top right) and c′ (top) have been reproduced from Fig. 2. epi, epithelium; mes, mesenchyme. Scale bar, 25 μm. A representative 2D central plane is shown in a, c and d. The data are presented as mean ± s.e.m. The statistical analysis was done using the two-tailed Mann–Whitney U test for e (not significant) and f. Source data are available for all plots. Each n represents the number of embryos, with one incisor bud measured per embryo.
These observations suggested that cell proliferation could potentially generate isotropic stresses within the growing tissue, akin to a tissue pressure arising from cell crowding upon growth inside the tissue31,32, as previously established in multicellular spheroids31,33. In the developing incisor, the observed cell proliferation profile at early stages (E12.5; Fig. 3a), with decaying cell proliferation from a maximum in the epithelium, would cause a similar pattern of tissue pressure, with a maximal value in the epithelium, as previously suggested for the Drosophila wing disc34. Mechanical resistance by the surrounding tissue to this proliferation-driven tissue pressure would result in a circular anisotropy pattern, as we observed (Fig. 1e-i), to balance mechanical stresses. In turn, this mechanical resistance would enable a progressive tissue pressure buildup at its centre, which could eventually suppress proliferation there and also drive EK formation. This hypothesis is consistent with our observations showing that cell proliferation is suppressed at the centre at later stages (E13.5; Fig. 3a) and that the EK emerges at this centre location (Figs. 1i and 3a).
To test this hypothesis, we used aphidicolin to inhibit cell proliferation at E12, before the anisotropy pattern and the EK emerge (Extended Data Fig. 4b-d and Methods). While treatment with aphidicolin for a short period of time (7 h) did not alter the tissue morphology nor the structural anisotropy pattern (Fig. 3c and Extended Data Fig. 4e), we found that longer treatments throughout the formation of the EK (30 h) changed the morphology of the tissue, eliminated the characteristic tissue bend associated with the EK and suppressed the characteristic circular tissue anisotropy pattern (Fig. 3d and Extended Data Fig. 4f). We found that the short (7 h) aphidicolin treatments did not change the high alignment between droplets and cell/tissue anisotropy in the HC region (Fig. 3c′, Extended Data Fig. 4g and Methods) or the magnitude of the resistive anisotropic stresses compared with controls (Fig. 3e and Extended Data Fig. 4h), in agreement with the lack of structural changes in the tissue for short aphidicolin treatments (Fig. 3c). However, longer aphidicolin treatments (30 h) caused a significant reduction in the magnitude of anisotropic stresses (Fig. 3f), also in agreement with the loss of structural anisotropy in these conditions (Fig. 3d,d′). These results indicate that cell proliferation is at the origin of the stress buildup in the tissue, with surrounding cells mechanically resisting it and causing the circular pattern in both structural and mechanical tissue anisotropies.
Pressure buildup regulates the emergence of the EK
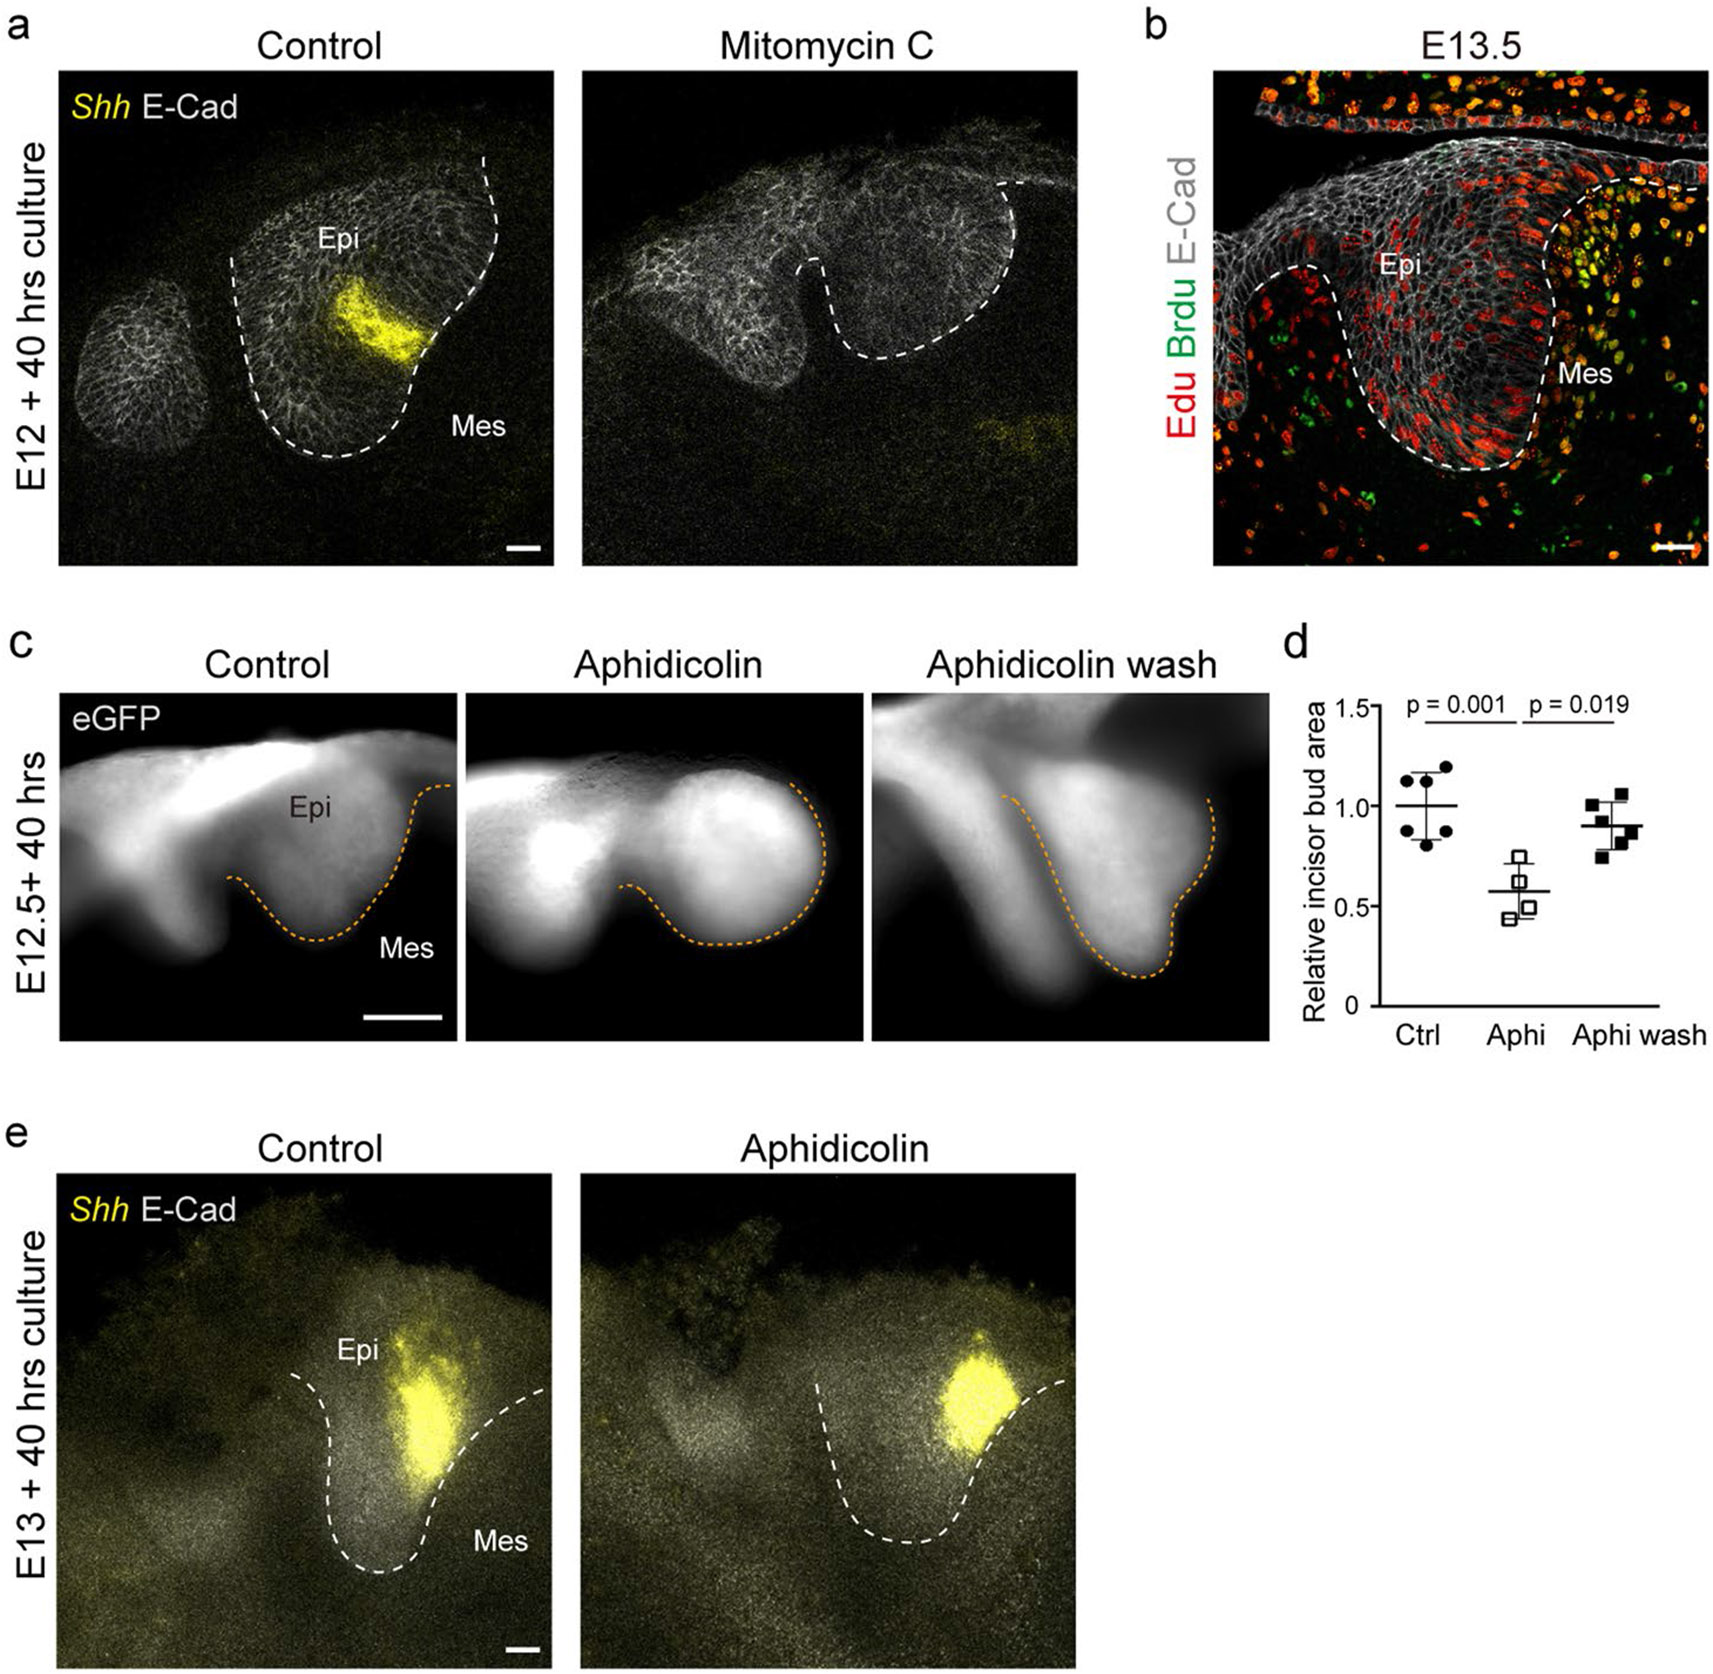
To test whether proliferation-driven tissue pressure could cause the emergence of the EK at the centre of the circular anisotropy pattern, we inhibited proliferation before mechanical anisotropy appears in the tissue and monitored Shh expression as an indicator of EK formation. Inhibition of cell proliferation at E12 with aphidicolin led to a substantial reduction in Shh expression (Fig. 4a,b), and treatment with mitomycin C completely abolished Shh expression (Extended Data Fig. 5a). The minimal Shh signal observed upon aphidicolin treatment was probably caused by the presence of cells that began to proliferate before treatment (Fig. 3c,c′, Extended Data Fig. 5b and Methods). Suppression of EK formation, loss of the circular anisotropy pattern and perturbed incisor morphology were all rescued upon removal of aphidicolin 16 h after its introduction (Fig. 4a-c and Extended Data Fig. 5c,d). These findings indicate that inhibition of proliferation prevents EK formation (Fig. 4a,b). Analysis of cell proliferation at the end of culture showed that a 16-h inhibition with aphidicolin synchronized the cell cycles around the EK (Fig. 4d,e and Methods), and this burst of cell proliferation triggered Shh expression in 24 h versus 40 h in controls (Fig. 4a). However, aphidicolin treatment of slightly older incisor buds (E13), in which the mechanical anisotropy pattern was already established before aphidicolin treatment, did not affect Shh expression (Extended Data Fig. 5e), indicating that the early cell proliferation pattern is critical for EK formation (E12; Fig. 3a). These data suggest that the proliferation-driven buildup of mechanical compression at the centre of the circular mechanical anisotropy pattern may drive formation of the EK.
Fig. 4 ∣. Proliferation-driven tissue pressure regulates EK gene expression in the murine incisor.
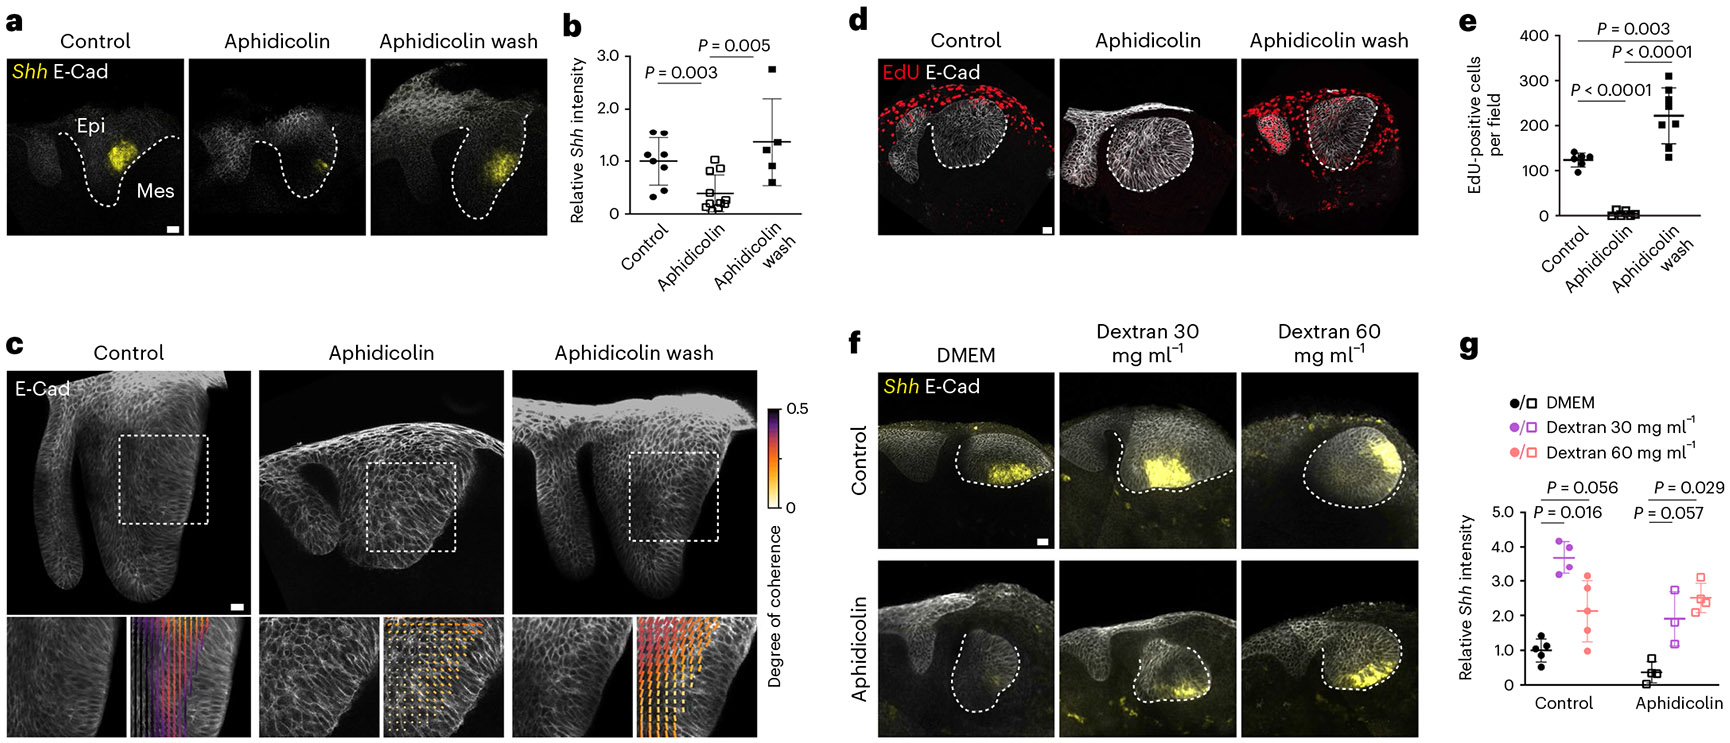
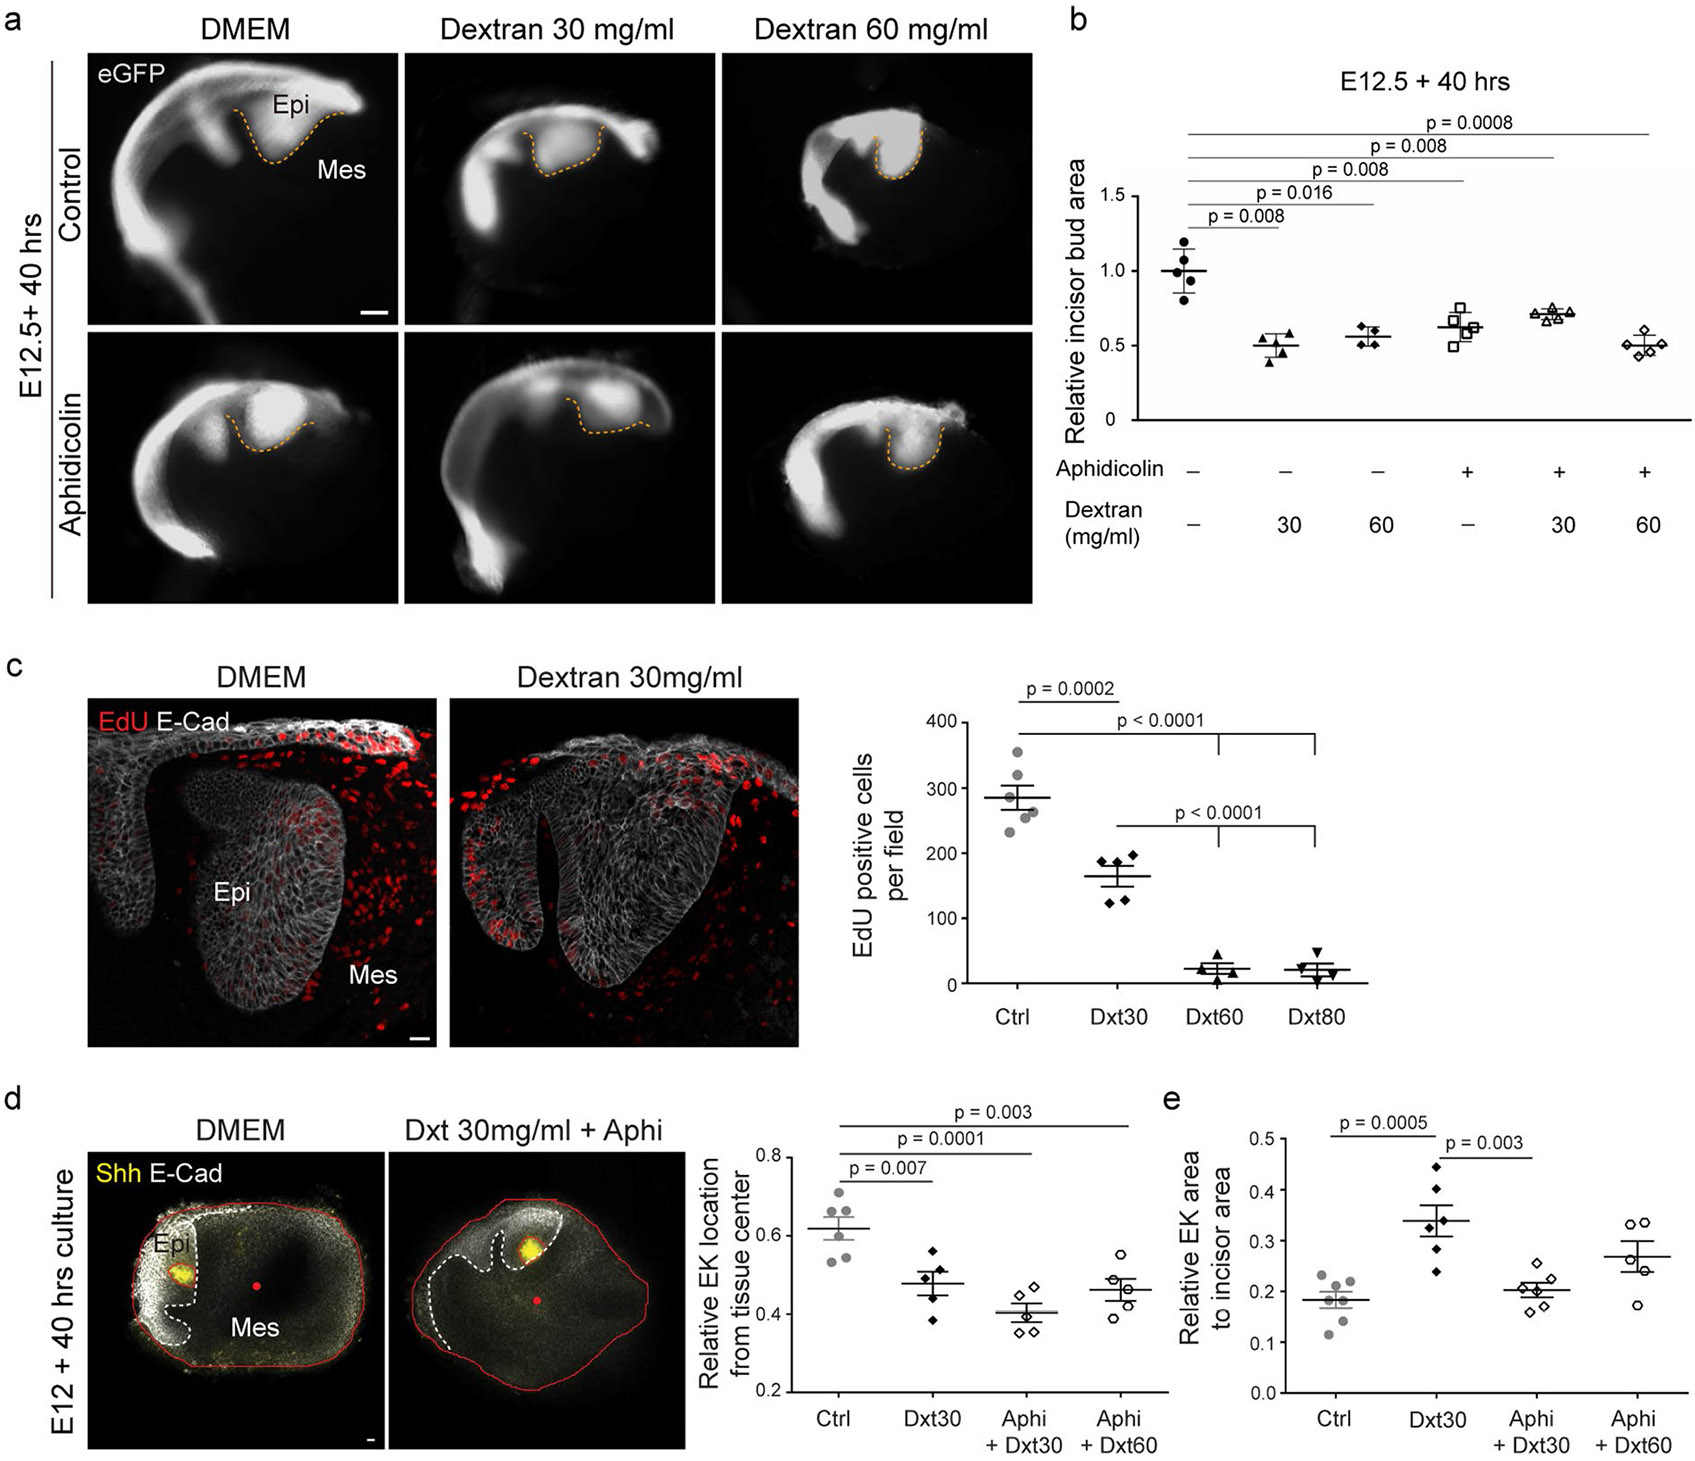
a, Whole mount in situ of Shh and E-Cad immunostaining in E12 incisors cultured for 40 h with DMSO or aphidicolin or with aphidicolin washed out after 16 h. b, Quantification of Shh intensity from all incisor buds represented in a (n = 8 for control, n = 11 for aphidicolin and n = 5 for the aphidicolin wash). c, Representative images and tissue anisotropy analysis (cell orientation) in E12 incisors from K14Cre;R26mTmG/mTmG embryos cultured for 40 h with DMSO or aphidicolin or with aphidicolin washed out after 16 h (n = 5). d, EdU and E-Cad immunostaining in E12 incisors cultured for 40 h with DMSO or aphidicolin or with aphidicolin washed out after 16 h. e, Quantification of EdU positive cells from all images represented in d (n = 6 for control, n = 6 for aphidicolin and n = 8 for the aphidicolin wash). f, Whole mount in situ of Shh and E-Cad immunostaining in E12 incisors cultured for 40 h with DMSO or aphidicolin with varying concentrations of dextran (30 mg ml−1 and 60 mg ml−1). g, Quantification of Shh intensity from all incisor buds represented in f (n = 5, 4 and 5 for control and n = 4, 3 and 4 for aphidicolin, with DMSO, dextran 30 mg ml−1 and dextran 60 mg ml−1, respectively). The dashed line outlines the incisor. epi, epithelium; mes, mesenchyme. Scale bars, 25 μm. A representative 2D central plane is shown in a, c, d and f. The data are presented as mean ± s.e.m. The statistical analysis was done using the two-tailed Mann–Whitney U test for b and g and the unpaired two-tailed Student’s t test (assuming unequal variance) with Welch’s correction for e. Source data are available for all plots. Each n represents the number of embryos, with one incisor measured per embryo.
To directly test whether mechanical compression can drive EK formation, we compressed the tissue after inhibition of cell proliferation by adding dextran to the culture medium (Methods). As previously shown, addition of large molecules of dextran (>500 kDa) to the culture medium creates an osmotic imbalance, which drives water out of the tissue and causes its mechanical compression33,35-37. Since living tissues are filled with water (incompressible), any mechanical compression requires some water to flow out. Indeed, we observed that incisor bud sizes were reduced to approximately half their normal culture size in the presence of dextran and became rounder compared with controls (Extended Data Fig. 6a,b). Also, in agreement with previous studies35-37, the application of compression by dextran reduced cell proliferation (Extended Data Fig. 6c). We found that dextran-induced mechanical compression of the tissue led to a recovery of Shh expression in aphidicolin treated incisors (Fig. 4f,g). These data indicate that, in the absence of cell proliferation, externally applied mechanical pressure rescues EK formation. Moreover, dextran also induced a significant overexpression of Shh in control (normally proliferating) incisor buds (Fig. 4f,g), suggesting that an external induction of compression enhances Shh expression. In the presence of dextran, the relative location of the EK moved closer to the centre of the explant (Extended Data Fig. 6d), in part owing to reduction in tissue size caused by the applied pressure. Shh expression remained centred in the EK region, and the relative area of Shh expression compared with the incisor area increased with additional pressure (Extended Data Fig. 6e), indicating a correlation between the area of Shh expression and mechanical compression.
Since the observed rescue of EK formation could potentially be controlled via previously implicated EK regulators, we studied their behaviour during perturbations of cell proliferation and tissue compression. We found that Bmp4 and Pax910,24 mesenchymal expression remained unchanged with perturbations of proliferation and tissue compression (Extended Data Fig. 7a,b). However, the expression of epithelial Bmp4 and Wnt10a, markers of the EK itself20,38, was suppressed upon the inhibition of proliferation and rescued upon washing out aphidicolin or inducing mechanical compression with dextran (Extended Data Fig. 7b,c). These findings demonstrate that proliferation-driven tissue compression is an essential regulator of EK formation in the incisor.
αE-catenin and YAP/TAZ transmit mechanical signals to the EK
Previous studies showed that the EK failed to form when mechanical cohesion between cells in the epithelium was reduced by deletion of αE-catenin, encoded by Ctnna125. Since αE-catenin has previously been established as a conduit for mechanotransduction downstream of increased cell proliferation39, we hypothesize that it may play a similar role to control EK formation in the incisor. To test this, we deleted αE-catenin in the dental epithelium using K14Cre and found that incisor morphogenesis was severely affected due to loss of the EK (Fig. 5a), as previously shown25. While cell proliferation remained unperturbed in the mutant dental tissue during and after EK formation (E13.5–E14.5; Fig. 5a), the characteristic circular anisotropy pattern was lost (Fig. 5b), and there was no central region with non-proliferating cells (Fig. 5a). Consistent with these observations, Shh expression was lost and EK formation was suppressed in the absence of αE-catenin in the dental epithelium (Fig. 5c, left). Altogether, these observations are consistent with epithelial cells failing to maintain strong physical connections without αE-catenin and the tissue losing its ability to mechanically resist the pressure exerted by cell proliferation, thereby reducing the tissue compression and suppressing EK formation. Shh expression could be partially rescued in half of the mutant buds upon induction of tissue compression with dextran (Fig. 5c, right). These data indicate that mechanical compression is necessary for the formation of the EK, whether compression emerges internally from αE-catenin-mediated mechanical resistance to proliferation-driven pressure or is applied externally.
Fig. 5 ∣. αE-catenin is necessary to create mechanical tissue anisotropy and for EK formation.
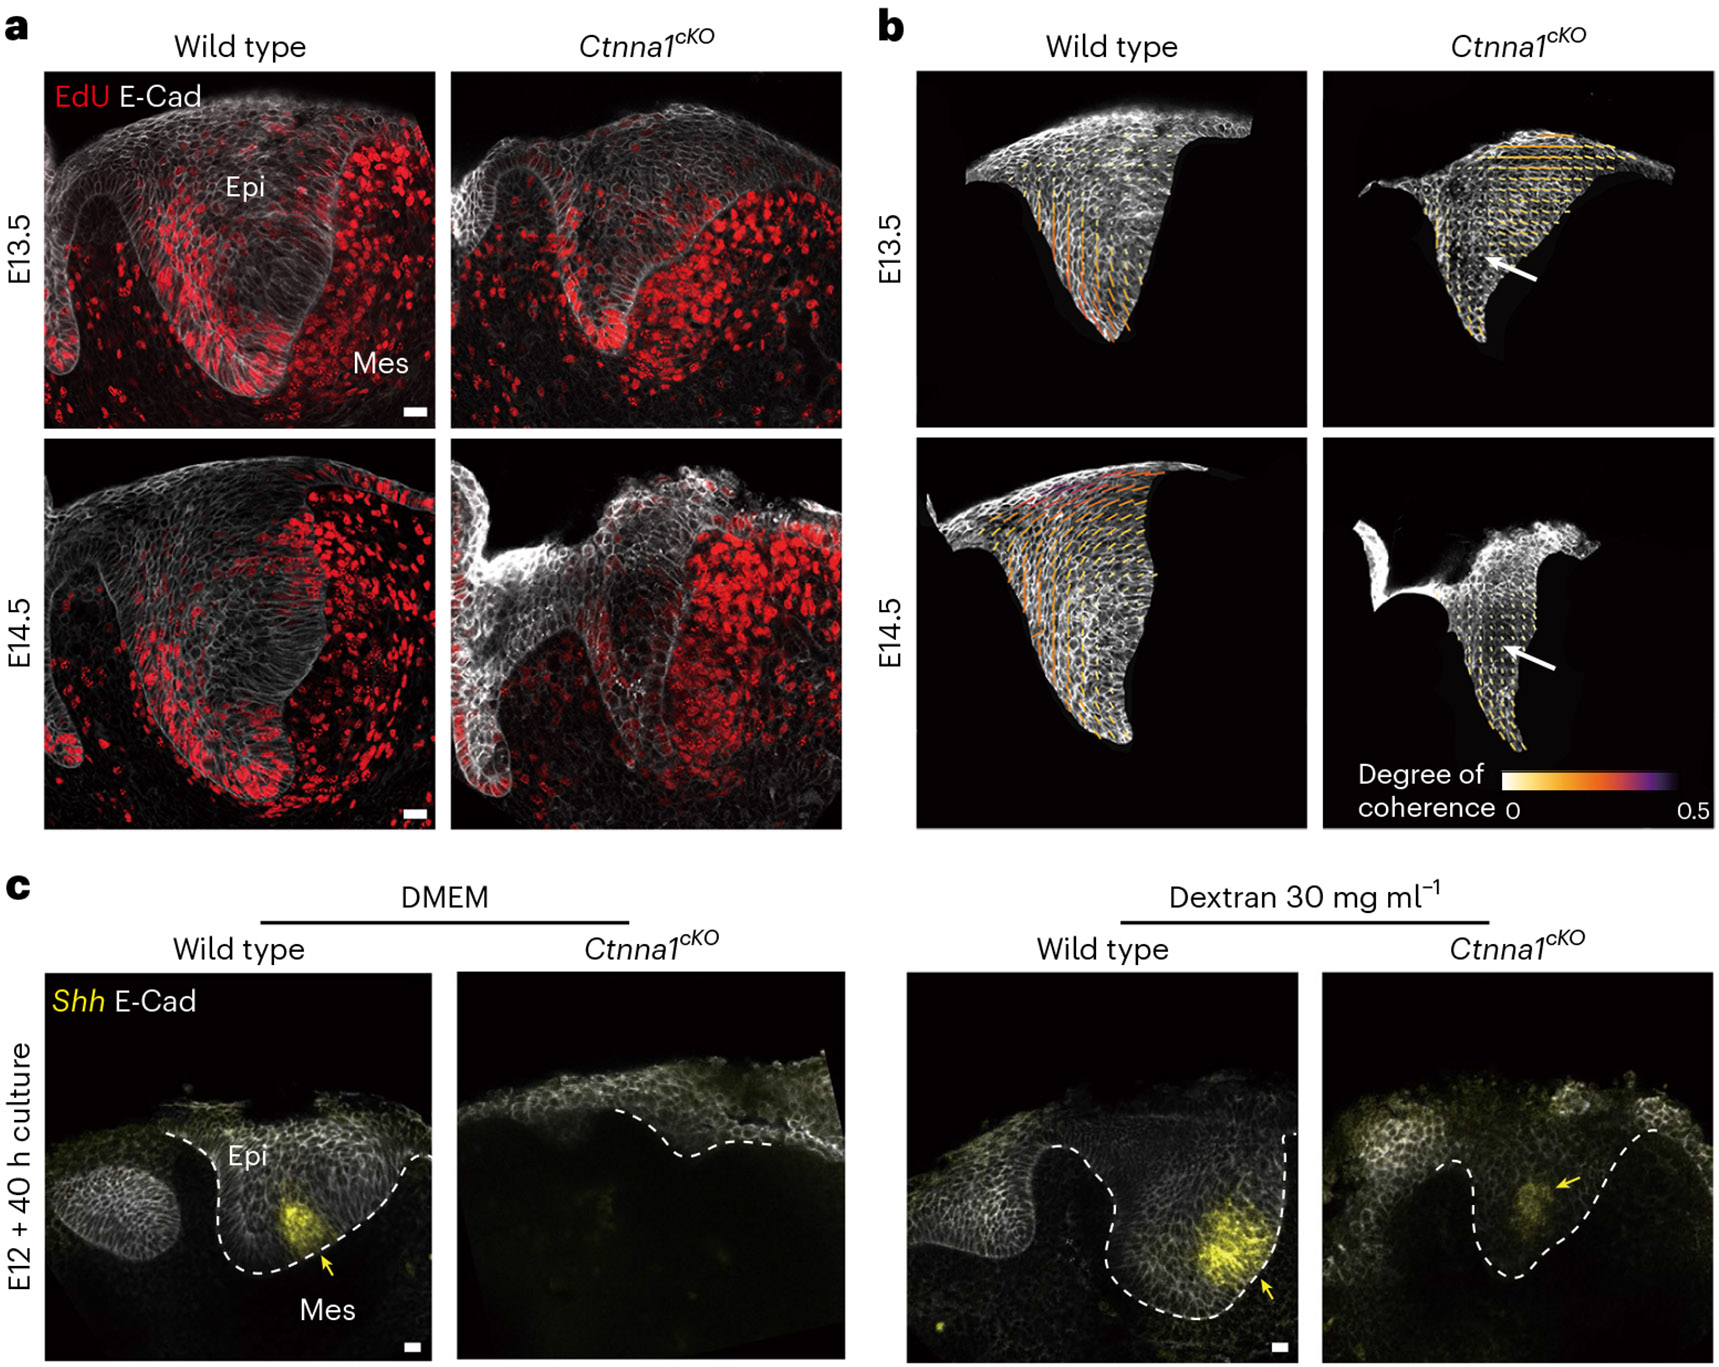
a, EdU and E-Cad immunostaining after a 1-h EdU chase in the developing incisor from wild type (K14Cre;Ctnna1fl/+) and K14Cre;Ctnna1cKO mice at E13.5 and E14.5 (n = 4 for wild type and n = 3 for Ctnna1cKO). b, Tissue anisotropy analysis (cell orientation) of incisors represented in a. The white arrows show loss of anisotropy. c, Whole mount in situ of Shh and E-Cad immunostaining in E12 incisors from wild type (K14Cre;Ctnna1fl/+) and K14Cre;Ctnna1cKO mice cultured for 40 h with DMSO or dextran (30 mg ml−1). The yellow arrows point to Shh. A total of 11 out of 12 DMEM-treated mutants showed absence of Shh, and 4 out of 7 dextran-treated mutants showed presence of Shh (n = 7 and 12 for DMEM and n = 7 and 7 for dextran 30 mg ml−1, for wild type and Ctnna1cKO, respectively). The dashed line outlines the incisor. epi, epithelium; mes, mesenchyme. Scale bars, 25 μm. A representative 2D central plane is shown in all images. Each n represents the number of embryos, with one incisor measured per embryo.
To understand how mechanical information is relayed to cells in the tissue during EK formation, we tested the role of two well-known mechanotransducers, namely Piezo and YAP40,41. We found that Piezo1 was expressed at a very low level in the dental tissue (Fig. 6a), and its expression did not change upon perturbations of cell proliferation or tissue compression (Fig. 6a). Moreover, neither genetic deletion of epithelial Piezo1/2 using K14CreER nor its chemical inhibition via Gd3+40 affected Shh expression (Fig. 6b,c), indicating that Piezo is not the mechanosensor involved in EK formation. On the other hand, YAP has been previously implicated in EK development25,41, and it is known that YAP localization in the nucleus versus the cytoplasm depends on the mechanical state of the cell42,43. Immunostaining revealed YAP nuclear localization in the cells forming the circular anisotropy pattern around the EK that mechanically resist the pressure buildup (Fig. 7a). In contrast, cells within the mechanically compressed EK displayed significantly reduced nuclear YAP levels, with most YAP found in the cytoplasm. Upon inhibition of cell proliferation with aphidicolin, YAP became nuclear throughout the incisor epithelium (Fig. 7a,d). The epithelial YAP pattern was restored by washing out aphidicolin after 16 h or by applying compression using 30 mg ml−1 dextran (with or without aphidicolin; Fig. 7b-d). Moreover, treating explants with increasing concentrations of dextran expanded the loss of nuclear YAP to larger tissue areas (Extended Data Fig. 7e), suggesting that higher tissue compression increases the region of cells without nuclear YAP. These data show that YAP mediates cells’ response to mechanical stresses, with proliferation-driven compressive stresses in the epithelium inducing the loss of nuclear YAP, thereby regulating morphogen expression and the formation of the EK.
Fig. 6 ∣. Piezo does not affect EK formation.
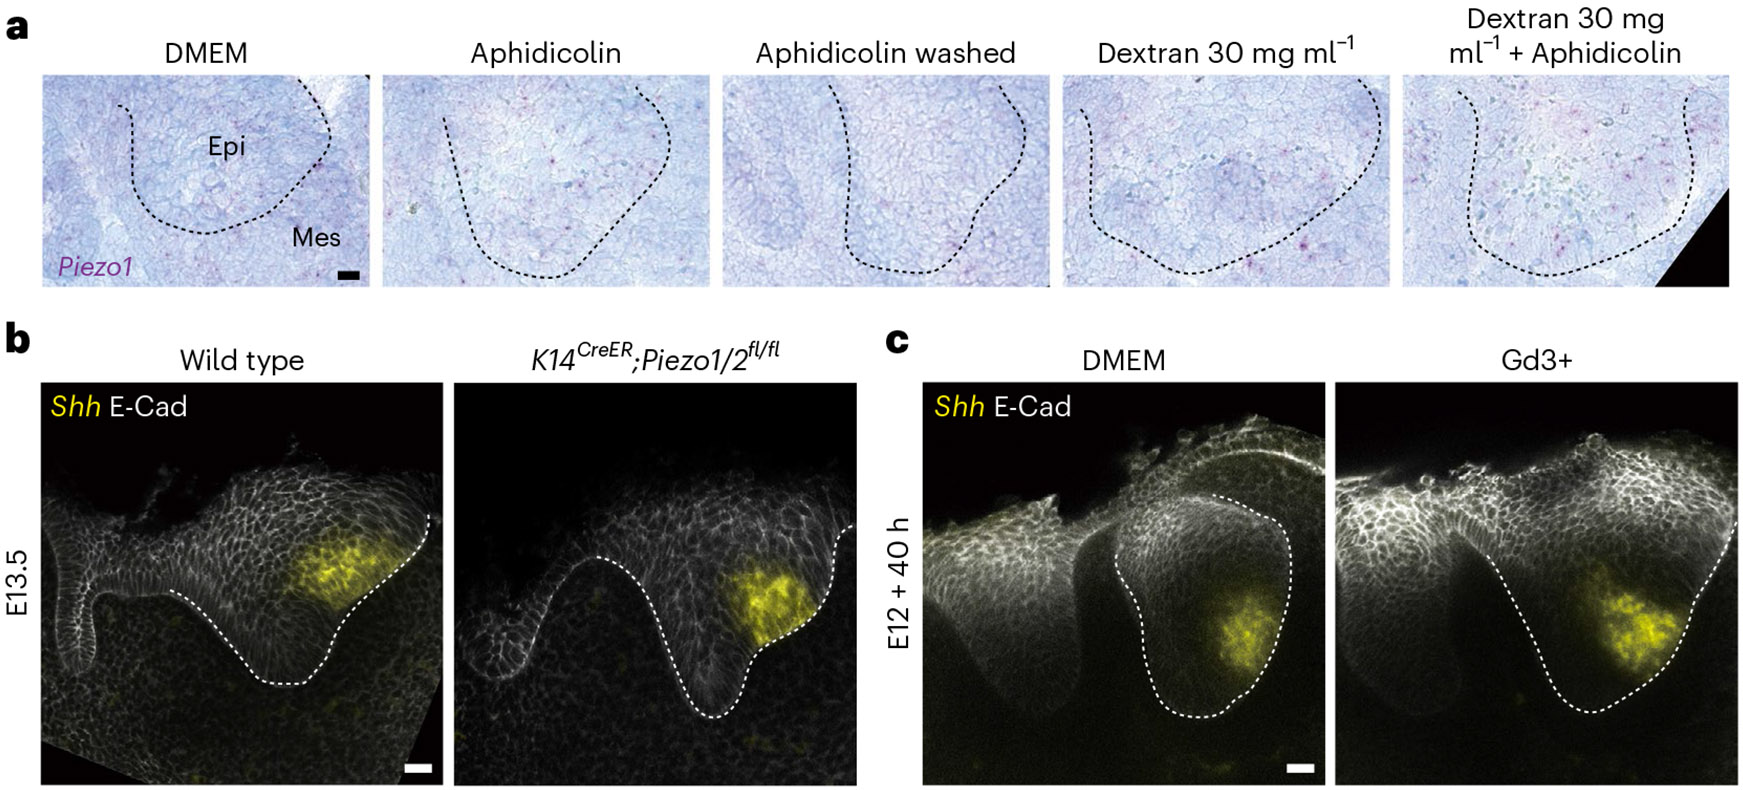
a, RNAscope of Piezo1 in E12 incisors cultured for 40 h in DMEM with aphidicolin, aphidicolin washed out after 16 h or dextran (30 mg ml−1) ± aphidicolin (n = 4). b,c, Whole mount in situ of Shh and E-Cad immunostaining in E13.5 wild type (Piezo1/2fl/fl) or K14CreER;Piezo1/2fl/fl incisors (n = 4) (b) and E12 incisors cultured in DMEM or Gd3+ (Piezo1/2 inhibitor) for 40 h (n = 5) (c). Scale bar, 25 μm. epi, epithelium; mes, mesenchyme. The dashed line outlines the incisor. A representative 2D central plane is shown in all images. Each n represents the number of embryos, with one incisor measured per embryo.
Fig. 7 ∣. YAP transduces mechanical information to establish the EK in the murine incisor.
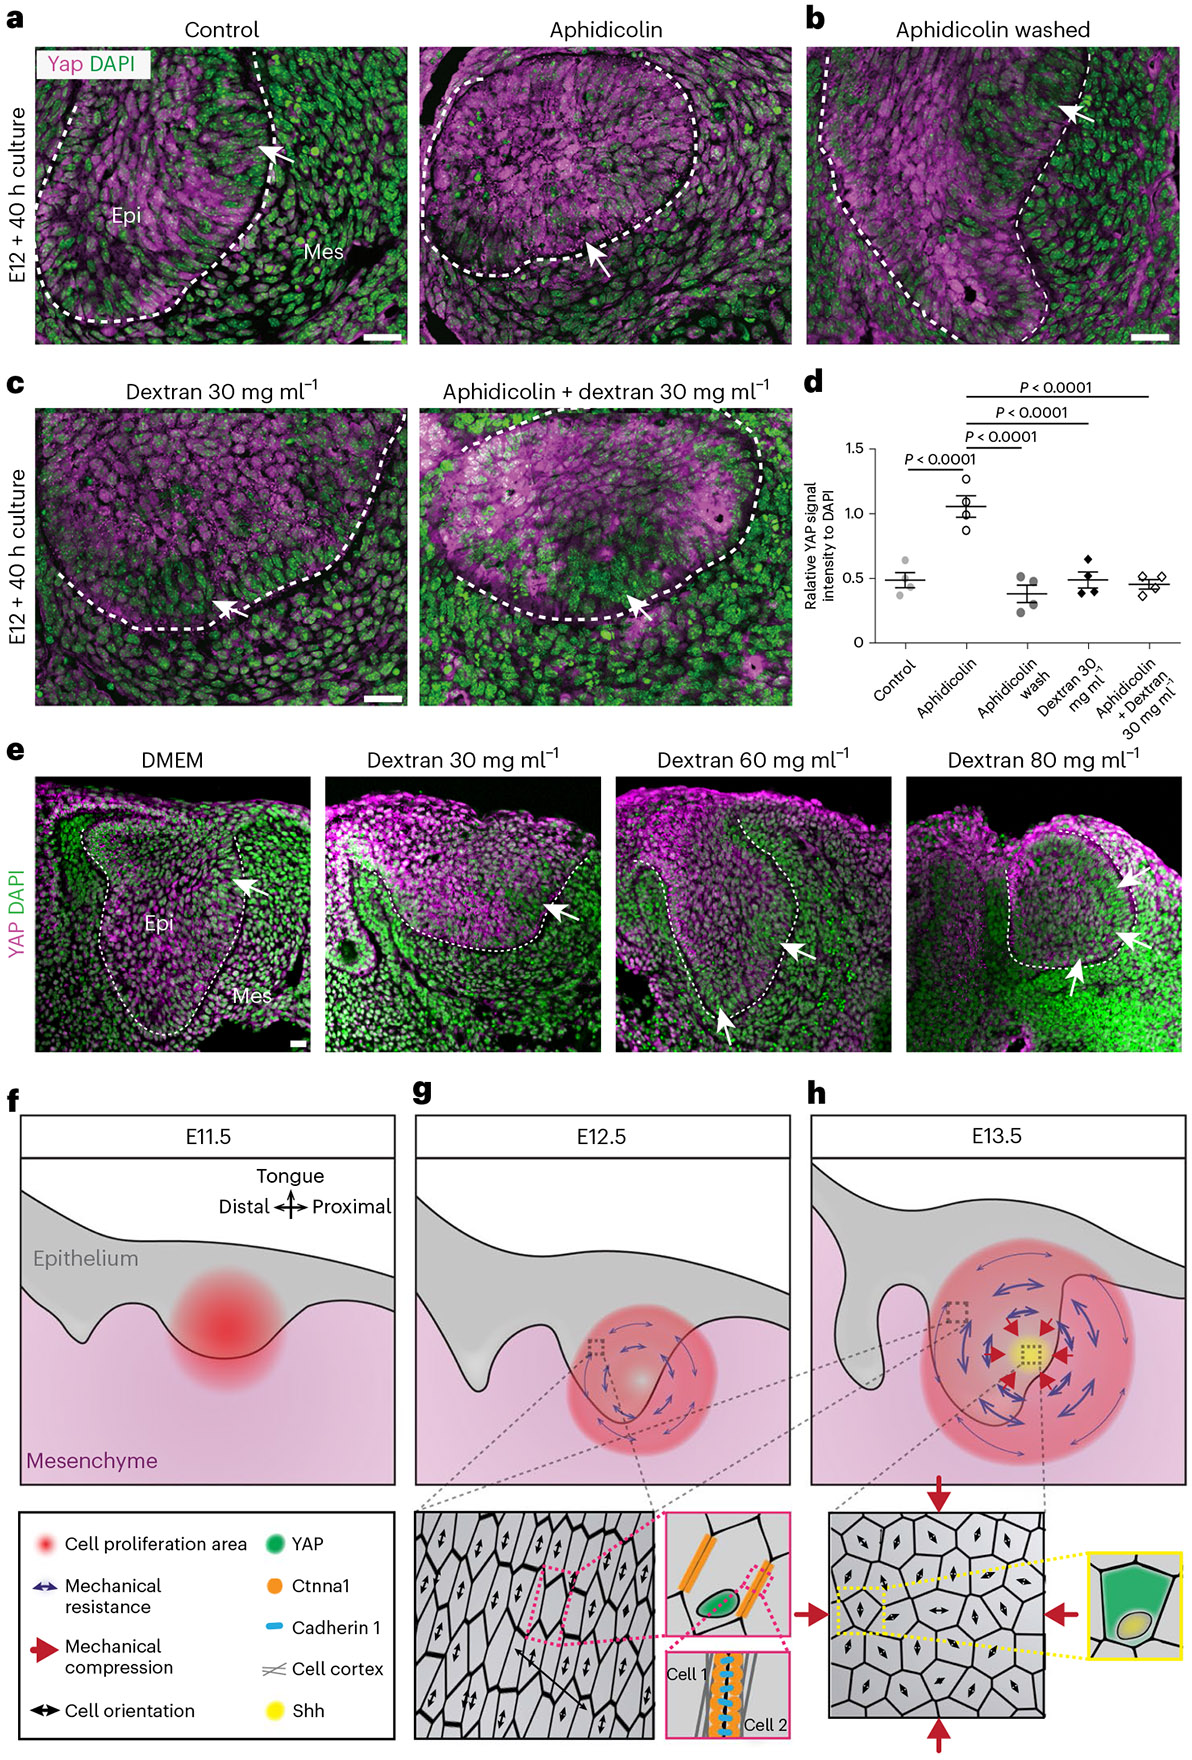
a,b,c, YAP immunostaining in OCT sections from E12 incisors cultured for 40 h with DMSO (left) and aphidicolin (right) (a), aphidicolin washed out after 16 h (b) or dextran (30 mg ml−1) in the absence (left) or presence (right) of aphidicolin (c). The white arrows point to actual/presumptive EK (n = 4 for each condition). d, Quantification of YAP nuclear signal intensity in the EK region from all images represented in a, b and c (n = 5 nuclei examined over four biological samples for all conditions). e, YAP immunostaining in OCT sections of E12 incisors cultured with DMEM (left) or 30 (middle left), 60 (middle right) and 80 mg ml−1 (right) dextran. The arrows denote region(s) of loss of nuclear YAP (n = 4 for each condition). f,g,h, Schematics of the main events driving EK formation. At E11.5 (f), a graded cell proliferation pattern in the incisor bud is observed. The cell proliferation gradient induces a localized growth in the epithelium and adjacent mesenchyme. With increasing proliferation, a circular pattern of structural anisotropy emerges in the tissue at E12.5 (g). The structural anisotropy is linked to a mechanical anisotropy associated with mechanical stresses that resist the localized increase in proliferation-driven tissue pressure. Cells in regions resisting the pressure are stretched along the direction of tissue- scale anisotropy (zoom-in) and display nuclear YAP (zoom-in). Intracellular αE-catenin (encoded by Ctnna1;zoom-in) is essential to physically link the cytoskeleton in neighbouring cells and allow them to mechanically resist the proliferation-driven buildup in tissue pressure. Tissue resistance to the graded cell proliferation causes an increase of tissue compression at the centre of the circular anisotropy pattern (h), which causes a loss of nuclear YAP (zoom-in), a suppression of cell proliferation and triggers Shh expression (zoom-in), driving EK formation. The dashed line outlines the incisor. Scale bars, 25 μm. epi, epithelium; mes, mesenchyme. A representative 2D central plane is shown in all images. The data are presented as mean ± s.e.m. The statistical analysis was done using one-way ANOVA with Bonferroni’s correction for multiple comparisons for d. Source data are available for all plots. Except for d, each n represents the number of embryos, with one incisor measured per embryo.
Altogether, our data build upon the observations from multiple groups and reveal the specific physical mechanism by which proliferation-mediated mechanical compression in the tissue controls the formation of the EK.
Discussion
Our findings demonstrate a role for endogenous tissue mechanics in the specification of signalling centres during organ development. We find that tissue mechanical resistance to cell proliferation in the incisor causes the emergence of a circular pattern of both structural and mechanical anisotropy from E11.5–14.5, the period of EK formation. In the epithelium, the development of this anisotropy is dependent on αE-catenin, which allows cells to establish robust physical connections and mechanically resist the proliferation-driven pressure buildup, with stretched cells displaying nuclear YAP. As a consequence of this mechanical resistance to increasing pressure, the tissue at the centre of the circular pattern becomes compressed and nuclear localization of YAP is lost, driving the formation of the signalling centre organizing tooth formation, the EK (Fig. 7f).
Studies on the mechanism of signalling centre formation so far have focused on the expression patterns of morphogens. For example, the isthmic organizer is specified by the mutually inhibitory expression of Otx2 in the midbrain and Gbx2 in the hindbrain overlapping with the dorso-ventral gradient formed by the Bmp family genes and Shh8. However, questions remain as to how the pattern in this and other cases is initiated, and previous studies have suggested that mechanical cues could organize tissue formation too. During specification of the Spemann organizer in Xenopus, cortical rotation induced by sperm entry triggers the rearrangement of the microtubule cytoskeleton, which moves Wnt-β-catenin pathway components into a region of the zygote, where they can interact with competent targets5,15. Although intracellular, this provides an example of how a mechanical change can influence signalling patterns. In another study, localized activation of the mechanotransducer YAP drives formation of the Shh-expressing notochord-floorplate signalling centre that patterns the neural tube44. Here, we show how the proliferation-driven buildup in mechanical compression induces expression of EK markers, including Shh, thereby specifying signalling centre formation in the incisor.
A focus on actomyosin-generated stresses has dominated recent examinations of endogenous tissue mechanics. For example, actomyosin-driven active stresses have been shown to control both morphogenesis and chondrogenic differentiation during mammalian digit formation30. Our data show how to distinguish the contribution of proliferation-driven stresses from actomyosin-driven active stresses in vivo. In the case of mouse incisors, we found that tissue-level actomyosin tension does not affect the formation of the EK. Instead, we find that a cell proliferation-driven increase in tissue mechanical compression is the central regulator of this process. Our work builds on studies in the Drosophila wing disc that reported a circular pattern of anisotropy in the 2D wing epithelial monolayer34,45 and suggested that a cell proliferation-mediated increase in pressure could regulate tissue patterning1. Using pharmacological inhibitors and direct measurements of internal stresses, our results provide a concrete validation that cell proliferation can function as a stress generator in tissues. This also supports previous observations that the condensed mesenchyme around the molar enamel organ exists in a state of tension that can influence various aspects of tooth development46,47. While all of our data, including structural, mechanical and molecular measurements and perturbations, point towards a proliferation-driven increase in tissue pressure (compression) guiding EK formation, we cannot exclude that other molecular or mechanical factors also participate in the process. Current technology does not allow for direct measurements of tissue pressure in situ. Future studies will further assess the role of pressure and reveal the potential participation of other factors in EK formation.
Studies on the effects of master regulators such as Pitx2 or Pax9 and Msx1 or even Shh on EK formation have always reported a notable decline in cell proliferation18,24,48. Our data provide an explanation for these phenomena. Interestingly, the formation of the EK happens at the centre of a circular pattern of anisotropy that spans both the epithelium and the mesenchyme. However, mechanical compression, whether caused by resistance to endogenous proliferation-driven pressure or by externally applied dextran, induces Shh expression only in the epithelium. This suggests that mesenchymal cells are not competent to respond in the same way.
Beyond the physical mechanism of signalling centre specification, how mechanical signal transducers link the tissue stresses to Shh expression needs to be explored further. Both αE-catenin and YAP/TAZ are known mechanotransducers that act in concert with various cell intrinsic and extrinsic pathways in the incisor and other organs49-51. Here, we have parsed their actions downstream of different mechanical inputs in the developing incisor. However, unlike previous studies that have explored the temporal and spatial connection between nuclear YAP/TAZ activation and Hedgehog signalling44,52,53, we are proposing that there is induction of Shh and other EK markers via the loss of nuclear YAP. It is possible that, within the EK, some other mechanotransducers are activated, such as the ETS transcription factors that have been linked to Shh expression in the ZPA of the limb bud54. There may also be an antagonistic interaction between YAP and hedgehog signalling that is dependent upon cell density55. Further work will be needed to understand the detailed signal transduction pathway that transmits the stresses arising from pressure buildup to the induction of biochemical factors.
Generally, our results show how endogenous tissue mechanics can function upstream of morphogen-dependent patterning during development and reveal a new role for proliferation-driven mechanical stresses in the coordination of morphogenesis and developmental patterning.
Methods
Mouse lines
K14Cre mice56, R26mT/mG mice57 and R26-pCAG-nuc-3x mKate2 mice58, obtained from the Keller laboratory, Janelia (originally from the Ueda laboratory, RIKEN), C57BL/6J mice (Jackson Laboratory 000664) and Ctnna1/3cKO (Jackson laboratory 004604; obtained from the Radice laboratory, RIH and VIB), were housed and maintained at the University of California, San Francisco (UCSF) animal care facility. Mice were housed singly (plugging males) or four to five per cage in ventilator cages with ad libitum food and water, in pathogen-free conditions. A 12 h light cycle at 68–79 °F ambient temperature and 30–70% humidity was maintained. K14CreER mice (Jackson Laboratory 005107), Piezo1fl/fl mice59 and Piezo2fl/fl mice60 mice were maintained at the University of California, Los Angeles animal facility under similar conditions as UCSF. At the time of acquisition, the mouse strains were on B6 backgrounds, but they were subsequently maintained on mixed backgrounds. Genotyping was done as previously published. The R26mTmG/mTmG females were crossed to K14Cre males to obtain the dual labelled K14Cre;R26mTmG/mTmG line, which has been used for most experiments. For all lines, 2–5-month-old females were mated to plug, and pregnant females were killed at E12.5 and E13.5 to collect eGFP+ embryos. The embryos were staged for growth/age according to their molecular weight and divided into the following group: 0.10 g (E11.5, initiating bud stage), 0.11 g (E12, pre-EK stage), 0.12 g (E12.5, pre-EK stage), 0.13–0.14 g (E13.5, EK formation stage), 0.15–0.16 g (E14.5, post-EK stage) and 0.17–0.18 g (E15.5, post-EK stage). The Piezo1fl/fl and Piezo2fl/fl mice were crossed to generate double mutants which were crossed to the K14CreER line with tamoxifen induction at E10.5 in pregnant females to obtain K14CreER;Piezo1/2fl/fl embryos at E13.5. The Ctnna1/3cKO line was bred with C57BL/6J mice to breed out the Ctnna3cKO gene, and the resulting mutant females were crossed to K14Cre males to generate K14Cre;Ctnna1cKO embryos at E12.5 and E13.5. No other criteria were used to exclude any mice from experiments. All experiments involving mice were approved by the Institutional Animal Care and Use Committee of the University of California, San Francisco (protocol #AN180876-03C) and the University of California, Los Angeles (protocol #ARC-2019-013).
Nuclear anisotropy measurement
R26-pCAG-nuc-3x mKate2 mice where the cell nuclei are fluorescently labelled with mKate2 were used to measure the nuclear anisotropy patterns. E11.5–14.5 embryos were fixed, mandibles were dissected and embedded in 4% low melt agarose. The agarose blocks were sectioned using a vibratome to obtain 90 μm slices that were mounted using 1 mm spacers and imaged on the Zeiss LSM900 microscope. Images were processed using the Zen software and FIJI to obtain nuclear anisotropy maps as outlined in ‘Orientation vector field analysis’ section.
Explant culture and experiments
Dissected mandibular incisor slices of correctly staged embryos were cultured on 1 μm pore size PET membranes (Millipore no. MCRP06H48 or Sterlitech no. PET1013100) and rested on a wire mesh so as to remain at an air–liquid interface61. The tissue was resting free on the filter without embedding in agar. The culture media was composed of fluorobrite Dulbecco’s modified Eagle’s medium (DMEM), 50% rat serum (Valley Biomedical no. AS3061SC), 5% glucose, 125 μg ml−1 ascorbic acid, 1X NEAA, 1X Glutamax and 1% PenStrep. Cultures were typically done for 38–42 h as specified in the experiments at 37 °C and 5% CO2 conditions. A total of 3.33 μM aphidicolin (CST no. 32774) or 11.33 μM blebbistatin (Sigma no. B0560) along with an equal volume of the solvent dimethyl sulfoxide (DMSO) as controls were used for treating the cultures for required time intervals. Blebbistatin/DMSO was replenished with fresh culture media after 20 h. For the aphidicolin wash experiment, the spent culture media was removed, all dishes rinsed with PBS twice, and then the buds were put in fresh media with DMSO or fresh aphidicolin after 16 h. The media was also replaced for the accompanying control and aphidicolin treated explants also. Large dextran (>500kDa, Sigma no. D5376) was used at concentrations of 30 mg ml−1 (~2kPa), 60 mg ml−1 (~6 kPa) and 80 mg ml−1 (~10 kPa) ± 3.33 μM aphidicolin. Large dextran is impermeable to the extracellular matrix (ECM) and increases pressure in the centre of the tissue by a process of gradual dehydration33,35. Other inhibitors used were 20 μM ROCK inhibitor Y27632 (Tocris no. 1254) left throughout culture, 10 μg ml−1 mitomycin C (Tocris no. 3258) washed out after a 1 h treatment at 37 °C and 30 μM Gd3+ (Apexbio no. B7706) replenished after 24 h and kept throughout culture. For measuring proliferation, culture dishes were spiked with 5 μg ml−1 EdU or 10 μg ml−1 BrdU for 1 or 2 h before termination of the culture as mentioned. Tooth bud areas were measured manually using the tracing tool in FIJI from images taken on the Leica MZ16F stereoscope (Leica Application Suite (LAS) software) or the Leica Dmi8 microscope (LAS). A few explants were not cut in the correct plane and, thus, showed an absence of incisor growth or abnormal orientation of bud and were discarded from representation and analysis.
Oil droplet injection and imaging
Mandibular incisor bud slices of correctly staged embryos were dissected and mounted in 2% low melt agarose mixed with an equal volume of rat serum (Valley Biomedical no. AS3061SC) in glass-bottom Delta T dishes (Bioptechs no. 04200417C) and kept in the culture medium mentioned in ‘Explant culture and experiments’ section. The tooth bud epithelium was injected with oil microdroplets with controlled bulk fluorescence and calibrated interfacial tension26 using a pressure-controlled microinjector. Briefly, oil droplets were generated in a similar way as previously described29. A 3-M Novec 7700 fluorocarbon oil containing a 2% (w/w) concentration of fluorinated Krytox-PEG (600) surfactant (008-fluorosurfactant, RAN Biotechnologies), as well as a custom-synthesized fluorinated rhodamine dye62 at a final concentration of 25 μM, was injected directly in the tissue using a pressure-controlled microinjector. Droplet size (approximately 40 μM in diameter) was controlled by modulating the injection pressure and the injection pulse time. The interfacial tension of the droplet was measured using a pendant drop tensiometer (Theta Lite, Biolin Scientific), as previously described63. After injection, tooth buds were allowed to recover at 37 °C, 5% CO2 for 3–4 h and then imaged for a period of 4–5 h at 1 h intervals using the Nikon A1r multiphoton microscope (NIS Elements software) to capture the drop volume in maximum resolution Z-stacks. During the period of imaging, the tooth buds were maintained at a temperature of 37 °C using stage and objective heater equipment (Bioptechs nos. 0420-4 and 150819-13) with a continuous perfusion of the culture medium (Bioptechs no. 0420131616).
Measurement of anisotropic stresses
The 3D images of oil microdroplet injected tooth buds were processed using the STRESS code developed at the Campas laboratory27,64. The software allows automated, accurate 3D reconstructions of the droplets in live tissues and measurement of tissue and cellular stresses over time. For the representative microdroplet, the tissue and cellular level of stresses were plotted on the 3D surface reconstruction of the microdroplet using the Paraview software (version 5.10). Two E12 and three E13.5 droplets (Fig. 2) and one 30 h control and two 30 h aphidicolin droplets (Fig. 3) were incompletely imaged or could not be imaged owing to improper embedding in agarose and were discarded from representation and analysis.
Orientation vector field analysis
A confocal section of the incisor epithelium ± mesenchyme with either the membrane signal (K14Cre–eGFP) or nuclear signal (H2B-mKate2) was first cropped based on three reference points: point 1, 2 and 3 (Extended Data Fig. 3b). To ensure a consistent tissue orientation, the original image was rotated and then cropped such that the reference point 1 and 2 are on the horizontal axis when required. For the membrane labelled images, the region outside the tooth bud tissue, including the top ectoderm and the basement membrane, was removed to eliminate any biases in the orientation analysis. Since basal cells are polarized columnar cells, their anisotropy is informed by their polarization and attachment to the basement membrane. Therefore, the different mechanical constraints of this cell layer would not be representative of the global pattern of anisotropy generated by supracellular stresses in the tissue. The OrientationJ FIJI plugin was utilized to compute the orientation vector field for each individual sample. Grid size and local window size were set to approximately two and three times the typical cell size, respectively. For each condition, the spatial average of the orientation map was obtained by normalizing body axes. The X-axis was normalized by the horizontal distance between the position 1 and 2, and the Y-axis by the vertical distance between the position 1 and 3. The analysis was done on E13.5 incisors in three planes: central, top and bottom (spanning a distance of 30 μm in Z) to analyse the nuclear orientation pattern in 2.5D. To check the validity of the OrientationJ analysis, we performed membrane segmentation in representative images using the membrane segmentation software, EpySeg65, from both a E12 incisor and from a E13.5 incisor (Extended Data Fig. 2a,b). For the cell aspect ratio analysis, cells with sizes less than 100 pixels were excluded, as these cells mostly come from the segmentation artifacts. An in-house MATLAB code was used to compute aspect ratio, cell orientation and cell centre for individual cells. An orientation map was then generated by plotting individual cell anisotropy as a line along its orientation with its length proportional to aspect ratio. To obtain anisotropy at supracellular scales, we performed spatial averaging of cell anisotropy with a radius of approximately 2.5 times of cell size, which was comparable to the local window size that we used for the OrientationJ analysis. We confirmed that the measurement obtained by OrientationJ at supracellular scales quantitatively agreed with that obtained by the segmentation analysis. This showed that the observed anisotropy pattern is consistent for different analysis methods. The images that were below the quality of analysis by OrientationJ and subsequent codes were discarded from representation and analysis.
Orientation analysis in 3D
To quantify the structural anisotropy in 3D, we used the surfaces module in Imaris x64 9.3.1 to reconstruct the nuclei (H2B-mKate2) from 3D Z-stacks of the incisor region of E13 embryos. We first performed 3D deconvolution using the software HuygensPro to improve the image quality. After deconvolution, created a binary mask using Cellpose. The binary mask was then used in the Surfaces module of Imaris to reconstruct the nuclei as 3D objects. During object creation, a diameter size restriction of 5 μm was placed to properly separate nuclei. The resulting reconstruction was then separated into three sections in Z to allow a better visualization of the nuclear anisotropy at different tissue depths: top (41–55 μm), middle (41 to 25 μm) and bottom (25 to 3 μm).
Microdroplet orientation maps
Using the local cell orientation and a critical coherence threshold value, we divided the epithelium into regions of LC in tissue anisotropy (low-to-no anisotropy, often close to the centre of the circular pattern) and HC in tissue anisotropy (high circular anisotropy regions; Fig. 2d,e and Extended Data Fig. 3c). To probe the alignment between the droplet and the cell, an interpolation function of the cell orientation map was first computed based on the average orientation values at grid positions. Using the interpolation function, the expected cell orientation at the droplet location (represented by point 4 in Extended Data Fig. 3b) was computed, and with this, the ψ between the droplet orientation and the cell orientation was calculated for each droplet. The droplet centre coordinates were then plotted on the average cell orientation vector field map with each oval representing one injected droplet orientation and the colour bars denoting the cos2ψ values as indicated in the figures. For all figures, images that were below the quality of analysis by OrientationJ and subsequent codes were discarded from representation and analysis.
Epithelium separation with dispase
E13.5 and E14.5 mandibles were incubated in 2.5% dispase II (Sigma no. D4693) solution in Ca2+/Mg2+ free DPBS at 37°C for 30–45 min to allow the epithelium to be gently separated from the mesenchyme with sharp forceps without damaging it, cleared for 24 h at room temperature (RT) with the X-clarity electrophoretic tissue clearing solution (Logos biosystems no. C13001), mounted using 1 mm spacers and imaged on the Zeiss LSM900 confocal microscope. The repeats were also mounted in 0.5% low melt agarose to compare with the mounted tissue. The cell and tissue morphology looked similar, but the image quality was poor and, thus, not shown.
Immunohistochemistry and RNAscope
For immunostaining, correctly staged embryos were fixed in 4% PFA O/N at 4 °C or 2 h at RT and processed for staining. Embryo heads were dehydrated and mounted in paraffin and blocks were sectioned on the microtome to obtain 10-μm thickness slices. To characterize actin, paraffin sections were incubated with Alexa647-conjugated phalloidin (Invitrogen no. A22247, 1:400). The antigen retrieval was performed on rehydrated paraffin sections with 10mM citrate acid/2 mM EDTA for 30 min in a pressure cooker before immunostaining with anti-E-cadherin (BD Biosciences no. 610181, 1:200) or anti-P21 (BD Biosciences no. 556431, 1:200) primary antibodies. Biotinylated secondary antibody (Vector Biolabs no. BA-9200, 1:250) and TSA kit (Akoya no. SAT705A001EA, 1:500) was used for signal amplification for P21. For YAP and pMyoII LC staining, explants were fixed in 4% PFA O/N at 4 °C followed by saturation in 30% sucrose at 4 °C and embedded in a 1:1 mix of 30% sucrose:OCT (optimal cutting temperature compound used as cryo-embedding medium). Blocks were sectioned on the cryotome to obtain 10-μm thickness slices. Sections were incubated O/N at 4 °C with the anti-YAP antibody (AbClonal no. A1002, 1:50) or the anti-pMyoII LC antibody (Abcam no. ab2480, 1:200) at 4 °C. For all immunostainings, the secondary antibodies used were Alexa Fluor 488 conjugated anti-rabbit (Thermo Fischer no. A11008, 1:300), Alexa Fluor 647-conjugated anti-rabbit (Thermo Fischer no. A21244, 1:300) or Alexa Flour 647-conjugated anti-Mouse IgG (Thermofisher Scientific, no. A21237, 1:300). All sections were mounted using VectaShield (no. H1700) or ProLong Gold (no. P36930) and imaged on the Zeiss LSM900 or the Nikon A1r confocal microscope
For RNAscope, cultured incisors were fixed for 24 h in 4% PFA, equilibrated with 30% sucrose and then embedded in 30% sucrose:OCT (cryo-embedding medium). The blocks were sectioned on the cryotome to obtain 10-μm-thick slices. Initial processing differed from the standard protocol: post-fixation for 10 min 4% PFA at 4 °C, followed by dehydration and H202 treatment, 5 min antigen retrieval and 30 min protease step. For paraffin slices, the standard RNAscope protocol was followed on tissue fixed at RT for 24 h. The probes that were used included Shh (probe no. 314361), Pax9 (probe no. 454321), Bmp4 (probe no. 401301), Wnt10a (probe no. 401061) and Piezo1 (probe no. 500511). Co-staining for E-cadherin and P21 was done following the RNAscope steps without any additional antigen retrieval step. All RNAscope protocols are available online. Sections were imaged on the Leica Dmi8 microscope (LAS).
Cell proliferation analysis
To analyse the proliferating cells, pregnant females (wild type or Ctnna1cKO at the mentioned stages) were injected with appropriate volumes of EdU (25 μg gm−1) 1 h before euthanasia or combinatorial EdU (25 μg gm−1) 1 h and BrdU (50 μg gm−1) 15 min before euthanasia. Correctly staged embryos were fixed, and dissected mandibles were mounted in 4% low melt agarose and sectioned on the vibratome to obtain 90-μm-thick slices. For whole mounts, E13.5 mandibles were embedded in 4% low melt agarose and manually dissected to obtain entire incisor explants. This was followed by incubation in X-Clarity clearing solution for 48 h. EdU staining was then performed on agarose slices or whole explants with Click-iT EdU (Invitrogen no. C10640). The cultured tooth bud slices from various explant culture conditions were incubated with 10 μg ml−1 BrdU or 5 μg ml−1 EdU for 1 or 2 h before termination and fixed in 4% PFA O/N at 4 °C. For only EdU, fixed explants were saturated with 30% sucrose at 4 °C, embedded in a 1:1 mix of 30% sucrose:OCT. Blocks were sectioned on the cryotome to obtain 10-μm-thick slices. The Click-iT EdU kit was used for the staining. For EdU/BrdU combinatorial staining, paraffin sections were obtained and processed in the same manner as for immunostaining. An additional denaturation with 2 N HCl for 1 h at room temperature was done before immunostaining with anti-BrdU (Novus MoBu-1 no. NB500-439, 1:200) and Alexa Fluor 555-conjugated secondary antibody (Thermo Fischer no. A21422, 1:300). All Paraffin/cryo sections were mounted as above. Agarose slices were mounted using spacers (Grace bio-labs no. 654002) and imaged with the Zeiss LSM900 (Zen software – Ver 3.4.91.00000) or the Leica Dmi8 (LAS) confocal microscope. For quantification, EdU channel was converted to greyscale, manually thresholded followed by counting particles in the entire frame. To quantify the proliferation profiles around the EK for each sample, the EK centre at stages E14.5–15.5 (or an estimated centre of the proliferation zone for E11.5–12.5) was manually marked. From these centre positions, the Euclidean distance between the centre and every pixel was calculated and proliferation signals were then averaged in terms of distance by considering a 5-μm-thick annulus region at the given distance (radial averaging). For each developmental stage, proliferation signals were further averaged over three independent samples.
In situ hybridization
Both cultured and uncultured incisor bud slices dissected from correctly staged embryos were fixed in 4% PFA O/N at 4 °C. In situ hybridization was performed as published66 with minor modifications. The Shh probe25 was co-stained with mouse anti-E-Cadherin antibody (BD Biosciences no. 610181, 1:200). The bud slices were mounted in 0.2% Agarose/PBS and imaged with the Zeiss LSM 900 (Zen software) or Leica Dmi8 (LAS) confocal microscope.
Measuring relative distance of EK from tissue centre and EK area
The incisor explants were imaged after in situ hybridization for Shh, followed by manual outlining of the whole tissue, the incisor region and the Shh expression region in the images using FIJI. Using the outlined images, the whole tissue region and the Shh expression region were segmented separately by a custom MATLAB code. The centres as well as the area of each segmented region were computed accordingly in MATLAB (Extended Data Fig. 5f). The Euclidean distance between the tissue centre and the EK centre (the centre of the Shh expression region) was measured and then normalized by the characteristic length scale, defined as the square root of the whole tissue region area. To plot the relative area graphs, the area of the manually outlined Shh-expressing region and the incisor were measured using FIJI and used to calculate the relative area by dividing Shh area/incisor area for each condition.
Statistics and reproducibility
The number of oil droplets/tooth buds/embryos measured for each experiment are indicated in the figure legend. No statistical tests were done to pre-determine sample size, but our sample sizes are similar to those reported in previous publications25,26,29. The embryos were weighed to ensure that the correctly staged ones were used as required for experiments. The correctly staged embryos were then randomly used for planned experiments. The data collection was not performed blind to the conditions of the experiments, since specific weights and genotypes were required. The analysis of the images was performed blind.
All graphs were plotted using the Graphpad Prism software. Error bars denote the mean ± standard error of mean. Statistical significance measurements have been done using the unpaired two-tailed Student’s t test (assuming unequal variance) with Welch’s correction for drop orientation analysis; EdU quantification for blebbistatin treatment and aphidicolin treated and washed samples; two-way analysis of variance (ANOVA) for the E12 and E13.5 tissue stress and 40 h aphidicolin treatment bud size measurements; two-tailed Mann–Whitney U test for tissue stress after aphidicolin treatment, remaining bud size measurements and Shh expression quantification; and one-way ANOVA with Bonferroni’s correction for multiple comparisons for YAP signal intensity, EK localization and area measurements and EdU positive cell quantification. The data distribution is shown on plots with n < 10 and individual data points for all plots are available in the source datasheet. The data distribution was assumed to be normal but this was not formally tested.
Extended Data
Extended Data Fig. 1 ∣. A concentric cellular arrangement develops around the EK in the embryonic mouse incisor.
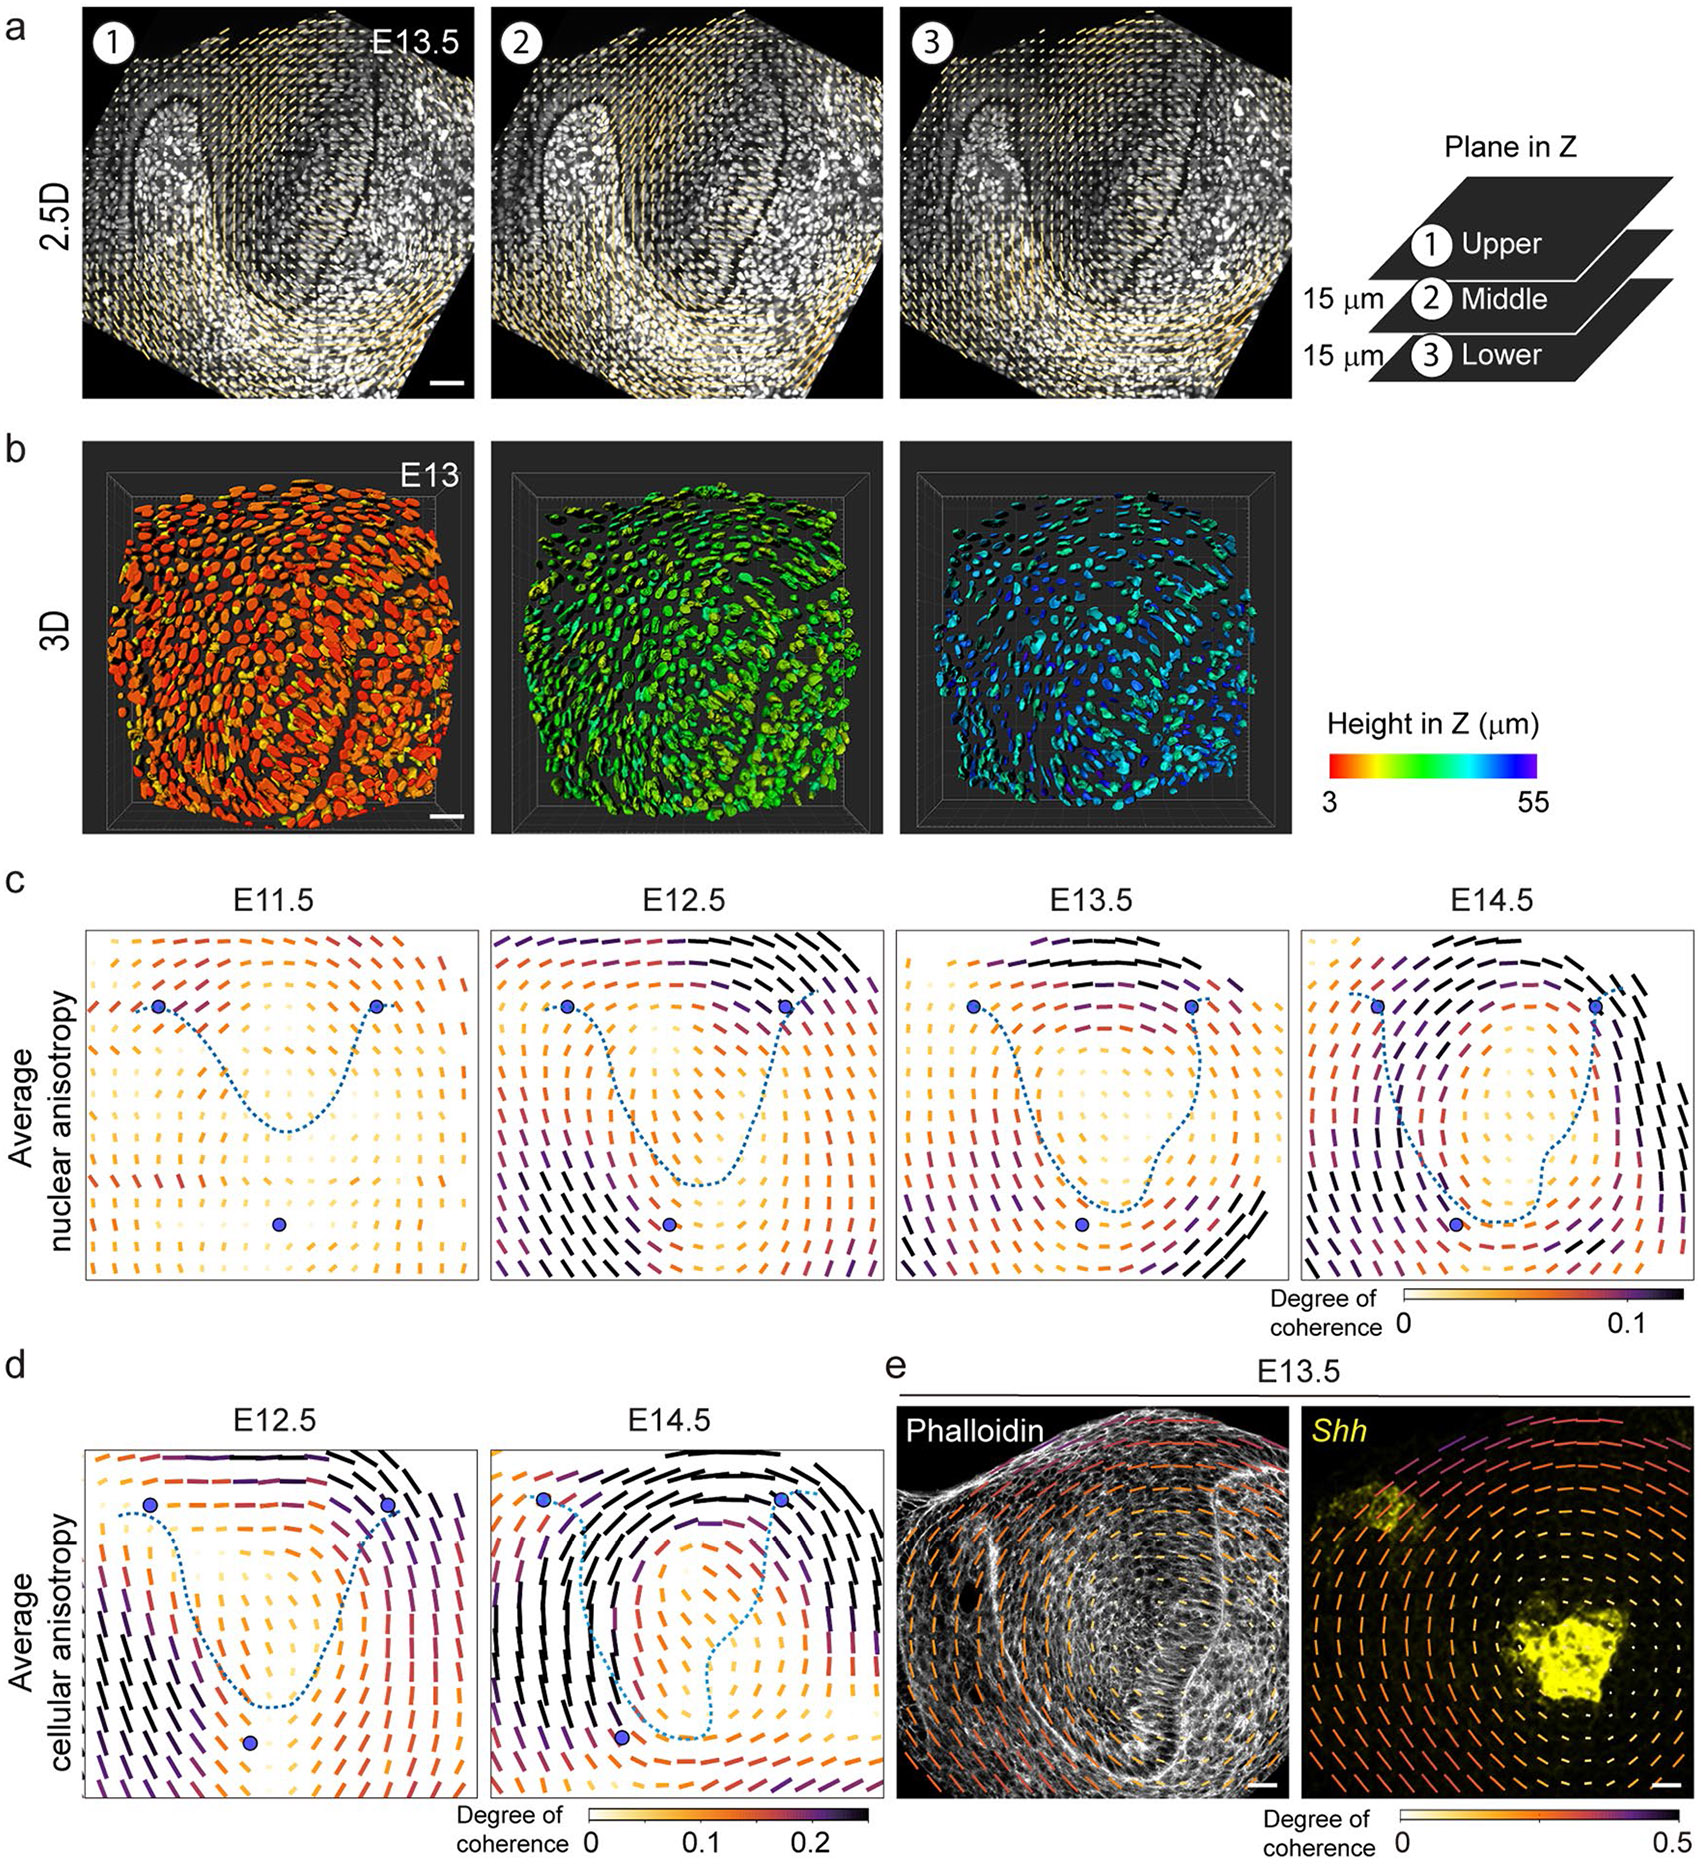
(a) Analysis of 2.5D nuclear orientation in representative images using OrientationJ in 3 confocal slices 15 μm apart in Z from a E13.5 incisor. (n = 1) (b) 3D analysis of nuclear orientation in representative images using Imaris nuclear segmentation of top, middle and bottom planes of a 52 μm thick Z-stack from a E13 incisor. (n = 1) (c) Average quantification of nuclear anisotropy in E11.5 through E14.5 incisor epithelia as shown in Fig. 1f using OrientationJ analysis (n = 4; Methods). (d) Average quantification of cytoskeletal anisotropy in E12.5 and E14.5 incisor epithelia as shown in Fig. 1g using OrientationJ analysis (n = 3). (e) Representative tissue anisotropy analysis (anisotropy in actin spatial distribution) of E13.5 Phalloidin stained bud and the overlay of the E13.5 Shh RNAscope image (from Fig. 1d) on the map. Scale bar, 25 μm. Data are represented as mean ± s.e.m. n represents number of embryos; one incisor measured per embryo.
Extended Data Fig. 2 ∣. OrientationJ and Epyseg analysis of incisors in 2D.
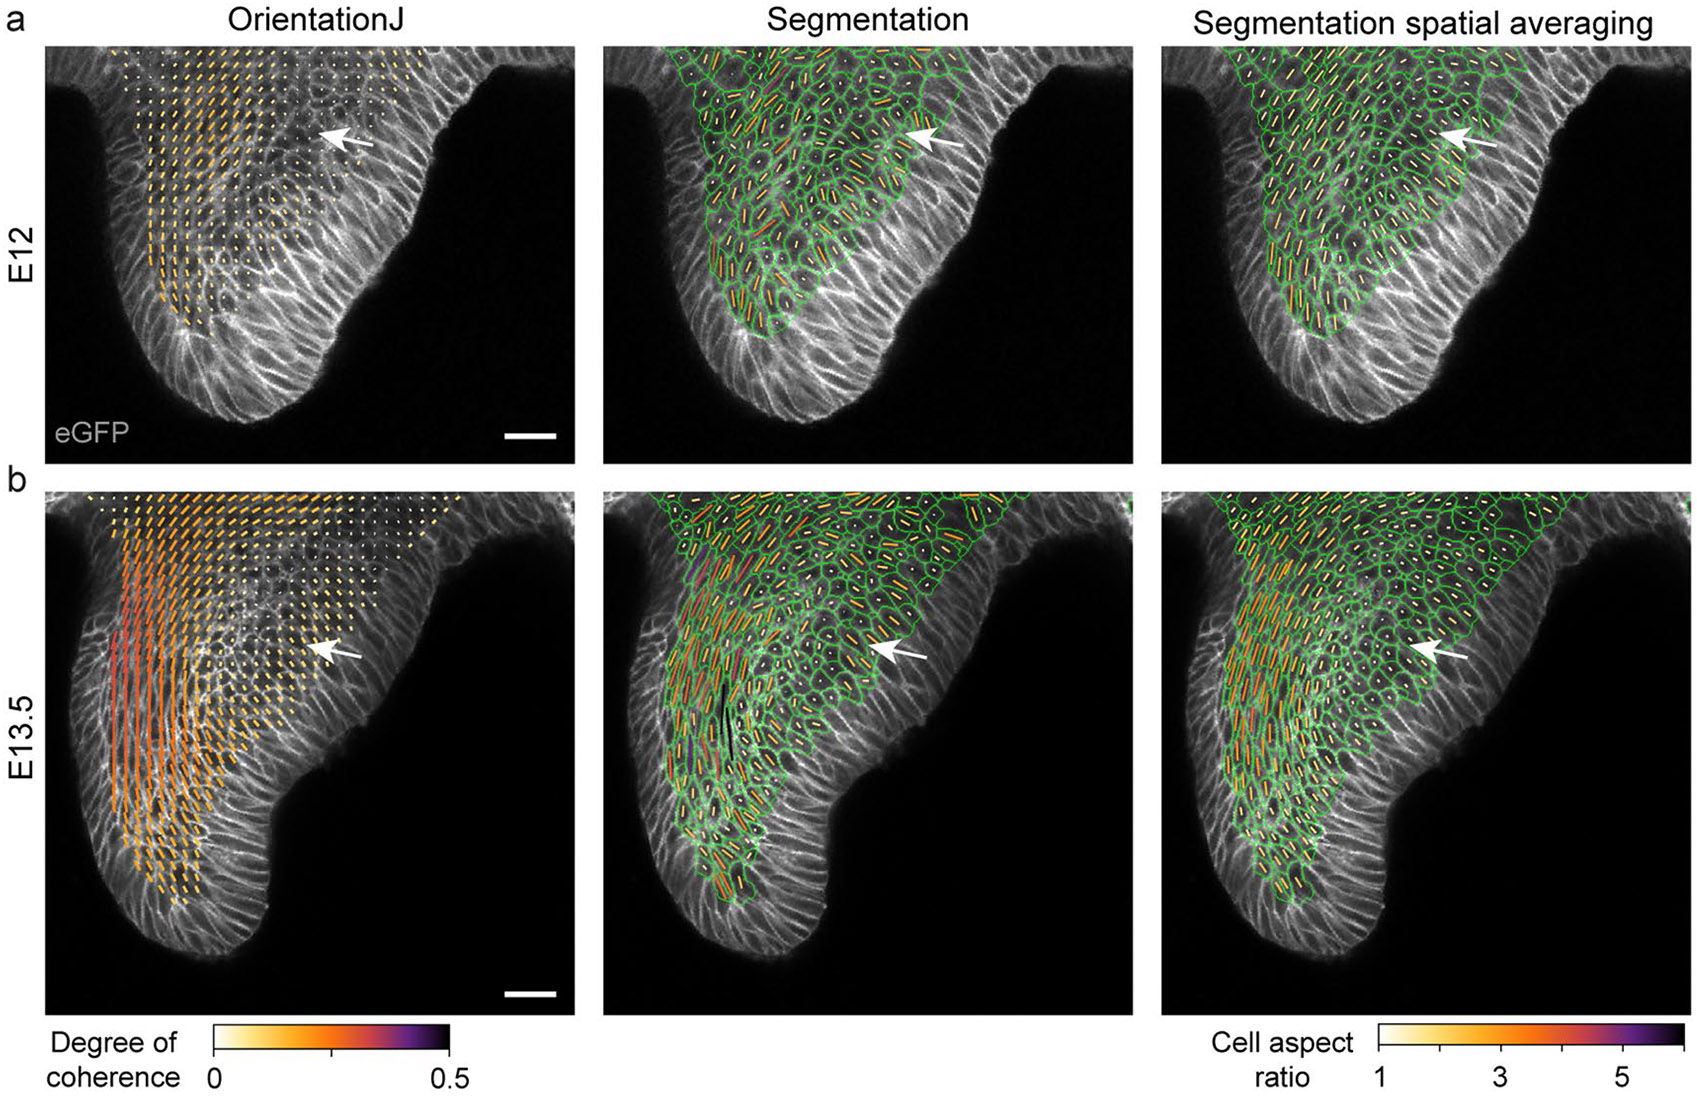
(a-b) OrientationJ and Epyseg analysis of representative (a) E12 and (b) E13.5 K14Cre;R26mTmG/mTmG incisors with the spatial averaging of the Epyseg analysis on the right (n = 1 per stage). White arrows indicate the low coherence region. Representative 2D central plane shown. Scale bar, 25 μm. n represents number of embryos; one incisor measured per embryo.
Extended Data Fig. 3 ∣. Inhibition of acto-myosin activity does not interfere with anisotropic stress mediated development of EK formation.
(a) Schematic depicting the dissection, agarose embedding, injection of oil microdroplets, and imaging of the incisor. The image of the embryo and the microscope have been obtained from Biorender.com. (b) Outline of E13.5 incisor with reference points 1–3 illustrating the marker locations on the border and point 4 illustrating the oil droplet for vector field and microdroplet orientation analysis. (c) Anisotropy analysis of the live E12 and E13.5 murine incisor. (E12: n = 6 and E13.5: n = 6). (d) Representative E14.5 incisor epithelium separated from the mesenchyme after 45 mins dispase treatment. (n = 3) (e) EdU and E-Cad immunostaining after a 1 h EdU pulse chase in E12 murine incisors cultured with DMSO or blebbistatin for 40 h. Quantification of total EdU positive cells in each field per condition for all incisors. (Control: n = 7; Blebbistatin: n = 7) (f) Whole mount in situ of Shh and E-Cad immunostaining in E12 incisors cultured for 40 h with DMSO or Y27632 (ROCK inhibitor). (DMSO: n = 5; Y27632: n = 5). Scale bar, 25 μm. Dashed line outlines the incisor. Representative 2D central plane shown in all images. Data are represented as mean ± s.e.m. Statistical analysis was done using the unpaired two-tailed Student’s T test (assuming unequal variance) with Welch’s correction for e. n represents number of embryos; one incisor measured per embryo.
Extended Data Fig. 4 ∣. Inhibiting cell proliferation in the embryonic murine incisor interferes with incisor growth and anisotropic stress development.
(a) Measured proliferation profiles from the centre in the epithelium at E11.5, 12.5, 14.5 and 15.5. (Mean values plotted from n = 3 per stage). (b) EdU and eGFP or BrdU and E-Cad immunostaining after a 1 h EdU or BrdU pulse chase in E12 murine incisors cultured with DMSO or Aphidicolin for 7 h (Top panel) and 40 h (Bottom panel). (n = 6 per condition) (c) Morphology of E12 incisors at 0 h and 40 h after culture with DMSO or aphidicolin. Dashed line outlines the incisor in (b, c). (Ctrl: n = 4, 6 and Aphi: n = 4, 6 for 0 and 40 hours respectively) (d) Quantification of the epithelial area (outlined in yellow dotted line) from all the buds represented in c. (n values in c). (e, f) Anisotropy analysis of the live E12 murine incisors cultured for (e) 7 h or (f) 30 h with DMSO or aphidicolin. (7 h – n = 5; 30 h - n = 3) (g) Representation of droplet orientation and cell anisotropy (orientation) maps (reproduced from Fig. 3c, c’) and quantification of droplet orientation with reference to the regional cell orientation in live 7 h DMSO or aphidicolin treated incisors. Compilation of average data from 3–6 h after injection. Orientation angle values for DMSO treated incisors reproduced from Fig. 2f E12 data. (Ctrl: n = 15 in LC and n = 14 in HC; Aphi: n = 13 in LC and n = 15 in HC) LC, low coherence region; HC, high coherence region. (h) Quantification of the tissue stress anisotropy measured by the oil droplets in the LC region of E12 incisors cultured for 7 hours with DMSO or aphidicolin (Ctrl: n = 15 from 2 h; Aphi: n = 13). Dashed line outlines the incisor. Scale bars, 25 μm. epi, epithelium; mes, mesenchyme. Representative 2D central plane shown in all images. Data are represented as mean ± s.e.m. Statistical analysis was done using 2 way ANOVA for d, unpaired two-tailed Student’s T test (assuming unequal variance) with Welch’s correction for g and 2 tailed Mann-Whitney test for h. Source data are available for all plots. n represents number of embryos; one incisor measured per embryo.
Extended Data Fig. 5 ∣. Cell proliferation increases compressive stress and area of the embryonic murine incisor.
(a) Whole mount in situ of Shh and E-Cad immunostaining in E12 incisors cultured for 40 h with DMSO or Mitomycin C. (n = 4 per condition) (b) BrdU-EdU double labelling in the E13.5 murine incisor after sequential pulse chase with EdU (1 h) – BrdU (15 mins). (n = 5) (c) Morphology of E12 incisors at 40 h after culture in DMSO or aphidicolin or aphidicolin washed out after 16 h. (Ctrl: n = 6; Aphi: n = 4; Aphi wash: n = 6) (d) Quantification of the area from all the buds represented in (a). (e) Whole mount in situ of Shh and E-Cad immunostaining in E13 incisors cultured for 40 h with DMSO or aphidicolin. (n = 3 per condition). Dashed line outlines the incisor. Scale bar, 25 μm. epi, epithelium; mes, mesenchyme. Representative 2D central plane shown in all images. Data are represented as mean ± s.e.m. Statistical analysis was done using the 2 tailed Mann-Whitney test for d. n represents number of embryos; one incisor measured per embryo.
Extended Data Fig. 6 ∣. Dextran-induced compression regulates incisor area and EK localization.
(a) Images showing the morphology of E12 incisor buds treated with DMSO or aphidicolin for 40 h with varying concentrations of dextran (30 mg/ml and 60 mg/ml). (b) Quantification of the area (outlined in yellow dashed lines) from all the buds represented in (a) (Ctrl: n = 3, 5 and 4 and Aphi: n = 5, 5 and 5 for Dextran 0, 30 and 60 mg/ml respectively). (c) EdU and E-Cad immunostaining after a 2 hour EdU chase in E12 incisors cultured for 40 h with DMSO or dextran (30 mg/ml). Quantification of EdU positive cells from these and incisors cultured in DMSO, or 30, 60, 80 mg/ml dextran. (n = 6, 5, 4 and 4 respectively) (d) Representative images of E12 mandible explants cultured for 40 h with DMSO or aphidicolin + dextran (30 mg/ml) (n = 6 and 5 respectively). Explants are outlined in red with the center marked by a red dot. Quantification of the relative distance of the EK from the center of the tissue in E12 incisors cultured with DMSO or aphidicolin with 30 or 60 mg/ml dextran. (n = 6, 5, 5 and 5 respectively) (e) Quantification of relative area of Shh expression to incisor area in E12 incisors cultured with DMSO or aphidicolin with 30 or 60 mg/ml dextran. (n = 7, 6, 6 and 5 respectively). Dashed line outlines the incisor. epi, epithelium; mes, mesenchyme. Scale bar, 25 μm. Representative 2D central plane shown in all images. Data are represented as mean ± s.e.m. Statistical analysis was done using the 2 tailed Mann-Whitney test for b and 1 way ANOVA with Bonferroni’s correction for multiple comparisons for c, d and e. n represents number of embryos; one incisor measured per embryo.
Extended Data Fig. 7 ∣. The expression patterns of EK markers Bmp4 and Wnt10a are affected by compressive stress.
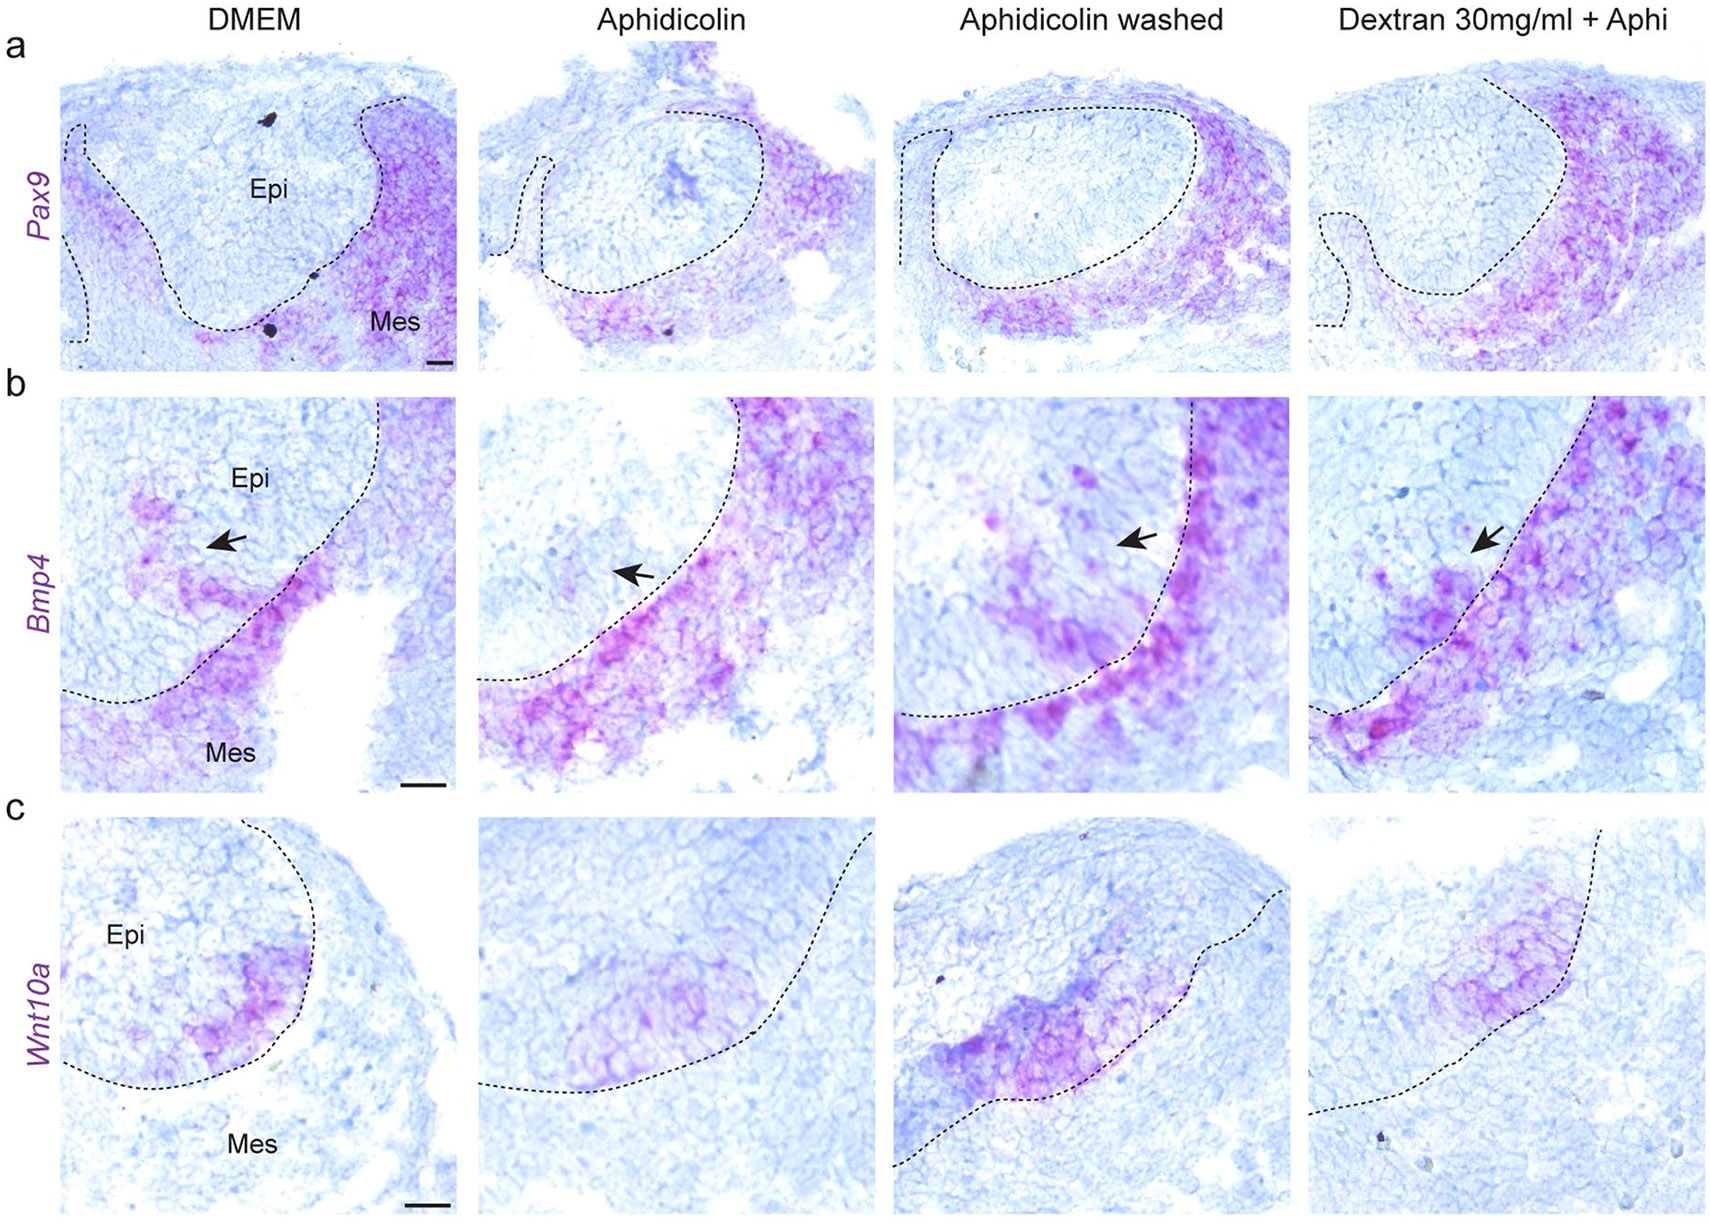
(a, b, c) RNAscope for (a) Pax9, (b) Bmp4 and (c) Wnt10a in E12 incisors after 40 h culture with DMSO, aphidicolin throughout, aphidicolin washed out after 16 h (Aphi wash) or aphidicolin + 30 mg/ml dextran throughout (Dxt 30 mg/ml + Aphi) (n = 3). Dashed line outlines the incisor. epi, epithelium; mes, mesenchyme. Representative 2D central plane shown in all images. Scale bar, 25 mm. n represents number of embryos; one incisor measured per embryo.
Acknowledgements
We thank D. Cuylear, P. Marangoni, A. Rathnayake, B. Hoehn and A. Cortez for technical support, E. Sletten (University of California Los Angeles) for sharing custom-made fluorinated rhodamine dyes and Klein and Campas laboratory members for helpful discussions. We acknowledge the staff within the Biological Imaging Development CoLab at UCSF Parnassus Heights, especially K. Marchuk and J. Eichorst, for their training and support in using the Nikon A1r and the NIS Elements software. We also thank the Laboratory Animal Resource Center, UCSF for assistance with animal care. Funding has been obtained from the National Institute of Dental and Craniofacial Research grant R01-DE027620 (O.D.K. and O.C.), R35-DE026602 (O.D.K.) and the Deutsche Forschungsgemeinschaft (German Research Foundation) under Germany’s Excellence Strategy – EXC 2068 – 390729961– Cluster of Excellence Physics of Life of TU Dresden (O.C.).
Footnotes
Reporting summary
Further information on research design is available in the Nature Portfolio Reporting Summary linked to this article.
Competing interests
The authors declare no competing interests.
Extended data is available for this paper at https://doi.org/10.1038/s41556-024-01380-4.
Supplementary information The online version contains supplementary material available at https://doi.org/10.1038/s41556-024-01380-4.
Online content
Any methods, additional references, Nature Portfolio reporting summaries, source data, extended data, supplementary information, acknowledgements, peer review information; details of author contributions and competing interests; and statements of data and code availability are available at https://doi.org/10.1038/s41556-024-01380-4.
Data availability
The data supporting the findings of this study are all available within the article. All other data supporting the findings of this study are available from the corresponding authors. Source data are provided with this paper.
Code availability
The 3D images of oil microdroplet injected tooth buds were processed using the STRESS code developed at the Campas lab27 (https://github.com/campaslab/STRESS). No other custom codes were used.
References
- 1.Lecuit T & Le Goff L Orchestrating size and shape during morphogenesis. Nature 450, 189–192 (2007). [DOI] [PubMed] [Google Scholar]
- 2.Gilmour D, Rembold M & Leptin M From morphogen to morphogenesis and back. Nature 541, 311–320 (2017). [DOI] [PubMed] [Google Scholar]
- 3.Gurdon JB & Bourillot PY Morphogen gradient interpretation. Nature 413, 797–803 (2001). [DOI] [PubMed] [Google Scholar]
- 4.Spemann H & Mangold H Induction of embryonic primordia by implantation of organizers from a different species. 1923. Int. J. Dev. Biol 45, 13–38 (2003). [PubMed] [Google Scholar]
- 5.De Robertis EM, Larraín J, Oelgeschläger M & Wessely O The establishment of Spemann’s organizer and patterning of the vertebrate embryo. Nat. Rev. Genet 1, 171–181 (2000). [DOI] [PMC free article] [PubMed] [Google Scholar]
- 6.Boettger T, Knoetgen H, Wittler L & Kessel M The avian organizer. Int. J. Dev. Biol 45, 281–287 (2003). [PubMed] [Google Scholar]
- 7.Balcuns A, Gasseling MT & Saunders JW Spatio-temporal distribution of a zone that controls antero-posterior polarity in the limb bud of the chick and other bird embryos. Am. Zool 10, 323 (1970). [Google Scholar]
- 8.Nakamura H & Watanabe Y Isthmus organizer and regionalization of the mesencephalon and metencephalon. Int. J. Dev. Biol 49, 231–235 (2003). [DOI] [PubMed] [Google Scholar]
- 9.Jernvall J, Kettunen P, Karavanova I, Martin LB & Thesleff I Evidence for the role of the enamel knot as a control center in mammalian tooth cusp formation: non-dividing cells express growth stimulating Fgf-4 gene. Int. J. Dev. Biol 38, 463–469 (2002). [PubMed] [Google Scholar]
- 10.Jernvall J, Åberg T, Kettunen P, Keränen S & Thesleff I The life history of an embryonic signaling center: BMP-4 induces p21 and is associated with apoptosis in the mouse tooth enamel knot. Development 125, 161–169 (1998). [DOI] [PubMed] [Google Scholar]
- 11.Ahtiainen L, Uski I, Thesleff I & Mikkola ML Early epithelial signaling center governs tooth budding morphogenesis. J. Cell Biol 214, 753–767 (2016). [DOI] [PMC free article] [PubMed] [Google Scholar]
- 12.Yu W. et al. Pitx2–Sox2–Lef1 interactions specify progenitor oral/dental epithelial cell signaling centers. Development 147, dev186023 (2020). [DOI] [PMC free article] [PubMed] [Google Scholar]
- 13.Alexander P & Wassef M The isthmic organizer links anteroposterior and dorsoventral patterning in the mid/hindbrain by generating roof plate structures. Development 130, 5331–5338 (2003). [DOI] [PubMed] [Google Scholar]
- 14.Mitsiadis TA, Graf D, Luder H, Gridley T & Bluteau G BMPs and FGFs target Notch signalling via jagged 2 to regulate tooth morphogenesis and cytodifferentiation. Development 137, 3025–3035 (2010). [DOI] [PMC free article] [PubMed] [Google Scholar]
- 15.De Belly H, Paluch EK & Chalut KJ Interplay between mechanics and signalling in regulating cell fate. Nat. Rev. Mol. Cell Biol 23, 465–480 (2022). [DOI] [PubMed] [Google Scholar]
- 16.Du W, Kuang-Hsien Hu J, Du W & Klein OD Lineage tracing of epithelial cells in developing teeth reveals two strategies for building signaling centers. J. Biol. Chem 10.1074/jbc.M117.785923 (2017). [DOI] [PMC free article] [PubMed] [Google Scholar]
- 17.Thesleff I, Keränen S & Jernvall J Enamel knots as signaling centers linking tooth morphogenesis and odontoblast differentiation. Adv. Dent. Res 15, 14–18 (2001). [DOI] [PubMed] [Google Scholar]
- 18.Yu T & Klein OD Molecular and cellular mechanisms of tooth development, homeostasis and repair. Development 147, dev184754 (2020). [DOI] [PMC free article] [PubMed] [Google Scholar]
- 19.Depew MJ, Tucker AS & Sharpe PT Craniofacial Development. Mouse Development (eds Rossant J & Tam PPL) 421–498 (Elsevier, 2002). [Google Scholar]
- 20.Tucker AS et al. Edar/Eda interactions regulate enamel knot formation in tooth morphogenesis. Development 127, 4691–4700 (2000). [DOI] [PubMed] [Google Scholar]
- 21.Pispa J. et al. Cusp patterning defect in Tabby mouse teeth and its partial rescue by FGF. Dev. Biol 216, 521–534 (1999). [DOI] [PubMed] [Google Scholar]
- 22.Kassai Y. et al. Regulation of mammalian tooth cusp patterning by ectodin. Science 309, 2067–2070 (2005). [DOI] [PubMed] [Google Scholar]
- 23.Chen J, Lan Y, Baek JA, Gao Y & Jiang R Wnt/beta-catenin signaling plays an essential role in activation of odontogenic mesenchyme during early tooth development. Dev. Biol 334, 174–185 (2009). [DOI] [PMC free article] [PubMed] [Google Scholar]
- 24.Nakatomi M. et al. Genetic interactions between Pax9 and Msx1 regulate lip development and several stages of tooth morphogenesis. Dev. Biol 340, 438–449 (2010). [DOI] [PubMed] [Google Scholar]
- 25.Li CY et al. αE-catenin inhibits YAP/TAZ activity to regulate signalling centre formation during tooth development. Nat. Commun 7, 1–13 (2016). [DOI] [PMC free article] [PubMed] [Google Scholar]
- 26.Campàs O. et al. Quantifying cell-generated mechanical forces within living embryonic tissues. Nat. Methods 11, 183–189 (2014). [DOI] [PMC free article] [PubMed] [Google Scholar]
- 27.Gross B, Shelton E, Gomez C & Campàs O STRESS, an automated geometrical characterization of deformable particles for in vivo measurements of cell and tissue mechanical stresses. Preprint at bioRxiv 10.1101/2021.03.26.437148 (2021). [DOI] [Google Scholar]
- 28.Shelton ER et al. Stress-driven tissue fluidization physically segments vertebrate somites. Preprint at bioRxiv 10.1101/2021.03.27.437325 (2021). [DOI] [Google Scholar]
- 29.Mongera A. et al. A fluid-to-solid jamming transition underlies vertebrate body axis elongation. Nature 561, 401 (2018). [DOI] [PMC free article] [PubMed] [Google Scholar]
- 30.Parada C. et al. Mechanical feedback defines organizing centers to drive digit emergence. Dev. Cell 57, 854–866.e6 (2022). [DOI] [PubMed] [Google Scholar]
- 31.Delarue M, Joanny JF, Jülicher F & Prost J Stress distributions and cell flows in a growing cell aggregate. Interface Focus 4, 20140033 (2014). [DOI] [PMC free article] [PubMed] [Google Scholar]
- 32.Banavar SP et al. Mechanical control of tissue shape and morphogenetic flows during vertebrate body axis elongation. Sci. Rep 11, 8591 (2021). [DOI] [PMC free article] [PubMed] [Google Scholar]
- 33.Montel F. et al. Stress clamp experiments on multicellular tumor spheroids. Phys. Rev. Lett 107, 188102 (2011). [DOI] [PubMed] [Google Scholar]
- 34.Mao Y. et al. Differential proliferation rates generate patterns of mechanical tension that orient tissue growth. EMBO J. 32, 2790–2803 (2013). [DOI] [PMC free article] [PubMed] [Google Scholar]
- 35.Dolega ME et al. Extra-cellular matrix in multicellular aggregates acts as a pressure sensor controlling cell proliferation and motility. eLife 10, e63258 (2021). [DOI] [PMC free article] [PubMed] [Google Scholar]
- 36.Delarue M. et al. Mechanical control of cell flow in multicellular spheroids. Phys. Rev. Lett 110, 138103 (2013). [DOI] [PubMed] [Google Scholar]
- 37.Dolega ME et al. Cell-like pressure sensors reveal increase of mechanical stress towards the core of multicellular spheroids under compression. Nat. Commun 8, 14056 (2017). [DOI] [PMC free article] [PubMed] [Google Scholar]
- 38.Lu X, Yang J, Zhao S & Liu S Advances of Wnt signalling pathway in dental development and potential clinical application. Organogenesis 15, 101–110 (2019). [DOI] [PMC free article] [PubMed] [Google Scholar]
- 39.Schlegelmilch K. et al. Yap1 acts downstream of α-catenin to control epidermal proliferation. Cell 144, 782–795 (2011). [DOI] [PMC free article] [PubMed] [Google Scholar]
- 40.Coste B. et al. Piezo1 and Piezo2 are essential components of distinct mechanically activated cation channels. Science 10.1126/science.1193270 (2010). [DOI] [PMC free article] [PubMed] [Google Scholar]
- 41.Kwon HJE, Li L & Jung HS Hippo pathway/Yap regulates primary enamel knot and dental cusp patterning in tooth morphogenesis. Cell Tissue Res 362, 447–451 (2015). [DOI] [PubMed] [Google Scholar]
- 42.Elosegui-Artola A. et al. Force triggers YAP nuclear entry by regulating transport across nuclear pores. Cell 171, 1397–1410. e14 (2017). [DOI] [PubMed] [Google Scholar]
- 43.Dupont S. et al. Role of YAP/TAZ in mechanotransduction. Nature 474, 179–184 (2011). [DOI] [PubMed] [Google Scholar]
- 44.Cheng C. et al. Yap controls notochord formation and neural tube patterning by integrating mechanotransduction with FoxA2 and Shh expression. Science 10.1126/sciadv.adf6927 (2023). [DOI] [PMC free article] [PubMed] [Google Scholar]
- 45.LeGoff L, Rouault H & Lecuit T A global pattern of mechanical stress polarizes cell divisions and cell shape in the growing Drosophila wing disc. Development 140, 4051–4059 (2013). [DOI] [PubMed] [Google Scholar]
- 46.Mammoto T et al. Mechanochemical control of mesenchymal condensation and embryonic tooth organ formation. Dev. Cell 21, 758–769 (2011). [DOI] [PMC free article] [PubMed] [Google Scholar]
- 47.Svandova E, Peterkova R, Matalova E & Lesot H Formation and developmental specification of the odontogenic and osteogenic mesenchymes. Front Cell Dev. Biol 8, 640 (2020). [DOI] [PMC free article] [PubMed] [Google Scholar]
- 48.Li J. et al. Mesenchymal Sufu regulates development of mandibular molars via Shh signaling. J. Dent. Res 98, 1348–1356 (2019). [DOI] [PubMed] [Google Scholar]
- 49.Hu JK et al. A FAK–YAP–mTOR signaling axis regulates stem cell-based tissue renewal in mice. Cell Stem Cell 21, 91–106 (2017). [DOI] [PMC free article] [PubMed] [Google Scholar]
- 50.Pincha N, Marangoni P, Haque A & Klein OD Parallels in signaling between development and regeneration in ectodermal organs. Curr. Top. Dev. Biol 149, 373–419 (2022). [DOI] [PMC free article] [PubMed] [Google Scholar]
- 51.van Soldt BJ & Cardoso WV Hippo-Yap/Taz signaling: complex network interactions and impact in epithelial cell behavior. Preprint at WIREs: Developmental Biology 10.1002/wdev.371 (2020). [DOI] [PMC free article] [PubMed] [Google Scholar]
- 52.Cotton JL et al. YAP/TAZ and Hedgehog coordinate growth and patterning in gastrointestinal mesenchyme. Dev. Cell 43, 35–47. e4 (2017). [DOI] [PMC free article] [PubMed] [Google Scholar]
- 53.Cong Q. et al. A self-amplifying loop of YAP and SHH drives formation and expansion of heterotopic ossification. Sci. Transl. Med 13, eabb2233 (2021). [DOI] [PMC free article] [PubMed] [Google Scholar]
- 54.Lettice LA et al. Opposing functions of the ETS factor family define Shh spatial expression in limb buds and underlie polydactyly. Dev. Cell 22, 459–467 (2012). [DOI] [PMC free article] [PubMed] [Google Scholar]
- 55.Tariki M et al. The Yes-associated protein controls the cell density regulation of Hedgehog signaling. Oncogenesis 3, e112 (2014). [DOI] [PMC free article] [PubMed] [Google Scholar]
- 56.Dassule HR, Lewis P, Bei M, Maas R & McMahon AP Sonic hedgehog regulates growth and morphogenesis of the tooth. Development 127, 4775–4785 (2000). [DOI] [PubMed] [Google Scholar]
- 57.Muzumdar MD, Tasic B, Miyamichi K, Li N & Luo L A global double-fluorescent Cre reporter mouse. Genesis 45, 593–605 (2007). [DOI] [PubMed] [Google Scholar]
- 58.Susaki EA et al. Whole-brain imaging with single-cell resolution using chemical cocktails and computational analysis. Cell 157, 726–739 (2014). [DOI] [PubMed] [Google Scholar]
- 59.Cahalan SM et al. Piezo1 links mechanical forces to red blood cell volume. Elife 4, e07370 (2015). [DOI] [PMC free article] [PubMed] [Google Scholar]
- 60.Woo SH et al. Piezo2 is required for Merkel-cell mechanotransduction. Nature 509, 622–626 (2014). [DOI] [PMC free article] [PubMed] [Google Scholar]
- 61.Alfaqeeh SA & Tucker AS The slice culture method for following development of tooth germs in explant culture. J. Vis. Exp 13, e50824 (2013). [DOI] [PMC free article] [PubMed] [Google Scholar]
- 62.Sletten EM & Swager TM Fluorofluorophores: fluorescent fluorous chemical tools spanning the visible spectrum. J. Am. Chem. Soc 136, 13574–13577 (2014). [DOI] [PMC free article] [PubMed] [Google Scholar]
- 63.Lucio AA et al. Spatiotemporal variation of endogenous cell-generated stresses within 3D multicellular spheroids. Sci. Rep 7, 1–11 (2017). [DOI] [PMC free article] [PubMed] [Google Scholar]
- 64.Aigouy B, Cortes C, Liu S & Prud’Homme B EPySeg: a coding-free solution for automated segmentation of epithelia using deep learning. Development 147, dev194589 (2020). [DOI] [PMC free article] [PubMed] [Google Scholar]
- 65.Zuniga E, Stellabotte F & Gage Crump J Jagged-Notch signaling ensures dorsal skeletal identity in the vertebrate face. Development 137, 1843–1852 (2010). [DOI] [PMC free article] [PubMed] [Google Scholar]
- 66.STRESS: Surface Topography Reconstruction for Evaluation of Spatiotemporal Stresses, Version 1. GitHub https://github.com/campaslab/STRESS (2021). [Google Scholar]
Associated Data
This section collects any data citations, data availability statements, or supplementary materials included in this article.
Data Availability Statement
The data supporting the findings of this study are all available within the article. All other data supporting the findings of this study are available from the corresponding authors. Source data are provided with this paper.
The 3D images of oil microdroplet injected tooth buds were processed using the STRESS code developed at the Campas lab27 (https://github.com/campaslab/STRESS). No other custom codes were used.