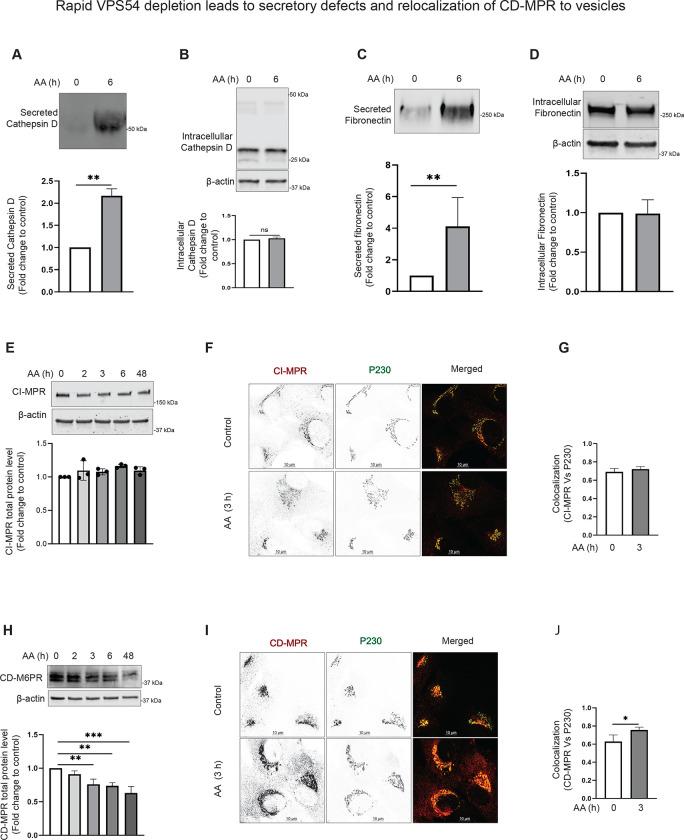
Figure 4: Acute VPS54 depletion causes secretory defects and relocalization of CD-MPR to vesicle.
(A) (Top panel) WB analysis of secreted Cathepsin D from RPE1 VPS54-mAID cells treated with AA for 0 h and 6 h respectively. (Bottom panel) Quantification of secreted Cathepsin D from three independent experiments. (B) WB analysis of the whole cell lysates from (A), probed with anti-Cathepsin D antibody. (Bottom panel) Quantification of intracellular Cathepsin D from three independent experiments. (C) (Top panel) WB analysis of the secreted Fibronectin from RPE1 VPS54-mAID cells treated with AA for 0 h and 6 h respectively. (Bottom panel) Quantification of secreted Fibronectin from three independent experiments. (D) WB analysis of the whole cell lysates from (C), probed with anti-Fibronectin antibody. (Bottom panel) Quantification of intracellular Fibronectin from three independent experiments. Statistical significance was assessed using paired t-test. ** p≤ 0.01. (E) (Top panel) WB analysis of RPE1 cells expressing VPS54-mAID, treated with AA for 0, 2, 3, 6, and 48 h respectively and probed with anti-CI-MPR antibody. (Bottom panel) Quantification of the blots from three independent experiments. (F) RPE1 VPS54-mAID expressing cells were treated with AA for 3 h and co-stained for CI-MPR and P230. (G) Colocalization of CI-MPR to P230 was calculated between control and 3 h AA treatment groups using Pearson’s correlation coefficient and graph was prepared in GraphPad prism. (H) (Top panel) WB analysis of RPE1 cells expressing VPS54-mAID treated with AA for 0, 2, 3, 6, and 48 h respectively and probed with anti-CD-MPR antibody. (Bottom panel) Quantification of the blots from three independent experiments. (I) RPE1 VPS54-mAID expressing cells were treated with AA for 3 h and cells were co-stained for CD-MPR and P230. (J) Colocalization of CD-MPR to P230 was calculated between the control and 3 h AA treatment groups using Pearson’s correlation coefficient and graph was prepared in GraphPad prism. Statistical significance was calculated using paired t-test. * p≤ 0.05

