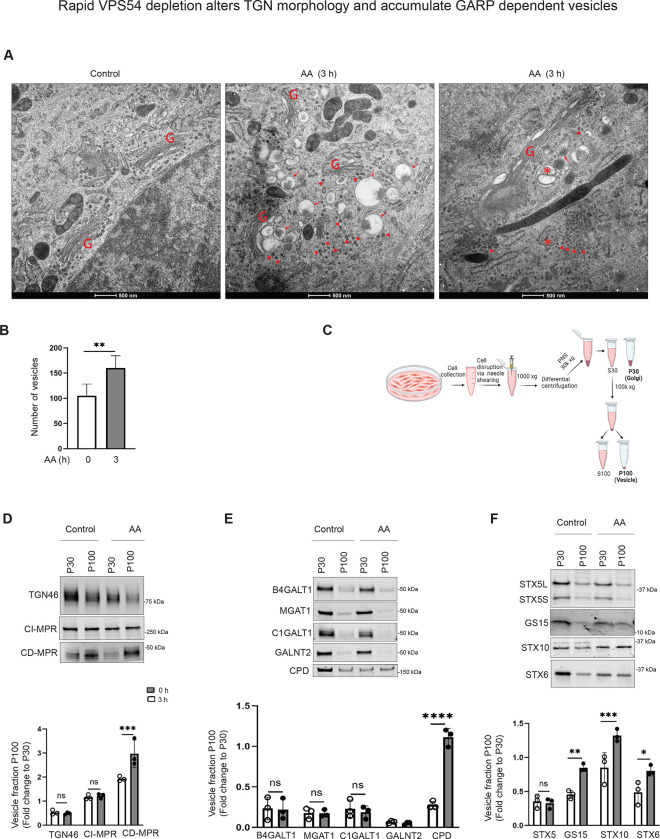
Figure 8: Rapid VPS54 depletion results in accumulation of GARP-dependent vesicles and alteration of TGN morphology.
(A) Transmission Electron Microscopy of high-pressure frozen RPE1 VPS54-mAID cells grown on sapphire discs before and after 3 h of AA treatment. “G” indicates Golgi stacks. Arrowheads pointed to vesicle-like structures. Arrows indicate the enlarged vacuolar structures accumulated near the Golgi. Asterisks indicate the autophagosomes. Scale bar, 500 nm. (B) The graph represents the quantification of total number of vesicles around the Golgi before and after 3 h of AA treatment. (C) Schematic of cellular fractionation experiment to prepare P30 (Golgi), and P100 (Vesicle) fractions from control and AA treated groups. (D) WB analysis of TGN localized proteins (TGN46, CI-MPR, and CD-MPR) in Golgi and vesicle fractions. (E) WB analysis of Golgi enzymes (B4GALT1, MGAT1, C1GALT1, GALNT2, and CPD) in Golgi and vesicle fractions. (E) WB analysis of SNAREs (STX5, GS15, STX10, STX6) in Golgi and vesicle fractions.

