

Abstract
Metabolic dysfunction-associated steatotic liver disease (MASLD) is a progressive disorder marked by lipid accumulation, leading to steatohepatitis (MASH). A key feature of the transition to MASH involves oxidative stress resulting from defects in mitochondrial oxidative phosphorylation (OXPHOS). Here, we show that pathological alterations in the lipid composition of the inner mitochondrial membrane (IMM) directly instigate electron transfer inefficiency to promote oxidative stress. Specifically, mitochondrial cardiolipin (CL) was downregulated with MASLD/MASH in mice and in humans. Hepatocyte-specific CL synthase knockout (CLS-LKO) led to spontaneous and robust MASH with extensive steatotic and fibrotic phenotype. Loss of CL paradoxically increased mitochondrial respiratory capacity but also reduced the formation of I+III2+IV1 respiratory supercomplex and interfered with the ability of coenzyme Q (CoQ) to transfer electrons to complex III. In turn, the bottleneck at complex III promoted electron leak primarily at site IIIQ0 as well as other upstream sites in the electron transport chain. Thus, reduction in mitochondrial CL promotes oxidative stress and contributes to pathogenesis of MASH.
Main
Metabolic dysfunction-associated steatotic liver disease (MASLD) is a growing global health concern with an increasing prevalence that parallels the rise in obesity.1 In the United States, annual medical costs related to MASLD exceed $103 billion.2 A large portion of patients with MASLD only exhibit steatosis, a silent and relatively benign early stage characterized by lipid accumulation in hepatocytes without hepatocellular inflammation.3 Steatosis can then progress to metabolic dysfunction-associated steatohepatitis (MASH), determined by hepatocyte injury and tissue fibrosis.4 MASH is the last stage of MASLD that may be reversible, making intervention at this stage particularly important.3,5 Although extensive clinical and basic research have been conducted in this field, the underlying mechanisms by which fatty liver transitions to MASH remain poorly understood.6–8
A defect in mitochondrial function is considered one of the hallmarks of MASLD progression in both mice and humans.9–12 MASLD is initially associated with an increase in mitochondrial respiratory capacity, followed by a subsequent impairment in oxidative phosphorylation (OXPHOS), and increased production of mitochondrial reactive oxygen species (ROS).11,13 Mitochondrial ROS is thought to be caused by an inefficient electron transport chain (ETC) that increases the propensity for electron leak. However, the mechanisms by which mitochondrial electron leak promotes MASLD are unknown.
Cardiolipin (CL) is a phospholipid with four acyl chains conjugated to two phosphatidylglycerol moieties linked by another glycerol molecule.14 CL resides almost exclusively in the inner mitochondrial membrane (IMM), constituting approximately 15–20% of the mitochondrial phospholipids.15 CL is synthesized by the condensation of phosphatidylglycerol (PG) and cytidine diphosphate-diacylglycerol (CDP-DAG) at the IMM via the enzyme cardiolipin synthase (CLS).16,17 Structural studies indicate that CL is essential for the activities of OXPHOS enzymes.18–22 In non-hepatocytes, decreased CL leads to compromised oxidative capacity,23,24 impaired membrane potential,25 and altered cristae morphology.26 In particular, low CL is associated with increased H2O2 production.27,28
In this manuscript, we set out to examine the changes in liver mitochondrial lipidome induced by MASH. In both mice and in humans, mitochondrial CL was downregulated in livers with MASLD/MASH compared to healthy controls. We then performed a targeted deletion of CLS in hepatocytes and studied its effects on liver, mitochondrial bioenergetics, and potential mechanisms that drive these changes.
Results
Mitochondrial cardiolipin levels are decreased in mouse models of MASLD/MASH
Previous research from our lab in non-hepatocytes indicated that mitochondrial phospholipid composition affects OXPHOS electron transfer efficiency to alter electron leak.15,29,30 MASLD has been shown to alter the total cellular lipidome in liver.31 However, MASLD may also influence mitochondrial content in the hepatocytes, making it difficult to discern whether these are changes in the lipid composition of mitochondrial membranes and/or changes in cellular mitochondrial density. Thus, we performed liquid chromatography-tandem mass spectrometry (LC-MS/MS) lipidomics specifically on mitochondria isolated from human liver samples with or without MASH. Samples from patients undergoing liver transplant or resection due to end-stage MASH (Fig. 1a, and Extended Data Table 1) were compared to samples from patients without MASH, undergoing resection for benign liver tumors or metastases (Fig. 1b). Strikingly, mitochondrial CL levels were reduced, primarily due to a decrease in tetralinoleoyl CL (Fig. 1c), commonly thought as the mature and functional form of CL. Additionally, levels of mitochondrial PG, an essential precursor to CL production, were also reduced, suggesting a disruption in CL biosynthesis (Fig. 1d–e).
Fig. 1. Hepatic mitochondrial phospholipidome in mouse models of MASLD.

(a) A schematic for performing mitochondrial phospholipidomic analyses in liver samples from humans. (b) Representative H&E staining from individuals with healthy or MASH liver. (c) Hepatic mitochondrial CL levels from healthy controls or individuals with MASH (n=10 and 16 per group). (d) Hepatic mitochondrial PG levels from healthy controls or individuals with MASH (n=10 and 16 per group). (e) Pathway for CL biosynthesis. (f) Representative H&E staining of livers from mice given standard chow or a Western HFD for 16 wks.(g) Representative H&E staining of livers from 20 wk old wildtype or ob/ob mice. (h) Representative Masson’s Trichrome staining of livers from mice given standard chow or GAN diet for 30wks. (i) Representative Masson’s Trichrome staining of livers from mice injected with vehicle or carbon tetrachloride for 6wks.(j) Representative western blot of OXPHOS subunits and citrate synthase in liver tissues from mice given standard chow or a Western HFD for 16 wks. (k) Representative western blot of OXPHOS subunits and citrate synthase in liver tissues from 20 wk old wildtype or ob/ob mice . (l) Representative western blot of OXPHOS subunits and citrate synthase in liver tissues from mice given standard chow or the GAN diet for 30 wks. (m) Representative western blot of OXPHOS subunits and citrate synthase in liver tissues from mice injected with vehicle or carbon tetrachloride for 6 wks.(n) A heatmap of hepatic mitochondrial phospholipidome of mice given standard chow or HFD for 16 wks. (o) A heatmap of hepatic mitochondrial phospholipidome of 20 wk old wildtype or ob/ob mice. (p) A heatmap of hepatic mitochondrial phospholipidome of mice given standard chow or the GAN diet for 30 wks. (q) A heatmap of hepatic mitochondrial phospholipidome of mice injected with vehicle or carbon tetrachloride for 6 wks. (r) Venn Diagram comparing hepatic mitochondrial phospholipidome from all four models of MASLD: HFD, ob/ob, GAN, or carbon tetrachloride. (s) CLS mRNA levels in livers of mice given standard chow or a Western HFD for 16 wks (n=4 per group). (t) CLS mRNA levels in livers from 20 wk old wildtype or ob/ob mice (n=6 per group). (u) CLS mRNA levels in livers from mice given standard chow or the GAN diet for 30 wks (n=5 per group).(v) CLS mRNA levels in livers from mice injected with vehicle or carbon tetrachloride for 6 wks (n=6 and 5 per group). Statistical significance was determined by 2-way ANOVA with a within-row pairwise comparison (c, d, n, o, p, and q) and unpaired, two-sided Student’s T test (c and d insert, s, t, u, and v). Measurements were taken from distinct samples for all groups.
We next performed lipidomic analyses on four distinct mouse models of MASLD/MASH (Fig. 1f–q). These included: 1) mice given a Western high-fat diet (HFD, Envigo TD.88137) or standard chow diet for 16 weeks (Fig. 1f), 2) ob/ob mice or their wildtype littermates at 20 weeks of age (Fig. 1g), 3) mice given the Gubra Amylin NASH diet for 30 weeks (GAN, Research Diets D09100310) or standard chow (Fig. 1h), 4) mice injected with carbon tetrachloride (CCI4) or vehicle (corn oil) for 6 weeks (Fig. 1i). Importantly, none of these interventions appear to alter the protein abundances of OXPHOS subunits or citrate synthase (Fig. 1j–m), suggesting that these interventions did not alter mitochondrial density in hepatocytes. Nevertheless, we performed all mitochondrial lipidomic analyses by quantifying lipids per mg of mitochondrial proteins. Each intervention appeared to alter different subsets of mitochondrial lipid classes (Fig. 1n–q, and Extended Data Fig. 1 and 2), as seen with our previous studies in skeletal muscle and brown adipose tissues.29,30 We take these observations to mean that most physiological interventions induce multiple systemic and local responses that are not mechanistically directly related to the phenotype of interest (e.g., cold exposure or exercise can increase food intake, obesity could affect locomotion and insulation, etc.). Although several phospholipid classes were altered among the four models, strikingly, mitochondrial CL was reduced in all four MASLD/MASH models (Fig. 1n–r). Furthermore, PG was significantly increased in all MASLD/MASH models (Fig. 1n–r). These changes coincided with decreased transcript levels for CLS (Fig. 1s–v). These observations further suggest that an insult in CL synthesis may be a key factor to disrupting mitochondrial function in MASLD/MASH.
Hepatocyte-specific deletion of cardiolipin synthase promotes MASH
CL is thought to be exclusively synthesized in the IMM where CLS is localized. To study the role of CL in hepatocytes, we generated mice with hepatocyte-specific knockout of CLS (CLS-LKO for CLS l iver knockout, driven by albumin-Cre) (Fig. 2a,b), which successfully decreased mitochondrial CL levels (Fig. 2c, and Extended Data Fig. 3). Consistent with our previous studies in non-hepatocytes, CLS deletion does not completely reduce CL levels to zero, suggesting that CL generated in other tissues may be imported. Our results showed that decreased levels of CL did not significantly impact body weight or composition (Fig. 2d,e) but resulted in significantly less liver mass (Fig. 2f).
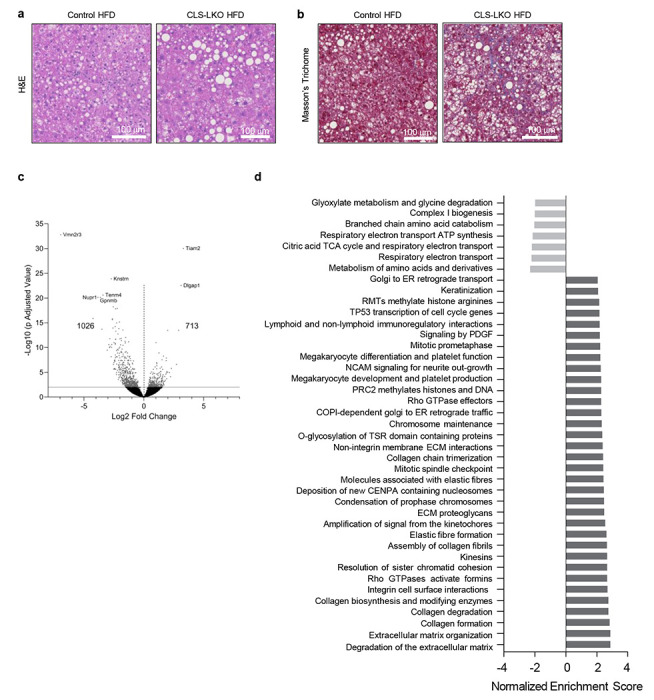
Fig. 2. Hepatocyte-specific deletion of CLS induces MASLD/MASH.

(a) A schematic for hepatocyte-specific deletion of CLS in mice. (b) CLS mRNA levels in livers from control and CLS-LKO mice (n=5 and 7 per group). (c) Mitochondrial CL levels in liver from control and CLS-LKO mice (n=5 and 6 per group). (d) Body mass of control and CLS-LKO mice (n=13 and 11 per group). (e) Body composition of control and CLS-LKO mice (n=6 and 7 per group). (f) Liver mass of control and CLS-LKO mice (n=10 and 13 per group). (g) Representative H&E staining of livers from control and CLS-LKO mice. (h) Representative Masson’s Trichrome staining of livers from control and CLS-LKO mice. (i) An RNAseq-derived heatmap of select genes associated with MASH, liver regeneration, and HCC for control and CLS-LKO mice (n=7 and 5 per group). (j) Serum AST for control and CLS-LKO mice (n=6 and 7 per group). (k) Serum ALT for control and CLS-LKO mice (n=6 and 7 per group). (l) mRNA levels of TNFα, TGFβ, IL-12, and MCP1 in livers from control and CLS-LKO mice (n=5 and 7 per group). (m) Representative image of flow cell population gating for livers from control and CLS-LKO mice (n=5 and 7 per group). (n) cDC2 cell population in livers from control and CLS-LKO mice (n=5 and 7 per group). (o) F4/80+ cell population in livers from control and CLS-LKO mice (n=5 and 7 per group). (p) Ly6Chi inflammatory monocyte population in livers from control and CLS-LKO mice (n=5 and 7 per group). (q) MHC-II cell population in control and CLS-LKO livers (n=5 and 7 per group). (r) Neutrophil cell population in control and CLS-LKO livers (n=5 and 7 per group). (s) cDC1 cell population in control and CLS-LKO livers (n=5 and 7 per group). All results are from mice fed with standard chow. Statistical significance was determined by 2-way ANOVA with a within-row pairwise comparison (c and l) and unpaired, two-sided Student’s T test (b, d, e, f, i-adjusting for FDR, and j-s). Data represent mean + SEM (b, c, d-f, j-l, and n-s). Measurements taken for b and c were from the same samples. Measurements for d, e, f, g, h, and i were taken from distinct samples. Measurements taken for j, k, m-s were from the same samples. Measurements taken for l were from distinct samples.
We sought to further characterize livers from control and CLS-LKO mice. Histological analyses revealed that CLS deletion was sufficient to promote steatosis (Fig. 2g) and fibrosis (Fig. 2h) in standard chow-fed and high-fat fed conditions (Extended Data Fig. 4a,b). To more comprehensively describe the effects of loss of hepatic CLS on gene expression, we performed RNA sequencing on these livers. CLS deletion increased the expression of 713 genes and decreased 1026 genes (Extended Data Fig. 4c). Pathway analyses revealed that many of the signature changes that occur with MASLD/MASH also occurred with CLS deletion (Fig. 2i, and Extended Data Fig. 4d). This MASLD/MASH phenotype in our CLS knockout model was further confirmed with an elevation of the liver enzymes AST and ALT (Fig. 2j,k) as well as increased mRNA levels of inflammatory markers (Fig. 2l). We then proceeded to confirm these data by further phenotyping liver tissues from control and CLS-LKO mice.
In steatohepatitis, immune cell populations in the liver become altered to activate pathological immune response.32 Flow cytometry on livers from control and CLS-LKO mice indicated that the loss of CL promotes a robust classic immune response found in MASH (Fig. 2m). cDC2 cells are a broad subset of dendritic cells with specific surface markers (e.g., CD11b, CD172a) that allow them to be distinguished from other dendritic cell populations.33 This broad population of dendritic cells was not different between control and CLS-LKO mice (Fig. 2n). Notably, there was a marked reduction in the Kupffer cell population (Fig. 2o) - traditionally involved in maintaining liver homeostasis whose dysfunction can lead to dysregulated immune response.34 This reduction appears to be counterbalanced by a concomitant increase in Ly6Chi population, which are known to typically go on to become inflammatory monocytes (Fig. 2m,p). The replacement of Kupffer cells with other inflammatory cell populations suggests a shift towards a more pro-inflammatory environment, which may exacerbate liver injury and promote fibrosis. Nonetheless, the MHC-II cell population and neutrophils were not increased (Fig. 2q,r) with neutrophils actually decreased (Fig. 2r). The cDC1 cell population was not different, which is traditionally elevated in response to cytotoxic T cells and might not be directly related to liver fibrosis.35 Together, these findings suggest that even on a chow diet, CLS-deficient livers exhibit inflammatory cell infiltration, a hallmark often associated with early signs of MASH.
CLS deletion promotes fatty liver but increases mitochondrial respiratory capacity
Hepatocyte lipid accumulation may suggest defects in substrate handling, which is often manifested in systemic substrate handling. Indeed, CLS deletion modestly reduced glucose or pyruvate handling, even in chow-fed conditions (Fig. 3a–d). Lipid accumulation in hepatocytes can occur due to an increase in lipogenesis, a decrease in VLDL secretion, or a decrease in β-oxidation. However, mRNA levels for lipogenesis genes trended lower (not higher), and mostly unchanged for VLDL secretion or β-oxidation (Fig. 3e, and Extended Data Fig. 5a). Circulating triglycerides were not lower in CLS-LKO mice compared to control mice (Extended Data Figure 5b).
Fig. 3. CLS deletion increases mitochondrial respiratory capacity.

(a) Glucose tolerance test (IPGTT) of control and CLS-LKO mice fed with standard chow (n=6 and 7 per group). (b) Area under the curve for IPGTT. (c) Pyruvate tolerance test (PTT) of control and CLS-LKO mice fed with standard chow (n=6 and 8 per group). (d) Area under the curve for PTT. (e) An RNAseq-derived heatmap of genes associated with lipogenesis, VLDL, and β-oxidation for control and CLS-LKO mice (n=6 and 5 per group). (f) An RNAseq-derived heatmap of genes associated with components of ETS complex structure and function (n=6 and 5 per group). (g) Representative electron microscopy images of liver mitochondria from control and CLS-LKO mice. (h) Representative western blot of whole liver tissue lysate using OXPHOS cocktail and citrate synthase in control and CLS-LKO mice. (i) Ratio of mitochondrial to nuclear DNA in liver tissue of control and CLS-LKO mice (n=8 per group). (j) Representative tracing from high-resolution respirometry during maximal respiration using TCA cycle intermediates. (k) JO2 consumption in isolated liver mitochondria from control and CLS-LKO mice in response to 0.5 mM malate, 5 mM pyruvate, 2.5 mM ADP, 10 mM succinate, and 1.5 μM FCCP (n=6 per group). (l) JO2 consumption in isolated liver mitochondria from control and CLS-LKO mice in response to 0.02 mM palmitoyl-carnitine, 0.5 mM malate, and 2.5 mM ADP (n=6 per group). (m) Representative western blot of isolated mitochondria using OXPHOS cocktail in control and CLS-LKO mice. All results are from mice fed with standard chow. Statistical significance was determined by 2-way ANOVA with a within-row pairwise comparison (a, c, k, and l) and unpaired, two-sided Student’s T test (b, d, e and f- adjusting for FDRs, and i). Data represent mean + SEM (a-d, k, and l). Data in box-and-whiskers plot in i represent median with min-to-max. Measurements for a, c, g, and i were taken from distinct samples. Measurements from e and f were from the same samples. Measurements from k, l, and m were taken using the same samples.
MASLD is known to be associated with reduced mitochondrial oxidative capacity, and such an effect may also occur with CL deficiency to induce lipid accumulation. Indeed, mRNA levels of several genes in the ETC were downregulated with CLS deletion, particularly those associated with structural components of the ETC complexes and the electron carrier CoQ (Fig. 3f). Given that CL is located in the IMM where it binds to enzymes involved in OXPHOS,36–39 we reasoned that the loss of CL could reduce mitochondrial oxidative capacity to promote steatosis.
Consistent with subcellular localization of CL, CLS deletion resulted in mitochondria with disorganized membrane structures and poorly developed cristae (Fig. 3g). However, mitochondrial density quantified with western blots for respiratory complex subunits and citrate synthase (Fig. 3h), as well as mtDNA/nucDNA (Fig. 3i), showed no differences in livers from control and CLS-LKO mice. We thus speculated that CL lowers respiratory capacity not by reducing the total number of mitochondria or OXPHOS respirasomes, but by reducing the activity of respiratory enzymes. To our surprise, CLS deletion increased, rather than decreased, mitochondrial respiration (JO2), as measured by high-resolution Oroboros respirometry (Fig. 3j), using both with Krebs cycle substrates (Fig. 3k) as well as fatty acyl substrates (Fig. 3l), to a similar degree. Importantly, these changes occurred in the absence of differences in OXPHOS subunit abundance per unit of mitochondria (Fig. 3m), ruling out the possibility that changes in the abundance of respiratory enzymes to contribute to change in respiration. A caveat to these findings is that CLS deletion promotes reduction in respiratory capacity after HFD-feeding (Extended Data Fig. 5c,d). However, CLS-LKO mice are steatotic in standard chow-fed condition, indicating that reduced mitochondrial fatty acid oxidation cannot be the cause of steatosis at baseline. The transient increase in respiration followed by its subsequent decrease is reminiscent of what is thought to occur with liver’s mitochondrial respiration over the course of MASLD progression.40
High-resolution respirometry experiments were performed in isolated mitochondria from hepatocytes by providing exogenous supraphysiological concentrations of substrates. While these assays provide robust measurements of respiratory capacity (the potential of mitochondria), they do not necessarily reflect their endogenous activity. To address this point, we performed stable isotope tracing experiments using uniformly labeled 13C-palmitate (Fig. 4a)41 in murine hepa1-6 cells without (scrambled shRNA or shSC) or with CLS knockdown (shRNA targeting CLS or shCLS). Surprisingly, but consistent with the JO2 data, CLS deletion increased, not decreased, the incorporation of palmitate into TCA intermediates (Fig. 4b–d). We also performed a similar tracing experiment using uniformally labeled 13C-glucose (Fig. 4e–j, and Extended Data Fig. 5e–i) and observed increased labeling towards pyruvate (Fig. 4e,f), reduced labeling towards lactate and alanine (Fig. 4g, and Extended Data Fig. 5h), and normal labeling towards TCA intermediates except for reduced labeling towards succinate (Fig. 4h–j, and Extended Data Fig. 5i–m). Overall, despite the altered substrate incorporation, a decrease in TCA flux does not appear to account for the steatotic phenotype observed with CLS deletion.
Fig. 4. Stable isotope tracing with [U-13C] palmitate and [U-13C] glucose in hepa1-6 cells with or without CLS deletion.

(a) Schematic illustration of the labeling process during stable isotope tracing with [U-13C] palmitate or [U-13C] glucose. Blue or green circles represent 13C-labeled carbons, and red circles represent unlabeled 12C carbons. The pathway shows the flow from palmitate to beta-oxidation or glucose through glycolysis to the tricarboxylic acid (TCA) cycle, with key intermediates labeled. (b) Levels of labeled succinate from palmitate tracing in hepa1-6 cells without (shSC) or with CLS deletion (shCLS) (n=6 per group). (c) Levels of labeled malate from palmitate tracing in hepa1-6 cells without (shSC) or with CLS deletion (shCLS) (n=6 per group). (d) Levels of labeled fumarate from palmitate tracing in hepa1-6 cells without (shSC) or with CLS deletion (shCLS) (n=6 per group). (e) Levels of labeled pyruvate from glucose tracing in hepa1-6 cells without (shSC) or with CLS deletion (shCLS) (n=6 per group). (f) Levels of labeled acetyl-CoA from glucose tracing in hepa1-6 cells without (shSC) or with CLS deletion (shCLS) (n=6 per group). (g) Levels of labeled lactate from glucose tracing in hepa1-6 cells without (shSC) or with CLS deletion (shCLS) (n=6 per group). (h) Levels of labeled succinate from glucose tracing in hepa1-6 cells without (shSC) or with CLS deletion (shCLS) (n=6 per group). (i) Levels of labeled fumarate from glucose tracing in hepa1-6 cells without (shSC) or with CLS deletion (shCLS) (n=6 per group). (j) Levels of labeled citrate from glucose tracing in hepa1-6 cells without (shSC) or with CLS deletion (shCLS) (n=6 per group). Statistical significance was determined by unpaired, two-sided Student’s T test. Data represent mean ± SEM. Measurements were taken from the same samples for b-d and a different set of samples for e-j.
Low hepatic CL paradoxically increases mitochondrial respiratory capacity and promotes electron leak
Oxidative stress is thought to play a critical role in the transition from MASLD to MASH, wherein sustained metabolic insult leads to hepatocellular injury and collagen deposition resulting in fibrosis.7 CLS deletion promotes liver fibrosis in standard chow-fed condition (Fig. 5a and Fig. 2h) and in HFD-fed condition (Extended Data Fig. 4b) that coincided with increased mRNA levels for fibrosis (Fig. 5b and 2i). Tissue fibrosis is often triggered by apoptosis, and CLS deletion appeared to activate the caspase pathway (Fig. 5c,d). How does deletion of CLS, a mitochondrial enzyme that produces lipids for IMM, activate apoptosis? Cytochrome c is an electron carrier that resides in IMM, which shuttles electrons between complexes III and IV.42 Under normal physiological conditions, cytochrome c is anchored to the IMM by its binding to cardiolipin.39 During the initiation of intrinsic apoptosis, CL can undergo oxidation and redistribution from the IMM to the outer membrane space (OMM). CL oxidation weakens its binding affinity for cytochrome c, releasing it from the IMM and into the OMM where it signals apoptosis.13 However, neither mitochondrial nor cytosolic cytochrome c abundance appeared to be influenced by CLS deletion (Fig. 5e,f, and Extended Data Fig. 6a,b).
Fig. 5. CL deficiency promotes mitochondrial electron leak.

(a) Representative electron microscopy images for control and CLS-LKO mice depicting fibrosis with red arrows. (b) mRNA levels of fibrotic markers (Col1a1 and Desmin) in liver tissues from control and CLS-LKO mice (n=5 and 7 per group). (c) Levels of cleaved caspase-3 in liver tissues from control and CLS-LKO mice (n=4 per group). (d) Levels of cleaved caspase-7 in liver tissues from control and CLS-LKO mice (n=4 per group). (e) Levels of mitochondrial cytochrome c in liver tissues of control and CLS-LKO mice (n=7 per group). (f) Levels of cytosolic cytochrome c levels in liver tissues of control and CLS-LKO mice (n=7 per group). (g) H2O2 emission and production in isolated liver mitochondria from control and CLS-LKO mice stimulated with succinate, or succinate, auranofin, and BCNU (n=3 and 4 per group). (h) Schematic representation of small unilamellar vesicles (SUVs) containing either cardiolipin (CL) or phosphatidylcholine (PC) to enrich mitochondria with exogenous lipids. (i) H2O2 production in liver mitochondria enriched with CL or PC SUVs in control and CLS-LKO mice (n=4 per group). All results are from mice fed with standard chow. Statistical significance was determined by 2-way ANOVA with a within-row pairwise comparison (b, g, and i) and unpaired, two-sided Student’s T test (c-f). Data represent mean ± SEM. Measurements from a, b, g, and i are from distinct samples. Measurements from c and d were taken from the same samples. Measurements from e and f were taken from a different set of samples.
Mitochondrial ROS has been implicated in apoptosis and fibrosis with MASLD.43–45 Using high-resolution fluorometry in combination with high-resolution respirometry, we quantified electron leak from liver mitochondria with the assumption that almost all electrons that leak react with molecular O2 to produce O2−. Using recombinant superoxide dismutase, we ensure that all O2− produced is converted into H2O2, which was quantified with the AmplexRed fluorophore.46 There were striking increases in mitochondrial electron leak in CLS-LKO mice compared to control mice on both standard chow (Fig. 5g) and high-fat diet (Extended Data Fig. 6c). It is noteworthy that endogenous antioxidant pathways were insufficient to completely suppress oxidative stress induced by CLS deletion (H2O2 emission shown in the 1st and 2nd bars in Fig. 5g, and Extended Data Fig. 6c). We also confirmed that JH2O2/JO2 was elevated with CLS knockdown in mitochondria from murine hepa1-6 cell line (Extended Data Fig. 6d) suggesting that low CL induces oxidative stress in a cell-autonomous manner.
While unknown, CLS may possess an enzymatic activity independent of CL synthesis that may contribute to electron leak. To more conclusively show that the loss of mitochondrial CL contributes to oxidative stress, we supplied exogenous CL to isolated mitochondria by fusing them with small unilamellar vesicles (SUVs) (Fig. 5h).47 Isolated mitochondria from control and CLS-LKO mice were fused with SUVs containing either CL or phosphatidylcholine (PC) (Fig. 5i, and Extended Data Fig. 6e). Remarkably, reintroducing CL to mitochondria from CLS-LKO mice reduced H2O2 production back to baseline, whereas PC had no effect. Thus, loss of CL drives the increased mitochondrial leak observed with CLS deletion.
Loss of CL attenuates coenzyme Q interface with complex III
How does the loss of CL promote electron leak? We first addressed whether CL influences the formations of respiratory supercomplexes. Respiratory supercomplexes exist in several combinations of multimers of Complex I, III, IV, and V and are thought to form either transiently or stably to improve electron transfer efficiency.48,49 CL may play an essential role in the stability of ETC supercomplexes.50,51 Using blue native polyacrylamide gel electrophoresis , we investigated supercomplex assembly in isolated hepatic mitochondria from control and CLS-LKO mice (Fig. 6). When probing indiscriminately for all supercomplexes, there were many bands whose intensity were influenced by CLS deletion (Fig. 6a). In particular, I+III2+IV1 supercomplex appeared to be substantially and consistently reduced in samples from CLS-LKO mice compared to control. To gain a more granular and definitive picture on the influence of CLS deletion on individual supercomplexes, we quantified supercomplexes using subunit-specific western blotting (Fig. 6b–m). Strikingly, CLS deletion substantially reduced the abundance of I+III2+IV1 supercomplex when probing for UQCRSF1/complex III (Fig. 6h,i), while increasing the abundances for CIII singlet and CIV singlet (Fig. 6j,k), as well as trends for increase in CI singlet (Fig. 6b–e). These findings suggest that loss of CL reduces I+III2+IV1 supercomplex assembly to attenuate electron flux through these complexes, promoting electron leak.
Fig. 6. Influence of CL deficiency on respiratory supercomplexes.

(a) Representative western blot of respiratory supercomplexes detected using supercomplex antibody cocktail in isolated mitochondria from livers taken from control and CLS-LKO mice. (b) Representative western blot of respiratory supercomplex detected using GRIM19/complex I antibody in isolated mitochondria from livers taken from control and CLS-LKO mice (n=4 per group). (c) Quantification of b. (d) Representative western blot of respiratory supercomplex detected using the NDUFA9/complex I antibody in isolated mitochondria from livers taken from control and CLS-LKO livers (n=4 per group). (e) Quantification of d. (f) Representative western blot of respiratory supercomplex detected using the SDHA2/complex II antibody in isolated mitochondria from livers taken from control and CLS LKO livers (n=4 per group). Complex II is not thought to form respiratory supercomplexes. (g) Quantification of f. (h) Representative western blot of respiratory supercomplex detected using the UQCRFS1/complex III antibody in isolated mitochondria from livers taken from control and CLS-LKO livers (n=4 per group). (i) Quantification of h. (j) Representative western blot of respiratory supercomplex detected using the MTCO1/complex IV antibody in isolated mitochondria from livers taken from control and CLS-LKO livers (n=4 per group). (k) Quantification of j. (l) Representative western blot of respiratory supercomplex detected using the ATP5A/complex V antibody in isolated mitochondria from livers taken from control and CLS-LKO livers (n=4 per group). (m) Quantification of l. All results are from mice fed with standard chow. Statistical significance was determined by 2-way ANOVA with a within-row pairwise comparison (first panel in c, first panel in e, first panel in i, and first panel in k) and unpaired, two-sided Student’s T test (second panel in c, second panel in e, g, second panel in i, second panel in k, and both panels in m). Data represent mean ± SEM. Measurements from a-m were taken from the same samples.
To better understand how low CL promotes inefficient electron transfer, we quantified electron leak at four specific sites of the ETC: 1) quinone-binding site in complex I (IQ), 2) flavin-containing site in complex I (IF), 3) succinate-dehydrogenase-associated site in complex II (IIF), and 4) the ubiquinol oxidation site in complex (IIIQo) Fig. 7a). Electron leak at each of these sites can be quantified separately using substrates and inhibitors that restrict electron flow specific to these sites (Fig. 7b–e). Among complex I, III, and IV (the components of I+III2+IV1 supercomplex), CLS deletion robustly increased electron leak at site IIIQo (Fig. 7e). In addition, electron leak either increased or trended to increase at all other upstream sites (Fig. 7b–d). These findings raise a possibility that inefficient electron transfer at complex III bottlenecks the ETC electron flow to increase electron leak at these sites.
Fig. 7. CL deficiency disrupts coenzyme Q homeostasis in mice and humans.

(a) A schematic for site-specific electron leak. (b) Electron leak at site IQ in liver mitochondria from control and CLS-LKO mice (n=7 per group). (c) Electron leak at site IF in liver mitochondria from control and CLS-LKO mice (n=7 per group. (d) Electron leak at site IIF in liver mitochondria from control or CLS-LKO mice (n=7 per group). (e) Electron leak at site IIIQ0 in liver mitochondria from control or CLS-LKO mice (n=7 per group). (f) Oxidized coenzyme Q (CoQ) (ubiquinone) can be charged with electrons to become reduced CoQ (ubiquinol). (g) Oxidized CoQ levels in isolated mitochondrial fractions from livers taken from control and CLS-LKO mice (n=7 per group). (h) Reduced CoQ levels in isolated mitochondrial fractions from livers taken from control and CLS-LKO livers (n=7 per group). (i) CoQ levels in in isolated mitochondria from livers of healthy human controls or patients with advanced steatohepatitis (n=10 and 16 per group). (j) Pearson correlation analysis of CL and CoQ levels in human liver samples (R2 = 0.64). Data from b-e,g,h are from mice fed with standard chow. Statistical significance was determined by unpaired two-sided Student’s T test (b-e and insert in i) and 2-way ANOVA with a within-row pairwise comparison (g, h, i). Data represent mean ± SEM (b-e, g, h, i). Measurements from b-e were taken from the same samples. Measurements from g and h were taken from the same samples. Measurements from i and j are from the same samples.
We further examined the possibility that complex III is the primary site of defect induced by CLS deletion, we studied the redox state of CoQ, a career that feeds electrons into complex III. It is noteworthy that CoQ, like CL, is a lipid molecule (Fig. 7f), and we thought it was conceivable that CL somehow interacts with CoQ to influence its electron transfer efficiency. Using redox mass spectrometry, we measured CoQ levels in whole liver tissues from control and CLS-LKO mice and found no difference in whole liver tissue CoQ levels (Extended Data Fig. 7a–i). However, since CoQ may also be found outside of mitochondria, we performed CoQ redox mass spectrometry in isolated mitochondria fractions of livers from control or CLS-LKO mice. Indeed, oxidized CoQ levels were increased (Fig. 7g, and Extended Data Fig. 7j,l,n) in CLS-LKO mice compared to their controls. In contrast, reduced forms of CoQ were not lower in CLS-LKO mice compared to control mice (Fig. 7h, and Extended Data Fig. 7k,m,o). Thus, CLS deletion does not appear to have a defect in converting oxidized CoQ into reduced CoQ (i.e., charging CoQ with electrons by complex I and II). Rather, these data support the notion that the defect is at complex III, as the normal level of reduced CoQ yielded greater oxidized CoQ.
To extrapolate these findings into humans, we went back to liver samples from patients undergoing liver transplant or resection due to end-stage MASH (Fig. 1a) to quantify the abundance of mitochondrial CoQ. MASH was associated with a striking ~40% reduction in the abundance of mitochondrial CoQ (Fig. 7i) (tissue samples were not large enough to perform CoQ redox mass spectrometry on mitochondria). A Pearson correlation analysis showed a highly robust correlation between the abundances of mitochondrial CL and CoQ (Figure 7j, R2 = 0.64), indicating that the variability in the abundance of CL explains 64% of the variability of the abundance of CoQ. Based on our findings that CL is reduced with MASLD/MASH and that loss of CL influences CoQ electron transfer efficiency, we interpret these findings to mean that loss of CL destabilizes CoQ to increase its turnover.
Discussion
In hepatocytes, disruptions of mitochondrial bioenergetics lead to and exacerbate metabolic-associated steatohepatitis.52 CL, a key phospholipid in the inner mitochondrial membrane, plays a critical role in mitochondrial energy metabolism.23 In this manuscript, we examined the role of CL in the pathogenesis of MASLD. In mice and in humans, MASLD/MASH coincided with a reduction in mitochondrial CL levels. Hepatocyte-specific deletion of CLS was sufficient to spontaneously induce MASH pathology, including steatosis and fibrosis, along with shift in immune cell populations towards a more pro-inflammatory profile, all of which occurred in mice given a standard chow diet. Paradoxically, high-resolution respirometry and stable isotope experiments showed that CLS deletion promotes, instead of attenuates, mitochondrial oxidative capacity in a fashion reminiscent of temporal changes that occur with mitochondrial bioenergetics in human MASH.40 Our principal finding on the role of hepatocyte CL in bioenergetics is that its loss robustly increases electron leak, particularly at complex III. This was likely due to: 1) direct interaction of CL with complex III, 2) lower abundance of I+III2+IV1 respiratory supercomplex, and 3) inability of complex III to efficiently accept electrons from CoQ. In humans, mitochondrial CL and CoQ were co-downregulated in MASH patients compared to healthy controls, with a strong correlation (R2 = 0.64) between CL and CoQ. Together, these results implicate CL as a key regulator of MASH progression, particularly through its effect on the CoQ-complex III interface to promote oxidative stress.
How might CL regulate CoQ? CoQ is the main electron transporter between complex I/II and III. CLS deletion in hepatocytes appeared to disrupt CoQ’s ability to cycle between its oxidized and reduced forms. There are several ways in which low CL might directly or indirectly influence CoQ’s redox state. The primary suspect is CL interacting with complex III, as eight or nine CL molecules are tightly bound to complex III38 and are thought to be essential to its function.53 While CL has been found to bind to other respiratory complexes, our data suggest that loss of CL might disproportionately influence complex III. This is also supported by our findings that the loss of CL reduced the formation of complex III-dependent supercomplex, without influencing other supercomplexes. Reduced capacity for complex III to efficiently accept electrons from CoQ might explain the increased electron leak at site IIIQ0 and increased level of oxidized CoQ. Meanwhile, loss of CL also increased electron leak at complex I and II. CL has also been implicated to bind to these complexes.20,21,36 Thus, complex III dysfunction is perhaps unlikely to entirely explain electron leaks at sites IF, IQ, and IIF, though we think that the majority of its effect is due to the bottleneck created by the reduced ability of complex III to accept electrons.54 Conversely, complex I and II are unlikely to be the only primary sites of defect as such defects probably will not promote electron leak at site IIIQO. Moreover, CLS deletion did not have an effect on the abundance of reduced CoQ despite there being greater abundance of oxidized CoQ, suggesting that complex I/II do not have reduced ability to transfer electrons onto CoQ. Another potential mechanism by which CL influences CoQ redox state is by CL directly interacting with CoQ. As they are both lipid molecules in the IMM, low CL may reduce the lateral diffusability of CoQ between respiratory complexes. Low CL might also indirectly influence CoQ by contributing to changes in membrane properties, distribution of ETC in the cristae, and the cristae architecture.55 Finally, increased electron leak, regardless of their origin, could have a feed-forward effect by which oxidative stress disrupts redox homeostasis in other components of ETC.
MASH is a progressive liver disease characterized by lipid accumulation, inflammation, and fibrosis in the liver.56 The progression to MASH involves a complex interplay of metabolic stress, mitochondrial defects, and immune responses that collectively promote hepatocellular injury.57 Our findings suggest that a low mitochondrial CL level directly induces key pathological features of MASH, including steatosis, fibrosis, and immune cell infiltration, even in the absence of dietary or environmental stressors, such as high-fat diet. When mice were fed a standard chow diet, CLS-LKO mice were more prone to lipid droplet accumulation than control mice. This phenotype was exacerbated when the mice were challenged with a high-fat diet. We primarily interrogated the mitochondrial bioenergetics of standard chow-fed control or CLS-LKO mice. A lower respiration rate would partially explain the lipid droplet accumulation, but to our surprise, CLS deletion increased JO2 regardless of substrates. Similarly, experiments using uniformly labeled 13C-palmitate or 13C-glucose showed that CLS deletion promoted an overall increase in the flux toward TCA intermediates, particularly for palmitate. CLS deletion did not appear to increase de novo lipogenesis or reduce VLDL secretion. Thus, it is unclear what mechanisms contribute to steatosis induced by CLS deletion.
Liver fibrosis is characterized by the accumulation of excess extracellular matrix components, including type I collagen, which disrupts liver microcirculation and leads to injury.55 Livers from CLS-LKO mice exhibited more fibrosis compared to control mice, even on a standard chow diet, which was worsened when fed a high-fat diet. Indeed, transcriptomic analyses revealed that CLS deletion activates pathways for fibrosis and degeneration, with many of the collagen isoforms upregulated. In the MASH liver, collagen deposition is accompanied by inflammatory cell infiltrate promoting an overall inflammatory environment. Flow cytometry experiments further confirmed that CLS deletion led to an increase in Ly6Chi cell population, suggesting that dying resident Kupffer cells are being replaced by Ly6Chi monocytes in the livers of CLS-LKO mice.33
Early in the MASLD disease progression, mitochondria adapt to the increased energy demands by increasing their respiratory capacity. In the later stages of disease progression to MASH, mitochondrial respiration diminishes.58 This pattern was reminiscent of our observations in the CLS-LKO mice. Livers from CLS-LKO mice fed a standard chow diet exhibited greater respiratory capacity compared to that of control mice. Conversely, livers from CLS-LKO mice on a high-fat diet exhibited lower respiratory capacity compared to that of control mice. We interpret these findings to suggest that liver mitochondria in chow-fed CLS-LKO mice are more representative of early stage of MASLD, while high-fat-diet fed CLS-LKO mice resemble later stages of MASLD.
In non-hepatocytes, low CL levels have been linked to electron leak in the context of a deficiency of the tafazzin gene, a CL transacylase, whose mutation promotes Barth syndrome.15,26,59,60 Paradoxically, we previously showed that CLS deletion in brown adipocytes does not increase electron leak.30 It is important to note that CLS deletion in our current or previous study does not completely eliminate CL (likely due to an extracellular source). We do not believe that CL is dispensable for efficient electron transfer in adipocytes. Rather, due to unclear mechanisms, different cell types likely exhibit varying tolerances to low CL influencing their bioenergetics, with brown adipocytes appearing more tolerant than hepatocytes. Regardless, electron leak was elevated with CLS deletion in both standard chow and high-fat diet-fed conditions. These observations mirror what has been shown in MASLD progression.61 The effect of CLS deletion on electron leak was due to reduced CL levels, as the reintroduction of cardiolipin via SUVs completely rescued the electron leak.
CL is reported to be essential for the formation and stability of supercomplexes.14,50,51,62 CL has a distinctive conical shape with four fatty acyl chains, which allows it to create a highly curved membrane environment in the IMM, promoting close packing of protein complexes that likely facilitates supercomplex formation.50 CL also directly interacts with various subunits of the ETC complexes through electrostatic interactions, which help stabilize the supercomplexes by anchoring them together in a specific spatial orientation to optimize electron flow.48 Liver-specific deletion of CLS only resulted in a lower abundance of the I+III2+IV1 supercomplex. We interpret these findings to mean that I+III2+IV1 supercomplex is particularly sensitive to the reduced CL level in hepatocytes.
In our study, we observed a striking correlation between CL levels and CoQ in human liver samples from healthy/MASH patients (R2 of 0.64). In contrast, low mitochondrial CL induced by CLS deletion coincided with a greater mitochondrial CoQ content in CLS-LKO mice compared to controls. These data likely suggest that acute and robust reduction in CLS or CL level might trigger a compensatory CoQ production in mice. Conversely, because the samples from healthy/MASH patients were from those who had cirrhosis, MASH samples likely came from subjects that had suffered from years of MASLD pathology. In those samples, where reduction in CL was quantitatively modest compared to what was induced with CLS knockout, CoQ might have gradually decreased coincidental to the decrease in CL. Regardless of these differences in mice and humans, it is clear that there is a relationship between CL and CoQ that is worth further exploration.
In conclusion, our findings identify a critical role for CL in regulating ETC efficiency to promote oxidative stress. In both mice and humans, MASLD is associated with a decrease in hepatic mitochondrial CL, suggesting that low CL may be the cause of the obligatory increase in oxidative stress known to occur with MASLD progression. We further link CL deficiency to increased electron leak at the CoQ-complex III interface, and as the primary defect that promotes oxidative stress. We believe that these bioenergetic changes underlie the pathogenesis of MASLD, as CL deletion was sufficient to cause steatosis, fibrosis, and inflammation, phenocopying many changes that occur with MASLD/MASH progression. Further research will be needed to fully uncover how CL regulates CoQ, and to test whether rescuing the CL/CoQ axis might be effective in treating patients with MASLD/MASH.
Methods
Experimental model and subject details
Human participants
De-identified liver samples were acquired from the University of Utah Biorepository and Molecular Pathology Shared Resource from patients undergoing liver transplantation or resection due to end-stage liver disease and/or liver tumor(s). All patients were classified to their respective diagnosis by a pathologist at the time of initial collection. The diagnosis for individual tissue samples was confirmed by a pathologist based on histology review of formalin-fixed, paraffin-embedded sections takes from the same location as the tissue analyzed by targeted lipid mass spectrometry.
Mice
All mice (male and female) used in this study were bred onto C57BL/6J background. CLS-LKO mice were generated by crossing the CLS conditional knockout (CLScKO+/+) generously donated by Dr. Zachary Gerhart-Hines (University of Copenhagen)24 with mice heterozygous for Albumin promotor Cre (Alb-Cre+/−) to produce liver-specific deletion of the CLS gene (CLScKO+/+, Alb-Cre+/−) or control (CLScKO+/+, no Cre) mice. CLScKO+/+ mice harbor loxP sites that flank exon 4 of the CLS gene. For high-fat diet studies, 8 wk CLS-LKO and their respective controls began high-fat diet (HFD, 42% fat, Envigo TD.88137) feeding for 8 wks. Mice were fasted 4 hours and given an intraperitoneal injection of 80 mg/kg ketamine and 10 mg/kg xylazine prior to terminal experiments and tissue collection. All animal experiments were performed with the approval of the Institutional Animal Care and Use Committees at the University of Utah.
Cell lines
Hepa 1-6 murine hepatoma cells were grown in high-glucose DMEM (4.5 g/L glucose, with L-glutamine; Gibco 11965-092) supplemented with 10% FBS (heat-inactivated, certified, US origin; Gibco 10082-147), and 0.1% penicillin-streptomycin (10,000 U/mL; Gibco 15140122). For lentivirus-mediated knockdown of CLS, CLS expression was decreased using the pLKO.1 lentiviral-RNAi system. Plasmids encoding shRNA for mouse Crls1 (shCLS: TRCN0000123937) was obtained from MilliporeSigma. Packaging vector psPAX2 (ID 12260), envelope vector pMD2.G (ID 12259), and scrambled shRNA plasmid (SC: ID 1864) were obtained from Addgene. HEK293T cells in 10 cm dishes were transfected using 50 μL 0.1% polyethylenimine, 200 μL, 0.15 M sodium chloride, and 500 μL Opti-MEM (with HEPES, 2.4 g/L sodium bicarbonate, and l-glutamine; Gibco 31985) with 2.66 μg of psPAX2, 0.75 μg of pMD2.G, and 3 μg of either scrambled or Crls1 shRNA plasmid. Cells were selected with puromycin throughout differentiation to ensure that only cells infected with shRNA vectors were viable.
Method details
Body composition
To assess body composition, mice were analyzed using a Bruker Minispec NMR (Bruker, Germany) 1 week prior to terminal experiments. Body weights were measured and recorded immediately prior to terminal experiments.
RNA quantification
For quantitative polymerase chain reaction (qPCR) experiments, mouse tissues were homogenized in TRIzol reagent (Thermo Fisher Scientific) and RNA was isolated using standard techniques. The iScript cDNA Synthesis Kit was used to reverse transcribe total RNA, and qPCR was performed with SYBR Green reagents (Thermo Fisher Scientific). Pre-validated primer sequences were obtained from mouse primer depot (https://mouseprimerdepot.nci.nih.gov/). All mRNA levels were normalized to RPL32. For RNA sequencing, liver RNA was isolated with the Direct-zol RNA Miniprep Plus kit (Zymo Cat#: R2070). RNA library construction and sequencing were performed by the High-Throughput Genomics Core at the Huntsman Cancer Institute, University of Utah. RNA libraries were constructed using the NEBNext Ultra II Directional RNA Library Prep with rRNA Depletion Kit (human, mouse rat). Sequencing was performed using the NovaSeq S4 Reagent Kit v1.5 150x150 bp Sequencing with >25 million reads per sample using adapter read 1: AGATCGGAAGAGCACACGTCTGAACTCCAGTCA and adapter read 2: AGATCGGAAGAGCGTCGTGTAGGGAAAGAGTGT. Pathway analyses were performed by the Bioinformatics Core at the Huntsman Cancer Institute, University of Utah using the Reactome Pathway Database. For differentially expressed genes, only transcripts with Padj < 0.05 and baseMean > 100 are included.
DNA isolation and quantitative PCR
Genomic DNA for assessments of mitochondrial DNA (mtDNA) was isolated using a commercially available kit according to the manufacturer’s instructions (69504, Qiagen). Genomic DNA was added to a mixture of SYBR Green (Thermo Fisher Scientific) and primers. Sample mixtures were pipetted onto a 3840well plate and analyzed with QuantStudio 12K Flex (Life Technologies). The following primers were used: mtDNA fwd, TTAAGA-CAC-CTT-GCC-TAG-CCACAC; mtDNA rev, CGG-TGG-CTG-GCA-CGA-AAT-T; nucDNA fwd, ATGACG-ATA-TCG-CTG-CGC-TG; nucDNA rev, TCA-CTT-ACC-TGGTGCCTA-GGG-C.
Western blot analysis
For whole liver lysate, frozen liver was homogenized in a glass homogenization tube using a mechanical pestle grinder with homogenization buffer (50 mM Tris pH 7.6, 5 mM EDTA, 150 mM NaCl, 0.1% SDS, 0.1% sodium deoxycholate, 1% triton X-100, and protease inhibitor cocktail). After homogenization, samples were centrifuged for 15 min at 12,000 × g. Protein concentration of supernatant was then determined using a BCA protein Assay Kit (Thermo Scientific). Equal protein was mixed with Laemmeli sample buffer and boiled for 5 mins at 95°C for all antibodies except for OXPHOS cocktail antibody (at room temp for 5 mins), and loaded onto 4–15% gradient gels (Bio-Rad). Transfer of proteins occurred on a nitrocellulose membrane and then blocked for 1 hr. at room temperature with 5% bovine serum albumin in Tris-buffered saline with 0.1% Tween 20 (TBST). The membranes were then incubated with primary antibody (see Extended Data Table 2), washed in TBST, incubated in appropriate secondary antibodies, and washed in TBST. Membranes were imaged utilizing Western Lightning Plus-ECL (PerkinElmer) and a FluorChem E Imager (Protein Simple). For isolated mitochondria, identical procedures were taken with equal protein of mitochondrial preps.
Single cell preparation of liver tissue for flow cytometry
After mice were euthanized using isoflurane, blood was collected by cardiac puncture, the abdomen was exposed and the liver collected, rinse with PBS and weighed. Liver was subsequently transferred in approximately 3ml of serum-free RPMI-1640 containing Collagenase D (10mg/ml; Sigma) and DNase (1mg/ml; Sigma) and incubated in a rocking platform for 45 min at 37°C. The liver extract was mashed through a 70μm filter, the cell re-suspended in RPMI-1640 containing 10% FBS and centrifuged at 1600 rpm for 5 min. The supernatant was discarded and the pellet re-suspended in approximately 4 ml of 70% Percoll, then transferred in 15 ml conical tube, carefully overlayed with 4 ml of 30% Percoll and centrifuged 1600 rpm for 25 min with the brake turned off. The non-parenchymal cells suspension from the Percoll interface were removed and mixed with 10 mL of RPMI-1640 containing 10% FBS and the cells were centrifuged at 1600 rpm for 5 min. Red blood cells (RBC) were removed from the pelleted single cell suspensions of livers non-parenchymal cells by incubation in an ammonium chloride -based 1x RBC lysis buffer (Thermofisher, eBioscience). The cells were again pelleted and mixed with FACS buffer (2% BSA, 2mM EDTA in PBS), then stained with Zombie-NIR viability dye (BioLegend) per manufacturer’s instructions to discriminate live vs dead cells. To prevent non-specific Fc binding, the cells were incubated with Fc Block (anti-mouse CD16/32, clone 93, Biolegend) for 15 min followed by the indicated antibodies cocktail for 60 min in the dark on ice: CD45 (FITC, clone S18009F, Biolegend), CD11b (BVC421, clone M1/70, Biolegend), F4/80 (APC, clone BM8, Biolegend), TIM4 (PerCP/Cy5.5, clone RMT4-54, Biolegend), Ly6C (PE, clone HK1.4, Biolegend), MHCII (BV605, clone M5/114.15.2, Biolegend), CD11c (BV785, clone N418, Biolegend) and Ly6G (PE/Cy7, clone 1A8, Biolegend). After surface staining, cells were fixed with a paraformaldehyde-based fixation buffer (BioLegend). Flow cytometric acquisition was performed on a BD Fortessa X20 flow cytometer (BD Biosciences) and data analyzed using FlowJo software (Version 10.8.1; Tree Star Inc).
Glucose tolerance test
Intraperitoneal glucose tolerance tests were performed by injection of 1 mg glucose per gram body mass at least 6 days prior to sacrifice. Mice were fasted for 4 hours prior glucose injection. Blood glucose was measured 30 minutes before glucose injection and at 0, 15, 30, 60, 90, and 120 minutes after injection via tail bleed with a handheld glucometer (Bayer Contour 7151H).
Pyruvate tolerance test
Pyruvate tolerance tests were performed by injection of 2 mg pyruvate per gram of body mass in PBS adjusted to pH 7.3-7.5 at least 6 days prior to sacrifice. Blood glucose was measured 30 minutes before pyruvate injection and at 0, 15, 30, 45, 60, 75, 90, 105, and 120 minutes after injection via tail bleed with a handheld glucometer (Bayer Contour 7151H).
Electron microscopy
To examine mitochondrial ultrastructure and microstructures, freshly dissected liver tissues from CLS-LKO and their controls were sectioned into ≈2 mm pieces and processed by the Electron Microscopy Core at University of Utah. To maintain the ultrastructure of the tissue via irreversible cross-link formation, each section was submerged in fixative solution (1% glutaraldehyde, 2.5% paraformaldehyde, 100 mM cacodylate buffer pH 7.4, 6 mM CaCl2, 4.8% sucrose) and stored at 4°C for 48 hours. Samples then underwent 3 × 10-minute washes in 100 mM cacodylate buffer (pH 7.4) prior to secondary fixation (2% osmium tetroxide) for 1 hour at room temperature. Osmium tetroxide as a secondary fixative has the advantage of preserving membrane lipids, which are not preserved using aldehyde, alone. After secondary fixation, samples were subsequently rinsed for 5 minutes in cacodylate buffer and distilled H2O, followed by prestaining with saturated uranyl acetate for 1 hour at room temperature. After prestaining, each sample was dehydrated with a graded ethanol series (2 × 15 minutes each: 30%, 50%, 70%, 95%; then 3 × 20 minutes each: 100%) and acetone (3 × 15 minutes) and were infiltrated with EPON epoxy resin (5 hours 30%, overnight 70%, 3 × 2-hour 40 minute 100%, 100% fresh for embed). Samples were then polymerized for 48 hours at 60°C. Ultracut was performed using Leica UC 6 ultratome with sections at 70 nm thickness and mounted on 200 mesh copper grids. The grids with the sections were stained for 20 minutes with saturated uranyl acetate and subsequently stained for 10 minutes with lead citrate. Sections were examined using a JEOL 1200EX transmission electron microscope with a Soft Imaging Systems MegaView III CCD camera.
Histochemistry
A fresh liver tissue was taken from each mouse and immediately submerged in 4% paraformaldehyde for 12 hours and then 70% ethanol for 48 hours. Tissues were sectioned at 10-μm thickness, embedded in paraffin, and stained for Masson’s Trichrome to assess fibrosis or hematoxylin and eosin (H&E) to determine fat droplet accumulation. Samples were imaged on Axio Scan Z.1 (Zeiss).
Native PAGE
Isolated mitochondria (100 μg) suspended in MIM were pelleted at 12,000 x g for 15 min and subsequently solubilized in 20 μL sample buffer (5 μL of 4x Native Page Sample Buffer, 8 μL 10% digitonin, 7 μL ddH2O per sample) for 20 min on ice and then centrifuged at 20,000 x g for 30 mins at 4°C. 15 μL of the supernatant (75 μg) was collected and placed into a new tube and mixed with 2 μL of G-250 sample buffer additive. Dark blue cathode buffer (50 mLs 20X Native Page running buffer, 50 mLs 20x cathode additive, 900 mLs ddH2O) was carefully added to the front of gel box (Invitrogen Mini Gel Tank A25977) and anode buffer (50 mLs 20x Native Page running buffer to 950 mL ddH2O) was carefully added to the back of the gel box making sure to not mix. The samples were then loaded onto a native PAGE 3-12% Bis-Tris Gel (BN1001BOX, Thermo Fisher Scientific), and electrophoresis was performed at 150 V for 1 hour on ice. The dark blue cathode buffer was carefully replaced with light blue cathode buffer (50 mLs 20X Native Page running buffer, 5 mL 20X cathode additive to 945 mLs ddH2O) and run at 30 V overnight at 4°C. Gels were subsequently transferred to PVDF at 100 V, fixed with 8% acetic acid for 5 min, washed with methanol, and blotted with the following primary antibodies Anti-GRIM19 (mouse monoclonal; ab110240), Anti-SDHA (mouse monoclonal; ab14715), Anti-UQCRFS1 (mouse monoclonal; ab14746), Anti-MTCO1 (mouse monoclonal; ab14705), Anti-ATP5a (mouse monoclonal; ab14748), Anti-NDUFA9 (mouse monoclonal; ab14713) in 5% non-fat milk in TBST. Secondary anti-mouse HRP antibody listed in the key resources table and Western Lightning Plus-ECL (PerkinElmer NEL105001) was used to visualize bands.
Isolation of mitochondrial and cytosolic fractions
Liver tissues were minced in ice-cold mitochondrial isolation medium (MIM) buffer [300 mM sucrose, 10 mM Hepes, 1 mM EGTA, and bovine serum albumin (BSA; 1 mg/ml) (pH 7.4)] and gently homogenized with a Teflon pestle. To remove excess fat in the samples, an initial high-speed spin was performed on all samples: homogenates were centrifuged at 12,000 x g for 10 mins at 4°C, fat emulsion layers were removed and discarded, and resulting pellets were resuspended in MIM + BSA. Samples were then centrifuged at 800 x g for 10 min at 4°C. The supernatants were then transferred to fresh tubes and centrifuged again at 1,300 x g for 10 min at 4°C. To achieve the mitochondrial fraction (pellet), the supernatants were again transferred to new tubes and centrifuged at 12,000 x g for 10 min at 4°C. The resulting crude mitochondrial pellets were washed three times with 0.15 M KCl to remove catalase, and then spun a final time in MIM. The final mitochondrial pellets were resuspended in MIM buffer for experimental use. For cytosolic fraction, the supernatant from 12,000 x g spin was ultracentrifuged at 180,000 x g for 16 hours in a fixed angle rotor (FIBERLite, F50L-24x1.5). The top half of the supernatant was collected as analyzed as the cytosolic fraction for western blotting analyses.
Mitochondrial respiration measurements
Mitochondrial O2 utilization was measured using Oroboros O2K Oxygraphs. Isolated mitochondria (50 μg for TCA substrate respiration and 100 μg for fatty acid respiration) were added to the oxygraph chambers containing assay buffer Z (MES potassium salt 105 mM, KCl 30 mM, KH2PO4 10 mM, MgCl2 5 mM, BSA 1 mg/ml). Respiration was measured in response to the following substrates: 0.5 mM malate, 5 mM pyruvate, 2.5 mM ADP, 10 mM succinate, 1.5 μM FCCP, 0.02 mM palmitoyl-carnitine, 0.5 mM malate.
Mitochondrial JH2O2
Mitochondrial H2O2 production was determined in isolated mitochondria from liver tissue using the Horiba Fluoromax-4/The Amplex UltraRed (10 μM)/horseradish peroxidase (3 U/ml) detection system (excitation/emission, 565:600, HORIBA Jobin Yvon Fluorolog) at 37°C. Mitochondrial protein was placed into a glass cuvette with buffer Z supplemented with 10 mM Amplex UltraRed (Invitrogen), 20 U/mL CuZn SOD). Since liver tissue is capable of producing resorufin from amplex red (AR), without the involvement of horseradish peroxidase (HRP) or H2O2, phenylmethylsulfonyl fluoride (PMSF) was included to the experimental medium due to its ability to inhibit HRP-independent conversion of AR to resorufin.63 PMSF was added to the cuvette immediately prior to measurements and at a concentration that does not interfere with biological measurements (100 μM).63 A 5-min background rate was obtained before adding 10 mM succinate to the cuvette to induce H2O2 production. After 4 min, 100 μM 1,3-bis(2-chloroethyl)-1-nitrosourea (BCNU) was added to the cuvette with 1 μM auranofin to inhibit glutathione reductase and thioredoxin reductase, respectively. After an additional 4 min, the assay was stopped, and the appearance of the fluorescent product was measured.
Site-specific electron leak was measured by systematically stimulating each site while inhibiting the other three.54 Site IF was investigated in the presence of 4 mM malate, 2.5 mM ATP, 5 mM aspartate, and 4 μM rotenone; site IQ was measured as a 4 μM rotenone-sensitive rate in the presence of 5 mM succinate; site IIIQO was measured as a 2 μM myxothiazol-sensitive rate in the presence of 5 mM succinate, 5 mM malonate, 4 μM rotenone, and 2 μM antimycin A; and site IIF was measured as the 1 mM malonate-sensitive rate in the presence of 0.2 mM succinate and 2 μM myxothiazol. As previously mentioned, electron leak is quantified using Amplex Red in the presence of excess superoxide dismutase, such that both superoxide and hydrogen peroxide production are accounted for by a change in fluorescence intensity (JH2O2) using high-resolution fluorometry (Horiba Fluoromax4®).
Lipid mass spectrometry for reduced and oxidized CoQ
Liver tissue was homogenized in ice cold isolation buffer (250 mM sucrose, 5 mM Tris-HCl, 1 mM EGTA, 0.1% fatty acid free BSA, pH 7.4, 4°C) using a tissuelyser. Mitochondria were then isolated via differential centrifugation (800 x g for 10 min, 1300 x g for 10 min, 12,000 x g for 10 min at 4°C), flushing each step under a stream nitrogen to prevent oxidation. Protein content was determined by bicinchoninic acid assay using the Pierce BCA protein assay with bovine serum albumin as a standard. To extract CoQ from mitochondria, incubations of 100 μg mitochondrial protein in 250 μL ice-cold acidified methanol, 250 μL hexane, and 1146 pmol per sample of CoQ standard (Cambridge Isotope Laboratories, CIL DLM-10279) were vortexed. The CoQ-containing hexane layer was separated by centrifugation (10 min, 17,000 x g, 4°C) and then dried down under a stream of nitrogen. Dried samples were then resuspended in methanol containing 2 mM ammonium formate and transferred to 1.5 mL glass mass spectrometry vials. Liquid chromatography-mass spectrometry (LC-MS/MS) was then performed on the reconstituted lipids using an Agilent 6530 UPLC-QTOF mass spectrometer.
U-13C-glucose and U-13C-palmitate labeling in hepa1-6 cell line
Stable isotope tracing experiments were conducted using U-13C-glucose or U-13C-palmitate to assess metabolic fluxes in hepa1-6 cells with or without CLS knockdown. Cells were incubated in either U-13C-glucose or U-13C-palmitate for 4 hours. For palmitate incubations, U-13C-palmitate was conjugated to fatty acid-free bovine serum albumin (BSA) and supplemented with 1 mM carnitine prior to being added to the culture medium. Following the 4-hour incubation period, cells were washed once with 1 mL of ice-cold Dulbecco’s Phosphate Buffered Saline (dPBS) and then scraped in 0.7 mL ice-cold dPBS. The cells were pelleted by centrifugation at 500 x g for 5 minutes at 4°C, and the supernatant was carefully removed. Cell pellets were resuspended in 215 μL of ice-cold dPBS and sonicated on ice using a 1/8” probe sonicator at 30% amplitude for 6 seconds. Debris was lightly pelleted by centrifugation at 500 x g for 2 minutes at 4°C. From the resulting supernatant, 25 μL was transferred to a separate tube for protein quantification using the bicinchoninic acid (BCA) assay. Samples incubated with U-13C-glucose were submitted for gas chromatography-mass spectrometry (GC-MS) and liquid chromatography-mass spectrometry (LC-MS) analysis, while those incubated with U-13C-palmitate were submitted for GC-MS analysis only.
GC-MS
All GC-MS analysis was performed with an Agilent 5977b GC-MS MSD-HES and an Agilent 7693A automatic liquid sampler. Dried samples were suspended in 40 μL of a 40 mg/mL O-methoxylamine hydrochloride (MOX) (MP Bio #155405) in dry pyridine (EMD Millipore #PX2012-7) and incubated for one hour at 37 °C in a sand bath. 25 μL of this solution was added to auto sampler vials. 60 μL of N-methyl-N-trimethylsilyltrifluoracetamide (MSTFA with 1% TMCS, Thermo #TS48913) was added automatically via the auto sampler and incubated for 30 minutes at 37 °C. After incubation, samples were vortexed and 1 μL of the prepared sample was injected into the gas chromatograph inlet in the split mode with the inlet temperature held at 250 °C. A 10:1 split ratio was used for analysis for most metabolites. Any metabolites that saturated the instrument at the 10:1 split was analyzed at a 100:1 split ratio. The gas chromatograph had an initial temperature of 60 °C for one minute followed by a 10 °C/min ramp to 325 °C and a hold time of 10 minutes. A 30-meter Agilent Zorbax DB-5MS with 10 m Duraguard capillary column was employed for chromatographic separation. Helium was used as the carrier gas at a rate of 1 mL/min.
Data were collected using MassHunter software (Agilent). Metabolites were identified and their peak area was recorded using MassHunter Quant. This data was transferred to an Excel spread sheet (Microsoft, Redmond WA). Metabolite identity was established using a combination of an in-house metabolite library developed using pure purchased standards, the NIST library and the Fiehn library. There are a few reasons a specific metabolite may not be observable through GC-MS.
LC-MS
A pooled quality control (QC) sample for each sample type was prepared by combining 10 μL of each sample. Samples were randomized prior to analysis. A SCIEX 7600 Zeno-ToF (AB SCIEX LLC, Framingham, MA, USA) coupled to an Agilent 1290 Infinity II HPLC system in positive-ionization modes was used for analysis. Separation was achieved using a Waters BEH zhilic 2.1 x 100 mm column (Waters Corporation, Milford, MA, USA) with Phenomenex Krudkatcher Ultra (Phenomenex, Torrence, CA, USA). Buffers consisted of 99% ACN with 5% ddH2O (buffer B) and 5% 25 mM ammonium carbonate in ddH2O (buffer A). An initial concentration of 99% buffer B was decreased to 85% over 2 min, then further decreased to 75%, and 60% over 3-minute intervals. Next, buffer B was decreased to 40% and held for 1 min. Then Buffer B was decreased to 1% and held for 1 min. Eluents were returned to initial conditions over 0.1 min, and the system was allowed to equilibrate for 5 min between runs. Mass spectrometry analysis was performed by high-resolution multiple reaction monitoring (MRM HR).
Data was collected using SCIEX analyst. Chromatogram integration was performed using SCIEX MultiQuant. This data was transferred to an Excel spread sheet (Microsoft, Redmond WA). Statistical analysis was performed using Microsoft Excel Data Analysis add-in. The metabolite lists were curated to the metabolites of interest for the researcher as applicable. Metabolite identity was established using a combination of an in-house metabolite library developed using pure purchased standards and the human metabolite data base (hmdb.ca). Isotope correction was performed using in-house software.
Mitochondrial phospholipids enrichment
Isolated mitochondria (500 μg) from 2-month-old mice were incubated in fusion buffer [220 mM mannitol, 70 mM sucrose, 2 mM Hepes, 10 mM KH2PO4, 5 mM MgCl2, 1 mM EGTA, 10 mM glutamate, 2 mM malate, 10 mM pyruvate, and 2.5 mM ADP (pH 6.5)] for 20 min at 30°C under constant stirring agitation in the presence of 15 nmol of small unilamellar vesicles (SUVs) (CL from Avanti Polar Lipids, 840012; PC from Avanti Polar Lipids, 850375C). After fusion, mitochondria were layered on a sucrose gradient (0.6 M) and centrifuged 10 min at 10,000g at 4°C to remove SUV. Pellet was then washed in mitochondrial buffer [250 mM sucrose, 3 mM EGTA, and 10 mM tris-HCl, (pH 7.4)].
Serum AST and ALT
Mice were sacrificed by CO2 inhalation and blood samples collected via cardiac puncture into heparin-coated tubes and centrifuged for collection of plasma within 1 hour of blood collection and frozen at −80°C until analysis. Plasma samples from mice were processed in a single batch for determination of serum alanine aminotransferase (ALT) and aspartate aminotransferase (AST) levels using a DC Element chemistry analyser (HESKA).
Quantification and statistical analyses
The level of significance was set at p < 0.05. Student’s T tests were used to determine the significance between experimental groups and two-way ANOVA analysis followed by a within-row pairwise comparison post hoc test where appropriate. For Student’s T tests, Gaussian distribution was assumed as well as assuming both populations had the same standard deviation. The sample size (n) for each experiment is shown in the figure legends and corresponds to the sample derived from the individual mice or for cell culture experiments on an individual batch of cells. Unless otherwise stated, statistical analyses were performed using GraphPad Prism software.
Extended Data
Extended Data Fig. 1. Mitochondrial phospholipidome from Figure 1j,k.

(a) Abundance of mitochondrial CL in liver of mice fed with standard chow or HFD for 16 wks (n=5 per group). (b) Abundance of mitochondrial PC in liver of mice fed standard chow or HFD for 16 wks (n=5 per group). (c) Abundance of mitochondrial PE in liver of mice fed with standard chow or HFD for 16 wks (n=5 per group). (d) Abundance of mitochondrial PI in liver of mice fed with standard chow or HFD for 16 wks (n=5 per group). (e) Abundance of mitochondrial PS in liver of mice fed with standard chow or HFD for 16 wks (n=5 per group). (f) Abundance of mitochondrial LPC in liver of mice fed with standard chow or HFD for 16 wks (n=5 per group). (g) Abundance of mitochondrial PG in liver of mice fed with standard chow or HFD for 16 wks (n=5 per group). (h) Abundance of mitochondrial LPE in liver of mice fed with standard chow or HFD for 16 wks (n=5 per group). (i) Abundance of mitochondrial CL in liver from wildtype or leptin-deficient mice, 30 wks old (n=6 per group). (j) Abundance of mitochondrial PC in liver from wildtype or leptin-deficient mice, 30 wks old (n=6 per group). (k) Abundance of mitochondrial PE in liver from wildtype or leptin-deficient mice, 30 wks old (n=6 per group). (l) Abundance of mitochondrial PI in liver from wildtype or leptin-deficient mice, 30 wks old (n=6 per group). (m) Abundance of mitochondrial PS in liver from wildtype or leptin-deficient mice, 30 wks old (n=6 per group). (n) Abundance of mitochondrial LPC in liver from wildtype or leptin-deficient mice, 30 wks old (n=6 per group). (o) Abundance of mitochondrial PG in liver from wildtype or leptin-deficient mice, 30 wks old (n=6 per group). (p) Abundance of mitochondrial LPE in liver from wildtype or leptin-deficient mice, 30 wks old (n=6 per group). Statistical significance was determined by 2-way ANOVA with a within-row pairwise comparison. Data represent mean ± SEM. Measurements taken from a-h were taken from the same samples. Measurements from i-p were taken from the same samples.
Extended Data Fig. 2. Mitochondrial phospholipidome from Figure 1l,m.

(a) Abundance of mitochondrial CL in livers from mice injected with corn oil or carbon tetrachloride for 10 wks (n=5 and 7 per group). (b) Abundance of mitochondrial PC in livers from mice injected with corn oil or carbon tetrachloride for 10 wks (n=5 and 7 per group). (c) Abundance of mitochondrial PE in livers from mice injected with corn oil or carbon tetrachloride for 10 wks (n=5 and 7 per group). (d) Abundance of mitochondrial PI in livers from mice injected with corn oil or carbon tetrachloride for 10 wks (n=5 and 7 per group). (e) Abundance of mitochondrial PS in livers from mice injected with corn oil or carbon tetrachloride for 10 wks (n=5 and 7 per group). (f) Abundance of mitochondrial LPC in livers from mice injected with corn oil or carbon tetrachloride for 10 wks (n=5 and 7 per group). (g) Abundance of mitochondrial PG in livers from mice injected with corn oil or carbon tetrachloride for 10 wks (n=5 and 7 per group). (h) Abundance of mitochondrial LPE in livers from mice injected with corn oil or carbon tetrachloride for 10 wks (n=5 and 7 per group). (i) Abundance of mitochondrial CL in livers from mice fed standard chow or Gubra-Amylin MASH diet for 30 wks (n=6 per group). (j) Abundance of mitochondrial PC in livers from mice fed standard chow or Gubra-Amylin MASH diet for 30 wks (n=6 per group). (k) Abundance of mitochondrial PE in livers from mice fed standard chow or Gubra-Amylin MASH diet for 30 wks (n=6 per group). (l) Abundance of mitochondrial PI in livers from mice fed standard chow or Gubra-Amylin MASH diet for 30 wks (n=6 per group). (m) Abundance of mitochondrial PS in livers from mice fed standard chow or Gubra-Amylin MASH diet for 30 wks (n=6 per group). (n) Abundance of mitochondrial LPC in livers from mice fed standard chow or Gubra-Amylin MASH diet for 30 wks (n=6 per group). (o) Abundance of mitochondrial PG in livers from mice fed standard chow or Gubra-Amylin MASH diet for 30 wks (n=6 per group). (p) Abundance of mitochondrial LPE in livers from mice fed standard chow or Gubra-Amylin MASH diet for 30 wks (n=6 per group). Statistical significance was determined by 2-way ANOVA with a within-row pairwise comparison. Data represent mean ± SEM. Measurements from a-h were taken from the same samples. Measurements from i-p were taken from the same samples.
Extended Data Fig. 3. Mitochondrial phospholipidome from standard chow or high-fat diet fed control and CLS-LKO livers.

(a) Abundance of mitochondrial PC in liver from control or CLS-LKO mice with standard chow, 8 wks old (n=5 and 6 per group). (b) Abundance of mitochondrial PE in liver from control or CLS-LKO mice fed with standard chow, 8 wks old (n=5 and 6 per group). (c) Abundance of mitochondrial PI in liver from control or CLS-LKO mice fed with standard chow, 8 wks old (n=5 and 6 per group). (d) Abundance of mitochondrial PS in liver from control or CLS-LKO mice fed with standard chow, 8 wks old (n=5 and 6 per group). (e) Abundance of mitochondrial LPC in liver from control or CLS-LKO mice fed with standard chow, 8 wks old (n=5 and 6 per group). (f) Abundance of mitochondrial PG in liver from control or CLS-LKO mice fed with standard chow, 8 wks old (n=5 and 6 per group). (g) Abundance of mitochondrial LPE in liver from control or CLS-LKO mice fed with standard chow, 8 wks old (n=5 and 6 per group). (h) Abundance of mitochondrial CL in liver from control or CLS-LKO mice fed a high-fat diet for 8 wks (n=11 and 12 per group). (i) Abundance of mitochondrial PC in liver from control or CLS-LKO mice fed a high-fat diet for 8 wks (n=11 and 12 per group). (j) Abundance of mitochondrial PE in liver from control or CLS-LKO mice fed a high-fat diet for 8 wks (n=11 and 12 per group). (k) Abundance of mitochondrial PI in liver from control or CLS-LKO mice fed a high-fat diet for 8 wks (n=11 and 12 per group). (l) Abundance of mitochondrial PS in liver from control or CLS-LKO mice fed a high-fat diet for 8 wks (n=11 and 12 per group). (m) Abundance of mitochondrial LPC in liver from control or CLS-LKO mice fed a high fat diet for 8 wks (n=11 and 12 per group). (n) Abundance of mitochondrial PG in liver from control or CLS-LKO mice fed a high-fat diet for 8 wks (n=11 and 12 per group). (o) Abundance of mitochondrial LPE in liver from control or CLS-LKO mice fed a high fat diet for 8 wks (n=11 and 12 per group). Statistical significance was determined by 2-way ANOVA with a within-row pairwise comparison. Data represent mean ± SEM. Measurements from a-g were taken from the same samples. Measurements from h-o were taken from the same samples.
Extended Data Fig. 4. Additional histological and transcriptomic data from control and CLS-LKO mice.
(a) Representative H&E staining of livers from control and CLS-LKO mice fed a HFD for 8 wks. (b) Representative Masson’s Trichrome staining of livers from control and CLS-LKO mice fed a HFD for 8 wks. (c) Volcano plot of differentially expressed genes in livers taken from control and CLS-LKO mice fed with standard chow (n=5 and 7 per group). (d) Pathway analysis of transcriptomic data in livers taken control and CLS-LKO mice fed with standard chow (n=5 and 7 per group). Pathway analysis was performed using the Reactome Pathway Database. Measurements from a and b were taken from distinct samples. Measurements from c and d were taken from the same samples.
Extended Data Fig. 5. Additional metabolic, mitochondrial, and fluxomic phenotyping data with CLS deletion.
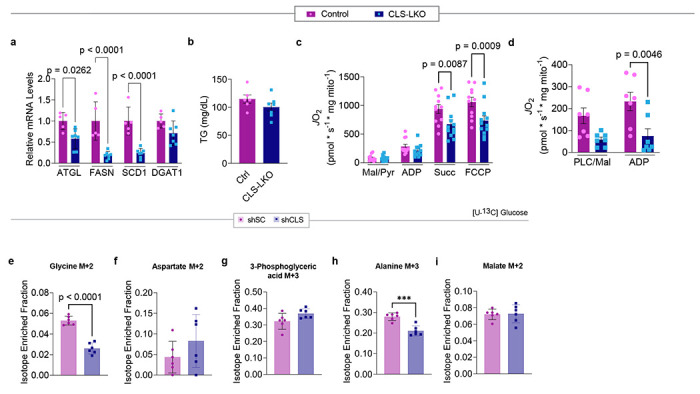
(a) mRNA levels of lipogenic genes in livers from control and CLS-LKO mice fed with standard chow (n=6 and 7 per group). (b) Serum triglycerides for control and CLS-LKO mice fed with standard chow (n=6 and 7 per group). (c) JO2 consumption in isolated liver mitochondria from control or CLS-LKO mice fed a HFD for 8 wks in response to 0.5 mM malate, 5 mM pyruvate, 2.5 mM ADP, 10 mM succinate, and 1.5 μM FCCP (n=11 and 12 per group). (d) JO2 consumption in isolated liver mitochondria from control or CLS-LKO mice fed a HFD for 8 wks in response to 0.02 mM palmitoyl-carnitine, 0.5 mM malate, and 2.5 mM ADP (n=7 per group). (e) Levels of labeled glycine from glucose tracing in hepa1-6 cells without (shSC) or with CLS deletion (shSLC) (n=6 per group). (f) Levels of labeled aspartate from glucose tracing in hepa1-6 cells without (shSC) or with CLS deletion (shSLC) (n=6 per group). (g) Levels of labeled 3-phosphoglyceric acid from glucose tracing in hepa1-6 cells without (shSC) or with CLS deletion (shSLC) (n=6 per group). (h) Levels of labeled alanine from glucose tracing in hepa1-6 cells without (shSC) or with CLS deletion (shSLC) (n=6 per group). (i) Levels of labeled malate from glucose tracing in hepa1-6 cells without (shSC) or with CLS deletion (shSLC) (n=6 per group). Statistical significance was determined by 2-way ANOVA with a within-row pairwise comparison (a, c, and d) and unpaired Student’s T test (b, and e-i). Data represent mean ± SEM. Measurements from a and b were taken from distinct samples. Measurements from c and d were taken from the same samples. Measurements from e-i were taken from the same samples.
Extended Data Fig. 6. Additional mitochondrial phenotyping data with CLS deletion.
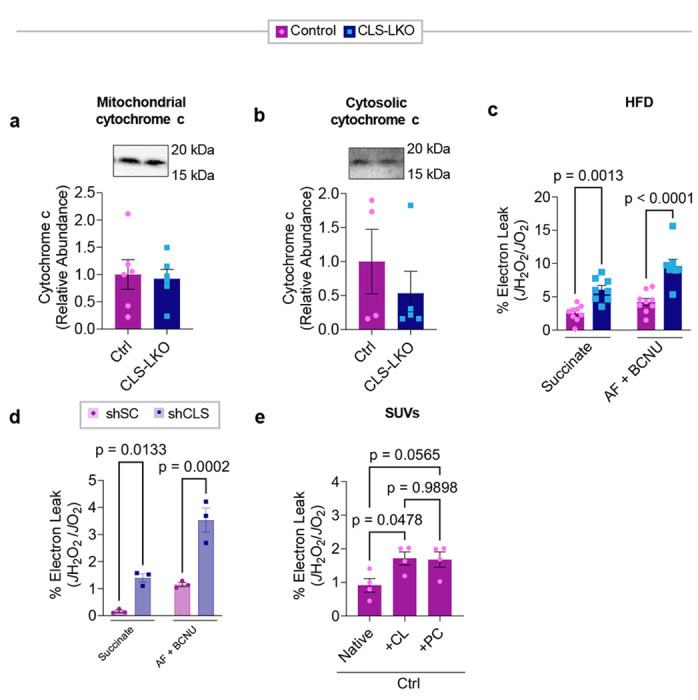
(a) Levels of mitochondrial cytochrome c in livers of control and CLS-LKO mice fed a HFD for 8 wks (n=6 per group). (b) Levels of cytosolic cytochrome c in livers of control and CLS-LKO mice fed a HFD for 8 wks (n=6 per group). (c) H2O2 emission and production in isolated liver mitochondria from control or CLS-LKO mice fed a HFD for 8 wks, stimulated with succinate, or succinate and auranofin and BCNU (n=9 and 8 per group). (d) H2O2 emission and production in isolated liver mitochondria from hepa1-6 cells without (shSC) or with CLS deletion (shSLC), stimulated with succinate, or succinate and auranofin and BCNU (n=3 per group). (e) Electron leak of liver mitochondria from control mice fused with SUVs (n=4 per group). Statistical significance was determined by 2-way ANOVA with a within-row pairwise comparison (c, d, and e) and unpaired Student’s T test (a and b). Measurements from a and b were taken from the same samples. Measurements from c, d, and e were taken from distinct samples.
Extended Data Fig. 7. Additional data on coenzyme Q.

(a) Total CoQ8 levels in whole liver tissue from control and CLS-LKO mice (n=7 per group). (b) Total CoQ9 levels in whole liver tissue from control and CLS-LKO mice (n=7 per group). (c) Total CoQ10 levels in whole liver tissue from control and CLS-LKO mice (n=7 per group). (d) Oxidized CoQ8 levels in whole liver tissue from control and CLS-LKO mice (n=7 per group). (e) Reduced CoQ8 levels in whole liver tissue from control and CLS-LKO mice (n=7 per group). (f) Oxidized CoQ9 levels in whole liver tissue from control and CLS-LKO mice (n=7 per group). (g) Reduced CoQ9 levels in whole liver tissue from control and CLS-LKO mice (n=7 per group). (h) Oxidized CoQ10 levels in whole liver tissue from control and CLS-LKO mice (n=7 per group). (i) Reduced CoQ10 levels in whole liver tissue from control and CLS-LKO mice (n=7 per group). (j) Oxidized CoQ8 levels in isolated mitochondria from control and CLS-LKO mice (n=7 per group). (k) Reduced CoQ8 levels in isolated mitochondria from control and CLS-LKO mice (n=7 per group). (l) Oxidized CoQ9 levels in isolated mitochondria from control and CLS-LKO mice (n=7 per group). (m) Reduced CoQ9 levels in isolated mitochondria from control and CLS-LKO mice (n=7 per group). (n) Oxidized CoQ10 levels in isolated mitochondria from control and CLS-LKO mice (n=7 per group). (o) Reduced CoQ10 levels in isolated mitochondria from control and CLS-LKO mice (n=7 per group). Statistical significance was determined by unpaired Student’s T test. Data represent mean ± SEM. Measurements from a-c were taken from the same samples. Measurements from d-i and j-o were taken from the same samples.
Extended Data Table 1.
Patient demographic information
| Healthy | MASH | |
|---|---|---|
| Age at time of collection | 50.3 ± 9.6 yrs | 62.2 ± 7.1 yrs |
| Sex | Male: 1 Female: 10 |
Male: 9 Female: 8 |
| Alcohol use? | N/A | Yes: 0 No: 17 |
| Race | White: 9 African American: 1 Asian: 1 |
White: 10 Unknown: 7 |
Extended Data Table 2.
Reagents and resources
| REAGENT or RESOURCE | SOURCE | IDENTIFIER |
|---|---|---|
| Antibodies | ||
| GRIM19 | Abcam | ab110240 |
| SDHA | Abcam | ab14715 |
| UQCRFS1 | Abcam | ab14746 |
| MTCO1 | Abcam | ab14705 |
| ATP5a | Abcam | Ab14748 |
| NDUFA9 | Abcam | Ab14713 |
| Total OxPhos Antibody cocktail | Abcam | MS604-300 |
| Citrate Synthetase | Abcam | Ab96600 |
| Cytochrome c | Cell Signaling | 11940S |
| Caspase-3 | Cell Signaling | 9661S |
| Caspase-7 | Cell Signaling | 9491S |
| CD16/32 (Fc Block, clone 93) | Biolegend | 101308 |
| CD45 (FITC, clone S18009F) | Biolegend | 157214 |
| CD11b (BVC421, clone M1/70) | Biolegend | 101202 |
| F4/80 (APC, clone BM8) | Biolegend | 123102 |
| TIM4 (PerCP/Cy5.5, clone RMT4-54) | Biolegend | 130020 |
| Ly6C (PE, clone HK1.4) | Biolegend | 128008 |
| MHCII (BV605, clone M5/114.15.2) | Biolegend | 107639 |
| CD11c (BV785, clone N418) | Biolegend | 117302 |
| Ly6G (PE/Cy7, clone 1A8) | Biolegend | 164504 |
| OxPhos Blue Native WB Antibody Cocktail | ThermoFisher | 45-7999 |
| Bacterial and virus strains | ||
| Second-generation lentiviral-mediated knockdown system | ||
| NEB Stable Competent E. Coli | NEB | C3040H |
| Biological samples | ||
| Chemicals, peptides, and recombinant proteins | ||
| Amplex Red Reagent | ThermoFisher Scientific | A12222 |
| Auranofin | Sigma Aldrich | A6733 |
| Carmustine (BCNU) | Sigma Aldrich | C0400 |
| SPLASH Mix | Avanti Polar Lipids | 330707 |
| Cardiolipin Mix I | Avanti Polar Lipids | LM6003 |
| Bovine Serum Albumin | Sigma Aldrich | A7030 |
| Protease Inhibitor Cocktail | Thermo Scientific | 78446 |
| Tamoxifen | Sigma Aldrich | T5648 |
| Sunflower Oil | Sigma Aldrich | S5007 |
| TRIzol | Thermo Scientific | 15596018 |
| Mini-PROTEAN TGX Gels | BioRad | 4561086 |
| ECL | PerkinElmer | 104001EA |
| Malate | Sigma Aldrich | M7397 |
| Pyruvate | Sigma Aldrich | P2256 |
| GDP | Sigma Aldrich | G7127 |
| CL 316,243 hydrate | Sigma Aldrich | C5976 |
| ADP | Sigma Aldrich | A5285 |
| ATP | Sigma Aldrich | A9187 |
| Glutamate | Sigma Aldrich | G5889 |
| Succinate | Sigma Aldrich | S3674 |
| Carnitine | Sigma Aldrich | 8.40092 |
| Palmitoyl-CoA | Sigma Aldrich | P9716 |
| Palmitoyl-L-carnitine | Sigma Aldrich | P1645 |
| SYBR Green | Thermo Scientific | A25776 |
| 4% Paraformaldehyde | Thermo | J19943-K2 |
| Opti-MEM | Gibco | 31985 |
| DMEM | Gibco | 1195-092 |
| FBS | Gibco | 10082-147 |
| Penicillin-streptomycin | Gibco | 15140122 |
| CL for SUVs | Avanti Polar Lipids | 840012 |
| PC for SUVs | Avanti Polar Lipids | 850375C |
| PAGE 3-12% Bis-Tris Gels | Thermo Scientific | BN1001BOX |
| NativePage 20x Cathode Buffer | Invitrogen | BN2002 |
| NativePage 5% G-250 Sample additive | Invitrogen | BN2004 |
| Nativepage 4x Sample Buffer | Invitrogen | BN2003 |
| CoQ Standard | Cambridge Isotope Labs | CIL DLM-10279 |
| Palmitic acid (U-13C16) | Cambridge Isotope Labs | CLM-409-0.1 |
| D-Glucose ((U-13C6) | Cambridge Isotope Labs | CLM-1396-5 |
| Critical commercial assays | ||
| Pierce BCA Protein Assay Kit | Thermo Scientific | 23227 |
| iScript cDNA Synthesis Kit | BioRad | 1708891 |
| SDH Detection Assay Kit | Abcam | ab228560 |
| Direct-zol RNA Miniprep Plus Kit | Zymo | R2070 |
| DNeasy Blood and Tissue Kit | Qiagen | 69504 |
| Deposited data | ||
| Experimental models: Cell lines | ||
| HEK293T cells | ATCC | CTRL-3216 |
| Hepa 1-6 murine hepatoma cells | ATCC | CRL-1830 |
| Experimental models: Organisms/strains | ||
| Mouse: CLS conditional knockout (CLS-cKO) | Sustarsic et al. 2018 | N/A |
| Mouse: CLS-LKO | This paper | N/A |
| Mouse: Alb-Cre | Jackson Laboratory | 003574 |
| Oligonucleotides | ||
| RT qPCR Primer ATGL F (CCACTCACATCTACGGAGCC) |
www.IDTDNA.com | |
| RT qPCR Primer ATGL R (TAATGTTGGCACCTGCTTCA) |
www.IDTDNA.com | |
| RT qPCR Primer DGAT1 F (GACGGCTACTGGGATCTGA) |
www.IDTDNA.com | |
| RT qPCR Primer DGAT1 R (TCACAACACACCAATTCAGG) |
www.IDTDNA.com | |
| RT qPCR Primer FAS F (GGATAGCTGTGTAGTGTAACCAT) |
www.IDTDNA.com | |
| RT qPCR Primer FAS R (GGTCATCGTGATAACCACACA) |
www.IDTDNA.com | |
| RT qPCR Primer SCD1 F (GCTCTACACCTGCCTCTTCG) |
www.IDTDNA.com | |
| RT qPCR Primer SCD1 R (CAGCCGAGCCTTGTAAGTTC) |
www.IDTDNA.com | |
| RT qPCR Primer CLS F (TGACCTATGCAGATCTTATTCCA) |
Johnson et al. 2019 | |
| RT qPCR Primer CLS R (TGGCAGAGTTCGGTATCTGA) |
Johnson et al. 2019 | |
| RT qPCR Primer TNFa F (CCACCACGCTCTTCTGTCTAC) |
www.IDTDNA.com | |
| RT qPCR Primer TNFa R (AGGGTCTGGGCCATAGAACT) |
www.IDTDNA.com | |
| RT qPCR Primer Taz F (CCCTCCATGTGAAGTGGCCATTCC) |
Johnson et al. 2019 | |
| RT qPCR Primer Taz R (TGGTGGTTGGAGACGGTGATAAGG) |
Johnson et al. 2019 | |
| mtDNA F: (TTAAGACACCTTGCCTAGCCACAC) | Mouse Primer Depot NCI/NIH |
|
| mtDNA R: (CGGTGGCTGGCACGAAATT) | Mouse Primer Depot NCI/NIH |
|
| nucDNA F: (ATGACGATATCGCTGCGCTG) | Mouse Primer Depot NCI/NIH |
|
| nucDNA R: (TCACTTACCTGGTGCCTAGGGC) | Mouse Primer Depot NCI/NIH |
|
| Recombinant DNA | ||
| Sc | Addgene | 1864 |
| Crls1 | Sigma Aldrich | TRCN0000123937 |
| psPAX2 | Addgene | 12260 |
| pMD2.G | Addgene | 12259 |
| Software and algorithms | ||
| GraphPad Prism 9.0 | GraphPad | N/A |
| Other | ||
Acknowledgements
This research was supported by National Institutes of Health (NIH) grants DK127979, GM144613, DK107397, AG074535 (to KF); DK127603 (to AMP), DK130555 (to ADP); HL170575, DK112826 (to WLH); GM151245 (to SMN), CA278803 (to KHF-W); DK128819, DK115991 (to PNM); CA222570 (to KJE); CA272529, DK130296, DK131609 (to SAS); DK091317 (to MJB, TST, STD), by American Heart Association grants 915674 (to PS) and 19PRE34380991 (to JMJ), by European Research Council (ERC) under the European Union’s Horizon 2020 Research and Innovation Programme (Starting Grant aCROBAT agreement no. 639382 to ZGH), by Damon Runyon Cancer Research Foundation (Damon Runyon-Rachleff Innovation Award DR 61-20 to KJE), by a pilot grant from Washington University DRC P30 DK020579, and by the Huntsman Cancer Foundation. The University of Utah Metabolomics Core Facility is supported by NIH S10 OD016232, S10 OD021505, and U54 DK110858. Research reported in this publication utilized the Huntsman Cancer Institute Biorepository and Molecular Pathology Shared Resources supported by NCI/NIH P30 CA042014. We thank Nikita Abraham and Diana Lim (University of Utah Molecular Medicine Program) for assistance with figures.
Footnotes
Materials availability
Plasmids utilized by this study are available from Sigma Aldrich. Mouse lines generated by this study may be available at personal request from the lead contact. No new reagents were created or used by this study.
Competing Interests
The authors declare no competing interests.
Data and code availability
All data are available in the main text or the Extended Data. Code for RNA sequencing can be retrieved upon request.
References
- 1.Younossi Z.M., et al. Global epidemiology of nonalcoholic fatty liver disease—Meta-analytic assessment of prevalence, incidence, and outcomes. Hepatology 64, 73–84 (2015). [DOI] [PubMed] [Google Scholar]
- 2.Miao L. Giovanni T., Byrne Christopher D; Cao Ying-Ying; Zheng Ming-Hua. Current status and future trends of the global burden of MASLD. Trends in Endocrinology & Metabolism 29, 1043–2760 (2024). [DOI] [PubMed] [Google Scholar]
- 3.Saito K., et al. Characterization of hepatic lipid profiles in a mouse model with nonalcoholic seatohepatitis and subsequent fibrosis. Scientific Reports 5(2015). [DOI] [PMC free article] [PubMed] [Google Scholar]
- 4.John B.S.S. Nonalcoholic Steatohepatitis (NASH). in StatPears (StatPearls Publishing, Treasure Island, 2023). [PubMed] [Google Scholar]
- 5.Vigano L., Lleo A. & Aghemo A. Non-alcoholic fatty liver disease, non-alcoholic steatohepatitis, metabolic syndrome and hepatocellular carcinoma—a composite scenario. Hepatobiliary Surgery and Nutrition 7, 130–133 (2018). [DOI] [PMC free article] [PubMed] [Google Scholar]
- 6.Fan J.-G. & Cao H.-X. Role of diet and nutritional management in non-alcoholic fatty liver disease. Gastroenterology and Hepatology 28, 87–87 (2013). [DOI] [PubMed] [Google Scholar]
- 7.Gordon D.L., et al. Biomarkers of NAFLD progression: a lipidomics approach to an epidemic. Journal of Lipid Research 56, 722–736 (2015). [DOI] [PMC free article] [PubMed] [Google Scholar]
- 8.Fu S., et al. Aberrant lipid metabolism disrupts calcium homeostasis causing liver endoplasmic reticulum stress in obesity. Nature 473, 528–531 (2011). [DOI] [PMC free article] [PubMed] [Google Scholar]
- 9.Simoes I.C.M., Fontes A., Pinton P., Zischka H. & Wieckowski M.R. Mitochondria in non-alcoholic fatty liver disease. The International Journal of Biochemistry & Cell Biology 95, 93–99 (2018). [DOI] [PubMed] [Google Scholar]
- 10.Leveille M. & Estall J.L. Mitochondrial Dysfunction in the Transition from NASH to HCC. Metabolites 9, 233 (2019). [DOI] [PMC free article] [PubMed] [Google Scholar]
- 11.Einer C., et al. Mitochondrial adaptation in steatotic mice. Mitochondrion 59, 483–495 (2018). [DOI] [PubMed] [Google Scholar]
- 12.Sunny N.E., Bril F. & Cusi K. Mitochondrial Adaptation in Nonalcoholic Fatty Liver Disease: Novel Mechanisms and Treatment Strategies. Trends in Endocrinology & Metabolism 28(2018). [DOI] [PubMed] [Google Scholar]
- 13.Noureddin M. & Sanyal A.J. Pathogenesis of NASH: the Impact of Multiple Pathways. Current Hepatology Reports 17, 350–360 (2018). [DOI] [PMC free article] [PubMed] [Google Scholar]
- 14.Pfeiffer K., et al. Cardiolipin stabilizes respiratory chain supercomplexes. Metabolism and Bioenergetics 278, 52873–52880 (2003). [DOI] [PubMed] [Google Scholar]
- 15.Johnson J.M., et al. Targeted overexpression of catalase to mitochondria does not prevent cardioskeletal myopathy in Barth syndrome. Journal of Molecular and Cellular Cardiology 121, 94–102 (2018). [DOI] [PMC free article] [PubMed] [Google Scholar]
- 16.Houtkooper R.H. & Vaz F.M. Cardiolipin, the heart of mitochondrial metabolism. Cell. Mol. Life Sci. 65, 2493–2506 (2008). [DOI] [PMC free article] [PubMed] [Google Scholar]
- 17.Schlame ab M. & Hostetler K.Y. Cardiolipin synthase from mammalian mitochondria. Biochimica et Biophysica Acta (BBA) - Molecular and Cell Biology of Lipids 1348, 207–213 (1997). [DOI] [PubMed] [Google Scholar]
- 18.Paradies G., Paradies V., Ruggiero F.M. & Petrosillo G. Role of Cardiolipin in Mitochondrial Function and Dynamics in Health and Disease: Molecular and Pharmacological Aspects. Cells 8, 728 (2019). [DOI] [PMC free article] [PubMed] [Google Scholar]
- 19.Funai K., Summers S.A. & Rutter J. Reign in the membrane: How common lipids govern mitochondrial function. Current Opinion in Cell Biology 63, 162–173 (2020). [DOI] [PMC free article] [PubMed] [Google Scholar]
- 20.Jussupow A., Luca A.D. & Kaila V.R. How cardiolipin modulates the dynamics of respiratory complex I. Science Advances 5(2019). [DOI] [PMC free article] [PubMed] [Google Scholar]
- 21.Schwall C.T., Greenwood V.L. & Alder N.N. The stability and activity of respiratory Complex II is cardiolipin-dependent. Biochimica et Biophysica Acta (BBA) - Molecular and Cell Biology of Lipids 1817, 1588–1596 (2012). [DOI] [PubMed] [Google Scholar]
- 22.Bazan S., et al. Cardiolipin-dependent Reconstitution of Respiratory Supercomplexes from Purified Saccharomyces cerevisiae Complexes III and IV*. 288, 401–411 (2013). [DOI] [PMC free article] [PubMed] [Google Scholar]
- 23.Dudek J., et al. Cardiolipin deficiency affects respiratory chain function and organization in an induced pluripotent stem cell model of Barth syndrome. Stem Cell Research 11, 806–819 (2013). [DOI] [PubMed] [Google Scholar]
- 24.Sustarsic E.G., et al. Cardiolipin Synthesis in Brown and Beige Fat Mitochondria Is Essential for Systemic Energy Homeostasis. Cell Metab 28, 159–174 (2018). [DOI] [PMC free article] [PubMed] [Google Scholar]
- 25.Jiang F., et al. Absence of cardiolipin in the crd1 null mutant results in decreased mitochondrial membrane potential and reduced mitochondrial function. Journal of Biological Chemistry 275, 22387–22394 (2000). [DOI] [PubMed] [Google Scholar]
- 26.Xu Y., Sutachan J.J., Plesken H., Kelley R.I. & Schlame M. Characterization of lymphoblast mitochondria from patients with Barth syndrome. Laboratory Investigation; a journal of technical methods and pathology 85, 823–830 (2005). [DOI] [PubMed] [Google Scholar]
- 27.Hsu P., et al. Cardiolipin remodeling by TAZ/tafazzin is selectively required for the initiation of mitophagy. Autophagy 11, 643–652 (2015). [DOI] [PMC free article] [PubMed] [Google Scholar]
- 28.Le C.H., et al. Tafazzin deficiency impairs CoA-dependent oxidative metabolism in cardiac mitochondria. Journal of Biological Chemistry 295, 12485–12497 (2020). [DOI] [PMC free article] [PubMed] [Google Scholar]
- 29.Heden T.D., et al. Mitochondrial PE potentiates respiratory enzymes to amplify skeletal muscle aerobic capacity. Science Advances 5, 8352 (2019). [DOI] [PMC free article] [PubMed] [Google Scholar]
- 30.Johnson J.M.P., Alek D; Balderas Enrique; Sustarsic Elahu G; Maschek J Alan; Brothwell Marisa J; Alejandro Jara-Ramos; Panic Vanja; Morgan Jeffrey T; Villanueva Claudio J; Sanchez Alejandro; Rutter Jared; Lodhi Irfan J; Cox James E; Fisher-Wellman Kelsey H; Chaudhuri Dipayan; Gerhart-Hines Zachary; Funai Katsuhiko. Mitochondrial phosphatidylethanolamine modulates UCP1 to promote brown adipose thermogenesis. Science Advances 9, 7864 (2023). [DOI] [PMC free article] [PubMed] [Google Scholar]
- 31.Kartsoli S., Kostara C.E., Tsimihodimos V., Bbairaktari E.T. & Christodoulou D.K. Lipidomics in non-alcoholic fatty liver disease. World Journal of Hepatology 12, 436–450 (2020). [DOI] [PMC free article] [PubMed] [Google Scholar]
- 32.Ehud Zigmond C.V. Two Roads Diverge in the Sick Liver, Monocytes Travel Both. Cell Press 10, 1016 (2020). [DOI] [PubMed] [Google Scholar]
- 33.Zahao X.-A.C., Guang-Mei; Liu Yong; Chen Yu-Xin; Wu Hong-Yan; Chen Jin; Xiong Ya-Li; Tian Chen; Wang Gui-Yang; Jia Bei; Xia Juan; Wang Jian; Yan Xiao-Min; Zhang Zhao-Ping; Huang Rui; Wu Chao. Inhibitory effect of silymarin on CCl4-induced liver fibrosis by reducing Ly6Chi monocytes infiltration. International Journal of Clinical & Experimental Pathology 10, 11941–11951 (2017). [PMC free article] [PubMed] [Google Scholar]
- 34.Daemen S.G., Anastasiia; Kalugotla Gowri; He Li; Chan Mandy M.; Beals Joseph W.: Liss Kim H.; Klein Samuel; Feldstein Ariel E.; Finck Brian N.; Artyomov Maxim N.; Schilling Joel D. Dynamic Shifts in the Composition of Resident and Recruited Macrophages Influence Tissue Remodeling in NASH. Cell Reports 34, 108626 (2021). [DOI] [PMC free article] [PubMed] [Google Scholar]
- 35.Liyanage S.E.G., Peter J.; Ribeiro Joana; Cristante Enrico; Sampson Robert D.; Luhmann Ulrich F.O.; Ali Robin R.; Bainbridge James W. Flow cytometric analysis of inflammatory and resident myeloid populations in mouse ocular inflammatory models. Experimental Eye Research 151, 160–170 (2016). [DOI] [PMC free article] [PubMed] [Google Scholar]
- 36.Fry M. & Green D.E. Cardiolipin requirement for electron transfer in complex I and III of the mitochondrial respiratory chain. Journal of Biological Chemistry 256, 1874–1880 (1981). [PubMed] [Google Scholar]
- 37.Paradies G., Petrosillo G., Pistolese M. & Ruggiero F.M. Reactive oxygen species affect mitochondrial electron transport complex I activity through oxidative cardiolipin damage. Gene 286, 135–141 (2002). [DOI] [PubMed] [Google Scholar]
- 38.Lange C., Nett J.H., Trumpower B.L. & Hunte C. Specific roles of protein–phospholipid interactions in the yeast cytochrome bc1 complex structure. The EMBO Journal 20, 6591–6600 (2001). [DOI] [PMC free article] [PubMed] [Google Scholar]
- 39.Robinson N.C. Functional binding of cardiolipin to cytochrome c oxidase. Journal of Bioenergetics and Biomembranes 25, 153–163 (1993). [DOI] [PubMed] [Google Scholar]
- 40.Koliaki C., et al. Adaptation of hepatic mitochondrial function in humans with non-alcoholic fatty liver is lost in steatohepatitis. Cell Metab 21, 739–746 (2015). [DOI] [PubMed] [Google Scholar]
- 41.Siripoksup P., et al. Sedentary behavior in mice induces metabolic inflexibility by suppressing skeletal muscle pyruvate metabolism. J Clin Invest 134(2024). [DOI] [PMC free article] [PubMed] [Google Scholar]
- 42.Drose S. & Brandt U. The Mechanism of Mitochondrial Superoxide Production by the Cytochrome bc1 Complex. Journal of Biological Chemistry 283, 21649–21654 (2008). [DOI] [PubMed] [Google Scholar]
- 43.Marra F. & Svegliati-Baroni G. Lipotoxicity and the gut-liver axis in NASH pathogenesis. Hepatology 68, 280–295 (2018). [DOI] [PubMed] [Google Scholar]
- 44.Buzzetti E., Pinzani M. & Tsochatzis E.A. The multiple-hit pathogenesis of non-alcoholic fatty liver disease (NAFLD). Metabolism 65, 1038–1048 (2016). [DOI] [PubMed] [Google Scholar]
- 45.Turkseven S., et al. Mitochondria-targeted antioxidant mitoquinone attenuates liver inflammation and fibrosis in cirrhotic rats. American Physiological Society 318, 298–304 (2020). [DOI] [PubMed] [Google Scholar]
- 46.Karakuzu O. C. Melissa R.; Liu Yi; Garsin Danielle A. Amplex Red Assay for Measuring Hydrogen Peroxide Production from Caenorhabditis elegans. Bio-protocol 9, 3409 (2019). [DOI] [PMC free article] [PubMed] [Google Scholar]
- 47.Prola A. B. Jordan; Vandestienne Aymeline; Piquereau Jerome; Denis Raphael GP; Guyot Stephane; Chauvin Hadrien; Mourier Arnaud; Maurer Marie; Henry Celine; Khadhraoui Nahed; Gallerne Cindy; Molinie Thibaut; Courtin Guillaume; Gressette Melanie; Solgadi Audrey; Dumont Florent; Castel Julien; Ternacle Julien; Demarquoy Jean; Malgoyre Alexandra; Koulmann Nathalie; Derumeaux Genevieve; Giraud Marie-France; Joubert Frederic; Veksler Vladimir; Luquet Serve; Relaix Frederic; Tiret Laurent; Pilot-Storck Fanny. Cardiolipin content controls mitochondrial coupling and energetic efficiency in muscle. Science Advances 7(2021). [DOI] [PMC free article] [PubMed] [Google Scholar]
- 48.Mileykovskaya E. & Dowhan W. Cardiolipin-Dependent Formation of Mitochondrial Respiratory Supercomplexes. Chemistry and Physics of Lipids 179, 42–48 (2014). [DOI] [PMC free article] [PubMed] [Google Scholar]
- 49.Pennington E.R., Funai K., Brown D.A. & Shaikh S.R. The role of cardiolipin concentration and acyl chain composition on mitochondrial inner membrane molecular organization and function. Biochimica et Biophysica Acta (BBA) - Molecular and Cell Biology of Lipids 1864, 1039–1052 (2019). [DOI] [PMC free article] [PubMed] [Google Scholar]
- 50.Arnarez C., Marrink S.J. & Periole X. Molecular mechanism of cardiolipin-mediated assembly of respiratory chain supercomplexes. Chemical Science (2016). [DOI] [PMC free article] [PubMed] [Google Scholar]
- 51.Bottinger L., et al. Phosphatidylethanolamine and Cardiolipin Differentially Affect the Stability of Mitochondrial Respiratory Chain Supercomplexes. Journal of Molecular Biology 5, 677–686 (2012). [DOI] [PMC free article] [PubMed] [Google Scholar]
- 52.Dornas W. & Schuppan D. Mitochondrial oxidative injury: a key player in nonalcoholic fatty liver disease. Gastrointestinal and Liver Physiology 319, G400–G411 (2020). [DOI] [PubMed] [Google Scholar]
- 53.Gomez B. & Robinson N.C. Quantitative Determination of Cardiolipin in Mitochondrial Electron Transferring Complexes by Silicic Acid High-Performance Liquid Chromatography. Analytical Biochemistry 267, 212–216 (1999). [DOI] [PubMed] [Google Scholar]
- 54.Brand M.D. Mitochondrial generation of superoxide and hydrogen peroxide as the source of mitochondrial redox signaling. Free Radical Biology and Medicine 100, 14–31 (2016). [DOI] [PubMed] [Google Scholar]
- 55.Decker S.T. Katsuhiko F. Mitochondrial membrane lipids in the regulation of bioenergetic flux. Cell Metab 36, 1963–1978 (2024). [DOI] [PMC free article] [PubMed] [Google Scholar]
- 56.Bessone F., Razori M.V. & Roma M.G. Molecular pathways of nonalcoholic fatty liver disease development and progression. Cell. Mol. Life Sci. 76, 99–128 (2019). [DOI] [PMC free article] [PubMed] [Google Scholar]
- 57.Simoes Ines C. M., A. R., Teixeira Jose, Karkucinska-Wieckowska Agnieszka, Carvalho Adriana, Pereira Susana P., Simoes Rui F., Szymanska Sylwia, Dabrowski Michal, Janikiewicz Justyna, Dobrzyn Agnieszka, Oliveira Paulo J., Potes Yaiza, Wieckowski Mariusz R. The Alterations of Mitochondrial Function during NAFLD Progression-- An Independent Effect of Mitochondrial ROS Production. International Journal of Molecular Sciences 22, 6848 (2021). [DOI] [PMC free article] [PubMed] [Google Scholar]
- 58.Simoes I.C., Fontes A., Pinton P., Zischka H. & Wieckowski M.R. Mitochondria in non-alcoholic fatty liver disease. The International Journal of Biochemistry & Cell Biology 95, 93–99 (2017). [DOI] [PubMed] [Google Scholar]
- 59.Goncalves R.L.S., Schlame M., Bartelt A.L., Brand M.D. & Hotamisligil G.S. Cardiolipin deficiency in Barth syndrome is not associated with increased superoxide/H2O2 production in heart and skeletal muscle mitochondria. FEBS Letters 595, 415–432 (2021). [DOI] [PMC free article] [PubMed] [Google Scholar]
- 60.Xu Y., et al. Loss of protein association causes cardiolipin degradation in Barth syndrome. Nature Chemical Biology 12, 641–647 (2016). [DOI] [PMC free article] [PubMed] [Google Scholar]
- 61.Simoes I.C.A., Ricardo; Teixeira Jose; Karkucinska-Wieckowska Agnieszka; Carvalho Adriana; Pereira Susana P.; Simoes Rui F.; Szymanska Sylwia; Dabrowski Michal; Janikiewicz Justyna; Dobrzyn Agnieszka; Oliveira Paulo J.; Potes Yaiza; Wieckowski Mariusz R. . The Alterations of Mitochondrial Function during NAFLD Progression-- An Independent Effect of Mitochondrial ROS Production. International Journal of Molecular Sciences 22, 6848 (2021). [DOI] [PMC free article] [PubMed] [Google Scholar]
- 62.Bazan S., et al. Cardiolipin-dependent Reconstitution of Respiratory Supercomplexes from Purified Saccharomyces cerevisiae Complexes III and IV*. Journal of Biological Chemistry 288, 401–411 (2013). [DOI] [PMC free article] [PubMed] [Google Scholar]
- 63.Miwa S., et al. Carboxylesterase converts Amplex red to resorufin: Implications for mitochondrial H2O2 release assays. Free Radical Biology and Medicine 90(2016). [DOI] [PMC free article] [PubMed] [Google Scholar]
Associated Data
This section collects any data citations, data availability statements, or supplementary materials included in this article.
Data Availability Statement
All data are available in the main text or the Extended Data. Code for RNA sequencing can be retrieved upon request.