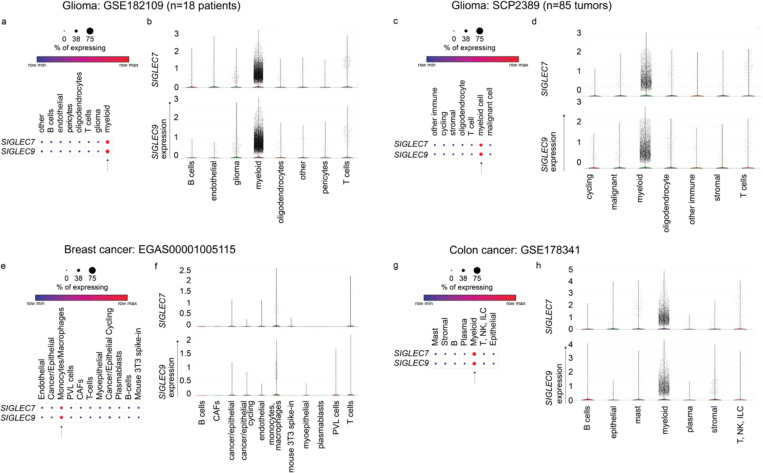
Extended Data Fig. 1 |. scRNA-seq analysis of SIGLEC7 and SIGLEC9 expression on tumor-infiltrating cells in human cancers.
Dot plots (a,c,e,g) and violin plots (b,d,f,h) presenting the expression of SIGLEC7 and SIGLEC9 genes across annotated tumor-infiltrating cells from patient with glioma (GSE182109, SCP2389), breast cancer (EGAS00001005115) and colon cancer (GSE178341). Dot sizes represent the percentage of each cell type expressing the SIGLEC genes, with average gene expression values depicted on the color gradient (a,c,e,g).

