Abstract
Background:
Scatter correction (SC) is essential in PET for accurate quantitative imaging. The state-of-the-art SC method is single-scatter simulation (SSS). Although this method is usually robust and accurate, it can fail in some situations, for example when there is motion between the CT and PET scans in PET/CT. Therefore, it is of interest to consider other SC methods.
Purpose:
In this work, an energy-based scatter estimation (EBS) method is described in detail, tested in phantoms and patients, and compared to SSS.
Methods:
This version of EBS was developed for list-mode data from Biograph Vision-600 PET/CT scanner. EBS is based on digitized 2D energy histograms in each bin of a coarsely sampled PET sinogram, either with or without time of flight (TOF). The histograms are modeled as a noisy realization of a linear combination of nine basis functions whose parameters were derived from a measurement of the 511-keV photopeak spectrum as well as Monte-Carlo simulations of the scattering process. EBS uses an iterative expectation maximization approach to determine the coefficients in the linear combination, and from this estimates the scatter. The investigation was restricted to 18F-based PET data in which the acquired number of counts was similar to the levels seen in oncological whole-body PET/CT scans. To evaluate the performance, phantom scans were used that involved the NEMA NU2–2018 protocol, a slab phantom, an NU 2–1994 phantom, a cardiac phantom in an anthropomorphic chest phantom, and a uniformly-filled torso phantom with a bladder phantom slightly outside the axial field of view. Contrast recovery (CR) and other parameters were evaluated in images reconstructed with SSS and EBS. Furthermore, FDG PET scans of seven lung cancer patients were used in the evaluation. Standardized uptake values (SUV) based on SSS and EBS were compared in 27 lesions.
Results:
EBS and SSS images were visually similar in all cases except the torso + bladder phantom, where the EBS was much closer to the expected uniform image. The NU2–2018 analysis indicated a 2% scatter residual in EBS images compared to 3% with SSS, and 10% higher background variability, which is a surrogate for image noise. The cardiac phantom scan showed that CR was 98.2% with EBS and 99.6% with SSS, and that the SSS sinogram had values greater than the net-true emission sinogram, indicating a slight overcorrection in the case of SSS. In the lesion SUV comparison in patient scans, EBS correlated strongly (R2 = 0.9973) with SSS, and SUV based on EBS were systematically 0.1 SUV lower. In the case of the torso + bladder phantom portion, the SSS image of the torso + bladder phantom was 299% times hotter than expected in one area, due to scatter estimation error, compared to 16% colder with EBS.
Conclusions:
In evaluating clinically relevant parameters such as SUV in focal lesions, EBS and SSS give almost the same results. In phantoms, some scatter figures of merit were slightly improved by use of EBS, though an image variability figure of merit was slightly degraded. In typical oncological whole-body PET/CT, EBS may be a suitable replacement for SSS, especially when SSS fails due to technical problems during the scan.
Keywords: energy, PET, scatter
1 |. INTRODUCTION
Correction for scattered radiation is important in clinical PET.1 State-of-the-art scatter correction (SC), usually robust and accurate, is based on the uncorrected PET image, an image of attenuation coefficients (the attenuation map), a physical model of the scattering process, and the assumption of negligible patient motion between the PET acquisition and the acquisition from which the attenuation map is derived. This standard SC method is single-scatter simulation, (SSS) developed by Ollinger1 and Watson et al.2 SSS uses the PET image, corrected for attenuation but not for scatter, to estimate the distribution of activity in the PET FOV and uses the attenuation map, which is also used in PET reconstruction for attenuation correction (AC), to determine where photons scatter and in which directions they go after scattering. Having started with a scatter-contaminated image, SSS uses this first estimate to make a scatter-corrected image, then repeats the simulation one time or more. SSS usually compensates for uncertainties, like activity outside the FOV, and multiple scattering, with a procedure called tail fitting in which sinogram regions that are expected to be free of activity (the sinogram’s tail) are compared to the simulated result, which is then adjusted. SSS includes a model of the scanner’s energy window but does not use the energies of individual PET photons.
SSS can fail in some situations, for example when the patient lies partly outside a CT scanner’s measured field of view (FOV), when there is motion, or when radioactivity is unexpectedly spilled on clothing or blankets. Multiple scatter and, for some isotopes, a background of prompt gamma rays may also not be accurately modeled by SSS. Because SC failure can cause serious PET image artifacts, the physician sometimes must rely on other approaches, for example, interpretation of uncorrected images. This paper describes an alternative SC method, that will be less susceptible to some of these failures. This is energy-based scatter estimation (EBS) which, unlike SSS, uses the energy signals of individual photons. Energy signals have long been used for SC in gamma-camera-based nuclear medicine.4–6 Early investigations using EBS for PET were described by several authors, including Grootoonk et al.,7 Bendriem et al.,8 and Shao et al.,9 and were constrained, by the technology of the day, to the use of just a few energy windows. A 1996 review of energy-based methods was presented by Grootoonk et al.10 It is of interest to note that deep-learning-based scatter estimation has been discussed quite recently as a potential alternative to both SSS and EBS.11 The energy-based method used here was influenced by the approach of Popescu et al.,12 which was recently tested by Efthimiou et al.13 In this work, we propose a different implementation than the one used by Efthimiou et al., using a two-dimensional instead of a one-dimensional approach (as described below), treating prompt and random coincidences separately, and modeling the energy spectrum differently. Earlier versions of this EBS method were described previously.14 In this paper, the method is described in detail. PET images based on EBS are compared to standard images based on SSS in PET/CT scans of phantoms and patients. The expectation is that standardized uptake values (SUV) should be approximately the same in both cases, especially in small lesions with focal uptake. The investigation was restricted to 18F-based PET data in which the acquired number of counts was similar to the levels seen in oncological whole-body PET/CT scans.
Notably, the EBS approach estimates the scatter only from the PET measurement, making no reference to a CT scan or the attenuation map. Therefore, it is also immune to errors in PET/CT alignment, for example patient motion between scans. It has the potential to be parameter-free and to avoid ad-hoc procedures like tail fitting that account for missing information.
2 |. METHODS
2.1 |. Hardware, software, and sinogram dimensions
Phantom and patient data were acquired with Biograph Vision-600 PET/CT systems (Siemens Healthineers, Knoxville, Tennessee), using single bed positions for phantom scans and, in the case of patients, multiple bed positions assembled into a whole-body volume. The scanner has a 26.3 cm axial field of view and uses time-of-flight detection (TOF) with time resolution of approximately 210 ps. Standard VG80 software was used. This software is appropriate for EBS because, compared to earlier versions of this manufacturer’s PET/CT systems, the detectors’energy signals are finely digitized and stable over time and as count rates change. Figure 1 illustrates the PET data model. A PET scanner counts positron-decay events along a line of response (LOR). Coincident events are represented in the list-mode data file by six parameters: the indices of the A and B detection crystals as determined by the scanner’s electronics and firmware, the TOF which is defined as the time difference between the A and B coincidences, the energies of EA and EB of the two photons, and a flag to distinguish between prompt and delayed coincidences. When a TOF sinogram is formed, those parameters are converted to indices representing five physical quantities as shown in the figure: the LOR’s radial coordinate (r), the azimuthal angle (ϕ), the LOR’s axial position (z), the co-polar angle (θ), and TOF (t). One TOF bin corresponds to a region somewhat larger than 2 cm in the direction between the A and B detectors. Prompt coincidences are stored in normal TOF bins whereas delayed ones are stored in one additional TOF bin. A similar discussion of the PET data model has been provided by Fahey.15
FIGURE 1.
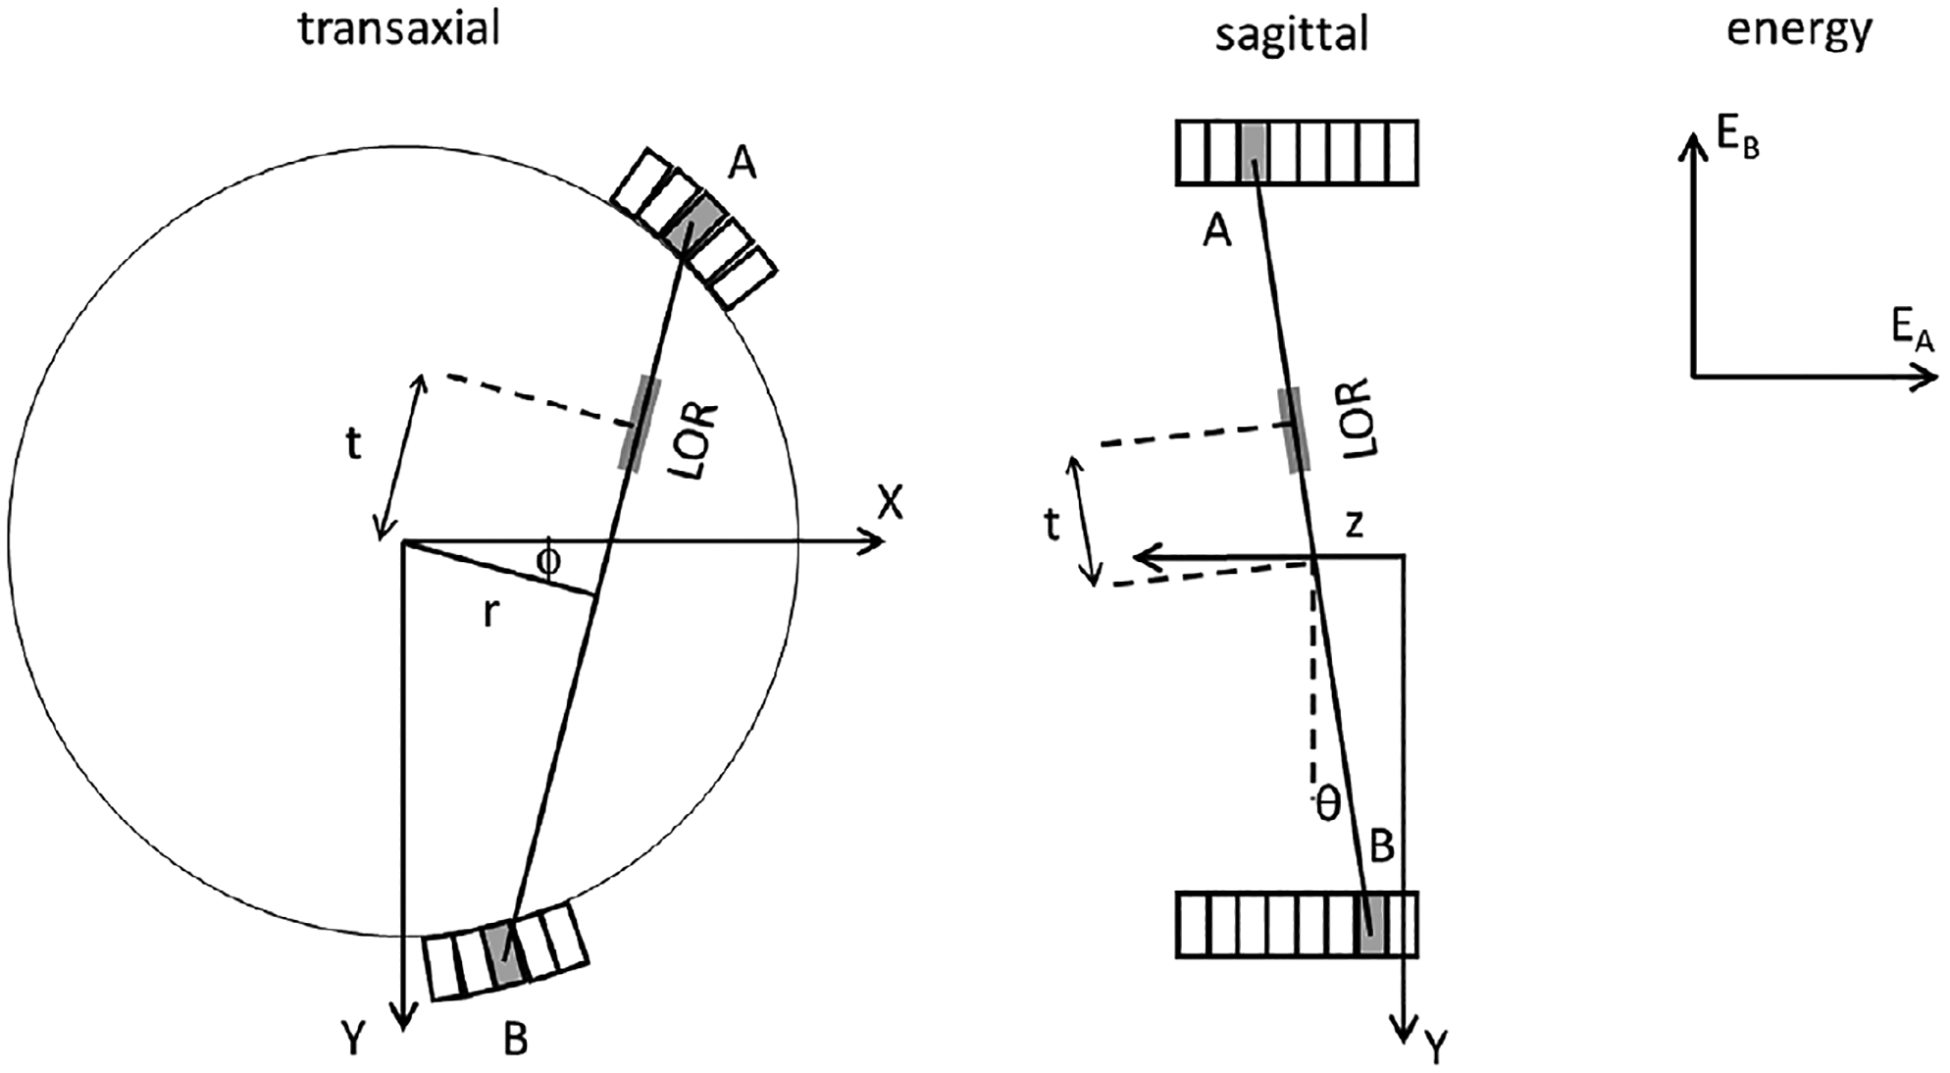
Spatial, TOF and energy dimensions used in the PET data model. A circle represents the PET scanner’s approximately circular bore. A small number of the scanner’s scintillating crystals are represented by rectangles, drawn with an exaggerated scale.
Data processing and reconstruction was performed with a laptop personal computer (PC) that also used VG80 software, adapted as necessary to provide access to the energy signals stored in the list-mode data files. The Hewlett Packard Zbook 15 PC had an Intel Core i7-8850H CPU at 2.60 GHz, and 64 GB of RAM memory. EBS was implemented in IDL software (L3Harris, Broomfield, Colorado). Monte Carlo simulations used an HP Z8 desktop computer, with an Intel Xeon Gold 6136 CPU at 3.00 GHz in dual processors, and 380 GB of RAM. Software was GATE v9.1, Geant4 10.7.3 and ROOT 6.26/00 on Ubuntu 18.04.
List-mode files were converted to two kinds of time-of-flight (TOF) sinogram: a standard sinogram without energy information, another sinogram with energy information, and a sinogram of normalization coefficients. Although EBS does not depend on time-of-flight, TOF sinograms were used in all tests described here. The standard sinograms and the normalization, used in reconstruction, were five-dimensional (5D) and had 520 radial bins, 50 azimuthal angle bins based on time-of-flight mashing,16 9 oblique segments to represent the co-polar angle, 33 prompt TOF bins and one additional bin for delayed coincidences. The number of axial planes in the segments were 159, 139, 139, 101, 101, 63, 63, 25, and 25. Sinograms with energy information had, in principle, seven dimensions (7D) to describe the two photons’ energies, though only 6D were used since the EBS estimate was made for the direct segment, as described below. The energy information was stored compactly in computer memory, using a representation where each sinogram bin contained, not just the number of counts, but a short list of the energies. In an early stage of processing, the sinogram was sampled coarsely, as explained below.
2.2 |. Energy spectrum measurements with and without scatter
The EBS method described in this paper estimates scatter based on the shape of the energy spectrum in each coarse sinogram bin, even though the number of counts is limited. The method is explained by an analysis of two phantom scans (Figure 2). One scan used the daily calibration and quality control phantom, a 20 cm diameter by 30 cm long cylinder filled uniformly with a solid suspension of positron-emitting 68Ge activity in polyurethane, surrounded by a 6 mm shell of polyethylene. The other scan used a 18F line source at the center of a 20 cm by 70 cm polyethylene cylinder, similar to the NEMA scatter phantom except for the location of the radioactivity. Each phantom was positioned near the center of the PET scanner. List-mode data were acquired and converted to sinograms. The figure illustrates the two phantoms on the patient bed and displays the sinograms, summed over axial planes and TOF bins. Net-true sinograms (prompt coincidences minus random ones) are shown in the figure. The horizontal and vertical directions in the figure represent the sinogram’s radial (520 bins) and angular directions (50 bins), respectively. To emphasize scattered radiation, a logarithmic grayscale was used in displaying the sinograms. Red markings in the figure indicate that there are three kinds of LOR, each corresponding to a line in the object or a point in the sinogram. These are: (1,4) LOR through the center where unscattered and scattered radiation are both expected; (2,5) LOR with small-angle scatter; and (3,6) LOR with large-angle scatter. These are described as the center region, the scatter region, and the tail region. The center region was large in the case of the uniform phantom and small in the case of the modified NEMA scatter phantom.
FIGURE 2.
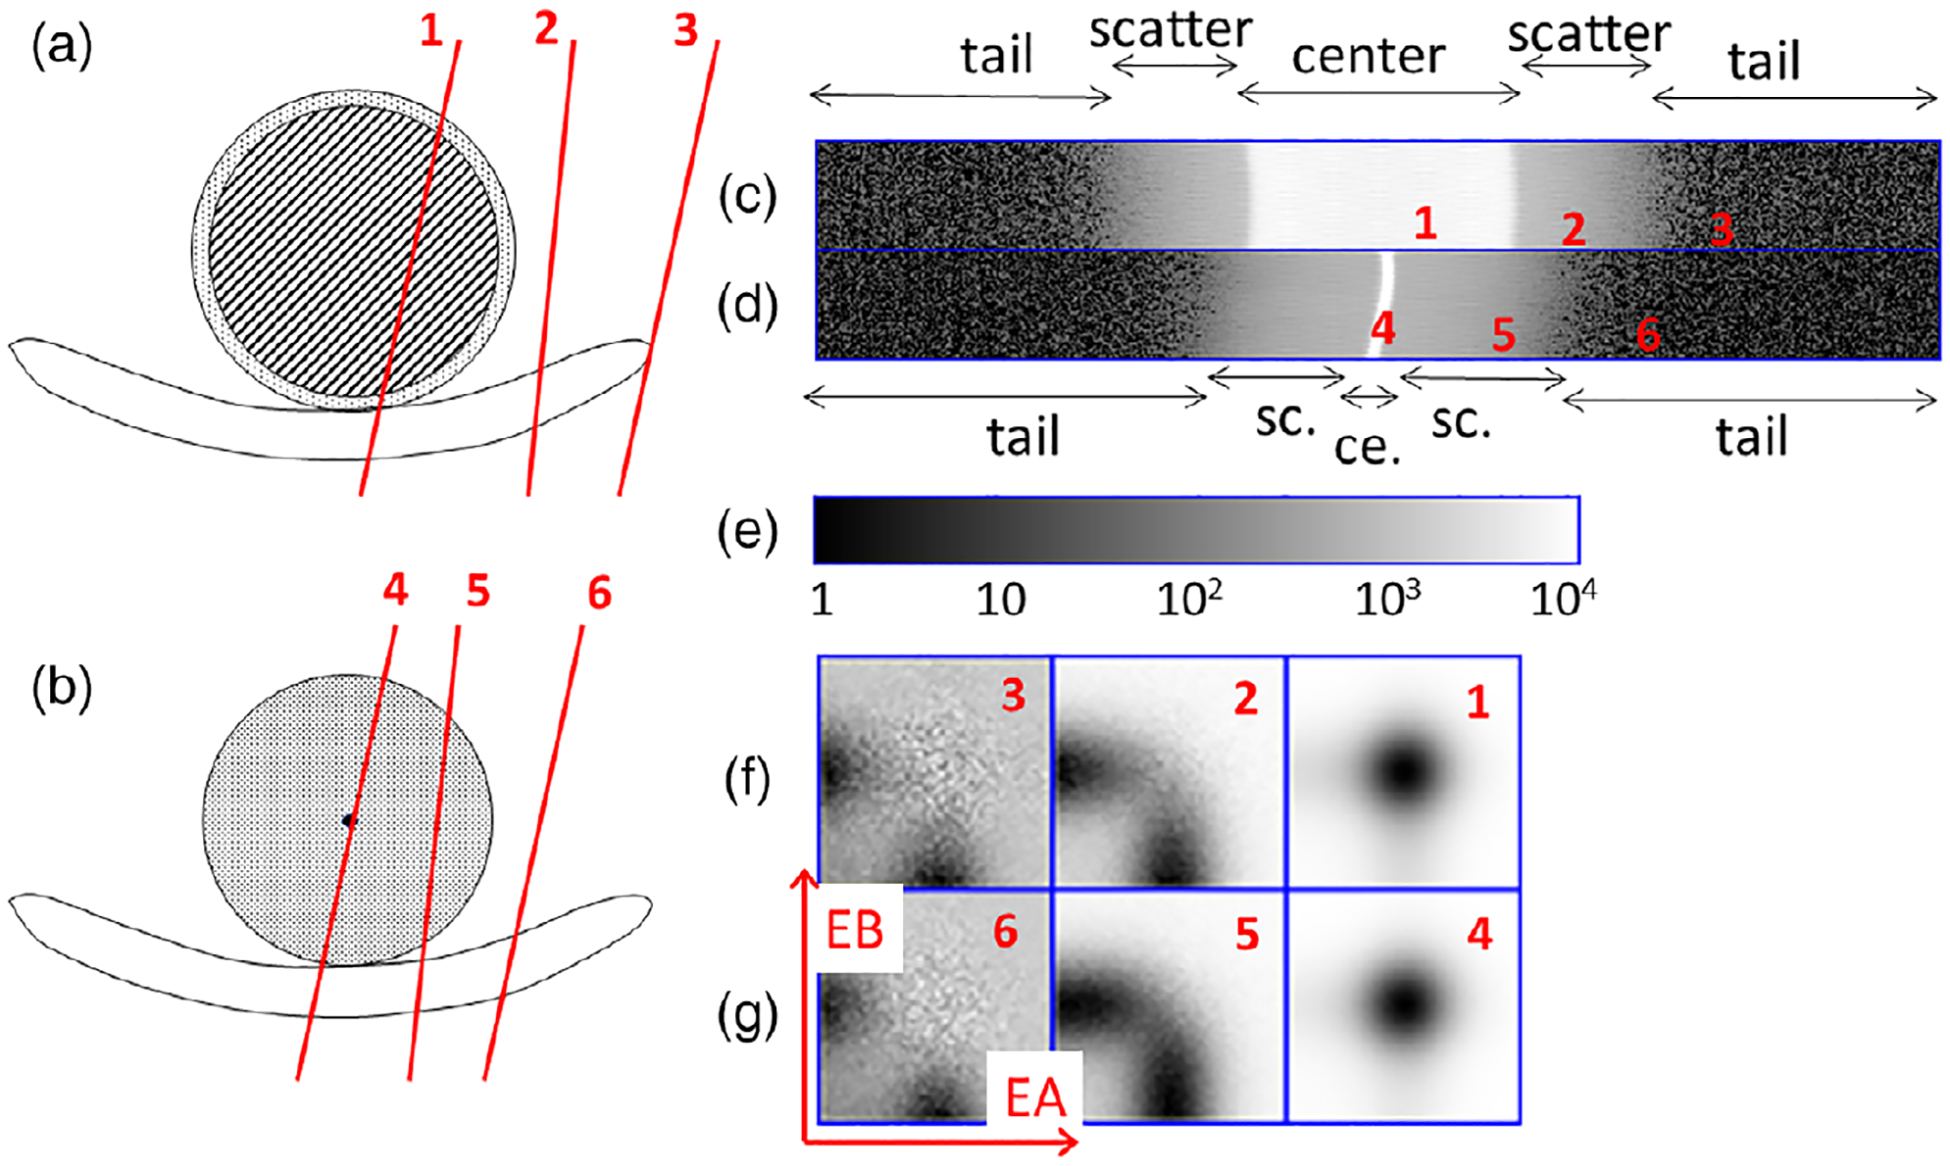
(a,b) cross-sectional drawings of (a) a 20-cm uniform phantom and (b) a modified NEMA scatter phantom, each positioned on the patient bed. PET radioactivity was only present in the areas shaded with diagonal lines or colored black. Radiation was scattered by the areas shaded with diagonal lines or with dots. (c,d) Acquired net-true sinograms for these phantoms, displayed with a logarithmic gray scale. (e) Color bar for (c,d). (f) 2D energy histograms as described in the text. (f,g) 2D net-true energy histograms for (a,b) for, left to right, the tail, scatter and center regions.
Like other authors,12,17 we use 2D energy histograms to represent the energy distribution in each region, since PET coincidences use two detectors. Each coarsely sampled sinogram bin is treated as if it represented one large A detector in coincidence with one large B detector. 2D histograms, functions of the discretized A and B energies, are shown in Figure 2, with the A and B energy indices varying along the horizontal and vertical axes, and the grayscale value corresponding to the number of coincidences. Although the phantoms were different, similar 2D histograms were seen in the three regions. This empirical observation was the basis for the EBS method described here.
2.3 |. The EBS algorithm
The following definition is used for the 2D histogram in any prompt or delayed bin of the TOF sinogram:
| (1) |
The EBS scatter estimate is calculated for each bin in the direct sinogram segment. The reconstruction program uses inverse single-slice rebinning to extend SSS or EBS from the direct segment to the oblique segments. To estimate the scatter content, EBS starts with the assumption that, in either the A or B detector, the spectrum of energies takes this simple form:
| (2) |
where a0, a1 and a2 are coefficients, p0(iE) represents the discretized energy spectrum in the case of no scatter, p1(iE) represents small-angle scatter, and p2(iE) represents large-angle scatter. The caret symbol (^) shows that this is an expected value for the number of photons in A or B. The functional form (2) is a simple generalization of the approach used by other authors, for example Popescu et al.12 who assumed the same scatter distribution in all parts of the sinogram, that is, just the first two terms in (2). The expansion in three basis functions instead of two may be helpful since Figure 2 indicates distinct scatter shapes in the small and large-angle scattering regions. Thus (2) suggests that, in any position, scatter might be successfully modeled as a linear combination of functions describing those two regions. It is explained below that p0 was obtained by a measurement whereas p1 and p2 were obtained by combining the measurement with a simulation.
Because the photons are detected in coincidence, (2) is extended to two energy dimensions:
| (3) |
The summation includes indices kA = 0, 1, 2 and kB = 0, 1, 2, a total of nine values.
Figure 3 illustrates the data flow used in our implementation of EBS for PET/CT, as explained below. The figure emphasizes that much of the calculation is the same as in normal PET/CT reconstruction when SSS is used for the SC. The SSS data-flow diagram, not shown, is quite complicated because it uses both the CT-based attenuation map and the PET-based sinograms, and an iterative loop. The core reconstruction algorithm (PET recon in the figure) requires these input arrays: a 5D sinogram, the corresponding normalization sinogram, the 4D attenuation-correction sinogram with no TOF dimension, and the 4D scatter estimate which is only defined for segment 0.
FIGURE 3.
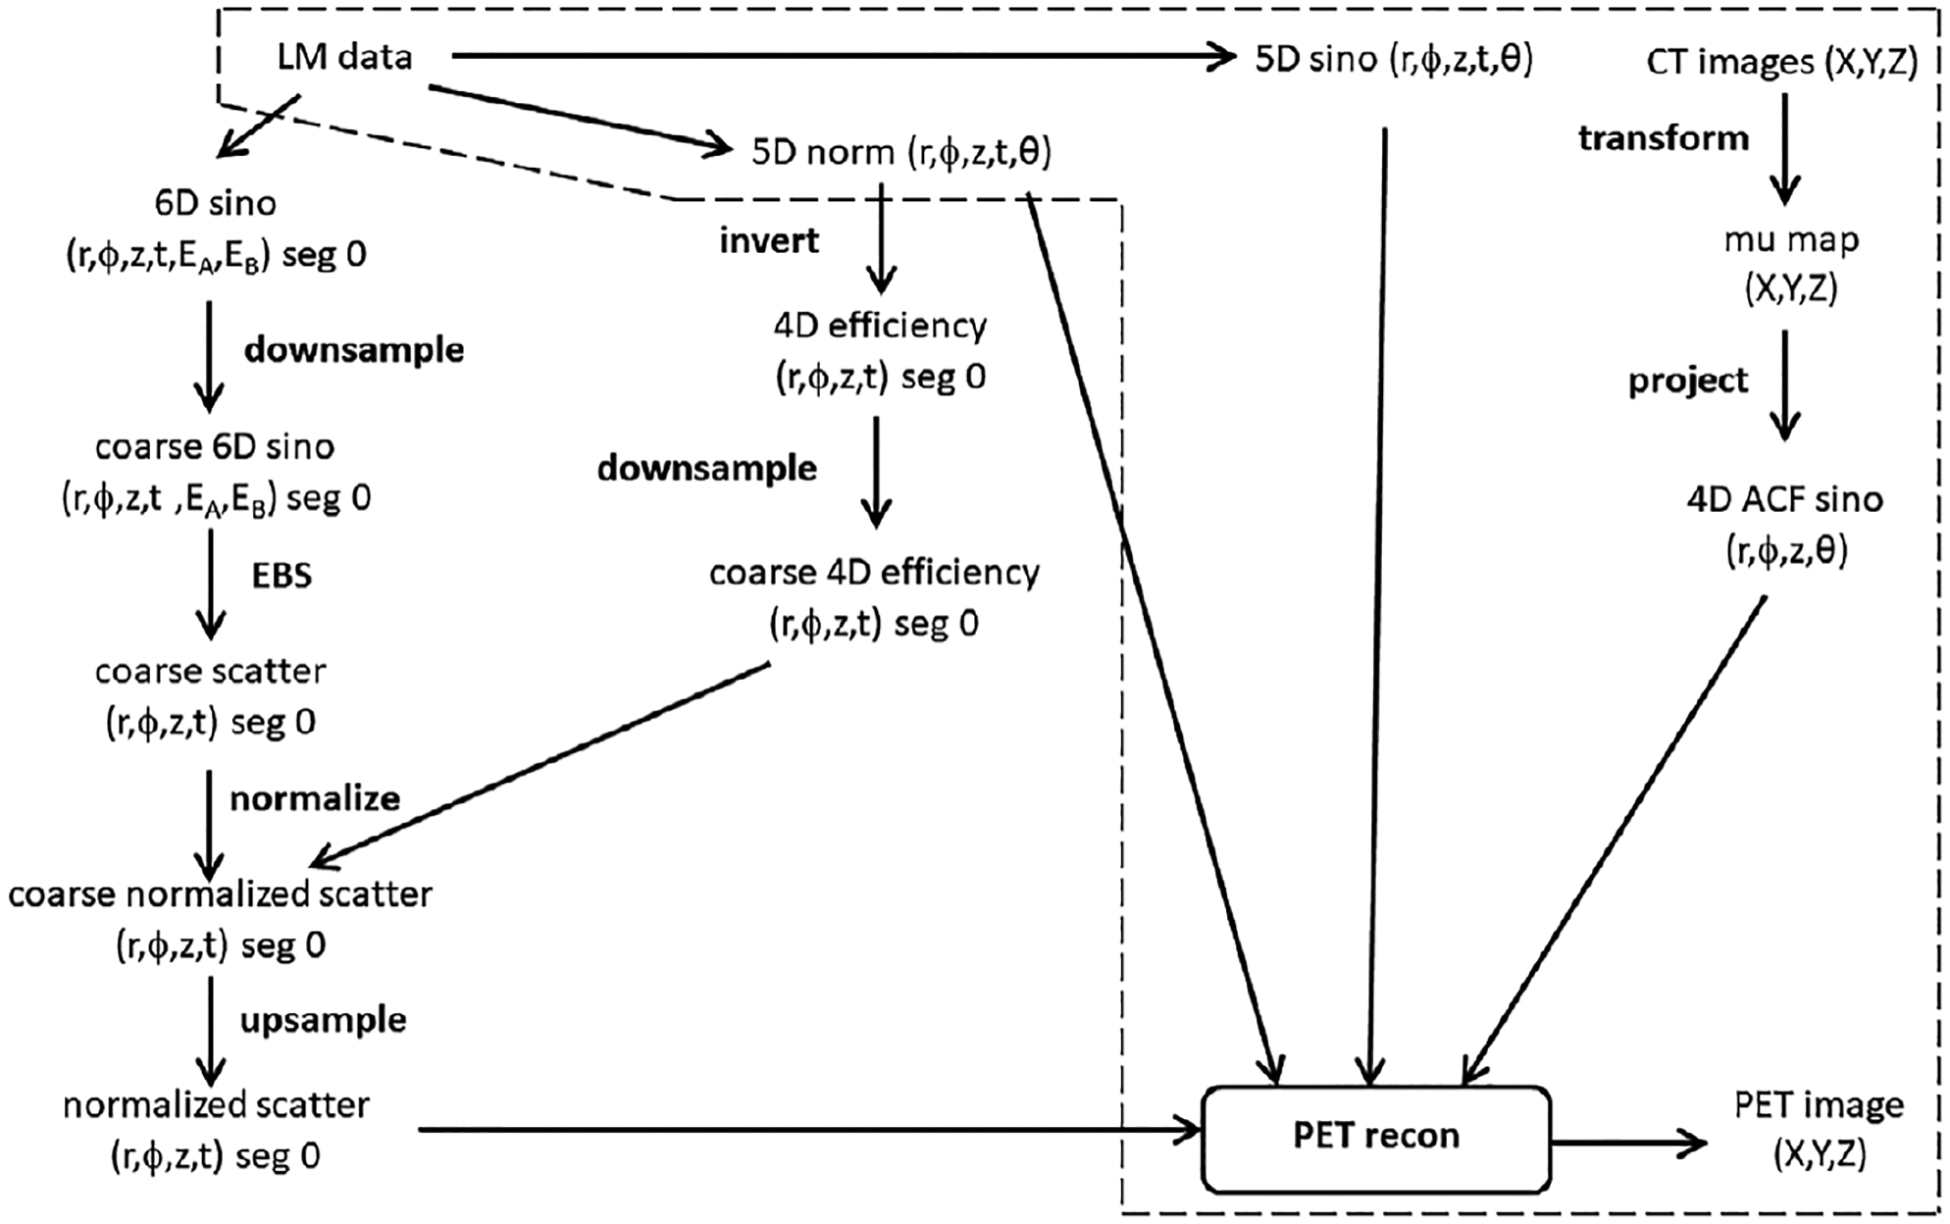
Data-flow diagram for PET image reconstruction using EBS. Algorithmic steps used in normal PET reconstruction with SSS are shown inside the dashed-line region, though the figure does not illustrate how the SSS estimate is made based on LM data and CT images. LM, sino and norm are abbreviations for list-mode, sinogram and normalization.
In one bin of a TOF sinogram and one energy bin, is likely to be much less than 1. The EBS method works with larger numbers because it uses a coarsely-sampled sinogram that combines data from adjacent sinogram bins. The EBS method down-samples segment 0 of the TOF sinogram using factors of 15 radially, 5 angularly, and 15 axially, resulting in coarse sinogram dimensions of 33 × 10 × 11 × 34 (radial, angular, axial, and TOF including one bin for delayed coincidences). The TOF sinogram dimension is not down-sampled. The average number of counts per bin increases by 1125. The bin sizes in this work were 24 mm radially and axially, 22 mm in TOF, and 18 degrees angularly.
In this scanner, energy signals are first digitized in the PET scanner as 10-bit integers, then down-sampled to 8 bits when saved in the list-mode files. The normal energy interval from 435 to 585 keV defined at 10-bit digitization, corresponds to 54 discrete bins for A detectors and 54 bins for B when 8-bit digitization is used. Because of the difference between 10 and 8 bits, the binning densities of the first and last bins were ¾ and ¼ of the binning densities in other bins.
EBS estimates the scatter in each sinogram bin by determining the nine values a00, a10, a20, a01, a11, a21, a02, a12, and a22 that maximize the likelihood of measuring the 54 × 54 values n(iEA,iEB), assuming a Poisson model and a parent distribution of the functional form (3). Though the application is completely different, the mathematical problem is the familiar maximum-likelihood expectation maximization (ML-EM), used for PET image reconstruction and described by Shepp and Vardi18 or Snyder and Politte.19 The similarity to the earlier work was noted by Popescu et al. in the work that motivated this approach.12 The earlier papers motivated the use, in this paper, of the following update equation that builds new estimates from previous ones:
| (4) |
As written, (4) is based on the assumption of unit normalization for the basis functions, meaning that the sum over energy bins is 1 for each basis function. Other normalizations can be used with a slight complication of the equation. In practice, all coefficients are set to 1 and then (4) is applied repeatedly. The stopping rule is discussed below. The algorithm runs faster, and gives the same answer, when the sum in (4) is restricted to bins where n(iEA,iEB) is nonzero. In each prompt or delayed down-sampled sinogram bin, the scatter estimate is set to the difference between the total measured counts in the bin and the estimated amount due to the photopeak:
| (5) |
again using the assumption of unit-normalized basis functions. The correction for random coincidences is based on delayed coincidences. In TOF bins it = 0 to 32 the net-true scatter estimate is
| (6) |
That is, the correction for random coincidences is applied directly in each sinogram bin based on delayed coincidences. (6) is approximate because TOF mashing is used to reduce the dimensions of the normal sinogram, meaning that, for any set of (ir,iϕ,iz), the number of LOR varies in the TOF dimension, it. The approximation is justified by the observation that, on average, 1152 sinogram bins are combined into one bin during the down-sampling. EBS includes a rule to avoid overdetermination. This means it does not try to determine more coefficients than the number of non-zero bins. When the number of non-zero bins is less than nine, (5) is modified by assuming 100% scatter in the prompt bins. This assumption leads to an overestimation of scatter in bins with very few counts.
For image reconstruction, the EBS sinogram must be restored to normal dimensions and normalized by the factors used for a normal sinogram. At full resolution, an efficiency sinogram is generated as the reciprocal of the normalization except where the normalization is zero. The efficiency sinogram is down-sampled to 33 × 10 × 11 × 34 bins, as described above. The scatter sinogram (6) is multiplied by this efficiency. This product is up-sampled to full resolution, using linear interpolation, creating the normalized scatter sinogram. This is then used as the scatter estimate in image reconstruction.
2.4 |. Energy basis functions derived from measurements and Monte Carlo calculations
Suitable basis functions, p0, p1 and p2 in (2) and (3), must be determined. Here we describe how this was done. The first basis function, p0, represents the scanner’s response to unscattered annihilation radiation and in this investigation was taken as a direct measurement of the energy spectrum of a 68Ge calibration source in a thin steel tube, placed on a low-scattering paper support near the center of the PET scanner, using only sinogram bins directly aligned with the source. Since daily quality control supplies the same energy spectrum each time the scanner is used, a single measurement of p0 can be used on different days and even in different scanners.
A simulation and a physics model were used to determine p1 and p2. Energy spectra are expected to represent a mix of unscattered and scattered photons. Because the energies in an actual measurement are broadened by resolution effects, we used a GATE (v9.1) Monte-Carlo simulation20 to model the case of perfect energy resolution. The simulation created unscattered radiation as well as the two types of scatter (those in the center region, representing p1, and those in the scatter region, representing p2). The simulation included other physical effects including inter-crystal scatter, TOF broadening, and signal digitization. The modeled object was a 18F uniform cylinder of water, 20 cm in diameter and 20 cm long, placed in the center of the scanner. The simulated object had no shell to contain the activity, and was suspended in the middle of the scanner with no patient bed. This was similar to the geometry of Figure 2a. The simulation recorded event data in the list-mode format used for patient scans. These values were saved for each event: the crystal in which each photon was detected; each photon’s energy; and the TOF. Delayed coincidences were included. Importantly, energy values for each photon were recorded and digitized in the energy range 350 to 650 keV, extending beyond the normal range of 435 to 585 keV. We created coarsely-binned sinograms that preserved the energy information, using the down-sampling procedure described above. Center and scatter regions as indicated by Figure 2 were defined, and in those two regions 2D energy histograms, n(iEA,iEB). were extracted. Energy spectra were defined in five steps.
- A 1D spectrum was defined as follows for energy values two or more bins below the photopeak, that is, excluding unscattered radiation:
(7) These spectra were approximated as simple bilinear functions of energy f(E) = c0 + c1 (iE), as described below in Results.
A realistic model of energy resolution and energy windowing was introduced by convolving those bilinear functions with the spectrum of unscattered radiation, which was derived from p0. A somewhat more accurate model might have used sharper resolution in lower energy bins, for example scaling the width of the p0 in proportion to the square root of the energy. That refinement was not used because it would cause only small changes to p1 and p2.
Energy windowing was modeled by restoring the range from 435 to 585 keV, resulting in a range of 54 bins as in actual acquisitions with this PET scanner.
The resulting spectrum was multiplied by the binning density factors of ¾ and ¼ (described above) in bins 0 and 53.
2.5 |. Stopping rule for EBS at various count levels
The number of iterations used in the iterative EBS solution based on (4) must be determined, that is, the stopping rule. To determine the stopping rule, and to determine how it might vary with the number of counts, data from a scan of the uniform cylinder phantom were used. Two high-count 2D histograms of prompt coincidence events were derived from this, one for the center and one for the scatter region, as defined above. In each case, the EBS solution was made with 20 000 iterations, defining basis-function expansions of the form (3) and determining the actual scatter fraction in these regions with (5). In this test, the expansion in basis functions was assumed to be the truth.
2D histograms for an artificial sinogram bin were created in which the expected total number of counts was set to each of these 16 values: < counts > = 10, 20, 50, 100, 200, 500, 1000, 2000, 5000, 10 000, 20 000, 50 000, 100 000, 200 000, 500 000, and 1 000 000. An algorithm described by Knuth21 generated ten ensembles of pseudo-random numbers at each of these count levels, creating 2D histograms that resembled actual measurements from a PET scanner, a total of 10 × 16 or 160 arrays of size 54 × 54 energy bins. Each array was used to estimate the scatter at each of these numbers of iterations: niter = 10, 20, 50, 100, 200, 500, 1000, and 2000. For each value of niter, for each value of < counts >, for each ensemble of random numbers, and for the center and scatter regions of the sinogram, an ensemble of ten estimated scatter fractions was calculated based on the definition
| (8) |
From the ten values in each ensemble, a mean value and standard deviation were extracted. At each number of iterations and for both regions (center and scatter) this definition was used:
| (9) |
The numerator averages ten noise realizations. The nominal scatter fraction was derived from (8) in the case of 2000 iterations and 1 000 000 counts. A stopping rule was derived by determining how many iterations brought this figure of merit close to 1.
2.6 |. Image reconstruction
The image reconstruction method was attenuation-corrected iterative OSEM that modeled the system’s point-spread (the PSF-TOF method22) with 4 iterations and 5 subsets and a matrix of 440 × 440 × 159 voxels whose size was 1.6 mm in each direction. The software included options to make images based on three kinds of scatter correction: no scatter correction (NOSCAT); SSS with tail fitting; and EBS. In patient scans but not in phantom scans, reconstructed images were smoothed after reconstruction with an isotropic 5 mm full width at half maximum Gaussian kernel.
2.7 |. PET/CT phantom scans
Four phantom scans were used to evaluate EBS performance in phantoms. Each scan used data from one bed position, and activity concentrations were similar to or higher than typical concentrations in patient scans. In the following descriptions of the phantoms, hot implies filled with radioactivity and cold implies no radioactivity. SC methods to be compared were NOSCAT, SSS and EBS.
Scan 1 followed a modified NEMA NU2–2018 protocol.23 An image-quality or IQ phantom (PTW Freiburg GmbH, Freiburg, Germany) filled with 50 MBq FDG and having cross-sectional size 30 cm × 20 cm had hot spheres of diameter 10, 13, 17, 22, 28, and 37 mm, filled with a 4:1 concentration relative to the background. The phantom included a 5 cm cylindrical cold lung-equivalent region. Analysis was provided by the automated NU2–2018 software provided with the scanner, which directly measured contrast recovery for each sphere. This was defined as
| (10) |
where the concentration ratio in the numerator was derived from the images according to the NEMA specification and the concentration ratio in the denominator was 4.0. The analysis software also calculated, as a function of axial position, residual error in the lung insert (a direct measure of SC) and background variability. Also computed were the image total values (Bq in all image voxels) divided by the total value of the image based on SSS.
Scan 2 combined two phantoms, placed on the patient bed in adjacent axial positions with no gap between them, so they could be scanned together. One of these was a PET acceptance testing phantom (NU 2–1994 phantom, Data Spectrum Corp., Chapel Hill, NC) with a large outer cylinder 20 cm in diameter, two inner air-filled 4.8 cm cylinders and a solid PTFE cylinder. The second phantom (custom-manufactured by Data Spectrum) used the same outer cylinder as NU 2–1994, but included a slab phantom with a 2.54 cm-thick acrylic plastic insert positioned vertically on a diameter. The NU 2–1994 cylinder and the two halves of the slab phantom were filled with water containing various concentrations of 18F-FDG, a total of 31 MBq. The half cylinders in the slab phantom were filled incompletely and therefore had an air bubble near the top. This combination of phantoms had several activity-free regions: the slab, the empty inner cylinders in the NU 2–1994 phantom, and the region between the phantoms which was void of activity in a 3.3-cm axial range. CR was based on a 2-cm by 2-cm line profile through the scatter-free region evaluated in each of these regions using the equation
| (11) |
where minimum was the smallest value on the profile and maximum was the average value in the two approximately-uniform parts to the left and right of the minimum. As in scan 1, image total values relative to SSS were computed.
Scan 3 used a cardiac insert phantom with 75 MBq FDG, placed in an anthropomorphic chest phantom filled with cold water. This phantom had a ventricle cavity 9.3 cm long, 6.1 cm in diameter and was surrounded by a 1 cm thick myocardium chamber. Activity was only present in the simulated myocardium. SC evaluation was based on examination of sinogram profiles and image profiles, as explained below. As in scans 1 and 2, image total values relative to SSS were computed.
Scan 4 of a torso + bladder phantom created a PET imaging situation in which SSS was expected to fail because a large fraction of the activity was slightly outside the axial FOV, a situation in which the tail-fitting procedure was likely to overestimate the scatter. This simulated a situation with a PET scanner positioned slightly superior to the bladder when the urine pool in the bladder was hot relative to the background. A 24-liter torso phantom, measuring 35.5 cm wide, 21 cm tall and 40 cm axially, was filled uniformly with water and 32 MBq FDG. An additional 65 MBq FDG was dissolved in a 0.45-liter insert, positioned anteriorly just 4.5 cm beyond the scanner’s axial FOV, that is, 114 times more concentrated than in the uniformly filled section. The phantom was scanned for 1800 s, resulting in a PET sinogram with 195 million net-true counts and a 2.0:1 prompt to random ratio. SC evaluation was based on a central, axially oriented profile through the reconstructed images. On the profile, image values were averaged slice by slice in a 6.5 by 6.5 cm region.
2.8 |. Patient scans
Images and figures of merit were derived from seven whole-body scans of lung-cancer patients at the Hospital of the University of Pennsylvania (HUP). The human data used in this study were acquired as part of an approved research protocol by the University of Pennsylvania Institutional Review Board and all study participants gave written informed consent. Four of the patients were female. Three were male. Patients’weight ranged from 52 to 97 kg (mean 79.0, standard deviation 13.3). Body mass index (BMI) ranged from 18.6 to 33.4 (mean 27.6, standard deviation 4.6). One hour after injection of 37 MBq FDG, a fast spiral CT scan was performed, followed by acquisition of list-mode PET data in six or seven bed positions with total acquisition time of about 5 min and time per bed position determined from a BMI-dependent formula. The list-mode data from one patient, an 83 kg female, were retrospectively processed to achieve undersampling of counts, resulting in two additional whole-body data sets with count levels 50% and 25% of the original study. This count-reduction strategy had been validated in prior studies.24 Prominent lesions or similar areas of high tracer uptake were selected for cross-comparison of the three SC methods. Uptake in each image was determined by the lesions’maximum SUV, which was determined in an IDL-based user interface that required manual identification of lesions in projection images, and derived SUV from the hottest voxel in the selected region.
3 |. RESULTS
3.1 |. Energy basis functions
Parts (A) and (B) of Figure 4 show 2D energy histograms from Monte Carlo, in which the energy resolution was simulated to be excellent. Part C shows that, in both sinogram regions, the spectrum of scattered events varied linearly as functions of (E—511 keV), but the two linear relations were strikingly different. In the center of the sinogram, this was an affine relation but in the scatter region it was a simple linear relation. Part D of the figure shows the experimentally obtained photopeak energy spectrum, p0, and also plots p1 and p2, obtained with the procedure described in Methods. The energy resolution full width at half maximum in the measurement of p0 was 46.7 keV, or 9.1%.
FIGURE 4.
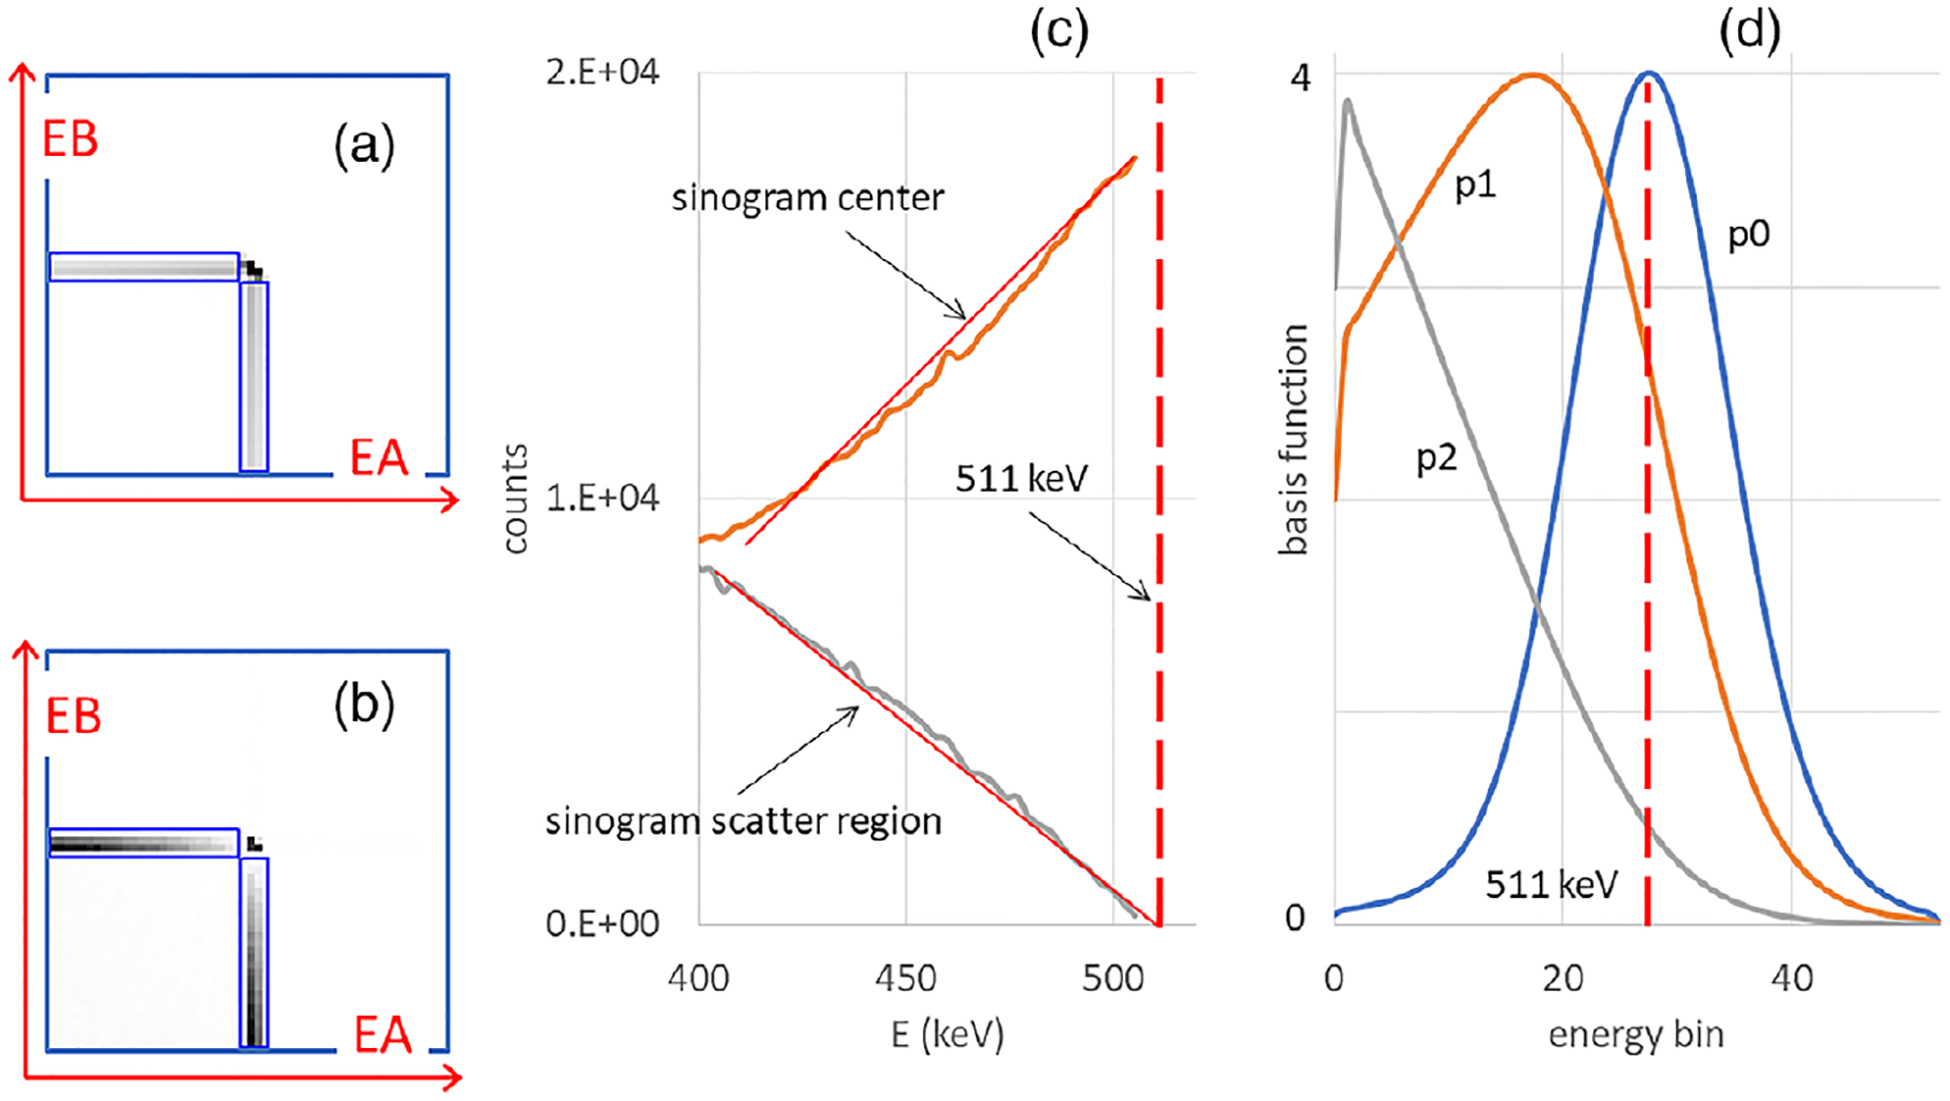
Net-true 2D energy histograms based on the perfect energy resolution Monte Carlo simulation of a uniform cylinder, with events collected in (a) the center region of the sinogram where scattered and unscattered radiation are mixed and (b) the scatter region where, after subtraction of random events, only scattered events can be found. (c) Energy spectra derived from the center and scatter regions. Approximate linear trend lines are shown as overlapping red lines. (d) Basis functions, not unit-normalized. In (c,d), a vertical dashed line indicates the energy of the unscattered radiation at 511 keV.
3.2 |. Stopping rule
Experimental 2D histograms from the center and scatter sinogram regions had 1.6 × 10⁷ and 3.2 × 10⁶ counts, respectively. Figure 5a is a 2D histogram derived from the scatter region. Part (B) of the figure shows the function fitted to the data in part (A), after 200 iterations. Part (C) plots the scatter estimate in the two regions as a function of the number of iterations. Part (D) plots the estimated scatter fraction as a function of < counts > in the case where the number of iterations was fixed at 200, uses error bars to present ensemble standard deviations for each point, and uses a dashed horizontal line to show the actual scatter fraction in each region. These values, derived from < counts > = 1 000 000 and niter = 2000, were 0.309 in the center region and 0.771 in the scatter region.
FIGURE 5.
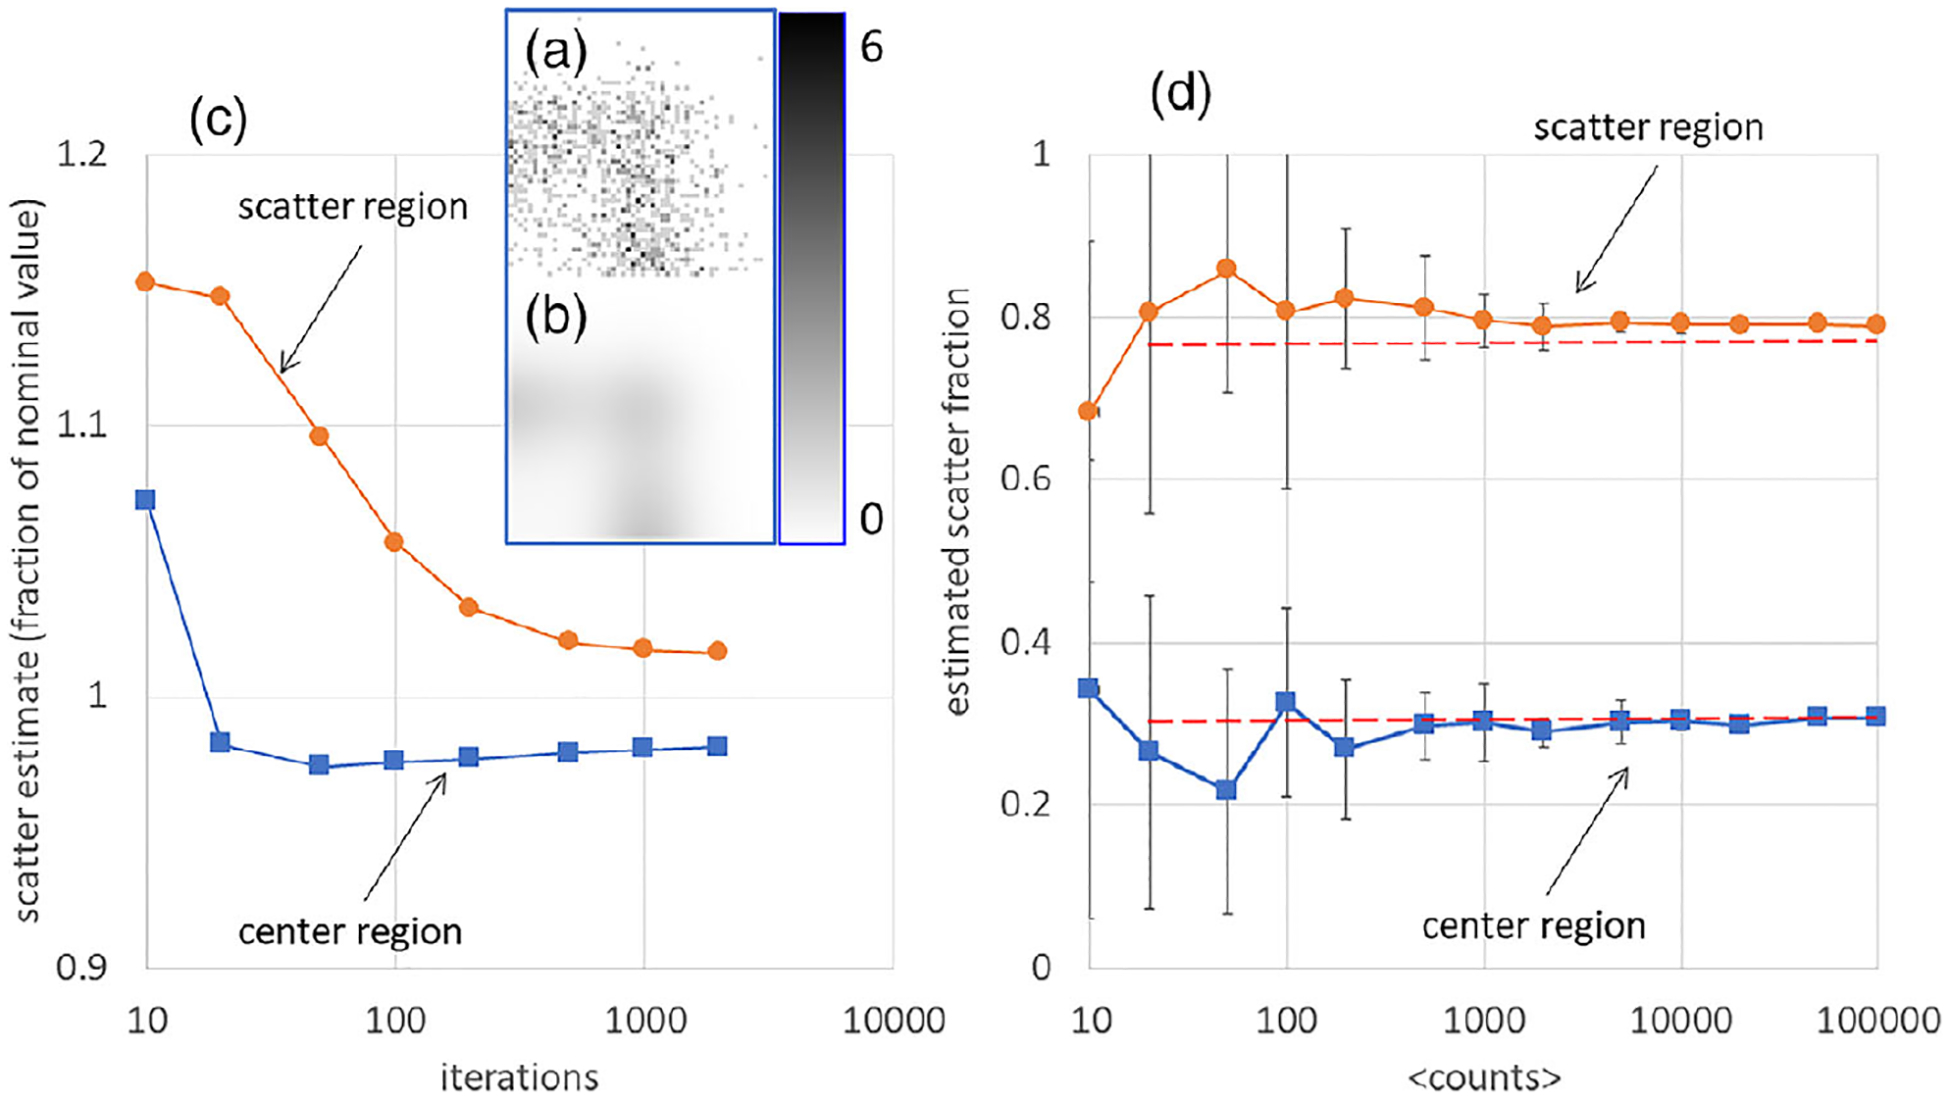
(a) One of the 1000-count 2D energy histograms used to demonstrate convergence in the scatter region of the sinogram. The color bar indicates the grayscale range from 0 to 6 counts per bin. (b) EBS fit to 2D energy histogram in (a). (c) In the case of 1000 actual counts in the 2D energy histogram, the relative number of scattered counts in the center and scatter regions, is plotted versus the number of iterations. Scatter estimates were divided by the value for 2000 iterations and one million counts. (d) In the case of 200 iterations, the estimated scatter fraction in the center and scatter regions is plotted versus the number of counts. Ensemble standard deviations are represented by error bars. Dashed lines represent the actual scatter fractions.
The numerical experiment, combined with other ad-hoc tests, confirmed that 200 iterations of (4) was an acceptable stopping rule. Accordingly, 200 iterations were used in all phantom and patient scans described here. The analysis showed that individual noise realizations (corresponding to individual coarsely-sampled sinogram bins in patient scans) could lead to substantial errors in estimated scatter, but the errors averaged almost to zero in statistical ensembles and were little affected by the number of iterations, indicating that, in practice, variations in the EBS estimate are mainly due the number of counts in the coarse sinogram bins.
3.3 |. EBS computation time
EBS computation time was dominated by sorting of the list-mode data and by 200 iterations of (4). The time on the laptop PC described above was about 4 min per bed position. CPU utilization was 15 to 30% during the EBS computation, indicating the possibility of a substantial speedup if more efficient coding were used.
3.4 |. Phantoms
Figure 6 shows the EBS transverse image section used for NEMA NU2–2018 IQ analysis. The plotted circular regions were drawn by the automated software and represent pixels from which values were derived for residual in the lung insert, CR and background variability. For the three SC methods, Figure 7 plots residual image values in the phantom’s lung insert, and also plots the CR. Table 1 also presents these results. Since the residual is believed to represent the effectiveness of SC, this figure indicates that both SSS and EBS reduced scatter in this region by about an order of magnitude compared to NOSCAT.
FIGURE 6.
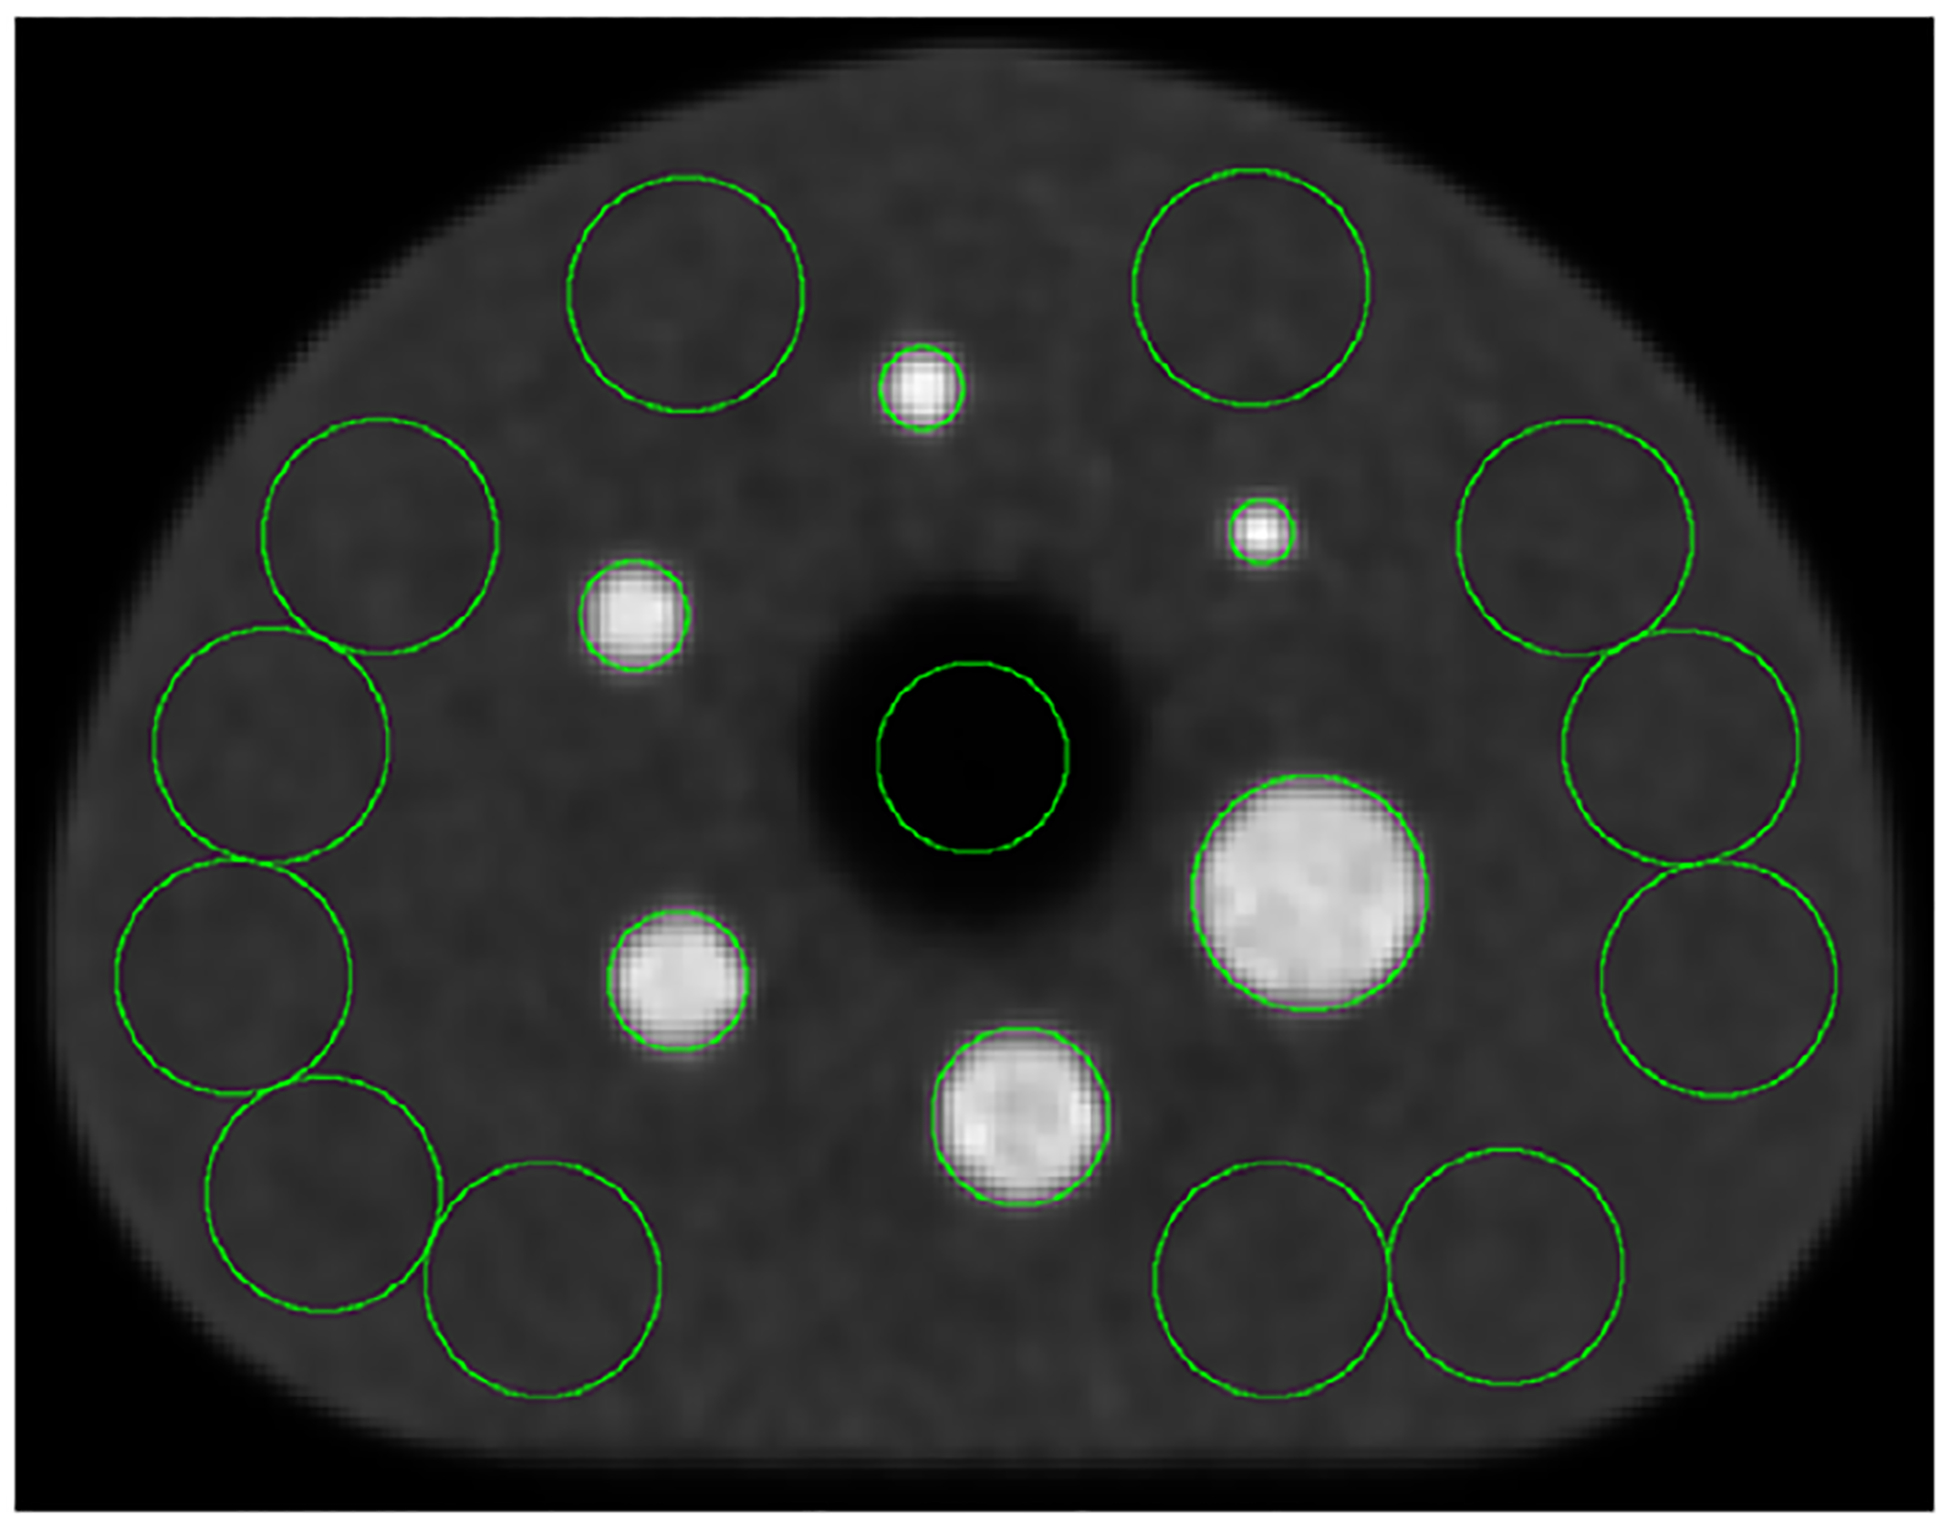
Transverse image section of the IQ phantom, reconstructed with SC by the EBS method.
FIGURE 7.
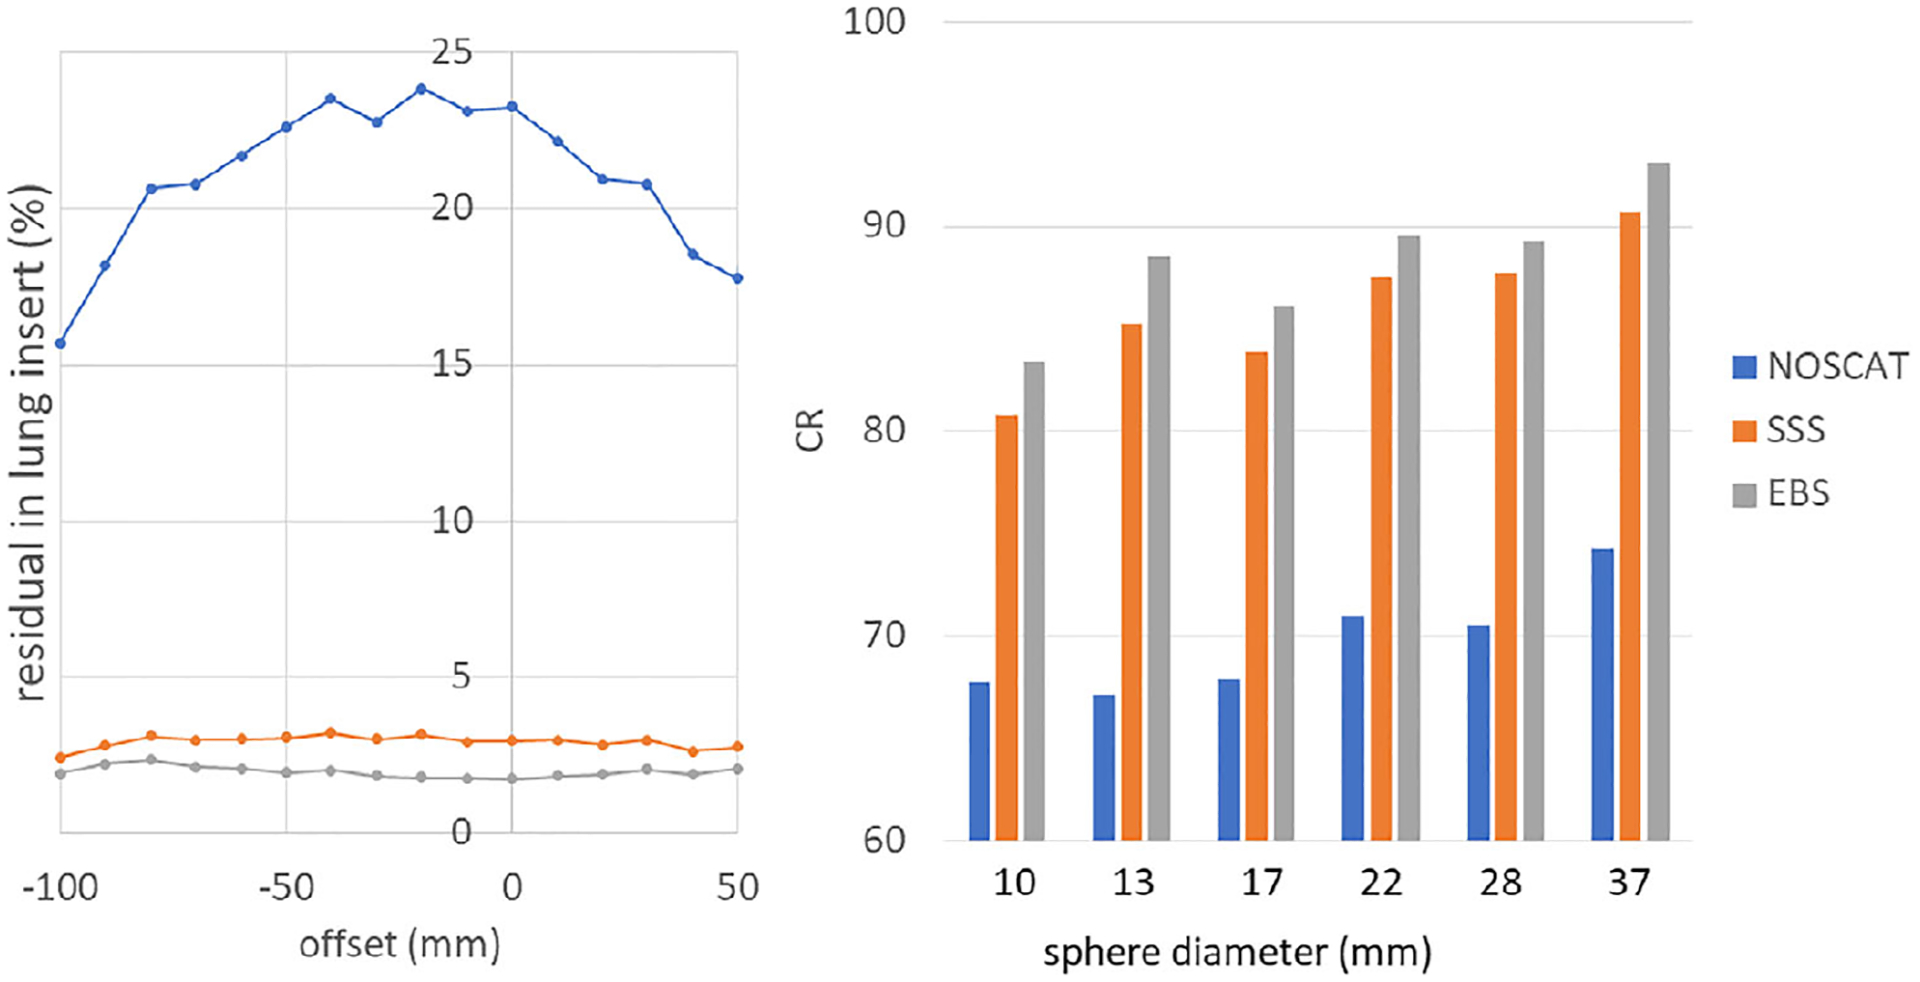
Left: residual in image of the lung insert in the IQ phantom, which indicates the relative amount of scatter, is plotted versus axial position according to NEMA NU2–2018. Right: CR in six hot spheres.
TABLE 1.
Background variability, CR, and image total in the scan of the IQ phantom. All figures of merit are expressed as percentages.
| NOSCAT | SSS | EBS | |
|---|---|---|---|
| Average background variability | 3.19 | 1.83 | 2.03 |
| CR for 10 mm sphere | 67.8 | 80.7 | 83.4 |
| CR for 13 mm sphere | 67.1 | 85.3 | 88.5 |
| CR for 18 mm sphere | 67.9 | 83.9 | 86.1 |
| CR for 22 mm sphere | 71.0 | 87.5 | 89.5 |
| CR for 28 mm sphere | 70.5 | 87.8 | 89.3 |
| CR for 37 mm sphere | 74.3 | 90.7 | 93.1 |
| Image total relative to SSS | 146.5 | 100.0 | 94.1 |
Figure 8 shows image sections from scan 2, using the three SC methods, and shows the locations of profiles from which CR was derived. CR values are presented in Table 2.
FIGURE 8.
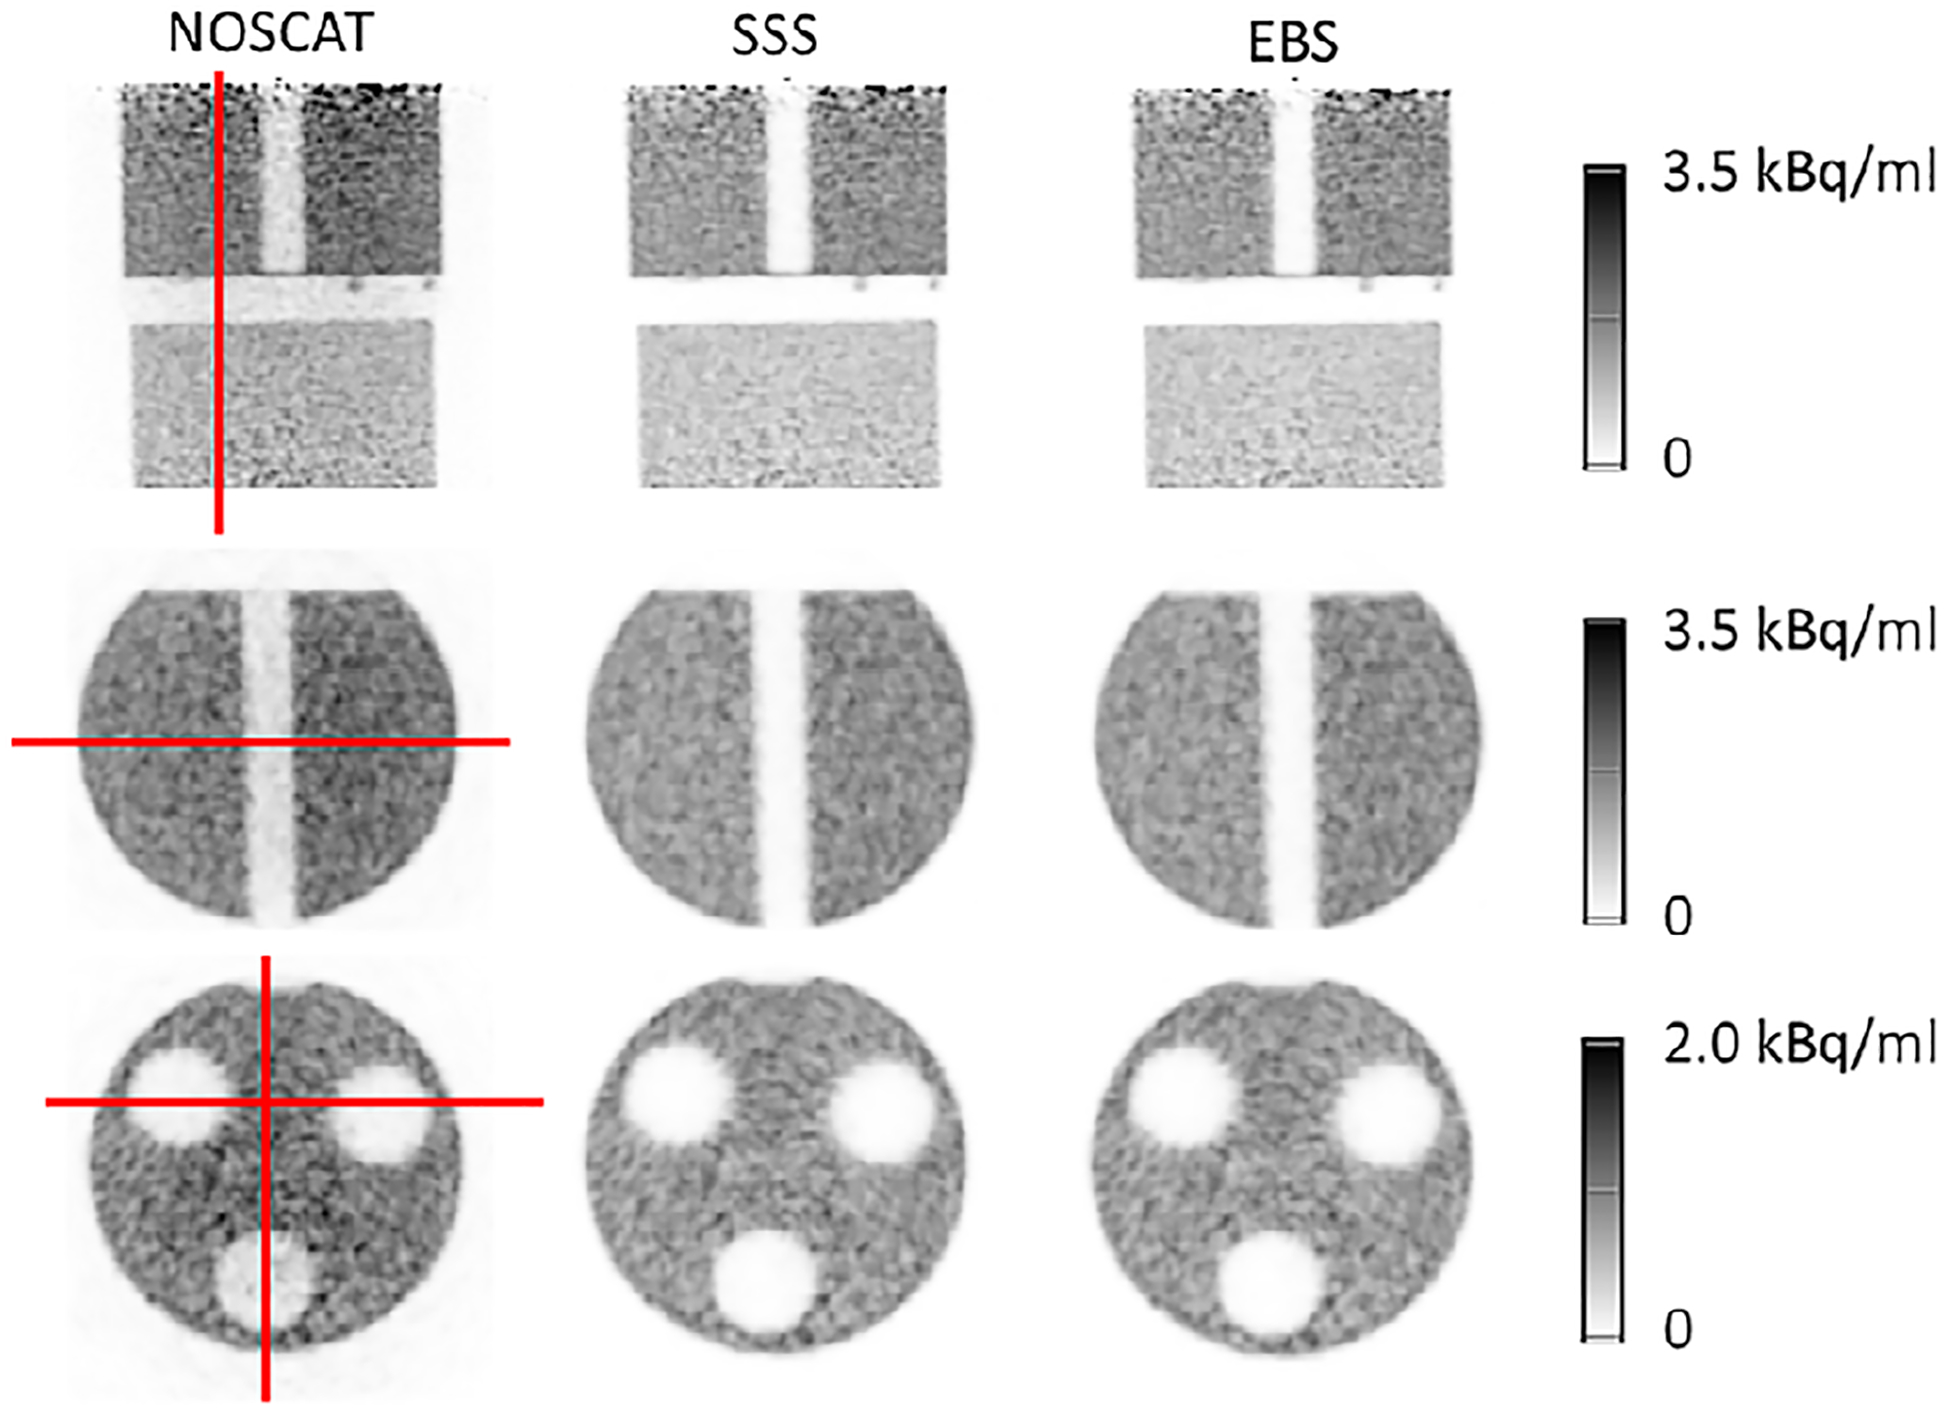
Image sections from scan 2 of a complex phantom. The three columns correspond to the NOSCAT, SSS and EBS methods. Top row: coronal section through both phantoms. Middle row: transaxial section through the slab phantom. Bottom row: transaxial section through the NU2–1994 phantom. Also shown are the profiles used to evaluate CR through the cold gap between the phantoms (top), the cold slab (middle), and two cold cavities (bottom).
TABLE 2.
CR and image total (percent) in scan 2 of the NU2–1994 and slab phantoms.
| NOSCAT | SSS | EBS | |
|---|---|---|---|
| CR in axial gap between slab and NEMA phantoms | 73.2 | 98.0 | 98.7 |
| CR in slab | 73.2 | 94.7 | 95.4 |
| CR in NU 2-1994, 2 cold cylinders | 91.1 | 97.5 | 97.6 |
| CR in NU 2-1994, 1 cold cylinder | 81.0 | 97.5 | 98.2 |
| Image total relative to SSS | 140.2 | 100.0 | 98.5 |
Figure 9 shows fused PET/CT images from the scan of the cardiac phantom, reconstructed with SC by the three methods. Since the myocardium was filled incompletely, an air bubble was at the phantom’s apex in scan data. The bubble can be seen in the images. CR in the simulated cardiac ventricle are reported in Table 3. This data set has a complicated interpretation. SSS seemed more accurate than EBS, as indicated by CR. Image profiles indicated uncorrected residual scatter tails adjacent to the wall of the simulated myocardium. However, analysis of the sinograms themselves indicated that SSS overestimated scatter by 15 to 30% in the scatter region, while EBS underestimated scatter by a similar amount. This is shown quantitatively and qualitatively in Figure 10, which presents the full-resolution sinogram at 0 and 90 degree view angles along with sinogram views when the SSS and EBS sinograms had been subtracted. These observations suggested that neither SSS nor the EBS method was perfectly accurate, and that low CR values in the SSS image could have been due to the overcorrection.
FIGURE 9.

Fused PET/CT images of the cardiac phantom when activity was only present in the simulated myocardium.
TABLE 3.
CR and image total (percent) from scan 3 of the cardiac phantom.
| NOSCAT | SSS | EBS | |
|---|---|---|---|
| CR in the cardiac ventricle | 95.7 | 99.6 | 98.2 |
| Image total relative to SSS | 180.1 | 100.0 | 110.3 |
FIGURE 10.
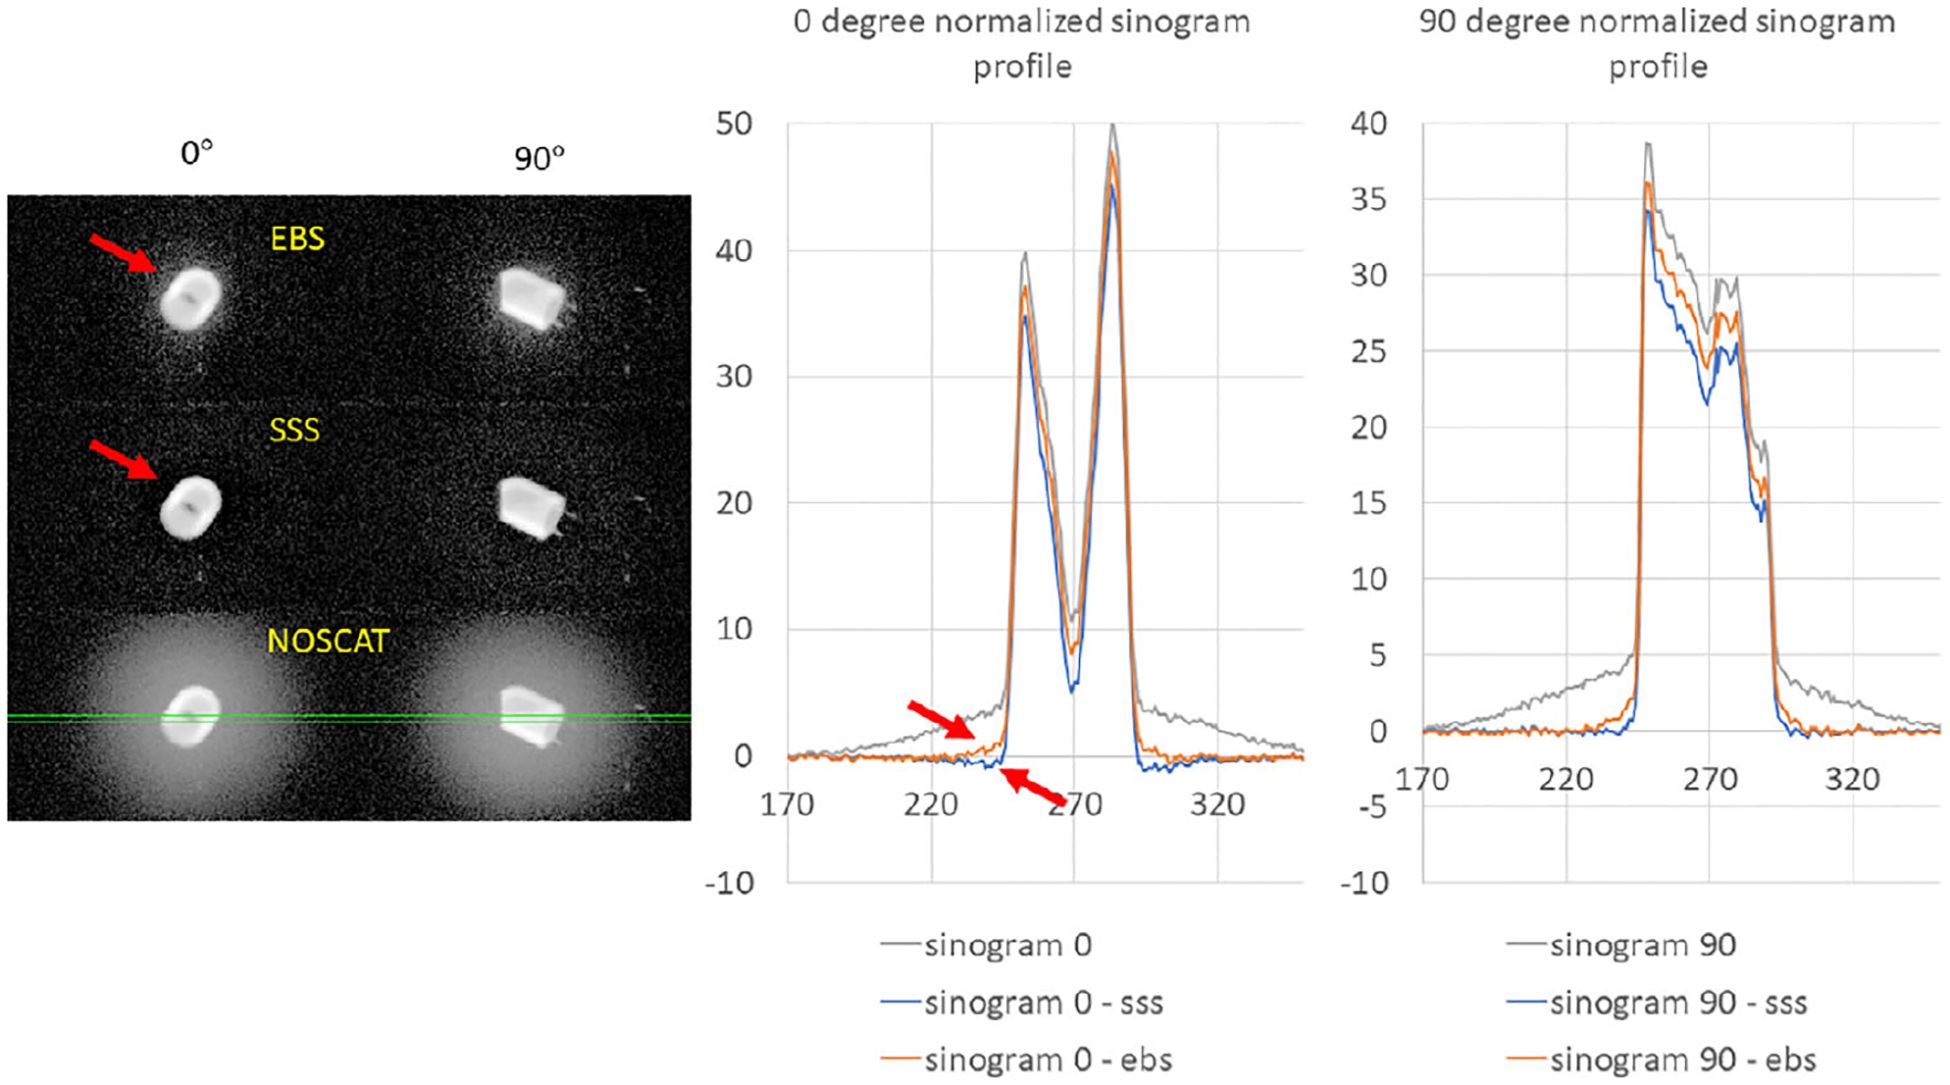
On the left: three views of the normalized sinogram in the scan of the cardiac phantom, at view angles 0 and 90 degrees. Grayscale values are logarithmically scaled from 0.01 to the maximum. Top left: the EBS scatter estimate was subtracted from the sinogram. Middle left: the SSS scatter estimate was subtracted. Bottom left: no scatter correction. Solid green lines indicate a region on which sinogram profiles were extracted. On the right: the sinogram profiles are plotted at 0 and 90 degree sinogram angles. Arrows indicate areas where scatter was underestimated or overestimated.
Figure 11 shows coronal image sections from scan 4, again using the three SC methods, and plots an axial image profile. The extent of PET artifact due to scatter was quantified by averaging the profiles in two 3-cm axial regions, one in the low-scatter superior region and one region extending to just 0.3 cm from the inferior edge, and forming the ratio of the averages. This ratio, whose value should ideally be 100%, was 351% for the NOSC image, 399% for the SSS image, and 83.4% for the EBS image.
FIGURE 11.
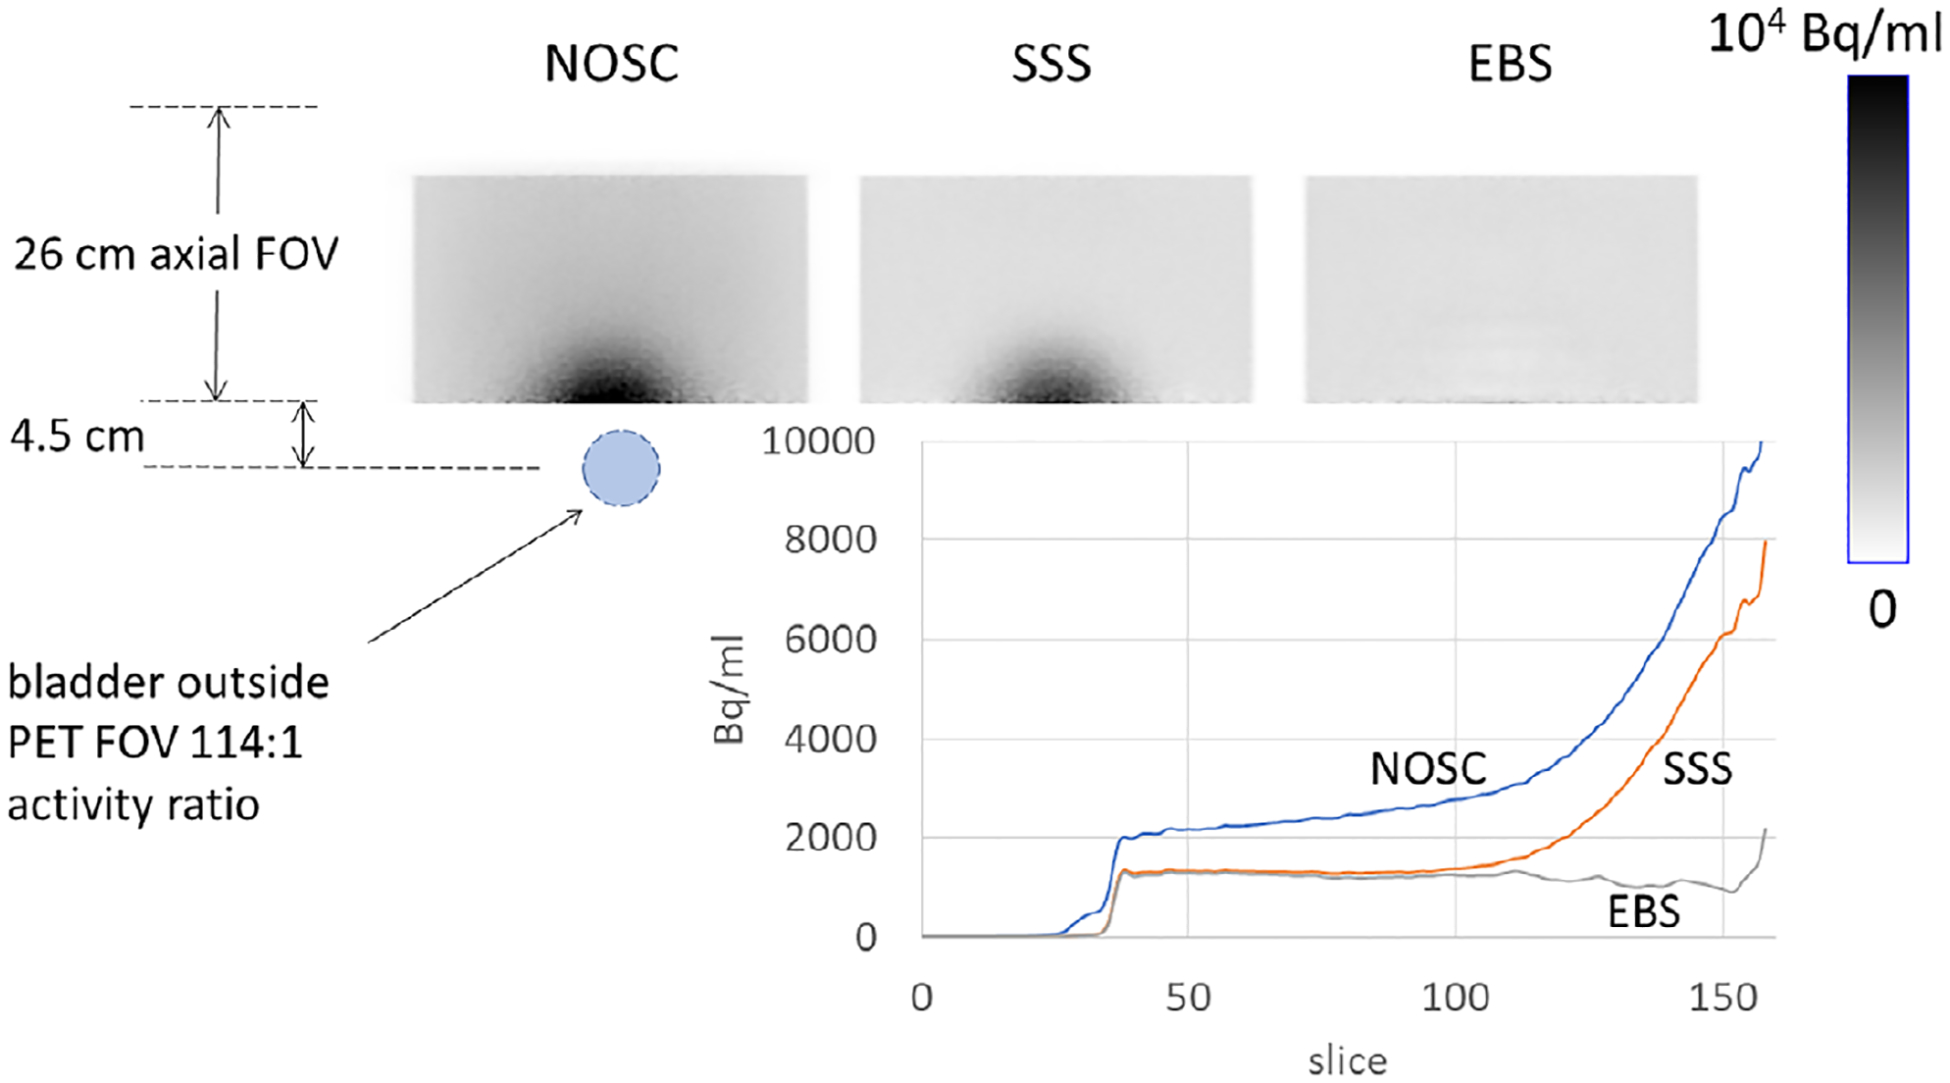
Coronal sections through the scan of the torso + bladder phantom, also showing the relative location of the hot bladder and plotting the axial profiles of PET image values.
3.5 |. Patients
Figure 12 compares coronal sections of a typical patient, reconstructed with SC by the three methods, and presents an image of the difference between the EBS and SSS images. SUV was quantified in 28 lesions and other areas of avid FDG uptake, located in the throat, axilla, chest, spine and gut. This included four lesions that were present in the 100%, 50% and 25% count-reduction scans. Areas of uptake were 2 cm or less in size. The correlation between SUV obtained by the two methods is plotted in Figure 13. The spreadsheet program determined the following regression relation and correlation:
| (12) |
FIGURE 12.
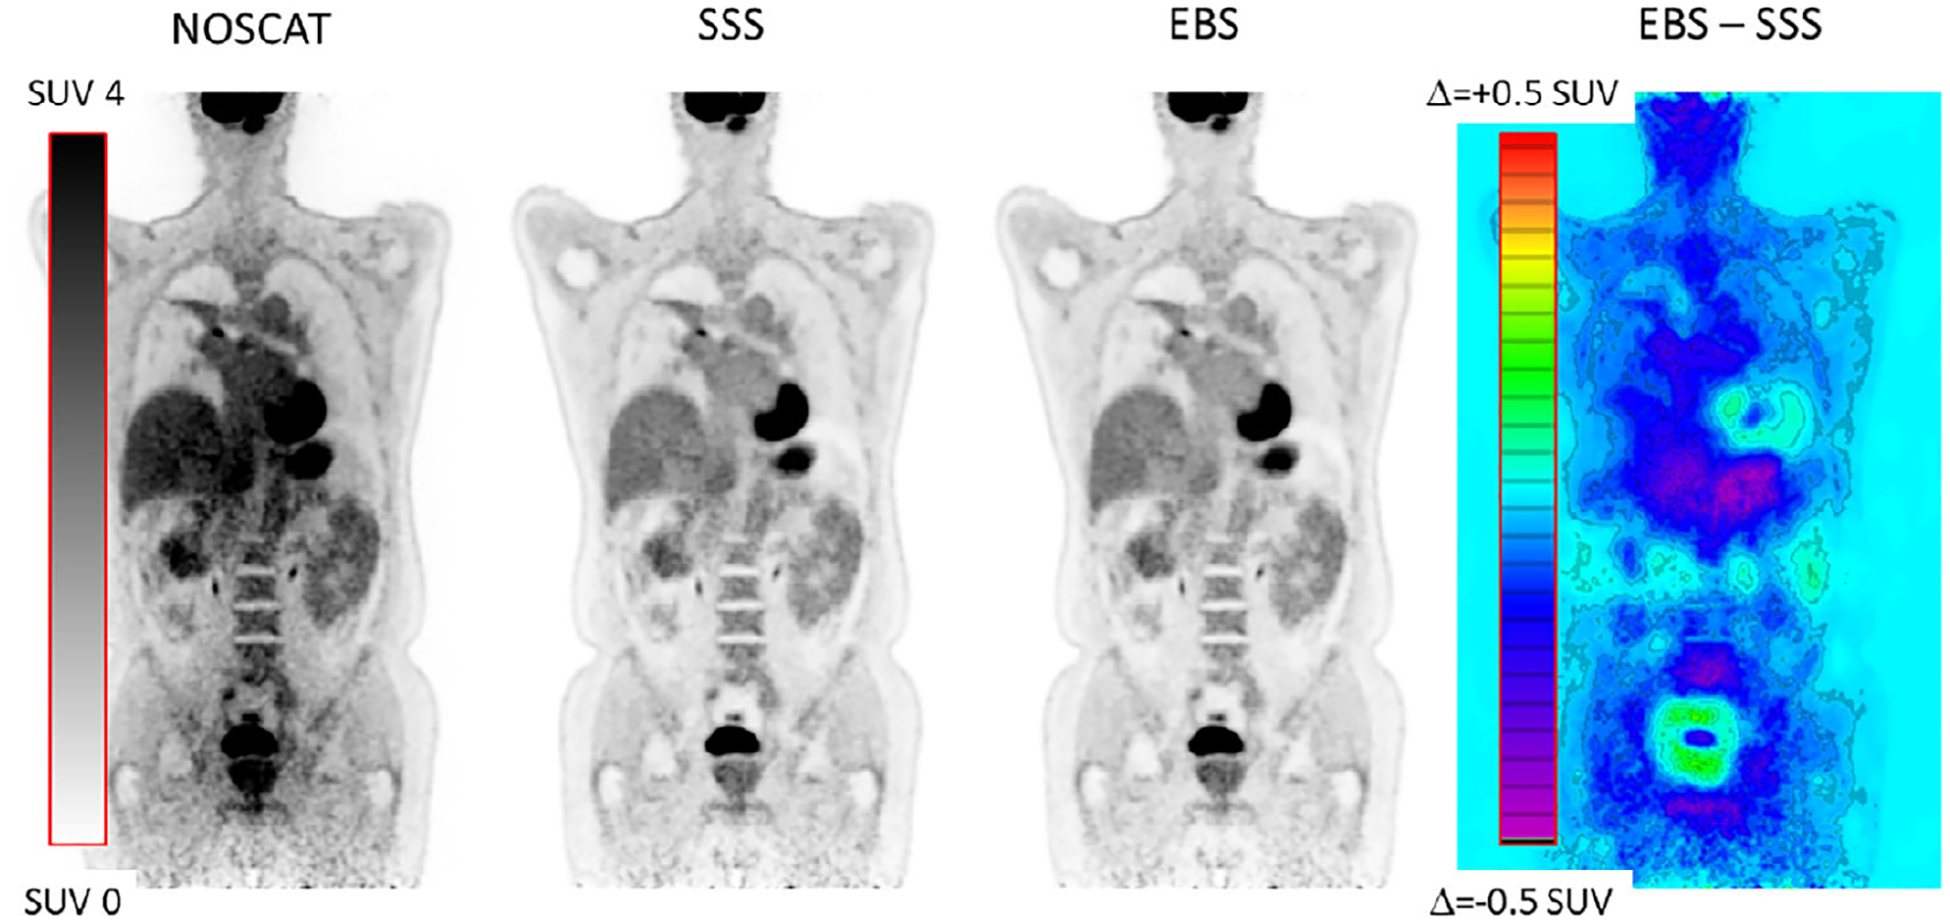
Coronal image section from a patient scan, comparing SSS and EBS scatter correction. Also shown is the NOSCAT section and the difference between EBS and SSS.
FIGURE 13.
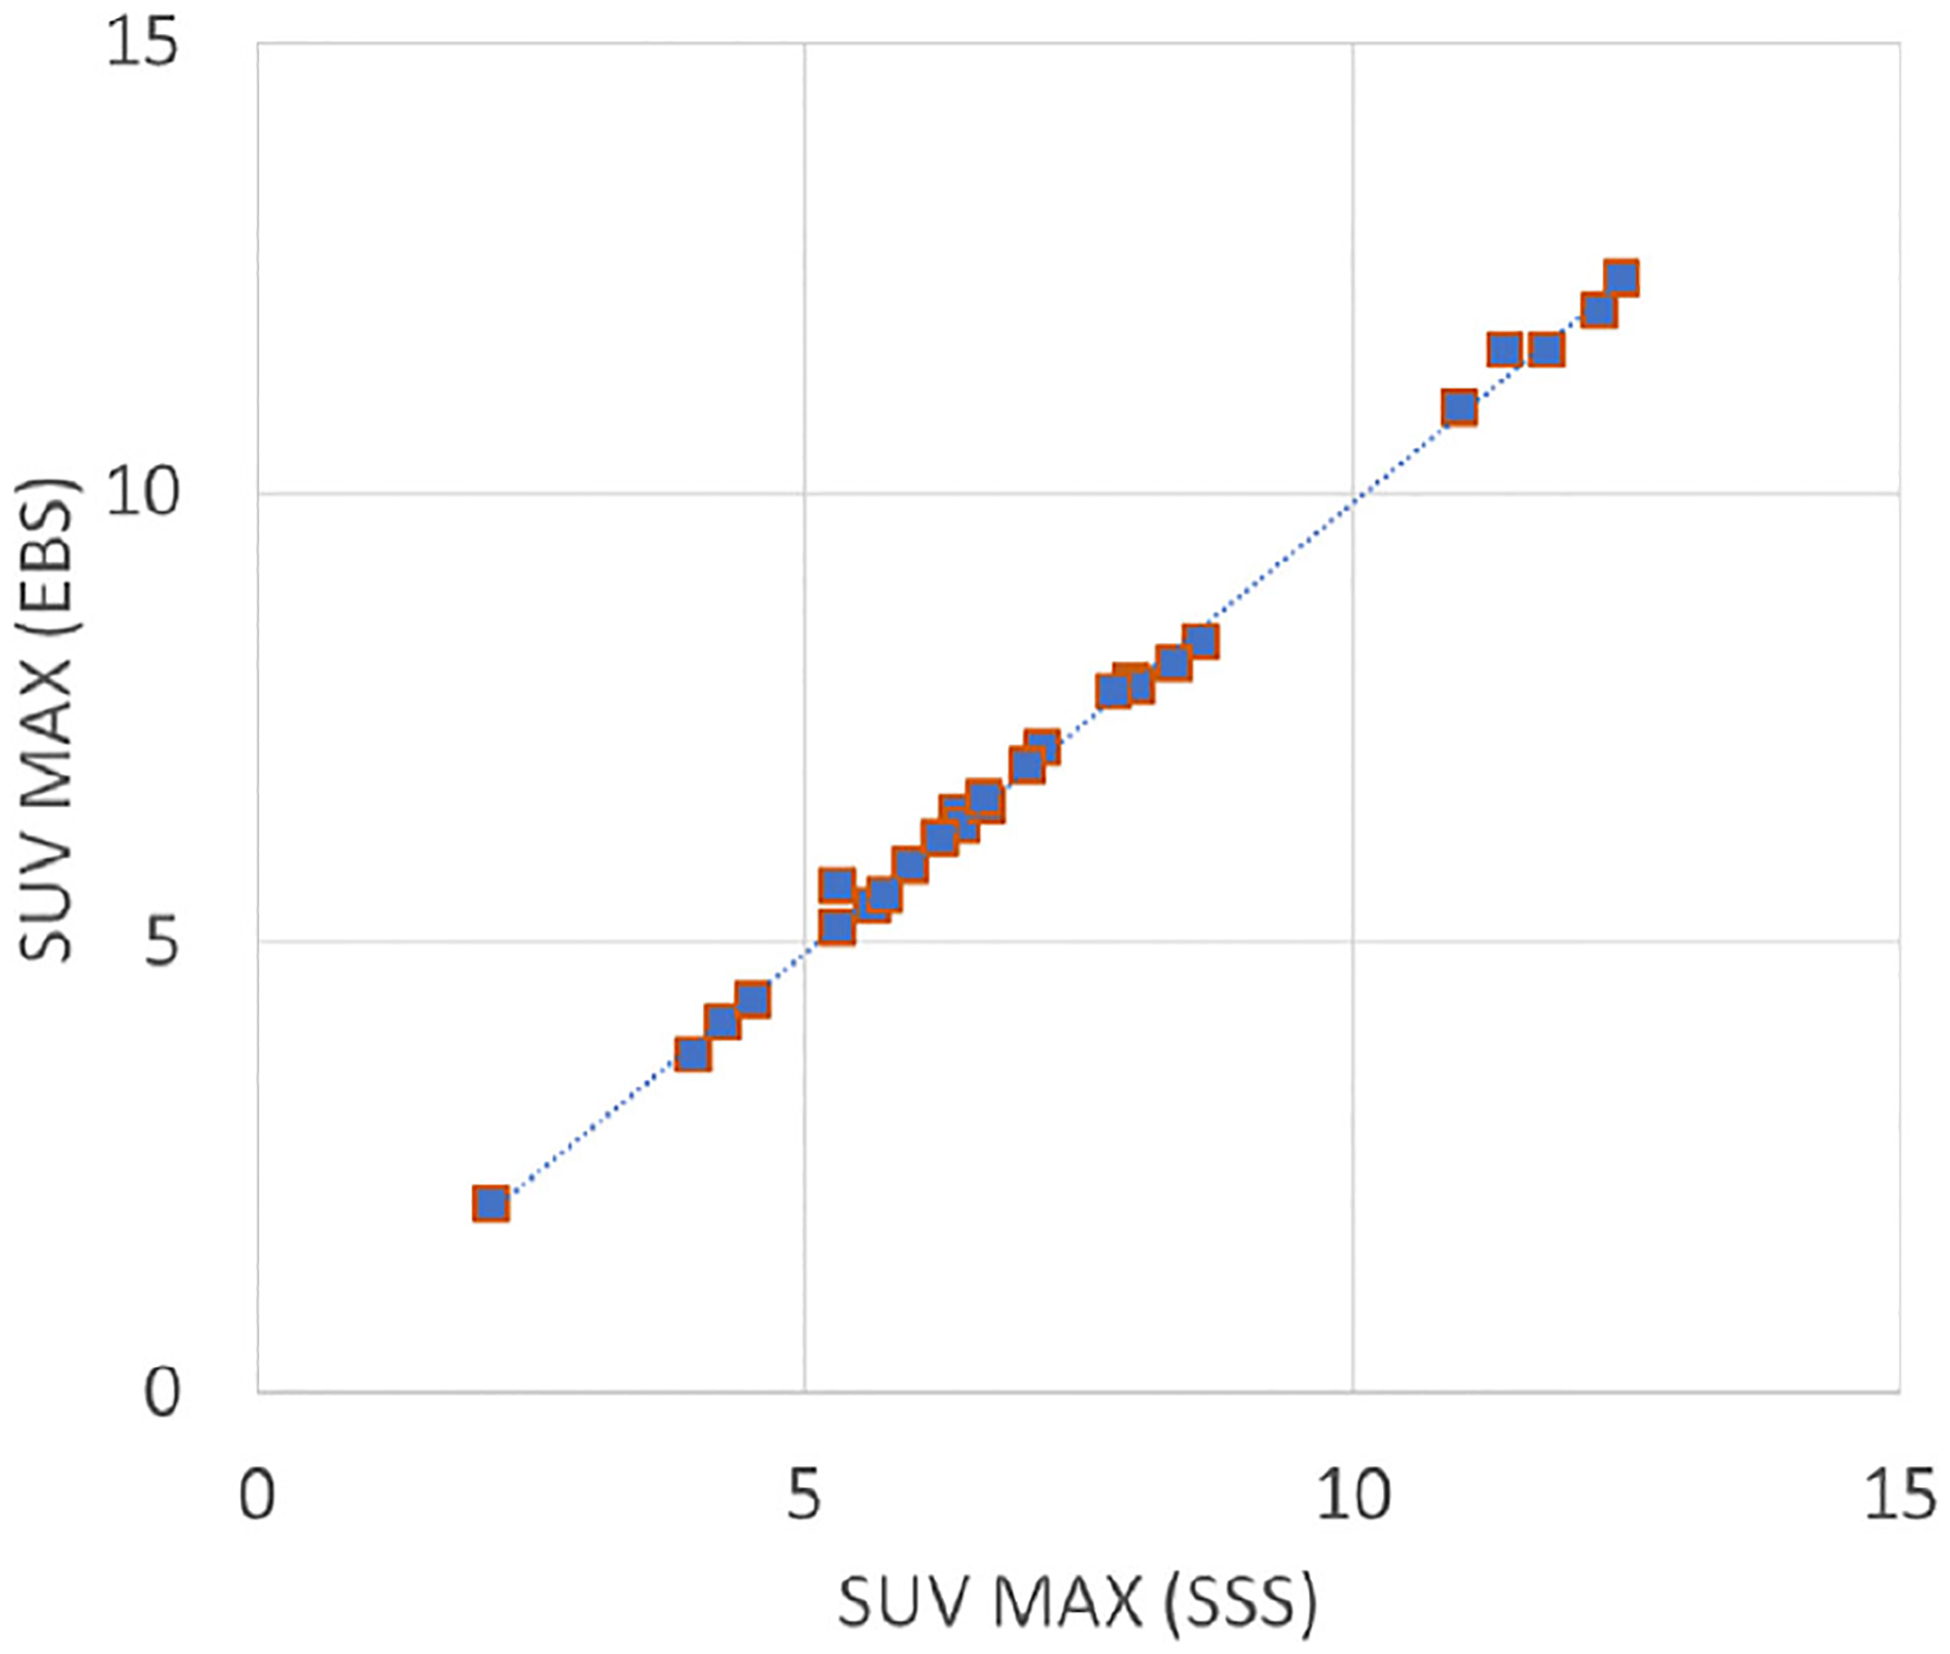
Correlation between SUV in 28 lesions. A trend line is also plotted.
Although the SSS and EBS images were visually similar, the difference image in Figure 12 indicated that background values in the EBS image were indeed slightly lower than SSS on average, but values were slightly higher in some areas, for example, around the bladder and the heart. Similar patterns were seen in all seven patients. In the count-reduction tests, the ratio of SUV based on EBS to SUV based on SSS was stable as counts were reduced. The ratio had these values: 0.980 (first lesion, 100% counts), 0.984 (first lesion, 50% counts) and 1.016 (first lesion, 25% counts); 0.967, 0.964, and 0.976 (second lesion); 0.976, 0.990, and 0.961 (third lesion); and 0.996, 0.995, and 0.993 (fourth lesion).
4 |. DISCUSSION
In 2006, Popescu et al. proposed an energy-based SC formalism that could be implemented in any of several ways.12 Efthimiou et al. recently implemented Popescu’s moments approach and tested it in phantoms.13 That work used the energies of A and B photons separately (1D) and included a method to measure the shape of the scatter energy spectrum. The present paper is based on the suggestion in Popescu’s paper that a statistical model could be used. In this case, the A and B energies were used in combination (2D), a more complex model of the scatter energy spectrum was assumed, and both phantom and patient tests were used in the evaluation.
EBS compared favorably to SSS. Images were visually similar. In most of the tests, CR was slightly higher when EBS was used instead of SSS, the difference being 2% on average. In the NEMA NU2–2018 evaluation, background variability was 10% higher when EBS was used, perhaps because the scatter sinogram itself was noisy. Tables 1, 2, and 3 show that EBS image totals in phantom tests were 5.9% and 1.5% lower in two of the phantom tests, and 10.3% higher in the test of the cardiac phantom. Figure 13, based on patient studies, shows that hot-lesion SUV in the SSS and EBS images were strongly correlated. Linear-regression analysis indicated that, on average, lesion uptake in the EBS images was 0.1 SUV lower than in the SSS images.
This investigation used 18F-based tracers. Some clinically used PET tracers are labeled with complex isotopes, sometimes called dirty isotopes, where positron decay can be accompanied by an uncorrelated gamma ray that can lead to a different kind of background, that, like simple scatter, also should be excluded but is not expected to be modeled properly by the basis functions defined for 18F. Examples are 68Ga, 124I and 82Rb. In fact, we did use 68Ge/68Ga sources to derive the photopeak energy spectrum. This was possible because spectra were collected in the part of the sinogram where normal positron-decay coincidences were expected to dominate. In future investigations we will attempt to extend EBS to include some of the dirty isotopes. Different basis functions, stopping criteria and so on may be necessary.
EBS, as described in this work, estimates prompt or delayed scatter in each individual bin of a coarsely-sampled TOF sinogram, based only on the distribution of counts in that bin. In two ways, this approach differs fundamentally from SSS which estimates scatter from the whole PET image in the current field of view. First, EBS automatically includes information arising outside the PET FOV, which the simplest implementation of SSS does not. Second, the level of noise in the EBS scatter estimate may be strongly influenced by the limited number of counts. In fact, no solution is possible when the number of counts approaches zero. A natural way of dealing with this problem would be to sample the sinogram more coarsely. That approach was not considered in this work.
When EBS was compared to SSS and NOSCAT, most figures of merit indicated comparable scatter reduction by EBS and SSS. CR was slightly higher (better) in EBS in every case except for the cardiac phantom, and in this case there was reason to believe that SSS slightly overestimated the scatter whereas EBS may have underestimated it. EBS’s slight overestimation of scatter resulted in slightly lower PET image values, including lesion SUV. This, we believe, was partly due to a different energy spectrum in the background of delayed coincidences, particularly at the high end of the energy range. Also, it could be partly due to an algorithmic step, mentioned above, in which the scatter is set to 100% in the case of nine counts or less, avoiding the need to solve an over-determined equation. In the image quality phantom, EBS had 11% higher (worse) background variability. This type of non-uniformity is likely to have only a small effect in imaging of regions of high uptake and, conversely, more importance when one tries to quantify uptake in smaller structures. We speculate that the variability may be due to noise in the scatter sinogram, which if true may indicate a potential benefit from reducing that noise source.
The EBS basis functions represent small-angle and large-angle scatter, based on a Monte Carlo simulation of a 20-cm cylinder filled uniformly with activity. It seems possible that this model could fail in the limit of an isolated point or line source in a radioactivity-free medium, for example, phantoms used to measure a PET scanner’s scatter rejection. The consequences in PET reconstruction have not been explored. The use of this model was based on the observation that, in most clinical PET situations, the radiotracer is distributed widely across the body, though not homogeneously. In this connection, it is interesting to consider patterns in the difference image in Figure 12. Reconstructed image values in the urine pool in the bladder were lower in the EBS image compared to the SSS image, but higher in the area around it. A similar phenomenon is seen around the heart. These phenomena might indicate that, because small-angle scatter is explicitly modeled as a scatter component separate from large angle scatter, and because no global smoothness criterion is imposed (each coarse sinogram bin is treated independently of the neighboring ones) EBS scatter contains more high frequencies than SSS scatter. Whether this interpretation is correct, and whether this can lead to a better image, are questions left for future investigation.
Phantom scan 4 simulated a one-bed-position PET scan with an intensely hot region barely outside the PET field of view. This was a severe test which SSS was expected to fail, since most of the detected radiation came from a location not known to the simulation. Indeed, the inferior part of the SSS image was 299% times hotter than the superior part, compared to 16% colder with EBS. It is fair and relevant to notice that no obvious artifacts of this magnitude were noticed in the seven clinical PET scans in this investigation, indicating that the phantom scan was more of a worst case than a typical result. The EBS result was much more uniform because, in fact, information from adjacent positions is automatically included in the energy spectra, even in a scan of just one position. The slight underestimation has not been explained completely. We speculate that the underestimation is due to inaccurate up-sampling of the normalized scatter estimate, which was assumed to change linearly with axial position whereas a more complicated behavior may model the situation more accurately. Fortunately, the hot-bladder artifact in SSS has, in the last few years, been addressed by combining data from adjacent bed positions.
Table 4 summarizes some of the ways in which SSS might sometimes lead to a clinically significant, SC-related artifact, and how the use of EBS is expected to help. Anecdotally, the situations listed here sometimes occur in clinical PET/CT.
TABLE 4.
Potential problems with SSS, and EBS’s behavior in these situations.
| Problem in SSS | Effect on the SSS scatter estimate | Effect on the SSS image | How EBS should respond | Related concerns or issues |
|---|---|---|---|---|
| Activity outside the axial FOV | Underestimation | Hot image artifacts | EBS handles this problem naturally | |
| Spilled activity on clothing or blankets | Overestimation | Photopenic regions in which hot spots can disappear | EBS handles this problem naturally | |
| Motion between CT scan and PET scan | Incorrect attenuation map leads to an incorrect scatter estimate, possibly underestimating the amount of scatter | Unpredictable | EBS handles this problem naturally | Because of motion, the AC of unscattered radiation is likely to be incorrect even if SC is correct |
| Standard SSS does not include multiple scatter | Unpredictable | Unpredictable | EBS is expected to handle this problem naturally | However, EBS’s correct behavior in this case has not been demonstrated |
| Low counts | Tail fitting can fail due to inadequate counts | Axial streaking because estimated scatter varies with axial position | The scatter estimate is expected to be noisy, but correct in an ensemble average (Figure 5) and axial streaks are not expected | Increased noise can be handled by sampling the sinogram more coarsely. However, this has not been demonstrated. |
Improvements in the EBS computation are certainly possible. Scatter estimation time was longer than image reconstruction itself, even though it was restricted to segment 0. Next steps could include: extending the method to all sinogram segments, further increasing the computation time; testing of shortcuts, like ones analogous to the ordered-subsets approach used in PET image reconstruction,25 or the use of pattern recognition for the 2D histograms; exploring the possibility of deep-learning approaches in each sinogram bin; and the use of more efficient coding. It is also of interest to ask if noise in the scatter estimate affects the PET image in important ways, and if it does then one should solve the problem carefully, perhaps with rules to down-sample the sinogram differently in the case of low counts, or by using reasonable regularization techniques. In fact, the possibility of using energy-based scatter parameters in image reconstruction has long been a goal in this area of research.8,13
EBS’s behavior in low-count studies is an area for future investigation. The present study demonstrated that the EBS scatter estimate converges, on average, to the correct value as the number of counts is reduced, while the uncertainty increases. This is indicated by error bars in Figure 5. The present study included one patient study in which the number of counts was reduced by factors of 2 and 4, with hardly any effect on SUV.
SSS, the state of the art, has been constantly improved over the decades to work well with each succeeding generation of PET scanners, including PET/CT and PET/MR. EBS, described in this paper, is an alternative approach that gives comparable results in typical clinical conditions. SSS does rely on the assumption of PET’s good registration with the attenuation map, as well as other limitations mentioned above. For cases like PET/MR or standalone PET, or even PET/CT when there the registration of PET and CT is incorrect, or when other problems affect the SSS calculation, EBS can be considered as an alternative.
5 |. CONCLUSIONS
Clinically relevant parameters, for example SUV in focal lesions, were almost the same in PET/CT images based on EBS and SSS scatter estimation. The EBS approach described here was parameter-free and avoided ad-hoc procedures like tail fitting to account for missing information. In phantoms, some scatter figures of merit were slightly improved by use of EBS, though an image variability figure of merit was slightly degraded. In PET/MR and in typical oncological whole-body PET/CT, EBS may be a suitable alternative to SSS, especially when SSS fails due to technical problems during the scan.
ACKNOWLEDGMENTS
For their support, insights, and encouragement, we thank Mehmet Aykac, Harshali Bal, Matthew Restivo, Joshua Scheuermann, Stefan Siegel, and Reza Teimoorisichani. This work was supported in part by the National Institutes of Health grant numbers R01-CA113941 and R56-EB03358 and a research collaboration between Siemens Medical Solutions and the University of Pennsylvania (Daniel Pryma, PI).
Footnotes
CONFLICT OF INTEREST STATEMENT
James Hamill and Jorge Cabello are employed by Siemens Medical Solutions, USA, Inc.
DATA AVAILABILITY STATEMENT
Digitized PET images of phantoms are available on request.
REFERENCES
- 1.Zaidi H, Koral FK. Scatter modelling and compensation in emission tomography. Eur J Nucl Med Mol Imaging. 2004;31(5):761–782. [DOI] [PubMed] [Google Scholar]
- 2.Ollinger JM. Model-based scatter correction for fully 3D PET. Physics in Medicine and Biology. 1996;41 (1):153. [DOI] [PubMed] [Google Scholar]
- 3.Watson CC, Newport D, Casey ME, DeKemp RA, Beanlands RS, Schmand M. Evaluation of simulation-based scatter correction for 3-D PET cardiac imaging. IEEE Trans Nucl Sci. 1997;44(1):90–97. [Google Scholar]
- 4.Eichling JO, Ter-Pogossian MM, Rhoten AL, Gottschalk A, Beck RN. Analysis of the scattered radiation encountered in lower energy diagnostic scanning. Fundamental Problems in Scanning. Thomas Charles C.; 1968. [Google Scholar]
- 5.Jaszczak RJ, Greer KL, Floyd CE Jr, Harris CC, Coleman RE. Improved SPECT quantification using compensation for scattered photons. J Nucl Med. 1984;25(8):893–900. [PubMed] [Google Scholar]
- 6.DeVito RP, Hamill JJ, Treffert JD, Stoub EW. Energy-weighted acquisition of scintigraphic images using finite spatial filters. J Nucl Med. 1989;30(12):2029–2035. [PubMed] [Google Scholar]
- 7.Grootoonk S, Spinks TJ, Jones T, Michel C, Bol A, Correction for scatter using a dual energy window technique with a tomograph operated without septa. In Conference Record of the 1991 IEEE Nuclear Science Symposium and Medical Imaging Conference. 1991:1569–1573. [Google Scholar]
- 8.Bendriem B, Trebossen R, Frouin V, Syrota A, A PET scatter correction using simultaneous acquisitions with low and high lower energy thresholds. In Conference Record of the 1993 IEEE Nuclear Science Symposium and Medical Imaging Conference. 1993:1779–1783. [Google Scholar]
- 9.Shao L, Freifelder R, Karp JS. Triple energy window scatter correction technique in PET. IEEE Trans Med Imaging. 1994;4:641–648. [DOI] [PubMed] [Google Scholar]
- 10.Grootoonk S, Spinks TJ, Sashin D, Spyrou NM, Jones T. Correction for scatter in 3D brain PET using a dual energy window method. Phys Med Biol. 1996;41:2757–2774. [DOI] [PubMed] [Google Scholar]
- 11.Laurent B, Bousse A, Merlin T, Nekolla S, Visvikis D. PET scatter estimation using deep learning U-Net architecture. Phys Med Biol. 2023;68(6):065004. [DOI] [PubMed] [Google Scholar]
- 12.Popescu LM, Lewitt RM, Matej S, Karp JS. PET energy-based scatter estimation and image reconstruction with energy-dependent corrections. Phys Med Biol. 2006;51(11):2919–2937. [DOI] [PubMed] [Google Scholar]
- 13.Efthimiou N, Karp JS, Surti S. Data-driven, energy-based method for estimation of scattered events in positron emission tomography. Phys Med Biol. 2022;67(9):095010. [DOI] [PMC free article] [PubMed] [Google Scholar]
- 14.Hamill JJ, 2D energy histograms for scatter estimation in an SiPM PET scanner. In Conference Record of the 2019 IEEE Nuclear Science Symposium and Medical Imaging Conference. 2019. [Google Scholar]
- 15.Fahey FH. Data acquisition in PET imaging. J Nucl Med Tech. 2002;30(2):39–49. [PubMed] [Google Scholar]
- 16.Panin VY, Aykac M, Hong I. TOF data compression on high time resolution clinical scanner. Conference Record of the 2018 IEEE Nuclear Science Symposium and Medical Imaging Conference. 2018. [Google Scholar]
- 17.Guérin B, El Fakhri G. Novel scatter compensation of list-mode PET data using spatial and energy dependent corrections. IEEE Trans Med Im. 2010;30(3):759–773. [DOI] [PMC free article] [PubMed] [Google Scholar]
- 18.Shepp LA, Vardi Y. Maximum likelihood reconstruction for emission tomography. IEEE Trans Med Im. 1982;1(2):113–122. [DOI] [PubMed] [Google Scholar]
- 19.Snyder DL, Politte DG. Image reconstruction from list-mode data in an emission tomography system having time-of-flight measurements. IEEE Trans Nucl Sci. 1983;30(3):1843–1849. [Google Scholar]
- 20.Sarrut D, Bała M, Bardiès M, et al. Advanced Monte Carlo simulations of emission tomography imaging systems with GATE. Phys Med Biol. 2021;66(10):10TR03. [DOI] [PMC free article] [PubMed] [Google Scholar]
- 21.Knuth D The Art of Computer Programming, Vol. 2: Seminumerical Algorithms, 2nd ed. Addison-Wesley; 1981. [Google Scholar]
- 22.Panin VY, Kehren F, Rothfuss H, Hu D, Michel C, Casey ME. PET reconstruction with system matrix derived from point source measurements. IEEE Trans Nucl Sci. 2006;53(1):152–159. [DOI] [PubMed] [Google Scholar]
- 23.National Electrical Manufacturers Association (NEMA), Standards Publi-cation NU 2–2012, Performance Measurements of Positron Emission Tomo-graphs (NEMA, Rosslyn, VA, 2012). [Google Scholar]
- 24.Schaefferkoetter J, Nai YH, Reilhac A, Townsend DW, Eriksson L, Conti M. Low dose positron emission tomography emulation from decimated high statistics: a clinical validation study. Med Phys. 2019;46(6):2638–2645. [DOI] [PubMed] [Google Scholar]
- 25.Hudson HM, Larkin RS. Accelerated image reconstruction using ordered subsets of projection data. IEEE Trans Med Im. 1994;13(4):601–609. [DOI] [PubMed] [Google Scholar]
Associated Data
This section collects any data citations, data availability statements, or supplementary materials included in this article.
Data Availability Statement
Digitized PET images of phantoms are available on request.


