Abstract
Existing theories can predict separately the effects of hydrodynamic slip and ion–ion electrostatic correlations on diffusioosmosis. However, a predictive model for the coupled dynamics of hydrodynamic slip and electrostatic correlations in diffusioosmosis is lacking. In this work, we develop a mathematical model to compute the diffusioosmotic mobilities of valence-symmetric electrolytes in a charged parallel-plate channel. We employ the Navier slip condition to model the hydrodynamic slip at the channel walls and the modified Poisson equation to model ion–ion electrostatic correlations. We report two key findings arising from the competition between electrostatic correlations and hydrodynamic slip, which radically change diffusioosmosis. First, in a divalent electrolyte, a minute hydrodynamic slip defers the reversal in the direction of diffusioosmosis caused by electrostatic correlations to a higher concentration. Hydrodynamic slip can even eliminate the diffusioosmosis reversal in a monovalent electrolyte. Second, electrostatic correlations limit the change in the mobility due to hydrodynamic slip, by hindering the slip-enhanced ionic transport via surface charge overscreening. Electrostatic correlations can reduce the change in the mobility by ≈60% in a monovalent electrolyte, whereas the stronger electrostatic correlations in a divalent electrolyte can even reduce the change by an order of magnitude. The model developed from this work can be used to understand and predict diffusioosmosis in natural settings such as metamorphic transformation, in addition to that in applications such as colloidal species separation, nanoparticle drug delivery, and enhanced oil recovery.
We have developed a mathematical model that predicts that hydrodynamic slip can eliminate the diffusioosmotic flow reversal due to electrostatic correlations.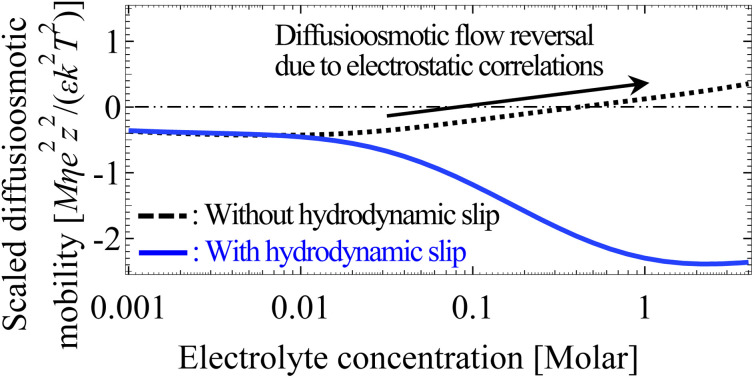
1. Introduction
Diffusioosmosis is the deterministic fluid motion generated over a charged surface in the presence of a solute concentration gradient.1–3 Diffusioosmosis of ionic solutes comprises a chemiosmotic and an electroosmotic component, where the former is due to an osmotic pressure gradient and the latter is due to an electric field, both induced by the solute concentration gradient. Recently, there has been an intense interest in understanding and predicting diffusioosmosis, given its relevance in natural settings such as metamorphic transformation,4–6 and in applications, including colloidal species separation,7–24 nanoparticle drug delivery,25,26 and enhanced oil recovery.27–31 The diffusioosmosis velocity follows u = M∇ log n, where n is the solute concentration and M is the diffusioosmotic mobility. A positive (negative) M corresponds to diffusioosmosis flowing up (down) the solute concentration gradient. The mobility is the key to characterizing diffusioosmosis, encompassing physical properties of the surface and the solute. The objective of this article is to develop a predictive model for diffusioosmosis that accounts for surface hydrodynamic slip and ion–ion electrostatic correlations, thereby uncovering and understanding their coupled effects on diffusioosmosis.
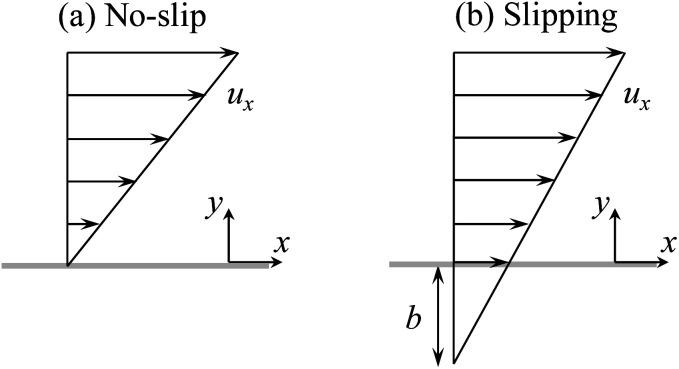
Current diffusioosmosis theories investigate the effect of hydrodynamic slip in the absence of ion–ion electrostatic correlations.31–35 Hydrodynamic slip occurs over a low surface energy material such as organosilane or fluorine. Physically, the lower the surface energy, the stronger the repulsion between the fluid and the surface and the weaker the fluid can wet a surface. Thus, a fluid dissipates less energy due to the lower friction over a low surface energy, hydrodynamically slipping surface. Hydrodynamic slip is characterized by the slip length, defined as the distance into a surface where the flow velocity profile would extrapolate to zero (Fig. 1).36–41 The slip length can be extracted from various experimental measurements, including the fluid flow rate using molecular dye tracers and confocal microscopy, the fluid velocity profile by micro-particle image velocimetry, and the shear stress by atomic force microscopy.40,41 Ajdari and Bocquet32 pioneered the study of diffusioosmosis in the presence of hydrodynamic slip. Ignoring the convective ionic flux, they predicted that diffusioosmosis over a hydrophobic surface with a slip length b can be enhanced by a factor of (1 + 2bκ) relative to that over a non-slipping surface, where κ−1 is the Debye length. For a smooth hydrophobic surface where b ∼ O(1)–O(102) nm 42–47 and a 1 M monovalent electrolyte solution where κ−1 ∼ O(0.1) nm,48 their results indicated that the enhancement can be as large as a thousand times. Hoshyargar et al.34 extended the prior model32 by incorporating the convective ionic flux. They showed that the convective ionic flux in fact controls the electric field induced by the solute concentration gradient and thus sets an upper bound for the enhancement of diffusioosmosis by the hydrodynamic slip. However, hydrodynamic slip still plays a significant role in diffusioosmosis in that it can enhance diffusioosmosis by up to an order of magnitude relative to that over a non-slipping surface.
Fig. 1. (a) A fluid flow over a stationary, no-slip surface and (b) a fluid flow over a stationary, hydrodynamically slipping surface. The length of the arrows is proportional to the velocity of the fluid flow, ux. For a no-slip surface, the fluid velocity at the surface is zero with a zero slip length b. For a slipping surface, the fluid velocity at the surface is non-zero with a non-zero slip length b.
Our recent study examined the effect of ion–ion electrostatic correlations on diffusioosmosis in the absence of hydrodynamic slip.49 Ion–ion electrostatic correlations refer to the Coulombic interactions between an ion pair, which are important in concentrated monovalent electrolytes or dilute and concentrated multivalent electrolytes.50,51 Electrostatic correlations cause overscreening of the surface charges. Overscreening means that the charge of the surface is overcompensated by a first layer of counterions, and the first layer of counterions is overcompensated by a second layer of coions, and so on. Overscreening manifests in sign oscillations in the space charge density normal to a charged surface. Overscreening can be modeled by molecular dynamics simulations, integral approaches, and statistical theories.52–61 For overscreening over a metal surface, the recently developed density–potential–polarization functional theory can further account for the coupling between the metal electronic effects and ions-layering effects in electrolytes.62 Although these approaches can model overscreening very accurately by capturing individual oscillation peaks in the space charge density,63 their high computational cost has largely restricted them to modeling static systems. Without capturing individual oscillation peaks, Storey and Bazant51 developed a continuum-level, modified Poisson equation that can model overscreening effectively. The modified Poisson equation can be coupled with other continuum-level transport equations, such as the Nernst–Planck and Stokes equation, to efficiently model dynamical transport processes.49,51,64–66 Employing the modified Poisson equation, our recent study showed that overscreening causes a unique reversal in the direction of diffusioosmosis,49 which cannot be captured by prior models that ignore electrostatic correlations. The diffusioosmosis reversal occurs at O(0.1) M in a monovalent electrolyte and at an even lower concentration O(10−3)–O(10−2) M in a divalent electrolyte, thus highlighting its practical significance. However, there is currently a lack of a predictive model for diffusioosmosis that considers the coupling of electrostatic correlations and hydrodynamic slip.
In this work, we develop a mathematical model to predict the diffusioosmotic mobility in a charged parallel-plate channel under the influence of ion–ion electrostatic correlations and hydrodynamic slip. We employ the modified Poisson equation51 to model electrostatic correlations and the Navier slip condition to model the hydrodynamic slip.36–41 We report two key findings which highlight the radical impacts of the coupling of hydrodynamic slip and electrostatic correlations on diffusioosmosis. The effects of hydrodynamic slip and electrostatic correlations are competitive in nature. First, we show that, relative to diffusioosmosis over a no-slip surface, a minute hydrodynamic slip can postpone the occurrence of the diffusioosmosis reversal caused by electrostatic correlations in a divalent electrolyte from O(10−2) M to a much higher concentration at O(10−1) M. Such a small hydrodynamic slip can even eliminate the diffusioosmosis reversal in a monovalent electrolyte, where the effect of hydrodynamic slip outweighs electrostatic correlations. Second, we show that electrostatic correlations can reduce the change in the mobility due to hydrodynamic slip by ≈60% in a monovalent electrolyte, and can even reduce the change by an order of magnitude in a divalent electrolyte. We identified that electrostatic correlations strengthen the attraction between the oppositely charged ions near the charged surface. The hindered ionic transport by electrostatic correlations competes with the enhanced ionic transport by hydrodynamic slip, resulting in a weakened modification of diffusioosmosis by slip. These two key findings demonstrate that the coupling of hydrodynamic slip and electrostatic correlations not only impacts diffusioosmosis by changing its magnitude significantly, but also qualitatively reverses its direction.
The rest of this article is structured as follows. In Section 2, we present the problem formulation for computing the electric potential, induced electric field, diffusioosmotic velocity, and diffusioosmotic mobility. In Section 3, we present our results and elaborate on the two above-mentioned key findings. In Section 4, we summarize this study and offer ideas for future work.
2. Problem formulation
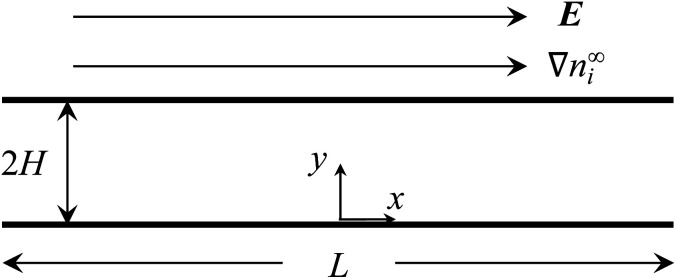
Consider a channel that consists of two parallel plates with a constant surface charge density q, slip length b, and length L (Fig. 2). The bottom and top plates are at y = 0 and y = 2H, respectively. A constant concentration gradient of a valence-symmetric electrolyte ∇n∞i is applied across the channel in the positive x-direction, where the value of ∇n∞i (a vector) is defined as ∇xn∞i = dn∞i/dx (a scalar), i = (+) and i = (−) are the cationic and anionic species, respectively, and the bulk number density of ions is n∞+(x) = n∞−(x) = n∞(x). The concentration gradient satisfies L∇xn∞/n∞ ≪ 1 with n∞ = n∞(0).1,34,49,67–73 Diffusioosmosis with a constant velocity u is generated parallel to ∇n∞i. Below we present the formulations for determining the electric potential and the electric field induced by the electrolyte gradient, followed by the calculation of u and the mobility M.
Fig. 2. A constant concentration gradient of a valence-symmetric electrolyte ∇n∞i induces diffusioosmosis in a channel that comprises two parallel, hydrophobic plates with a constant surface charge density and a length L separated by a distance 2H. Diffusioosmosis is parallel to ∇n∞i along the x-direction. The induced electric field E is parallel to ∇n∞i and note that it may be in the same or opposite direction as ∇n∞i depending on the electrolyte and channel surface charge.
2.1. Electric potential
The Bikerman model74,75 governs the electrochemical potential of the ionic species as μ± = kT log n± + z±eϕ − kT log[1 − a3(n+ + n−)], where k is the Boltzmann constant, T is the absolute temperature, z+ and z− are the valence of the cations and anions, respectively, e is the proton charge, ϕ is the electric potential, n+ and n− are the number densities of the cations and anions, respectively, and a is the hydrated ion diameter. The space charge density is ρ = en+z+ + en−z−, with z+ = −z− = z for a valence-symmetric electrolyte. Solving ∇μ± = 0 gives an explicit relation between n± and ϕ.75 The relation is substituted into the modified Poisson equation that governs the electric potential and accounts for ion–ion electrostatic correlations,49–51,60,64–66,76–82
 |
1 |
where ε is the solution permittivity and α = [1 − ν + ν cos h(zeϕ/kT)]−1 includes the bulk volume fraction of ions ν = 2a3n∞. The fourth-order term in the modified Poisson eqn (1) models ion–ion electrostatic correlations, which act over a correlation length lc. As noted in Section 1, electrostatic correlations lead to overscreening, where the charge density oscillates in sign away from the surface. Eqn (1) recovers the classical Poisson equation in the limit of lc → 0, where electrostatic correlations between ions are neglected. That is, the classical Poisson equation has no fourth-order term and thus cannot model electrostatic correlations. The non-dimensionalized eqn (1) reads
 |
2 |
We have non-dimensionalized eqn (2) and equations hereafter using the following schemes, where quantities with carets are non-dimensional: ŷ = y/H,
= ϕ/(kT/e),
= κH, and
= ρ/(n∞ez). The Debye length  is the characteristic lengthscale over which the space charge density varies. The quantity δc = κlc contains the ion–ion electrostatic correlation length lc = z2e2/(4πεkT), which characterizes the significance of electrostatic correlations: correlations are absent at δc = 0 whereas they are prominent at δc ≳ 1.50,51 The boundary conditions for eqn (2) are as follows: the surface charge density is specified d
/dŷ = −q̂ = −qeH/(εkT) and the mean-field charge density is flat d3
/dŷ3 = 0 at ŷ = 0; and the electric potential and its derivative decay to zero smoothly,
= 0 and d
/dŷ = 0, at ŷ = 1.51 The condition
= 0 is guaranteed for
≥ 10 in this work.
2.2. Induced electric field
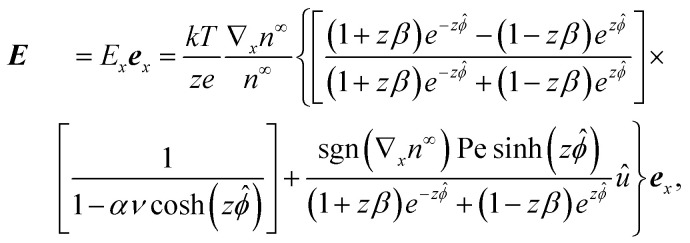
The diffusivities of two different ionic species are not the same. The difference in the ion diffusivities will cause a difference in the cationic j+ and the anionic flux j−, which induces an electric field,1,70,71 also referred to as the diffusion potential or liquid junction potential.83,84 Without a closed circuit as in typical diffusioosmosis, there is no electric current in the system. Thus, imposing the zero current condition, J = z+ej+ + z−ej− = 0, will determine the induced electric field as1,70,71†
 |
3 |
where β = (D+ − D−)/z(D+ + D−) is the ratio of the cation diffusivity D+ and anion diffusivity D−, ex is the unit vector in the positive x-direction, the Peclet number Pe = 4n∞U/[(D+ + D−)|∇xn∞|] characterizes the strength of diffusioosmotic convection relative to ionic diffusion, U = εk2T2|∇xn∞|/(ηe2z2n∞) is a characteristic velocity with η being the dynamic viscosity of the electrolyte, and û = ux/U is the non-dimensionallized x-component of u. An electrolyte concentration gradient pointing in the positive x-direction is represented by sgn(∇xn∞) = |∇xn∞|/∇xn∞ = 1 as in the present work, whereas a gradient pointing in the negative x-direction is represented by sgn(∇xn∞) = −1.
2.3. Diffusioosmotic flow velocity and mobility
For an incompressible microscale flow, the fluid dynamics is governed by the continuity equation ∇·u = 0 and the Stokes equation with an electric body force 0 = η∇2u − ∇p + ρ(E − ∇ϕ). A fully developed flow and the continuity equation suggest that the x- and y-components of u are ux = ux(y) and uy = 0, respectively. The y-component of the Stokes equation reduces to 0 = −∂p/∂y − ρdϕ/dy. By substituting the explicit expression of n±75 into ρ and integrating with the boundary conditions ϕ(y = H) = 0 and p(y = H) = p∞, the pressure field is obtained as p = p∞ − (2kTn∞ log α)/ν, where p∞ is a constant in the absence of an imposed pressure gradient. Substituting the pressure field into the x-component of the Stokes equation 0 = ηd2ux/dy2 − ∂p/∂x + ρEx yields the governing equation for the diffusioosmotic flow
 |
4 |
where Ê = Ex/(kT∇xn∞/zen∞). The boundary conditions for eqn (4) are the Navier slip condition û = b̂dû/dŷ 36–41 at ŷ = 0, where b̂ = b/H, and flow symmetry dû/dŷ = 0 at ŷ = 1. The diffusioosmotic mobility is equivalent to the mean velocity,49
 |
5 |
where M̂ = Mηe2z2/(εk2T2) and um = M|∇x log n∞|. We use the finite difference method and Newton's method as in our prior work49 to solve the above equations in Wolfram Mathematica. Converged solutions are obtained with mesh size Δŷ = 10−5.
3. Results and discussion
In this section, we compute and discuss the mobilities M̂ of valence-symmetric electrolytes. Model inputs are taken from typical experiments: a = 0.3 nm,75b ∈ [0, 100] nm,42–47H = 100 nm, T = 298 K, Pe = 1,9,68β ∈ [−0.6, 0.64] and β ∈ [−0.14, −0.10] for common monovalent and divalent electrolytes, respectively,49,87 and q ∈ [−0.014, 0.014] C m−2.48,88–92 The bulk molar concentration of the electrolyte C is related to the bulk number density of ions via n∞ = 103AC, where A is the Avogadro constant. The solution viscosity, diffusivity, and permittivity in general depend on the electrolyte concentration. We assume that they are constant, since their concentration-dependence are prominent only in a solution with an electrolyte concentration higher than a few molars.49,51,60,65,76–79,93–95 In Section 3.1, we present the mobilities for a monovalent electrolyte with β = −0.5 as a function of the electrolyte concentration and slip length, followed by those for divalent electrolytes with β = −0.10 in Section 3.2. In Section 3.3, we present diagrams which show the direction of diffusioosmosis as a function of the electrolyte concentration, valence, diffusivity, channel surface charge, and slip length. In Section 3.4, we propose experiments to observe and verify the model predictions from this work.
We have validated the present model by recovering the results from prior work. First, in the absence of ion–ion electrostatic correlations (δc = 0) and hydrodynamic slip (b̂ = 0), the present model recovers the results from Ma and Keh.68 Details of this validation were presented in our prior work.49 Second, in the absence of ion–ion electrostatic correlations (δc = 0) but in the presence of hydrodynamic slip (b̂ ≠ 0), the present model recovers the results from Hoshyargar et al.34 Third, in the presence of ion–ion electrostatic correlations (δc ≠ 0) but in the absence of hydrodynamic slip (b̂ = 0), the present model can recover the results from Zhang and Chu.49 Some of these validations are presented in Section 3.1 to 3.3 to contrast with the new results of this work that concern diffusioosmosis in the presence of ion–ion electrostatic correlations (δc ≠ 0) and hydrodynamic slip (b̂ ≠ 0).
3.1. Diffusioosmosis of a monovalent electrolyte
3.1.1. Variation of diffusioosmotic mobilities with bulk electrolyte concentrations
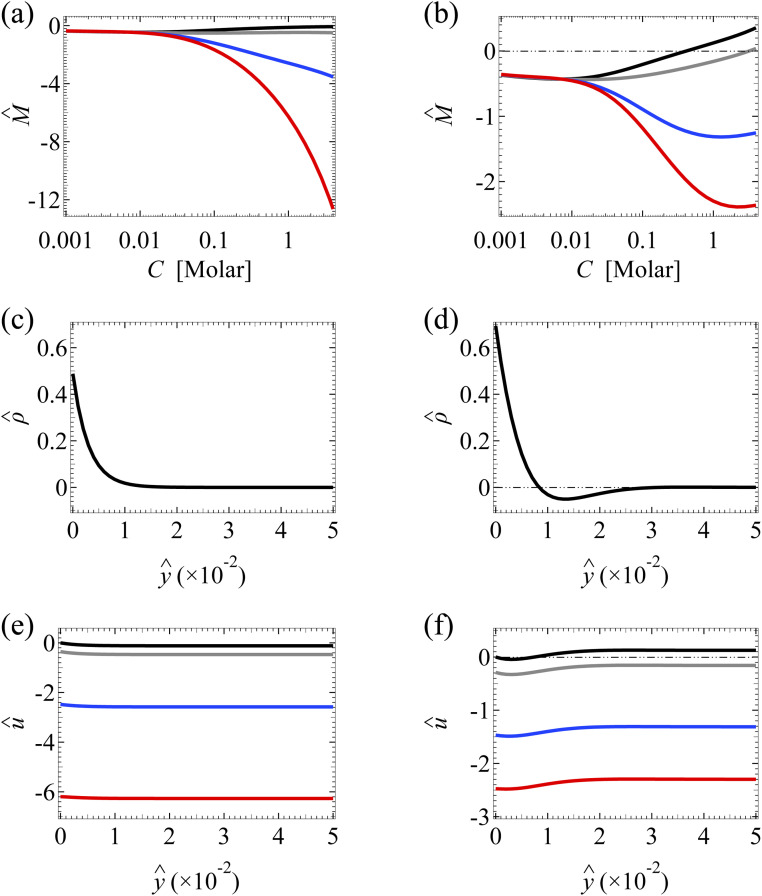
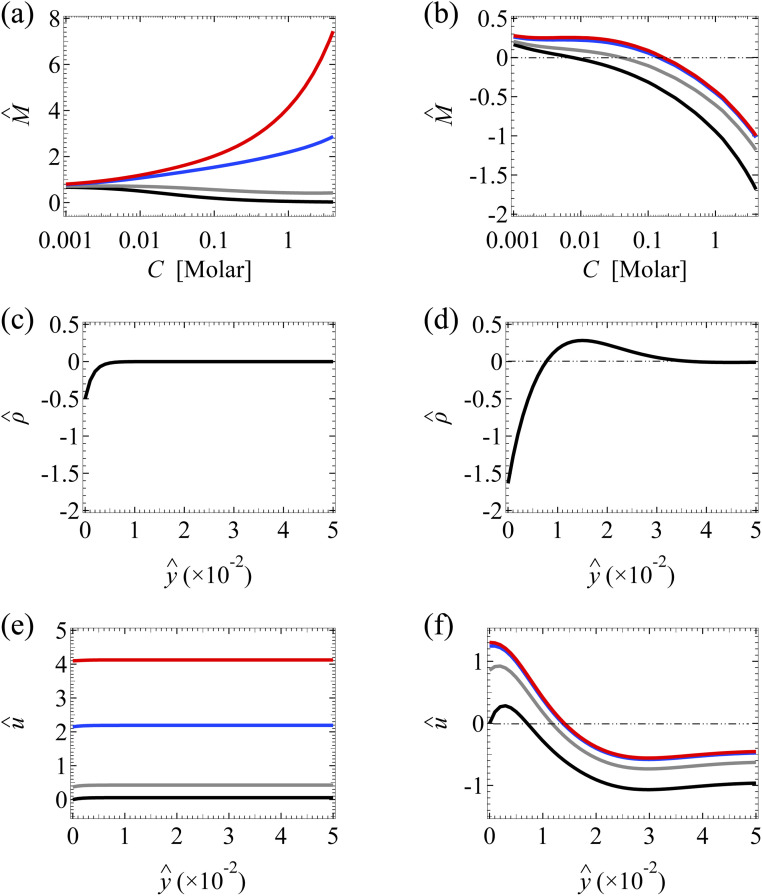
We begin by discussing the separate impacts of hydrodynamic slip and ion–ion electrostatic correlations on diffusioosmosis of a monovalent electrolyte. Fig. 3(a) shows the variation of the mobility M̂ with the bulk electrolyte concentration C in the absence of electrostatic correlations (δc = 0). The first observation is that the amplification of the mobility by hydrodynamic slip (non-zero b̂) is more prominent in a concentrated electrolyte (C = 1 M) than in a dilute electrolyte (C = 10−3 M).32,34 Physically, in a concentrated electrolyte the excess counterions which are responsible for generating diffusioosmosis are confined to a thinner Debye layer near the slipping channel wall at ŷ = 0. Thus, in a concentrated electrolyte more excess counterions experience less wall drag and hence the more prominent enhancement of diffusioosmosis by hydrodynamic slip.
Fig. 3. Diffusioosmosis of a monovalent electrolyte with ion diffusivity ratio β = −0.5. The channel surface charge density q = −0.014 C m−2 corresponds to a channel surface potential ζ = −100 mV at a bulk electrolyte molar concentration C = 10−3 M. Panels (a), (c), and (e) ignore ion–ion electrostatic correlations (δc = 0). Panels (b), (d), and (f) account for electrostatic correlations (δc = κlc). (a) and (b): The diffusioosmotic mobility M̂ versus C. (c) and (d): The space charge density versus the distance from the bottom channel wall ŷ at C = 1 M. (e) and (f): The diffusioosmotic velocity û versus ŷ at C = 1 M. For (a), (b), (e) and (f), the black line denotes a slip length b̂ = 0, the grey line denotes b̂ = 10−2, the blue line denotes b̂ = 10−1, and the red line denotes b̂ = 1. For (c) and (d), is independent of b̂.
Fig. 3(b) shows the variation of M̂ in the presence of electrostatic correlations (δc ≠ 0). The second observation is that, in the absence of hydrodynamic slip (b̂ = 0; the black line), electrostatic correlations cause a reversal in the direction of diffusioosmosis, manifested in a sign change in the mobility at C ≈ 0.4 M.49 Physically, electrostatic correlations are prominent in a concentrated electrolyte at C = 1 M. Electrostatic correlations overscreen the channel surface charge and cause a sign change in the space charge density away from the channel wall, as shown at ŷ ≈ 8 × 10⁻³ in Fig. 3(d). This in turn causes a reversal in the direction of the diffusioosmotic flow û away from the channel wall, as shown at ŷ ≈ 8 × 10⁻³ in Fig. 3(f). Thus, averaging û in Fig. 3(f) across the channel yields the positive mobility at C = 1 M in Fig. 3(b), which is in contrast to the negative mobility at C = 10−3 M. This sign change in the mobility across low to high electrolyte concentrations illustrates the diffusioosmosis reversal caused by electrostatic correlations. Note that overscreening and diffusioosmosis reversal are absent when electrostatic correlations are ignored [Fig. 3(a), (c) and (e)].
Next, let us examine a key result arising from the coupled effects of hydrodynamic slip and electrostatic correlations on diffusioosmosis. Fig. 3(b) shows that a minute hydrodynamic slip can eliminate the diffusioosmotic flow reversal caused by electrostatic correlations. For instance, the mobility is negative at all C for b̂ ≥ 10−2. This can be understood by analyzing Fig. 3(f), which shows the diffusioosmosis velocity û at C = 1 M. Specifically, the negative û at the channel wall is significantly enhanced by hydrodynamic slip. Fluid momentum is transferred from the wall to the bulk via viscous drag. In the presence of slip, in the bulk the enhanced negative momentum by slip outweighs the positive momentum by electrostatic correlations, leading to a negative û across the channel at all ŷ. Averaging û across the channel yields the negative mobility in Fig. 3(b) for b̂ ≥ 10−2 at C = 1 M. Thus, the same sign of the mobility across low to high electrolyte concentrations signifies that a minute hydrodynamic slip can eliminate the diffusioosmosis reversal caused by electrostatic correlations. This demonstrates the competitive nature between the effects of hydrodynamic slip and electrostatic correlations on diffusioosmosis. We remark that, given that b̂ = b/H with H = 100 nm, b̂ = 0.01 corresponds to a slip length b = 1 nm, which is typical for common natural and synthetic materials.42–47 This implies that the correlation-induced diffusioosmosis reversal in a monovalent electrolyte occurs only over rough surfaces with b < 1 nm.
3.1.2. Variation of diffusioosmotic mobilities with hydrodynamic slip lengths
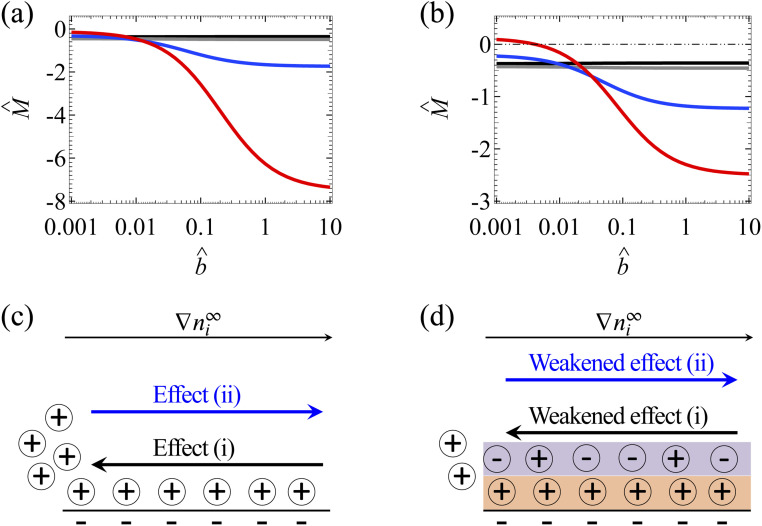
Fig. 4(a) shows the variation of the mobility M̂ with the slip length b̂ in the absence of ion–ion electrostatic correlations (δc = 0). The first observation here is that the amplification of M̂ by hydrodynamic slip is bounded, as shown by the plateau in the limit of large b̂ of each line.34 We show b̂ = 10 to illustrate the plateaus and note that typical materials have b̂ ≤ O(1).42–47 To understand the plateau, recall that the channel surface is negatively charged. As shown in Fig. 3(e), the negative û at the channel wall (ŷ = 0) indicates that hydrodynamic slip enhances diffusioosmosis to transport the excess positive counterions from a region of high to low electrolyte concentration. This causes an accumulation of positive ions and a higher electric potential on the low-concentration side of the electrolyte gradient. This induces an electric field that counters the accumulation of positive ions and transport them back to the high-concentration side of the electrolyte gradient via an electroosmotic flow [Fig. 4(c)]. In other words, there are two effects, namely, (i) a slip-enhanced diffusioosmosis and (ii) a counteracting electroosmosis induced by the slip-enhanced diffusioosmosis. Diffusioosmosis reaches a steady state when the two effects balance each other, which is the case anywhere along the lines in Fig. 4(a). In particular, when effect (i) saturates and hydrodynamic slip can no longer further enhance the flow, the mobility attains a plateau.
Fig. 4. Diffusioosmosis of a monovalent electrolyte with ion diffusivity ratio β = −0.5. The channel surface charge density q = −0.014 C m−2 corresponds to a channel surface potential ζ = −100 mV at a bulk electrolyte molar concentration C = 10−3 M. Panels (a) and (c) ignore ion–ion electrostatic correlations (δc = 0). Panels (b) and (d) account for electrostatic correlations (δc = κlc). (a) and (b): The diffusioosmotic mobility M̂ versus the slip length b̂. The black line denotes C = 10−3 M, the grey line denotes C = 10−2 M, the blue line denotes C = 10−1 M, and the red line denotes C = 1 M. (c) and (d): Diffusioosmosis reaches a steady state when two effects balance each other, namely, (i) a slip-enhanced transport of the excess (positive) counterions and diffusioosmosis and (ii) a counteracting electroosmosis induced by the slip-enhanced diffusioosmosis. (d) Differs from (c) in that electrostatic correlations weaken both effects (i) and (ii) and hence reduce the change in the mobility by hydrodynamic slip.
Next, let us examine a key result arising from the coupled effects of hydrodynamic slip and electrostatic correlations on diffusioosmosis. Comparing with Fig. 4(a) and (b) shows that electrostatic correlations can significantly reduce the change in the mobility due to hydrodynamic slip by ≈60%. For example, at C = 1 M, Fig. 4(a) shows that the mobilities at b̂ = 10−3 and b̂ = 1 are −0.15 and −6.27 respectively, yielding a difference of −6.12 in the absence of electrostatic correlations. In contrast, in the presence of electrostatic correlations, Fig. 4(b) shows that the mobilities at b̂ = 10−3 and b̂ = 1 are 0.09 and −2.30 respectively, yielding a difference of −2.39. To understand the reduced hydrodynamic slip-induced change in the mobility by electrostatic correlations, recall that electrostatic correlations and overscreening lead to the first layer of positive counterions adjacent to the charged surface being overcompensated by a second layer of negative coions, as shown in Fig. 4(d). Due to Coulombic attractions, the second layer of coions attracts the first layer of counterions and therefore weakens the slip-enhanced diffusioosmosis [the effect (i) in the previous paragraph]. The counteracting electroosmosis induced by the slip-enhanced diffusioosmosis [the effect (ii)] is also weakened. Thus, electrostatic correlations weaken the overall diffusioosmosis and significantly reduce the change in the mobility by hydrodynamic slip. This again demonstrates the competitive nature between the effects of hydrodynamic slip and electrostatic correlations on diffusioosmosis.
In Appendix A, we present the same analyses as in Section 3.1 for a monovalent electrolyte with β = 0.5. All the observations in Section 3.1 for β = −0.5 persist when β = 0.5, demonstrating the generality of the observations and the underlying physics.
3.2. Diffusioosmosis of a divalent electrolyte
3.2.1. Variation of diffusioosmotic mobilities with bulk electrolyte concentrations
We follow the structure of Section 3.1.1 to analyze the diffusioosmosis of a divalent electrolyte. Fig. 5(a), (c), and (e) show the variation of the mobility M̂, the space charge density , and the diffusioosmosis velocity û, respectively, in the absence of ion–ion electrostatic correlations (δc = 0). Fig. 5(b), (d), and (f) show the variation of the three quantities in the presence of electrostatic correlations (δc ≠ 0). The first and the second observations made in Section 3.1.1 persist here for a divalent electrolyte. First, Fig. 5(a) shows that, in the absence of electrostatic correlations, the amplification of the mobility by hydrodynamic slip is more prominent in a concentrated electrolyte than in a dilute electrolyte. Second, Fig. 5(b) shows that, in the absence of hydrodynamic slip (b̂ = 0), electrostatic correlations cause a diffusioosmosis reversal that is manifested in a sign change in the mobility as the electrolyte concentration increases. Note that the diffusioosmosis reversal in a divalent electrolyte occurs at a much lower electrolyte concentration at C ≈ 7 × 10⁻³ M [Fig. 5(b)] compared to that in a monovalent electrolyte at C ≈ 0.4 M [Fig. 3(b)]. This is because the strength of electrostatic correlations, quantified by δc = κlc, is stronger in a divalent electrolyte than in a monovalent electrolyte of the same concentration. A detailed explanation was given in our prior work.49
Fig. 5. Diffusioosmosis of a divalent electrolyte with ion diffusivity ratio β = −0.1. The channel surface charge density q = 0.014 C m−2 corresponds to a channel surface potential ζ = 50 mV at a bulk electrolyte molar concentration C = 10−3 M. Panels (a), (c), and (e) ignore ion–ion electrostatic correlations (δc = 0). Panels (b), (d), and (f) account for electrostatic correlations (δc = κlc). Other figure captions are the same as those in Fig. 3.
However, the key result arising from the coupling of hydrodynamic slip and electrostatic correlations in Section 3.1.1 does not persist for a divalent electrolyte. Specifically, Fig. 3(b) shows that a minute hydrodynamic slip (b̂ ≥ 10−2) can eliminate the diffusioosmosis reversal of a monovalent electrolyte caused by electrostatic correlations. In contrast, Fig. 5(b) shows that even a large hydrodynamic slip (b̂ = 1) cannot cancel the diffusioosmosis reversal of a divalent electrolyte but can only defer its occurrence to a higher concentration. This can be understood by analyzing Fig. 5(f), which shows the diffusioosmosis velocity û at C = 1 M. The positive û at the channel wall is enhanced by hydrodynamic slip. However, electrostatic correlations cause a sign reversal in the space charge density [Fig. 5(d)], which is sufficiently strong to cause a sign reversal in û and thus a negative û at ŷ ≳ 2 × 10⁻³ for all b̂, as shown in Fig. 5(f). Averaging û across the channel yields the negative M̂ at C = 1 M for all b̂ in Fig. 5(b). Thus, switching from a positive to a negative M̂ across low to high electrolyte concentrations signifies that even a large hydrodynamic slip cannot cancel the diffusioosmosis reversal of a divalent electrolyte, but can only postpone its occurrence to a higher concentration. This implies that the correlation-induced diffusioosmosis reversal in a divalent electrolyte is likely present in most common natural and synthetic materials where b̂ ≤ O(1). Note that, despite the different responses shown here for a divalent electrolyte compared to a monovalent electrolyte in Section 3.1.1, their origin is common and is the competition between hydrodynamic slip and electrostatic correlations in diffusioosmosis.
3.2.2. Variation of diffusioosmotic mobilities with hydrodynamic slip lengths
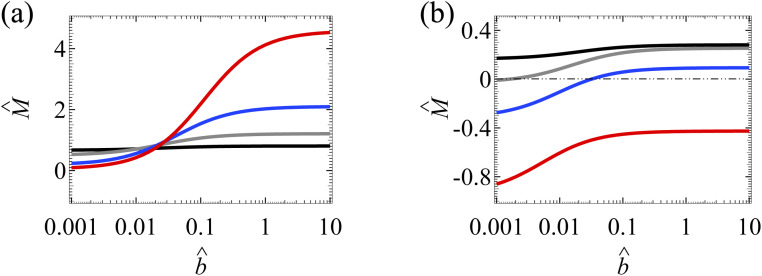
We follow the structure of Section 3.1.2 to analyze the diffusioosmosis of a divalent electrolyte. Fig. 6(a) shows the variation of the mobility M̂ with the slip length b̂ in the absence of ion–ion electrostatic correlations (δc = 0). The first observation made in Section 3.1.2 persists here for a divalent electrolyte, that is, the amplification of M̂ by hydrodynamic slip is bounded, as shown by the plateau in the limit of large b̂ for each line in Fig. 6(a). The mobility reaches a plateau when two effects, namely, (i) slip-enhanced diffusioosmosis and (ii) a counteracting electroosmosis induced by the slip-enhanced diffusioosmosis, balance each other.
Fig. 6. Diffusioosmosis of a divalent electrolyte with ion diffusivity ratio β = −0.1. The channel surface charge density q = 0.014 C m−2 corresponds to a channel surface potential ζ = 50 mV at a bulk electrolyte molar concentration C = 10−3 M. Panels (a) ignores ion–ion electrostatic correlations (δc = 0). Panels (b) accounts for electrostatic correlations (δc = κlc). Other figure captions are the same as those in Fig. 4(a) and (b).
Next, we show that the coupled effect of hydrodynamic slip and electrostatic correlations presented in Section 3.1.2 is radically intensified here in a divalent electrolyte. For example, at C = 1 M, Fig. 6(a) shows that the mobilities at b̂ = 10−3 and b̂ = 1 are 0.10 and 4.13 respectively, yielding a difference of 4.03 in the absence of electrostatic correlations. In the presence of electrostatic correlations, Fig. 6(b) shows that the mobilities at b̂ = 10−3 and b̂ = 1 are −0.85 and −0.42 respectively, yielding a difference of 0.43. That is, in a divalent electrolyte, electrostatic correlations can reduce the change in the mobility due to slip by an order of magnitude. This is in contrast to the weaker ≈60% reduction in a monovalent electrolyte in Section 3.1.2. The stronger reduction in a divalent electrolyte is due to the stronger electrostatic correlations, represented by a larger δc = κlc.50,51 For instance, at C = 1 M, δc = 18.8 in a divalent electrolyte whereas δc = 2.4 in a monovalent electrolyte. Stronger electrostatic correlations give rise to stronger attractions between the second layer of coions and the first layer of counterions adjacent to the overscreened charged surface. This causes a stronger hindrance to the first layer of counterions and a stronger reduction in the slip-enhanced diffusioosmosis. Thus, electrostatic correlations can reduce the change in the mobility due to hydrodynamic slip more significantly in a divalent electrolyte compared to a monovalent electrolyte. This again confirms the competition between the effects of hydrodynamic slip and electrostatic correlations on diffusioosmosis.
3.3. Diffusioosmotic flow direction diagrams
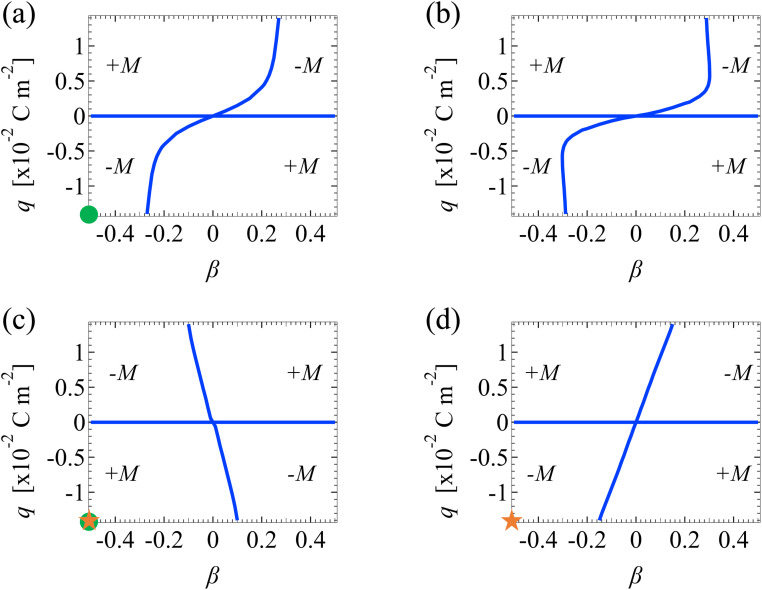
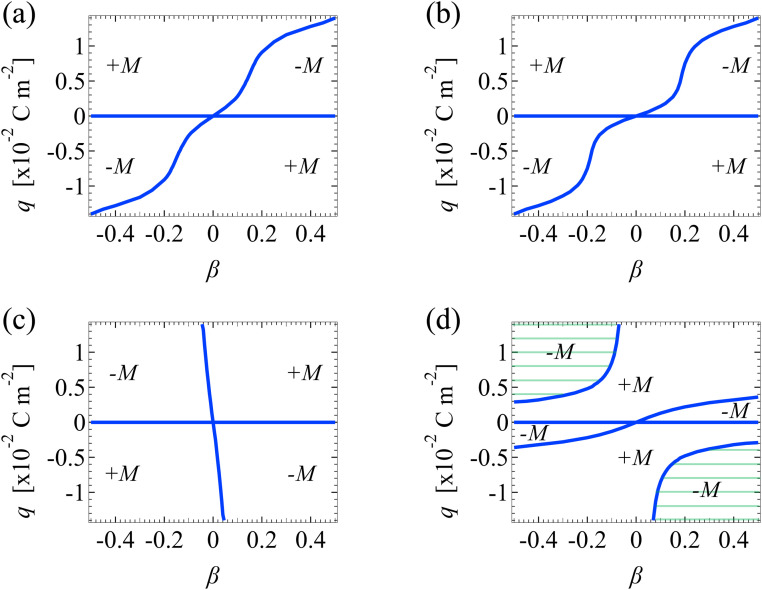
We discuss Fig. 7 and 8 which show how the direction of diffusioosmosis changes, represented by a sign change in the mobility M̂, with respect to the electrolyte concentration C, ion diffusivity ratio β, ion valence z, channel surface charge density q, and slip length b̂. Electrostatic correlations are accounted for by incorporating a non-zero δc = κlc. Fig. 7 is for monovalent electrolytes and Fig. 8 is for divalent electrolytes. In each figure, the blue lines are obtained by determining the values of β that generate a zero M̂ at each q by setting a tolerance of |M| ≤ 10−4. Thus, the blue lines separate each figure into different domains, with each of them corresponding to diffusioosmosis flowing from a region of low to high electrolyte concentration (+M̂) or vice versa (−M̂).
Fig. 7. Diffusioosmotic flow direction of monovalent electrolytes versus the channel surface charge density q and ion diffusivity ratio β. Ion–ion electrostatic correlations are accounted for (δc = κlc). (a): Bulk electrolyte molar concentration C = 10−3 M and slip length b̂ = 0. (b): C = 10−3 M and b̂ = 1. (c): C = 1 M and b̂ = 0. (d): C = 1 M and b̂ = 1. Domains with a positive (negative) mobility M denote that diffusioosmosis is from a region of low (high) to high (low) electrolyte concentration. Circle symbols in (a) and (c) correspond to the mobility at C = 10−3 M and C = 1 M along the line b̂ = 0 in Fig. 3(b). Star symbols in (c) and (d) correspond to the mobility with b̂ = 0 and b̂ = 1 at C = 1 M in Fig. 3(b).
Fig. 8. Diffusioosmotic flow direction of divalent electrolytes versus the channel surface charge density q and ion diffusivity ratio β. Ion–ion electrostatic correlations are accounted for (δc = κlc). Other figure captions are the same as those in Fig. 7. The shaded regions in (d) are absent in Fig. 7(d), owing to the stronger electrostatic correlations in a divalent electrolyte than a monovalent electrolyte.
Let us first examine Fig. 7(a) and (b), which show diffusioosmosis of a dilute electrolyte at C = 10−3 M in a non-slipping channel (b̂ = 0) and a slipping channel (b̂ = 1), respectively. Electrostatic correlations are negligible in both panels, where δc = 0.07 ≪ 1.50,51 Thus, comparing the two panels demonstrates the effect of hydrodynamic slip. On comparison, panel (b) shows that, in the absence of electrostatic correlations, hydrodynamic slip has a minor quantitative effect on shifting the values of q and β at which a sign change in the mobility occurs.
Next, let us examine Fig. 7(c), which shows diffusioosmosis of a concentrated electrolyte at C = 1 M in a non-slipping channel (b̂ = 0). Electrostatic correlations are significant in Fig. 7(c), where δc = 2.4 > 1.50,51 Comparing Fig. 7(c) and (a), in the absence of hydrodynamic slip, electrostatic correlations can cause a reversal in the direction of diffusioosmosis, manifested in a sign change in the mobility as the electrolyte concentration increases [from panel (a) to (c)] while q and β are fixed. This echoes the second observation in Section 3.1.1. For example, the two circle symbols in Fig. 7(a) and (c) correspond to the mobility at C = 10−3 M and C = 1 M along the line b̂ = 0 in Fig. 3(b).
Next, let us examine Fig. 7(d), which shows diffusioosmosis of a concentrated electrolyte at C = 1 M in a slipping channel (b̂ = 1). In a concentrated electrolyte, one may expect that the distribution of the +M and −M regions in Fig. 7(d) would be the same as that in Fig. 7(c). However, the distribution in Fig. 7(d) is qualitatively different from that in Fig. 7(c) and is in fact reversed. This difference is due to the strong hydrodynamic slip in Fig. 7(d), which cancels the diffusioosmosis reversal caused by electrostatic correlations. This echoes the coupled and competitive effect of hydrodynamic slip and electrostatic correlations on diffusioosmosis, as discussed in Section 3.1.1. For example, the two star symbols in Fig. 7(c) and (d) correspond to the mobility with b̂ = 0 and b̂ = 1 at C = 1 M in Fig. 3(b).
The above discussions regarding Fig. 7(a)–(d) for monovalent electrolytes also apply to Fig. 8(a)–(d) for divalent electrolytes. For brevity, we do not repeat them. Instead, we elaborate on a qualitative difference between Fig. 8(d) and 7(d). Fig. 8(d) shows the mobilities for divalent electrolytes in the presence of electrostatic correlations and hydrodynamic slip. Fig. 8(d) displays two shaded domains which are absent in Fig. 7(d). In these domains, the mobility is negative when |q| ≳ 3 × 10⁻³ C m−2. Physically, these domains arise, since electrostatic correlations are strong over highly charged surfaces and are more prominent in a divalent electrolyte than in a monovalent electrolyte. As a result, when |q| ≳ 3 × 10⁻³ C m−2, the sign of the mobility follows that in a system with strong electrostatic correlations [Fig. 8(c)], that is, a negative mobility. In contrast, when |q| ≲ 3 × 10⁻³ C m−2, electrostatic correlations are weak and thus the sign of the mobility follows that in a system with negligible electrostatic correlations and strong hydrodynamic slip [Fig. 8(b)]. For instance, the mobility is positive for a negative β and positive q. This again demonstrates the competition between electrostatic correlations and hydrodynamic slip in diffusioosmosis.
3.4. Proposed experimental validations
Before concluding, we propose experiments to observe the model predictions from this work. Currently, experimental data for the diffusioosmotic mobility is limited to dilute electrolytes in a no-slip channel.96 Experimental data is not available to compare with our model predictions that concern concentrated electrolytes in a hydrophobic channel. Referring to the pioneering experiment by Lee et al.,96 here we outline the experimental procedure to measure the diffusioosmotic mobility that can be compared with our model predictions.
The experimental setup comprises a H-shape, micro- and nanochannel network, with the nanochannel connected to two side microchannels. The width W and length L of the nanochannel are at least two orders of magnitude larger than its height 2H, so that the species and fluid transport inside the nanochannel can be accurately approximated as one-dimensional. A high concentration electrolyte solution with fluorescent molecular dye tracers of concentration C0Dye is flowed through the left microchannel. A low concentration electrolyte solution without dye tracers is flowed through the right microchannel. Thus, an electrolyte concentration gradient is set up across the nanochannel. The electrolyte concentration gradient drives a diffusioosmotic flow with the tracers through the nanochannel. The pressure across the nanochannel is balanced using high precision pressure pumps, so that the fluid flow inside the nanochannel is chiefly due to diffusioosmosis and the flow due to a pressure gradient is negligible. The fluorescence intensity signal is recorded using confocal microscopy. The fluorescence intensity is proportional to the dye tracer concentration CDye(x).
At steady state, the transport of the dye is governed by the steady convection diffusion equation, Dd2CDye/dx2 − umdCDye/dx = 0, where D is the dye diffusivity and um is the mean diffusioosmotic flow velocity. Solving the equation with the boundary conditions CDye = C0Dye at x = 0 (left end of the nanochannel) and CDye = 0 at x = L (right end of the nanochannel) gives CDye = C1(D/um)exp(umx/D) + C2, with C1 = −C0Dyeum/[D exp(umL/D) − D] and C2 = (um/D)exp(umL/D)/[D exp(umL/D) − D]. The tracer diffusivity D is known from the Nernst–Einstein relation.97 The unknown um can be determined by using it as a fitting parameter to best-fit the profile of CDye from experiments. Once um is determined, we recall that the volumetric flow rate Q = umW(2H) with um = M∇x|log n∞| and n∞ = 103AC, where A is the Avogadro constant.‡ The flow rate can be integrated from x = 0 to x = L to obtain Q = 2M(WH/L)log[C(L)/C(0)]. Since Q, W, H, L, C(L), and C(0) are known, the only unknown mobility M can be determined and compared with model predictions.
4. Conclusions
In this work, we have developed a predictive model for diffusioosmosis of a valence-symmetric electrolyte in a charged parallel-plate channel. Prior models examine either the effects of hydrodynamic slip31–35 or ion–ion electrostatic correlations49 in diffusioosmosis. The present model is novel in that it accounts for the coupled effects of slip and electrostatic correlations. We have computed the diffusioosmotic mobility of monovalent electrolytes and divalent electrolytes, revealing the competitive nature of the effects of hydrodynamic slip and electrostatic correlations in diffusioosmosis. We summarize the two key findings below.
Our first key finding arising from the coupling of hydrodynamic slip and electrostatic correlations is that hydrodynamic slip can eliminate the reversal in the direction of diffusioosmosis caused by electrostatic correlations in a monovalent electrolyte. Specifically, in the absence of slip, a prior study49 found that electrostatic correlations cause overscreening of the channel surface charges, reverse the direction of fluid momentum away from the channel surface, and lead to a reversal in the net diffusioosmosis averaged across the channel. In this work, we have shown that, in a monovalent electrolyte, hydrodynamic slip enhances the fluid momentum and outweighs that in the opposite direction caused by electrostatic correlations. As a result, in a slipping channel, the direction of diffusioosmosis, represented by the sign of the mobility, remains unchanged across low to high electrolyte concentrations. This signifies that a minute slip length as small as O(1) nm can eliminate the diffusioosmosis reversal caused by electrostatic correlations. However, such an elimination is absent in a divalent electrolyte. Specifically, electrostatic correlations in a divalent electrolyte are stronger than those in a monovalent electrolyte of the same concentration. Thus, the slip-enhanced fluid momentum is insufficient to outweigh that in the opposite direction caused by electrostatic correlations. As a result, the direction of diffusioosmosis and the sign of the mobility change across low to high electrolyte concentrations. Even a large slip length of O(102) nm cannot cancel the diffusioosmosis reversal but can only postpone its occurrence to a higher concentration.
Our second key finding arising from the coupling of hydrodynamic slip and electrostatic correlations is that electrostatic correlations can radically diminish the slip-induced change in the mobility by an order of magnitude in a divalent electrolyte, compared to the same system that ignores electrostatic correlations. Specifically, the mobility is set by a balance of two effects, namely, (i) a slip-enhanced ionic transport and diffusioosmosis and (ii) a counteracting electroosmosis induced by the slip-enhanced diffusioosmosis. We have shown that electrostatic correlations cause strong Coulombic attractions between the oppositely charged ions near the channel surface. In a divalent electrolyte, these attractions significantly weaken the effects (i) and (ii), resulting in an order-of-magnitude reduction in the change in the mobility by hydrodynamic slip. However, the reduction is more gentle in a monovalent electrolyte. This is because electrostatic correlations in a monovalent electrolyte are weaker than those in a divalent electrolyte. Thus, electrostatic correlations are not strong enough to significantly weaken the effects (i) and (ii). As a result, compared to the same system that ignores electrostatic correlations, electrostatic correlations only reduce the slip-induced change in the mobility by ≈60% in a monovalent electrolyte.
Many interesting questions remain for future work. For example, the present model can incorporate a concentration-dependent solution permittivity. Recall that the modified Poisson equation in the present work assumes a constant permittivity. In general, the solution permittivity decreases with an increasing electrolyte concentration, a phenomenon known as dielectric decrement.82,95,98–100 Incorporating a concentration-dependent permittivity will expand the applicability of the present model to electrolyte solutions of concentrations beyond a few molars. However, it is expected that dielectric decrement will have insignificant effects on the results and conclusions of the present work. This is reasoned as follows. The solution permittivity varies linearly with the electrolyte concentration as ε = εw − (γ+C+ + γ−C−), where εw is the solvent (water) permittivity, γ+ and γ− are the coefficient of dielectric decrement of the cationic and anionic species, respectively, and C+ and C− are the molar concentrations of the cationic and anionic species, respectively.95 For water at 293 K, εw = 80.1. For NaCl, γ+ = 8 M−1 and γ− = 3 M−1. Let us consider C+ = C− = 1 M, since the key observations of this work arise at 1 M or lower. Thus, the dielectric decrement is (γ+C+ + γ−C−) = 11, which is about an order of magnitude smaller than εw. Hence, dielectric decrement will have insignificant effects on the results and conclusions of the present work. This is consistent with prior work,51,60,65,76–79 where the predictions by the modified Poisson equation are in good agreement with Monte Carlo and density functional theory simulations in electrolyte solutions of concentrations up to 1 M, and likely up to a few molars. In addition, a prior model which assumes a constant solution permittivity accurately captures the experimentally measured electrophoretic mobility in electrolyte solutions up to 1 M.64 This provides strong support for the reasonable assumption of a constant solution permittivity to predict the new diffusioosmotic flow responses in the present work.
Appendix
A. Diffusioosmosis of a monovalent electrolyte with a positive ion diffusivity ratio β
In this section, we present the diffusioosmotic mobility M̂ of a monovalent electrolyte with a positive ion diffusivity ratio β = 0.5. All the observations in Section 3.1 for β = −0.5 persist here, demonstrating the generality of the observations and the underlying physics. For brevity, we recapitulate the observations and key findings below without repeating the explanations.
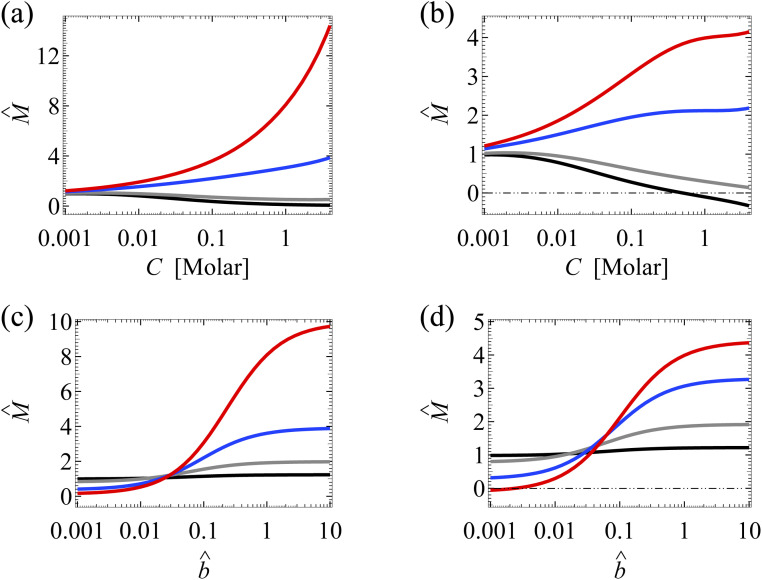
Analogous to Fig. 3(a), Fig. 9(a) shows the variation of M̂ with the bulk electrolyte concentration C in the absence of ion–ion electrostatic correlations (δc = 0). The first observation is that the amplification of the mobility by hydrodynamic slip (non-zero slip length b̂) is more prominent in a concentrated electrolyte (C = 1 M) than in a dilute electrolyte (C = 10−3 M). Analogous to Fig. 3(b), Fig. 9(b) shows the variation of M̂ in the presence of electrostatic correlations (δc ≠ 0). The second observation is that, in the absence of hydrodynamic slip (b̂ = 0), electrostatic correlations cause a reversal in the direction of diffusioosmosis, manifested in a sign change in the mobility at C ≈ 0.4 M. As a key result arising from the coupled effects of hydrodynamic slip and electrostatic correlations, Fig. 9(b) shows that a minute hydrodynamic slip can eliminate the diffusioosmotic flow reversal caused by electrostatic correlations.
Fig. 9. Diffusioosmosis of a monovalent electrolyte with ion diffusivity ratio β = 0.5. The channel surface charge density q = −0.014 C m−2 corresponds to a channel surface potential ζ = −100 mV at a bulk electrolyte molar concentration C = 10−3 M. Panels (a) and (c) ignore ion–ion electrostatic correlations (δc = 0). Panels (b) and (d) account for electrostatic correlations (δc = κlc). (a) and (b): The diffusioosmotic mobility M̂ versus C. Color schemes follow Fig. 3. (c) and (d): M̂ versus the slip length b̂. Color schemes follow Fig. 4.
Analogous to Fig. 4(a), Fig. 9(c) shows the variation of M̂ with b̂ in the absence of electrostatic correlations. The first observation is that the amplification of M̂ by hydrodynamic slip is bounded, as shown by the plateau in the limit of large b̂ of each line. A key result arising from the coupled effects of hydrodynamic slip and electrostatic correlations is that, when comparing Fig. 9(c) and (d) at C = 1 M, the latter shows that electrostatic correlations can significantly reduce the change in the mobility due to hydrodynamic slip. This is analogous to comparing Fig. 4(a) and (b).
Data availability
All data that supports this study is included in this article.
Author contributions
S. Z.: data curation, formal analysis, investigation, methodology, software, validation, writing – original draft, writing – review & editing. H. C. W. C.: conceptualization, data curation, formal analysis, funding acquisition, methodology, project administration, resources, supervision, visualization, writing – original draft, writing – review & editing.
Conflicts of interest
There are no conflicts of interest to declare.
Acknowledgments
This work was supported by the donors of ACS Petroleum Research Fund under Doctoral New Investigator Grant 66915-DNI9. H.C.W.C served as Principal Investigator on ACS PRF 66915-DNI9 that provided support for S.Z. This material is based upon work supported by the U.S. Department of Energy, Office of Science, Office of Basic Energy Sciences, Geosciences program under Award Number DE-SC0018676. The authors acknowledge the fruitful discussion with Professor Anthony J. C. Ladd.
Footnotes
The zero current condition will require modifications if the system is connected to a closed circuit, e.g., the two ends of the electrolyte concentration gradient are connected to an external resistor.85,86
Lee et al.96 defined um = −M∇x|log n∞| whereas our definition does not have the minus sign. Both definitions are correct as long as the theory and experiments consistently use the same definition.
References
- Prieve D. C. Anderson J. L. Ebel J. P. Lowell M. E. J. Fluid Mech. 1984;148:247–269. doi: 10.1017/S0022112084002330. [DOI] [Google Scholar]
- Marbach S. Bocquet L. Chem. Soc. Rev. 2019;48:3102–3144. doi: 10.1039/C8CS00420J. [DOI] [PubMed] [Google Scholar]
- Shim S. Chem. Rev. 2022;122:6986–7009. doi: 10.1021/acs.chemrev.1c00571. [DOI] [PubMed] [Google Scholar]
- Kar A. McEldrew M. Stout R. F. Mays B. E. Khair A. S. Velegol D. Gorski C. A. Langmuir. 2016;32:5233–5240. doi: 10.1021/acs.langmuir.6b00462. [DOI] [PubMed] [Google Scholar]
- Plumper O. Botan A. Los C. Liu Y. Malthe-Sorenssen A. Jamtveit B. Nat. Geosci. 2017;10:685–690. doi: 10.1038/ngeo3009. [DOI] [PMC free article] [PubMed] [Google Scholar]
- Ladd A. J. C. Szymczak P. Annu. Rev. Chem. Biomol. Eng. 2021;12:4.1–4.29. doi: 10.1146/annurev-chembioeng-092920-102703. [DOI] [PubMed] [Google Scholar]
- Shi N. Nery-Azevedo R. Abdel-Fattah A. I. Squires T. M. Phys. Rev. Lett. 2016;117:258001. doi: 10.1103/PhysRevLett.117.258001. [DOI] [PubMed] [Google Scholar]
- Zhai S. Zhao H. Phys. Rev. E. 2016;93:052409. doi: 10.1103/PhysRevE.93.052409. [DOI] [PMC free article] [PubMed] [Google Scholar]
- Shin S. Ault J. T. Warren P. B. Stone H. A. Phys. Rev. X. 2017;4:041038. [Google Scholar]
- Ault J. T. Shin S. Stone H. A. Soft Matter. 2019;15:1582–1596. doi: 10.1039/C8SM01360H. [DOI] [PubMed] [Google Scholar]
- McMullen A. Araujo G. Winter M. Stein D. Sci. Rep. 2019;9:15065. doi: 10.1038/s41598-019-51049-4. [DOI] [PMC free article] [PubMed] [Google Scholar]
- Ha D. Seo S. Lee K. Kim T. ACS Nano. 2019;13:12939–12948. doi: 10.1021/acsnano.9b05507. [DOI] [PubMed] [Google Scholar]
- Chu H. C. W. Garoff S. Tilton R. D. Khair A. S. Soft Matter. 2020;16:238–246. doi: 10.1039/C9SM01938C. [DOI] [PubMed] [Google Scholar]
- Rasmussen M. K. Pedersen J. N. Marie R. Nat. Commun. 2020;11:2337. doi: 10.1038/s41467-020-15889-3. [DOI] [PMC free article] [PubMed] [Google Scholar]
- Singh N. Vladisavljevic G. T. Nadal F. Cottin-Bizonne C. Pirat C. Bolognesi G. Phys. Rev. Lett. 2020;125:248002. doi: 10.1103/PhysRevLett.125.248002. [DOI] [PubMed] [Google Scholar]
- Chu H. C. W. Garoff S. Tilton R. D. Khair A. S. J. Fluid Mech. 2021;917:A52. doi: 10.1017/jfm.2021.322. [DOI] [Google Scholar]
- Alessio B. M. Shim S. Gupta A. Stone H. A. J. Fluid Mech. 2022;942:A23. doi: 10.1017/jfm.2022.321. [DOI] [Google Scholar]
- Chu H. C. W. Garoff S. Tilton R. D. Khair A. S. Soft Matter. 2022;18:1896–1910. doi: 10.1039/D2SM00139J. [DOI] [PubMed] [Google Scholar]
- Volk R. Bourgoin M. Brehier C. Raynal F. J. Fluid Mech. 2022;948:A42. doi: 10.1017/jfm.2022.730. [DOI] [Google Scholar]
- McKenzie B. E. Chu H. C. W. Garoff S. Tilton R. D. Khair A. S. J. Fluid Mech. 2022;949:A17. doi: 10.1017/jfm.2022.666. [DOI] [Google Scholar]
- Akdeniz B. Wood J. A. Lammertink R. G. H. Langmuir. 2023;39:2322–2332. doi: 10.1021/acs.langmuir.2c03000. [DOI] [PMC free article] [PubMed] [Google Scholar]
- Teng J. Rallabandi B. Ault J. T. J. Fluid Mech. 2023;977:A5. doi: 10.1017/jfm.2023.919. [DOI] [Google Scholar]
- Sambamoorthy S. Chu H. C. W. Soft Matter. 2023;19:1131–1143. doi: 10.1039/D2SM01620F. [DOI] [PubMed] [Google Scholar]
- Xu J. Wang Z. Chu H. C. W. RSC Adv. 2023;13:9247–9259. doi: 10.1039/D3RA00115F. [DOI] [PMC free article] [PubMed] [Google Scholar]
- Shin S. Um E. Sabass B. Ault J. T. Rahimi M. Warren P. B. Stone H. A. Proc. Natl. Acad. Sci. U. S. A. 2016;113:257–261. doi: 10.1073/pnas.1511484112. [DOI] [PMC free article] [PubMed] [Google Scholar]
- Shin S. Doan V. S. Feng J. Phys. Rev. Appl. 2019;12:024014. doi: 10.1103/PhysRevApplied.12.024014. [DOI] [Google Scholar]
- Kar A. Chiang T. Rivera I. O. Sen A. Velegol D. ACS Nano. 2015;9:746–753. doi: 10.1021/nn506216b. [DOI] [PubMed] [Google Scholar]
- Park S. W. Lee J. Yoon H. Shin S. Energy Fuels. 2021;35:4885–4892. doi: 10.1021/acs.energyfuels.0c04320. [DOI] [Google Scholar]
- Shi N. Abdel-Fattah A. Phy. Rev. Fluids. 2021;6:053103. doi: 10.1103/PhysRevFluids.6.053103. [DOI] [Google Scholar]
- Tan H. Banejee A. Shi N. Tang X. Abdel-Fattah A. Squires T. M. Sci. Adv. 2021;7:eabh0638. doi: 10.1126/sciadv.abh0638. [DOI] [PMC free article] [PubMed] [Google Scholar]
- Zhang H. Moh D. Y. Wang S. Qiao R. Phys. Fluids. 2022;34:092017. doi: 10.1063/5.0110741. [DOI] [Google Scholar]
- Ajdari A. Bocquet L. Phys. Rev. Lett. 2006;96:186102. doi: 10.1103/PhysRevLett.96.186102. [DOI] [PubMed] [Google Scholar]
- Huang D. M. Cottin-Bizonne C. Ybert C. Bocquet L. Phys. Rev. Lett. 2008;101:064503. doi: 10.1103/PhysRevLett.101.064503. [DOI] [PubMed] [Google Scholar]
- Hoshyargar V. Sadeghi A. Ashrafizadeh S. N. RSC Adv. 2016;6:49517. doi: 10.1039/C6RA05846A. [DOI] [Google Scholar]
- Huang H. Huang K. Meccanica. 2019;54:2151–2168. doi: 10.1007/s11012-019-01077-1. [DOI] [Google Scholar]
- Navier C. L. M. H. Mem. Acad. R. Sci. Inst. France. 1823;6:389–440. [Google Scholar]
- Lauga E., Brenner M. P. and Stone H. A., Microfluidics: the no-slip boundary condition, in Handbook of Experimental Fluid Dynamics, Springer, New York, 2007 [Google Scholar]
- Vinogradova O. I. Belyaev A. V. J. Phys.: Condens. Matter. 2011;23:184104. doi: 10.1088/0953-8984/23/18/184104. [DOI] [PubMed] [Google Scholar]
- Chu H. C. W. Ng C. O. Fluid Dyn. Res. 2013;45:025507. doi: 10.1088/0169-5983/45/2/025507. [DOI] [Google Scholar]
- Neto C. Evans D. R. Bonaccurso E. Butt H. Craig V. S. J. Rep. Prog. Phys. 2005;68:2859–2897. doi: 10.1088/0034-4885/68/12/R05. [DOI] [Google Scholar]
- Lee C. Choi C. H. Kim C. J. Exp. Fluids. 2016;57:176. doi: 10.1007/s00348-016-2264-z. [DOI] [Google Scholar]
- Cheng J. T. Giordano N. Phys. Rev. E: Stat., Nonlinear, Soft Matter Phys. 2002;65:031206. doi: 10.1103/PhysRevE.65.031206. [DOI] [PubMed] [Google Scholar]
- Tretheway D. C. Meinhart C. D. Phys. Fluids. 2002;14:L9–L12. doi: 10.1063/1.1432696. [DOI] [Google Scholar]
- Huang P. Breuer K. S. Phys. Fluids. 2007;19:028104. doi: 10.1063/1.2539829. [DOI] [Google Scholar]
- Bowles A. P. Ducker W. A. J. Phys. Chem. C. 2013;117:14007–14013. doi: 10.1021/jp402553f. [DOI] [Google Scholar]
- Aminpour M. Torres S. A. G. Scheuermann A. Li L. Phys. Rev. Appl. 2021;15:054051. doi: 10.1103/PhysRevApplied.15.054051. [DOI] [Google Scholar]
- Jin J. Asai P. Wang X. Miller J. D. Deo M. Colloids Surf., A. 2021;626:127032. doi: 10.1016/j.colsurfa.2021.127032. [DOI] [Google Scholar]
- Hunter R. J., Zeta potential in colloid science, Academic Press, New York, 1981 [Google Scholar]
- Zhang S. Chu H. C. W. Nanoscale. 2024;16:9367–9381. doi: 10.1039/D3NR06152C. [DOI] [PubMed] [Google Scholar]
- Bazant M. Kilic M. S. Storey B. D. Ajdari A. Adv. Colloid Interface Sci. 2009;152:48–88. doi: 10.1016/j.cis.2009.10.001. [DOI] [PubMed] [Google Scholar]
- Storey B. D. Bazant M. Z. Phys. Rev. E: Stat., Nonlinear, Soft Matter Phys. 2012;86:056303. doi: 10.1103/PhysRevE.86.056303. [DOI] [PubMed] [Google Scholar]
- Torrie G. M. Valleau J. P. J. Chem. Phys. 1980;73:5807–5816. doi: 10.1063/1.440065. [DOI] [Google Scholar]
- Fedorov M. V. Kornyshev A. A. J. Phys. Chem. B. 2008;112:11868–11872. doi: 10.1021/jp803440q. [DOI] [PubMed] [Google Scholar]
- Gonzales-Tovar E. Lozada-Cassou M. Henderson D. J. Chem. Phys. 1985;83:361–372. doi: 10.1063/1.449779. [DOI] [Google Scholar]
- Kjellander R. Marcelja S. J. Phys. Chem. A. 1986;90:1230–1232. doi: 10.1021/j100398a006. [DOI] [Google Scholar]
- Attard P. Mitchell D. J. Ninham B. W. J. Chem. Phys. 1988;89:4358–4367. doi: 10.1063/1.454821. [DOI] [Google Scholar]
- Ennis J. Marcelja S. Kjellander R. Electrochim. Acta. 1996;41:2115–2124. doi: 10.1016/0013-4686(96)00043-6. [DOI] [Google Scholar]
- Martin-Molina A. Quesada-Perez M. Galisteo-Gonzalez F. Hidalgo-Alvarez R. J. Chem. Phys. 2003;118:4183–4189. doi: 10.1063/1.1540631. [DOI] [Google Scholar]
- Netz R. R. Orland H. Eur. Phys. J. E: Soft Matter Biol. Phys. 2000;1:203–214. doi: 10.1007/s101890050023. [DOI] [Google Scholar]
- Hatlo M. M. Lue L. Europhys. Lett. 2010;89:25002. doi: 10.1209/0295-5075/89/25002. [DOI] [Google Scholar]
- Gillespie D. Khair A. S. Bardhan J. P. Pennathur S. J. Colloid Interface Sci. 2011;359:520–529. doi: 10.1016/j.jcis.2011.03.088. [DOI] [PubMed] [Google Scholar]
- Zhang M., Chen Y., Eikerling M. and Huang J., Grand-Canonical Variational Theory of Oscillatory Fields at Electrified Metal-Solution Interfaces, 2023, 10.26434/chemrxiv-2024-c5dvr [DOI]
- Auer A. Eder B. Giessibl F. J. J. Chem. Phys. 2023;159:174201. doi: 10.1063/5.0168329. [DOI] [PubMed] [Google Scholar]
- Stout R. F. Khair A. S. J. Fluid Mech. 2014;752:R1. doi: 10.1017/jfm.2014.354. [DOI] [Google Scholar]
- Celebi A. T. Cetin B. Beskik A. J. Phys. Chem. C. 2019;123:14024–14035. doi: 10.1021/acs.jpcc.9b02432. [DOI] [Google Scholar]
- Alidoosti E. Zhao H. Electrophoresis. 2019;40:2655–2661. doi: 10.1002/elps.201900127. [DOI] [PMC free article] [PubMed] [Google Scholar]
- Keh H. J. Ma H. C. Langmuir. 2005;21:5461–5467. doi: 10.1021/la0504863. [DOI] [PubMed] [Google Scholar]
- Ma H. C. Keh H. J. J. Colloid Interface Sci. 2006;298:476–486. doi: 10.1016/j.jcis.2005.11.042. [DOI] [PubMed] [Google Scholar]
- Chiang T. Velegol D. J. Colloid Interface Sci. 2014;424:120–123. doi: 10.1016/j.jcis.2014.03.003. [DOI] [PubMed] [Google Scholar]
- Hoshyargar V. Ashrafizadeh S. N. Sadeghi A. Phys. Chem. Chem. Phys. 2015;17:29193–29200. doi: 10.1039/C5CP05327G. [DOI] [PubMed] [Google Scholar]
- Keh H. J. Curr. Opin. Colloid Interface Sci. 2016;24:13–22. doi: 10.1016/j.cocis.2016.05.008. [DOI] [Google Scholar]
- Jing H. Das S. Phys. Chem. Chem. Phys. 2018;20:10204–10212. doi: 10.1039/C8CP01091A. [DOI] [PubMed] [Google Scholar]
- Gupta A. Rallabandi B. Stone H. A. Phy. Rev. Fluids. 2019;4:043702. doi: 10.1103/PhysRevFluids.4.043702. [DOI] [Google Scholar]
- Bikerman J. J. Philos. Mag. 1942;33:384–397. [Google Scholar]
- Kilic M. S. Bazant M. Z. Ajdari A. Phys. Rev. E: Stat., Nonlinear, Soft Matter Phys. 2007;75:021502. doi: 10.1103/PhysRevE.75.021502. [DOI] [PubMed] [Google Scholar]
- Bazant M. Storey B. D. Kornyshev A. A. Phys. Rev. Lett. 2011;106:046102. doi: 10.1103/PhysRevLett.106.046102. [DOI] [PubMed] [Google Scholar]
- de Souza J. P. Bazant M. Z. J. Phys. Chem. C. 2020;124:11414–11421. doi: 10.1021/acs.jpcc.0c01261. [DOI] [Google Scholar]
- Santangelo C. D. Phys. Rev. E: Stat., Nonlinear, Soft Matter Phys. 2006;73:041512. doi: 10.1103/PhysRevE.73.041512. [DOI] [PubMed] [Google Scholar]
- Alijo P. H. R. Tavares F. W. Biscaia Jr E. C. Secchi A. R. Electrochim. Acta. 2015;152:84–92. doi: 10.1016/j.electacta.2014.11.109. [DOI] [Google Scholar]
- Alidoosti E. Zhao H. Langmuir. 2018;34:5592–5599. doi: 10.1021/acs.langmuir.8b00855. [DOI] [PMC free article] [PubMed] [Google Scholar]
- He M. Sun P. Zhao H. Comput. Math. Appl. 2022;117:229–244. doi: 10.1016/j.camwa.2022.05.005. [DOI] [Google Scholar]
- Gupta A. Stone H. A. Langmuir. 2018;34:11971–11985. doi: 10.1021/acs.langmuir.8b02064. [DOI] [PubMed] [Google Scholar]
- Probstein R. F., Physicochemical Hydrodynamics: An Introduction, John Wiley and Sons, New York, 1994 [Google Scholar]
- Shin S. Phys. Fluids. 2020;32:101302. doi: 10.1063/5.0023415. [DOI] [Google Scholar]
- Kang B. D. Kim H. J. Lee M. G. Kim D. Energy. 2015;86:525–538. doi: 10.1016/j.energy.2015.04.056. [DOI] [Google Scholar]
- Siria A. Bocquet M. Bocquet L. Nat. Rev. Chem. 2017;1:0091. doi: 10.1038/s41570-017-0091. [DOI] [Google Scholar]
- Vanysek P., CRC Handbook of Chemistry and Physics, CRC Press, Boca Raton, 1992 [Google Scholar]
- Werner C. Zimmerman R. Kratzmuller T. Colloids Surf., A. 2001;192:205–213. doi: 10.1016/S0927-7757(01)00725-7. [DOI] [Google Scholar]
- Trimpert C. Boese G. Albrecht W. Richau K. Weigel T. Lendlein A. Groth T. Macromol. Biosci. 2006;6:274–284. doi: 10.1002/mabi.200500238. [DOI] [PubMed] [Google Scholar]
- Uba F. I. Pullagurla S. R. Sirasunthorn N. Wu J. Park S. Chantiwas R. Cho Y. Shin H. Soper S. A. Analyst. 2015;140:113–126. doi: 10.1039/C4AN01439A. [DOI] [PMC free article] [PubMed] [Google Scholar]
- Song Y. Li J. Li D. Electrophoresis. 2016;37:567–572. doi: 10.1002/elps.201500465. [DOI] [PubMed] [Google Scholar]
- Santos T. P. Cunha R. L. Tabeling P. Cejas C. M. Phys. Chem. Chem. Phys. 2020;22:17236. doi: 10.1039/D0CP01999B. [DOI] [PubMed] [Google Scholar]
- Wang J. G. Ladiges D. R. Srivastava I. Carney S. P. Nonaka A. J. Garcia A. L. Bell J. B. Phys. Rev. Fluids. 2023;8:083702. doi: 10.1103/PhysRevFluids.8.083702. [DOI] [Google Scholar]
- Dane J. H. and Topp G. C., Methods of soil analysis Part 4 Physical methods, Soil Science Society of America Inc., Madison Wisconsin, 2002 [Google Scholar]
- Nakayama Y. Andelman D. J. Chem. Phys. 2015;142:044706. doi: 10.1063/1.4906319. [DOI] [PubMed] [Google Scholar]
- Lee C. Cottin-Bizonne C. Biance A. L. Joseph P. Bocquet L. Ybert C. Phys. Rev. Lett. 2014;112:244501. doi: 10.1103/PhysRevLett.112.244501. [DOI] [PubMed] [Google Scholar]
- Milanova D. CHambers R. D. Bahga S. S. Santiago J. G. Electrphoresis. 2011;32:3286–3294. doi: 10.1002/elps.201100210. [DOI] [PubMed] [Google Scholar]
- Hasted J. B. Ritson D. M. Collie C. H. J. Chem. Phys. 1948;16:1–21. doi: 10.1063/1.1746645. [DOI] [Google Scholar]
- Ben-Yaakoc D. Andelman D. Podgornik R. J. Chem. Phys. 2011;134:074705. doi: 10.1063/1.3549915. [DOI] [PubMed] [Google Scholar]
- Hatlo M. M. van Roij R. Lue L. Europhys. Lett. 2012;97:28010. doi: 10.1209/0295-5075/97/28010. [DOI] [Google Scholar]
Associated Data
This section collects any data citations, data availability statements, or supplementary materials included in this article.
Data Availability Statement
All data that supports this study is included in this article.


