

Abstract
Individuals suffering from obsessive compulsive disorder (OCD) and schizophrenia (SCZ) frequently exhibit symptoms of cognitive disassociations, which are linked to poor functional integration among brain regions. The loss of functional integration can be assessed using graph metrics computed from functional connectivity matrices (FCMs) derived from neuroimaging data. A healthy brain at rest is known to exhibit small-world features with high clustering coefficients and shorter path lengths in contrast to random networks. The aim of this study was to compare the small-world properties of prefrontal cortical functional networks of healthy subjects with OCD and SCZ patient groups by use of hemodynamic data obtained with functional near infrared spectroscopy (fNIRS). 13 healthy subjects and 47 patients who were clinically diagnosed with either OCD (N = 21) or SCZ (N = 26) completed a Stroop test while their prefrontal cortex (PFC) hemodynamics were monitored with fNIRS. The Stroop test had a block design consisting of neutral, congruent and incongruent stimuli. For each subject and stimuli type, FCMs were derived separately which were then used to compute small world features that included (i) global efficiency (GE), (ii) clustering coefficient (CC), (iii) modularity (Q), and (iv) small-world parameter (). Small-world features of patients exhibited random networks which were indicated by higher GE and lower CC values when compared to healthy controls, implying a higher neuronal operational cost.
Keywords: Small worldness, fNIRS, Obsessive-compulsive disorder, Schizophrenia, Functional connectivity, Global efficiency
Subject terms: Network models, Brain imaging, Biomedical engineering, Cognitive neuroscience, Computational neuroscience
Introduction
The human brain is a complex network made up of millions of neurons with a small world topology, which is widely used to model the network behavior of various natural interactions involving social networks and brain networks1–4.
The understanding of brain network function through its correspondence to small-world topology is predicated on the assumption that information processing and transfer between neuronal structures have an optimal dynamic balance of local-level specialization and global-level integration. The small-world topology is defined by dense local clustering of neuronal connections between neighboring nodes and a short average path length between all possible pairs of nodes1. The functional and structural organization of the human cerebral cortex have been frequently modeled by a small-world topology because the properties of a small-world configuration optimize both local information processing efficiency and global information integration, where efficiency is defined as low energy consumption and wiring costs with a high transmission rate1.
Furthermore, the application of computing small-world topology features to the interpretation of structural and functional neuroimaging data obtained at various spatial and temporal scales has demonstrated that any disruption in the structural organization or functionality of this network could be an indicator or a result of a brain disease or disorder. Indeed, several neuropsychiatric disorders have been linked to disruptions and changes in the small-world properties of cerebral cortex networks. Among these disorders, changes in functional and structural connectivity have been extensively studied for obsessive-compulsive disorder (OCD) and schizophrenia (SCZ). Resting-state functional magnetic resonance imaging (fMRI) studies have revealed that SCZ patients have lower small-world functional connectivity and weaker local clustering5. Deficit and nondeficit SCZ patients have lower local efficiency metrics than healthy controls (HC), indicating a decrease in local specialization6.
The efficiency of a network’s organization can be measured using graph theoretical metrics. Previous studies on brain functional connectivity have benefited significantly from graph theoretical metrics in generating such features3,7–9. Among many metrics, Global Efficiency (GE) has been widely and consistently used in brain connectivity research as a metric to quantify the information-sharing efficiency of functional connectivity matrices (FCMs)7,8,10–14. Small-world phenomena imply both high local and global efficiency, which manifests itself as high functional specialization measured by a metric named the clustering coefficient and cost-efficient functional integration measured by a shorter mean path length1,3.
Over the last two decades, numerous studies have focused on how these graph theoretical metrics can be computed from neuroimaging data and how well they represent brain states, particularly the affected brain. Many studies investigated the accuracy of such metrics as biomarkers extracted from neuroimaging data and discovered conflicting results for SCZ patientsOver the last two decades, numerous studies have focused on methodologies for extracting graph theoretical metrics from functional neuroimaging data and the extent to which these metrics can represent altered brain states, particularly the affected brain. Various studies investigated the existence of alterations in functional and structural connectome of SCZ patients by use of graph theoretical metrics. A recent meta-analysis15 was undertaken due to the observation that comparisons of the structural and functional network properties between SCZ patients and HCs yielded contradictory findings. The researchers conducted a literature search on all available articles up to 2022. They included papers that utilized only MRI scanners. After all the exclusion criteria were implemented, 48 studies were included. As a conclusion, decreased segregation and integration in the structural connectome of SCZ patients were reported while no significant difference in functional network metrics were found across all graph theoretical characteristics. Their interpretations to this insignificance were attributed to the polygenecity of the disease, heterogeneity in methodological factors, different preprocessing strategies, selection of threshold ranges. They concluded that more research is needed for understanding the differences between functional organization of SCZ patients and HCs.
As a less studied disease using graph theoretical approaches, OCD patients showed more consistent results with GE than healthy controlsAs a less studied disease group with graph theoretical approaches, OCD patients also demonstrated alterations in global network efficiency16 and modular structure of the brain networks which refers to the dynamic balance between wiring cost and efficiency of information transmission17,18. Significantly lower functional connectivity was found in OCD patients in a resting state fMRI study. OCD patients were unable to deactivate anterior nodes of the default mode network (DMN) during presentation of emotionally pleasant and unpleasant images19. Anterior nodes of the default mode network(DMN) showed deactivation at OCD group20. Concentrated exposure and response prevention therapy in medication naive OCD patients resulted in reduced connectivity between the frontoparietal and limbic subnetworks. These behavioral treatments also decrease the connectivity flexibility of the subgenual anterior cingulate cortex, which is an indication of a more independent and stable network topology21. Functional network dysfunction in OCD patients can be detected with lower modular segregation in both primary(visual network, sensorimotor network) and high-order modules (dorsal attention network, frontoparietal network). A recent resting state fMRI study also found frequency-specific abnormalities in global metrics (i.e., small-worldness, global efficiency and modularity) derived from different frequency bands of BOLD signal fluctuations at OCD patients, which included small worldness metrics18.
Overall, studies found an impairment of small-world organization of the cerebral functional network in psychiatric patients than healthy controls. This study investigates the small-world properties of prefrontal cortical functional networks in psychiatric patients to challenge previous research findings. Recent studies have presented compelling evidence that a wide variety of neuropsychiatric disorders can be characterized by functional alterations in the hemodynamic activity of the prefrontal cortex (PFC), which can be detected with fNIRS22. Hypoactivation in frontal lobe regions has been detected in patients with SCZ and major depressive disorder (MDD) during verbal fluency tasks when compared to their healthy counterparts22,23Similarly, hyper- and hypo-connectivity between different brain regions during resting state have been identified in patients with SCZ, while decreased cerebral blood flow in bilateral symmetric regions of the inferior PFC has been detected in patients with OCD when compared to their healthy counterparts, while decreased cerebral blood flow in bilateral symmetric regions of the inferior PFC has been detected in patients with OCD when compared to their healthy counterparts24–26. In conclusion, these studies have highlighted the potential of exploring PFC-based neurofunctional features as objective and distinctive biomarkers of various major neuropsychiatric disorder states. They also showed that information from practical and preferably field-deployable cerebral physiology monitoring tools such as fNIRS systems can quantify and parameterize abnormalities in frontal lobe function and may have a great potential for assisting in the objective diagnosis and classification of major psychiatric disorders which, in most cases, have overlapping behavioral symptoms across each other and are difficult to distinguish when decisions are based solely on observation, self-report, interview, and/or rating scales.
We investigate the use of fNIRS, a rapid, non-invasive, mobile brain imaging technology that is better suited to cognitive studies, in elucidating the small-world properties of prefrontal cortical functional networks. To achieve this, we used the well-established cognitive task known as the Stroop task. This task is featured among the most classical paradigms in experimental psychology as it is a simple yet robust measure of selective attention, cognitive flexibility, and processing speed. While not a direct measure of small-world properties, by combining the Stroop task with fNIRS, we aim to extract metrics such as Clustering Coefficient (CC), Modularity (Q), and Global Efficiency (GE) that would allow us to make inferences about the small-world network in participants with aforementioned cognitive disorders. A positive outcome in favour of our hypothesis would also show how small-world properties of our brain network can be derived from a vast number of cognitive processes and help us better understand how the brain organises and integrates information.
Methods and materials
Subjects and experimental procedure
The study included sixty subjects from three different groups. The three categories were as follows: (1) 13 healthy control subjects (6 female, average age 26), (2) 26 patients with obsessive-compulsive disorder (11 female, average age of 29), and (3) 21 patients with SCZ (10 female, average age of 28). Diagnoses were made based on comprehensive interviews conducted by an experienced psychiatrist using standardized diagnostic criteria (DSM-IV-TR). The diagnoses of patients who agreed to participate in the study were confirmed by SCID-I structured interview. Schizophrenia patients who were too agitated to allow evaluation were excluded in the study. The OCD group consisted of patients with mild/severe obsessive-compulsive symptoms who were not in remission. Additionally, acute neurological disease (such as stroke) and comorbid psychiatric diagnoses (including depression) were considered as exclusion criteria. Scale for the Assessment of Positive Symptoms (SAPS), Scale for the Assessment of Negative Symptoms (SANS), Brief Psychiatric Rating Scale (BPRS) were used for patients diagnosed with schizophrenia. Extrapyramidal Symptoms Assessment Scale (EBDS), Calgary Depression Scale for Schizophrenia (CDS) were also applied. Yale Brown Obsessive Compulsive Rating Scale (Y-BOCS), Hamilton Depression Scale (HDS) and Overvalued Thought Scale (ADS) were applied to the patient group meeting the diagnosis of OCD. According to OCD scores, patients with OCD and those who score 6 or above were determined as the low-insight OCD group. We conducted a post-hoc power analysis using G*Power to assess the achieved power with our current sample and effect sizes. For a smallest effect size that shows a significant difference in our study (n2 = 0.14) and an alpha level of 0.05, our analysis revealed a power of 0.99. Given the unbalanced group sizes, we calculated the power based on the smallest group (13 HC). This indicates that our study has a sufficient power level to detect medium-sized effects, supporting the validity of our findings. The protocol was approved by the Ethics Committee of Pamukkale University in 2008. All experiments were performed in accordance with relevant guidelines and regulations of the Ethics Committee, which abide with the Helsinki Declaration. Our group has previously published portions of this data using analysis methods other than those used in the current study27–37. All subjects gave written and signed informed consent to participate in the study before the experiment. The subjects were instructed to perform the task while sitting in front of a computer in a dimly lit, isolated room.
Subjects were asked to respond to stimuli for a computerized color word-matching Stroop task, which has been thoroughly described in previous research35,38. The subjects were instructed to respond with left mouse clicks with their index finger for “YES” and right mouse clicks with their middle finger for “NO” with their right hand, depending on whether the stimulus was correct or incorrect. During the “Neutral” trials, the top row showed letters (“XXXX”) in different colors (red, green, or blue), while the bottom row showed color words (“RED,” “GREEN,” and “BLUE”) printed in black. In the “Congruent” trials, the top row featured color words printed in matching colors. Conversely, in “Incongruent” trials, color words were printed in opposing colors to induce interference. Participants were asked to determine whether the color name in the top row matched the color word in the bottom row under all conditions. Half of the trials in each condition showed colors that were consistent between the top and bottom rows. The stimuli were presented in nine randomly assigned blocks, with each block containing five consecutive stimuli of the same type. The blocks were interspersed with 20-second rest intervals. Each stimulus within a block was displayed on the screen for 2.5 s, with an inter-stimulus interval of 4 s. The subjects had to respond with left or right mouse clicks based on whether the stimulus was correct or incorrect. The entire Stroop task began with 30 s of resting fNIRS recording and concluded with another 30 s of rest. Each participant performed a 1-min-long practice before the actual session.
Cognitive quotient
The Stroop task yields two types of behavioral outcomes: Reaction (Response) Times () in seconds and Accuracy () as a percentage value, concerning task type , for each subject m. RTs are calculated by averaging the response times of correctly answered stimuli. Accuracy was calculated as the ratio of total correct answers to total questions. The concept of speed-accuracy trade-offs was initially introduced by Townsend and Ashby with the inverse efficiency score39. Combining these two parameters yields the Cognitive Quotient (, also known as cognitive efficiency), which can be calculated by . CQ can also be viewed as a measure of cognitive behavior that includes both reaction time and error rates. This formula has been validated and widely used in cognitive psychology research, where it is denoted as ‘Rate Correct Score”. The specific RCS formula employed in our study was introduced by Woltz and Was (2006), further building on the foundational work of Townsend and Ashby40.
fNIRS equipment
A custom-built fNIRS system (NIROXCOPE 301) was used to collect cortical hemodynamic data at a sampling frequency of 1.77 Hz from 16 brain regions using a flexible probe placed over the forehead. The NIRS system includes a flexible probe placed on the subjects? foreheads, a data acquisition unit, and a data collection computer. The prefrontal cortex probe has four dual-wavelength light-emitting diodes (LED, nm and nm) and 10 photodetectors, forming 16 equidistant light source and detector pairs at a distance of 2.5 cm (Fig. 1). A channel is defined as a pair of 1 LED and 1 photodetector separated by 2.5 cm.
Figure 1.

Rectangular probe geometry of the fNIRS NIROXCOPE 301. are the LEDs, the detectors, and the channels28,41.
Several tests of the validity of this instrument and probe design for probing brain tissue42, as well as its ability to detect cognition-related brain signals, were provided in our previous studies10,29–31,36,43.
Analysis of the fNIRS data
An overview of the analysis of fNIRS [HbO] data consisted of 7 major steps, which will be detailed in the following sections. Briefly, the analysis steps included: (1) calculating partial correlation-based FCMs for both rest and task-stimulus intervals, (2) calculating the average of FCMs across all subjects and stimulus types to find one common background FCM and subtracting this background from each task-based FCM (background subtracted: BS), (3) performing PCA on the BS FCMs and reconstructing noise-eliminated FCMs, (4) applying a thresholding procedure to BSPCA FCMs, (5) Computing the GE value from each combination of PCA set and threshold, (6) determine the PCA component set and threshold with the highest statistically significant difference among the three subject groups based on the GE parameter, and (7) calculate the CC, Q and parameters of the small world phenomena using the selected PCA components and thresholds from step 6. Figure 2 shows the flow of the signal processing pipeline. The sections that follow explain the chronological set of steps in this pipeline
Figure 2.
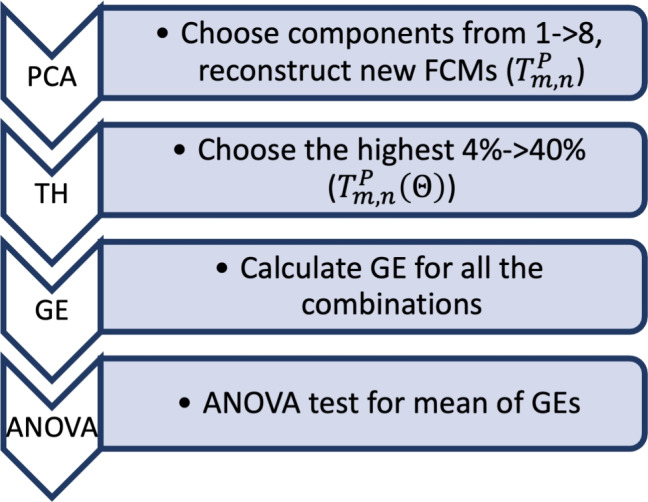
Algorithm of the proposed work: PC-FCMs: partial correlation-based FCMs: Partial correlation based FCMs (Eq. 1), BS: Back Subtraction, PCA: PCA to obtain task positives FCM ( , Eq. 6), TH thresholding and computing adjacency matrix (), ANOVA: calculate 3-class statistical significance (p-value).
Preparing FCMs
Our previous research confirmed the benefits of using a partial correlation-based analysis to obtain FCMs10,34,44. Similar to previous studies, 16 channels of fNIRS [HbO] time series data were first high-pass filtered with a Butterworth filter of order 8 at a cutoff frequency of 0.09 Hz. The subject-based average of these high-pass filtered data was then used as the regressor in the partial correlation analysis, as described in10,44. In summary, the partial correlation coefficient between each pair of channels () can be calculated using the raw (unfiltered) data (k) from two channels with the mean regressor as follows:
| 1 |
Raw [HbO] data were concatenated according to task type and rest data. Hence, from one channel of fNIRS data, four concatenated data sets were generated (1 for resting-state and 3 for task-based). In total, 16 4 data traces were created for each subject, which were then used to generate 4 FCMs. Because there are 16 channels, the FCM is converted to a 16 16 symmetric matrix with diagonals nulled () to exclude them from further GE analysis. In this way, 4 FCMs are generated for each subject using the four sets of concatenated signals.
Background network subtraction
In addition to the previous studies, the question of whether FCMs have background network connectivity that obscures the task-related network topology that emerges during cognitive tasks was raised. We decided to test this assumption by asking a simple but fundamental question: How much do resting-state FCMs and task-based FCMs resemble each other?
To answer this question, the average of the remaining FCMs () and task-based FCMs () was calculated across all 60 subjects. The hypothesis to be tested was:
Assumption 1
A background connectivity network is active even during cognition, which obscures the cognitive network structure.
Therefore, the following average of the rest- and task-based FCMs over 60 subjects were calculated to test for this assumption:
| 2 |
| 3 |
where ( number of subjects) and (). Note that the averages were calculated using squared FCMs. The FCMs are squared for the remainder of the analysis. Averaged FCMs for all subjects during rest and task episodes are shown in Fig. 3a, b. Here, represents the average resting state of squared FCMs calculated across all subjects, while represents the averaged task-based squared FCMs calculated across all subjects.
Figure 3.

(a) , (b) .
A significant correlation value computed using two-dimensional correlation analysis (, ) was found between these two matrices. Therefore, it is now clear that even partial correlation analysis was insufficient to reduce the dominance of physiological systemic activity observed in the background network over networks active during cognition. The presence of a dominant background network in the task FCMs necessitates the removal of this background network, which could not have been eliminated using partial correlation analysis alone. In our previous paper44, we did not perform background subtraction because we assumed that the PCA-based approach would already eliminate all background task-unrelated connectivity topologies. These matrices will now be treated as images, and the following processing pipeline will be based on image-processing approaches developed for target and motion detection applications45,46.
Previous research on removing static background images from images containing moving or non-background targets proposed subtracting this background to improve target detection accuracy47,48. The following processing steps are performed to remove the static background FCM from the task-based FCM:
- Subtract the common background from the task-based FCM ()
5
where m denotes the subject, and n represents the stimulus type. The assumption behind averaging across all subjects is that there is a common baseline resting-state network in all human brains, that remains active during any cognitive paradigm and contains an intrinsic functional connectivity pattern (unrelated to sensory or motor stimuli) that is responsible for maintaining bodily functions49–51. Cognition or task-based FCM, denoted as cn can be assumed to be superimposed on this previously existing so-called “evolutionary network” ()52–54. Therefore, while the brain is doing what it always does (maintaining all bodily functions, as evolution dictates), it should also focus on a specific cognitive task. Once background subtraction is completed, task-based FCMs with small-world properties can be easily extracted. Further elimination of background noise can be done using PCA, which has been proposed in image processing applications55,56.
Assumption 2
Cognition necessitates the activation of an independent functional neural network called the task-positive Network ()
-
3.
Perform PCA on the
-
4.Reconstruct a new Task Positive Network with the strongest components of the PCA decomposition57
6
This pipeline generated three new task-based reconstructed FCMs for each subject. Assuming that these FCMs are now free of background “blurring” effects, we can proceed with the generation of features from these matrices.
A thresholding algorithm was applied to task-positive FCMS, in which only a subset of the highest correlation values within a single matrix were retained to ensure that the same number of edges appeared across all FCMs. This threshold value eventually determines how many nonzero elements are present in the binaries matrix, also known as the adjacency matrix.
| 7 |
Eventually, we are left with metrics for a specific combination of PCA components (i.e. the first 3) and a threshold value. The threshold value determines how sparse the matrix is. Sparsity is calculated by dividing the number of nonzero elements in a matrix by the total number of elements in a matrix. Choice of appropriate threshold directly affects the significance of the graph theoretic metrics. Usually, a sweep of various thresholds is performed and the statistical significance of a specific metric is computed. Literature suggests a range of 1 to 50 % of sparsity of the FCMs.58,59. We optimized this range by computing the statistical significance of the values over the three groups. The sparsity (also known as the Cost) values were chosen between 4% and 40%.
Small-worldness
Small-world phenomena in brain networks can be studied by comparing graph theoretical metrics obtained from individual FCMs concerning different threshold values. Typically, a comparison is performed between several of the graph theoretical metrics, such as the GE, Clustering Coefficient (CC), characteristic path length (L), and graph theoretical modularity (Q) values, with those obtained from a normally distributed random matrix (network) and those from a lattice type of network for varying levels of sparsity or cost, as described in2,60. Computation of the graph theoretical metrics is explained in detail in other studies3,61,62. The small-world parameter () can be calculated from the other metrics using the following formula63:
| 8 |
These equations were used to calculate the individual for controls, for OCD patients, and for SCZ patients. Therefore, the primary goal of this paper is to test the following hypothesis:
Hypothesis 1
The small-world phenomenon is disrupted in OCD and SCZ patients due to changes in the brain’s network of functional connectivity.
A comparison was made between the small world parameters of GE, CC, Q, and values of the subjects to test the above hypothesis.
Results
Behavioral results
Figure 4a shows the average CQ values for subjects and stimuli. A two-way mixed ANOVA of mean CQ values for each group and stimulus type () revealed significant values for group comparison (), and stimulus type () but no interaction for (). There is a decreasing trend of the mean CQ as the task becomes more difficult (from N to I) for all groups. Similarly, the mean CQ value () plotted as the last bar for each group across three stimuli types (shown in Fig. 4b) resulted with as for controls, for OCD patients, and for SCZ patients with a significant difference (), , ). The Scheffe post hoc analyses revealed that the differences in values between the control group and both the OCD () and SCZ () groups were statistically significant. However, the difference between the OCD and SCZ groups was only marginally significant (). Because there is no significant interaction for this term, the (over three stimulus types) will be used for the remainder of the analysis.
Figure 4.

(a) CQ values for groups and task types, with within-group p values shown on top of the bars and the p value between subjects for mean CQ values over three tasks in the title. (b) ANOVA for the CQ values for groups observed as purple bars in (a).(a) Mean CQ values () for groups observed as purple bars in (a). The differences between the control group and both the OCD () and SCZ () groups were statistically significant, while the difference between the OCD and SCZ groups was marginally significant ().
Not such a small-world for psychiatric patients small-world properties small world properties
There are several ways to determine whether a network (or an FCM) exhibits the small-world phenomenon. One approach is to compare subjects’ graph-theoretic metrics to values from random and lattice-type matrices2,63,64. 60 random FCMs with normal distribution were generated, and their graph-theoretic metrics were calculated using the same thresholding method described previously. Similarly, 60 lattice-type FCMs were created using the code () from the Brain Connectivity Toolbox4.
Figure 5 shows the violin charts for the GE, CC, Q, and values at different thresholds and compares them to random and lattice networks. The threshold interval was selected based on the statistics with the highest significance () for selecting the PCA set () and threshold values () of .
| 9 |
For this dataset, the optimal PCA components were and . As predicted, in Fig. 5a, human GE values present a small-world phenomenon, because they fall between the two extreme cases of network topologies, namely the lattice and random networks. As observed, the values of people with OCD and SCZ have values that are closer to random networks, with SCZ being closer to randomness. This pattern also appears in the other three metrics. Figure 5b displays the distribution of CC, Fig. 5c the modularity Q, and finally Fig. 5d the change in the small-worldness index, . All of the graph’s theoretical metrics indicate a statistically significant shift toward randomness in people with OCD and SCZ.
Figure 5.

Violin charts for (a) , (b) , (c) , and (d) . The boxplots are derived for the mean values over the thresholds.
Furthermore, one-way ANOVA tests were conducted to evaluate differences in graph theoretical metrics among the groups. To account for multiple comparisons, Bonferroni correction was applied to the results of the four one-way ANOVA designs, setting the significance level at (0.05/4). Results indicated that (, , ), CC (, , ) and (, , ) values were statistically significant among groups. The Scheffe post hoc analyses revealed that the difference in ( for HC, and for SCZ patients) and values ( for HC, and for SCZ patients) between the control group and SCZ group were statistically significant (). However, other pairwise comparisons of graph theoretical metrics were not significant ().
The boxplots in the center of the violin charts are calculated using the average of the individual charts. We present these boxplots to demonstrate how the medians and standard deviations differ between groups.
Connectivity patterns laterality in connectivity patterns
Connectivity maps were created by averaging all the task-based FCMs after BS &PCA processing for both healthy controls and affected subjects. When the averaged FCMs were computed, the threshold that gave the highest statistical significance for the () was applied to these two matrices to identify the remaining connections. Figure 6a illustrates the final connectivity map (i.e. adjacency matrix) for the controls with an overall , while Fig. 6b, c depict the connectivity patterns, with , and .
Figure 6.

Connectivity maps (a) for healthy controls, and (c) affected subjects and the connectivity strength maps for (b) healthy controls and (d) affected subjects. Mean connectivity maps for (a) HC, (b) OCD and (c) SCZ patients, mean connectivity strength topographs for (d) HC, (e) OCD, and (f) SCZ patients..
Healthy controls and affected subjectspatients with OCD and SCZ use different nodes when performing the Stroop task. Healthy controls used the middle to right prefrontal cortex more frequently, whereas affected subjectspatients with OCD and SCZ used the opposite pattern.employed heavily the left dorsolateral prefrontal cortex.
Another way to display these connectivity maps is by calculating the strength of connections for each node (i.e. the sum of connections from a node using the adjacency matrices). A laterality index can be defined to evaluate the hemispheric dominance of the connections as follows:
| 10 |
where S(i) is the total number of connections from the node, . The indicates right lateralization, and vice versa. The LAT values quantify the brain’s hemispheric dominance. The number of connections from a node can be mapped as a heat map as observed in Fig. 6d for healthy controls, Fig. 6e for OCD patients, and Fig. 6f for SCZ patients. The laterality indices were calculated to be (almost symmetric), for both OCD and SCZ patients (left dominant).
Neuroscientific results
Neuroscientific research seeks to understand the relationship between neurobiology and behavior. Typically, this relationship is assumed to be casual. When biology changes, behavior should follow suit. This trend is typically expressed as a correlation between behavioral outcomes and biological findings, as illustrated in Fig. 7a.
Figure 7.

Correlation of (a) and values, and (b) and values.Correlation of (a) and for all subjects, with the linear fit equation given inside the graph (black fit is for all subjects), (b) and values with the linear fit equation given inside the graph (black fit is for all subjects)..
Speaking purely according to neuropsychiatric research, patients with OCD and SCZ exhibit many symptoms in common. Their behavioral results (minds) also support this claim, as evidenced by the similarity of the CQ values shown in Fig. 4b. However, their brains behave differently, as shown in Fig. 5. The combination of these mind-body features yields far superior performance than either alone. It appears that it may be better to consider behavioral and physiological data together rather than attempting to find a causal explanation for behavioral findings using correlation analysis. The regression between and for subject groups reveals that the slope of the curve turns from positive for HC () to for OCD patients and for SCZ patients with an for all subjects. As mentioned in “Not such a small-world for psychiatric patients small-world properties small world properties ” , the increase in GE is associated with a shift towards randomness. This shift in this value, manifests itself as a loss of cognitive performance for the Stroop task, as evidenced from low values of OCS and SCZ patients observed in Fig. 4b.
Figure 7b shows an interesting but predictable result: higher CC networks have lower GE values. As the CC increases in a network, closer nodes are favored to communicate information, resulting in an increase in the number of shorter paths and lowering the global efficiency value. The slope values were not different among groups, yet there is a negative correlation between the two values
Discussions
Behavioral results
Previous research has yielded conflicting results when investigating various executive tasks in OCD. Some studies have found that OCD subjects make more errors and respond slower in Stroop incongruent trials than control group65,66, while others have found no such differences67,68. Patients with SCZ69,70 and OCD experience cortical neuronal degeneration that correlates with the duration of the disease71,72. In this study, we discovered that individuals with OCD had lower cognitive inhibition than healthy controls. These findings indicate that these impairments may contribute to repetitive symptomatic behaviors associated with OCD, such as compulsion and obsessions.
Neuropsychological assessments revealed disrupted performance associated with frontal lobe functions in both SCZ and OCD, with SCZ showing a more severe deficit. In most cases, SCZ patients suffer more than patients with OCD in terms of executive functions73,74. This suggests a link between the severity of negative symptoms and SCZ. More specifically, subjects with both disorders made more errors and took longer to complete the Stroop incongruent trials than controls. Simultaneously, lack of blood flow also decreases, resulting in cognitive impairments, as depicted in the values shown in Fig. 4a.
Our behavioral results shown in Fig. 4b are consistent with the literature75,76. Specifically, our findings show that patients with SCZ had the poorest performance, while patients with OCD had a less severe but still impaired performance, in contrast to the relatively better performance observed in healthy control subjects.
The current findings show that the Stroop task assessment, which is known for its sensitivity to frontal functioning, found impaired frontal lobe function in both SCZ and OCD, with SCZ showing a more significant impairment. However, one should exercise caution when interpreting this finding because the number of controls () and affected patients () is not equal. Given that the variance was expected to be lower in the healthy control group, this may not be considered a significant statistical concern.
Small-worldness results
Small-worldness is a phenomenon discovered in the anatomical and functional connectivity patterns of human brains1,63. In fact, this has been demonstrated both theoretically and experimentally in several studies77. Several studies have found a shift toward randomness in the functional connectivity networks of patients with SCZ60,78.
Bassett et al. used global efficiency to assess the small-worldness of people with SCZ and healthy controls where they observed that controls. They observed that controls’ GE values lie between random and regular networks in the -band network while SCZ patients have GE values closer to regular matrices. However, this pattern reverses in other EEG bands64. Interestingly, they also discovered a higher GE value at the -band for patients with SCZ. Our results also show that psychiatric patients have higher GE values than controls (See Fig. 5a). This is due to the increased cost of operating the network with more but shorter connections. However, there appears to be a methodological conflict with the cost-efficiency analysis. When a matrix is thresholded with the greatest number of connections, the same cost efficiency (density or sparsity) is found regardless of the actual matrix entries. Similarly, in an fMRI study, Yu et al. discovered evidence that schizophrenics have lower GE than healthy controls79. This finding contradicts our previous findings and the dissociative nature of the disease. In contrast, Sun et al. discovered that fMRI data increased global efficiency, “indicating a tendency toward a more random organization of temporal brain networks”80, which is similar to our finding. Their difference from the literature is attributed partly to the choice of data analysis algorithm and a compensatory effort by the schizophrenic brain. In a resting fMRI study, Li et al. found higher GE and values for OCD patients compared to healthy controls18. Similarly, several studies have shown that GE from resting-state fMRI functional connectivity maps is higher than in healthy controls6,80.
Hence, there is strong evidence that the neuroimaging method chosen, the preprocessing steps, and the algorithm used to compute the small-world features all have an impact on the findings and their interpretation. We propose an algorithm that avoids the pitfalls of previous studies by claiming that (1) there is an inherent background connectivity obscuring the cognition-related topology and it needs to be removed in advance, (2) further cleaning of the connectivity matrices is required to lower the variability; thus, PCA should be preferred, (3) thresholding should be performed by keeping a certain number of the highest values for an individual matrix to ensure the same sparsity for each matrix. Once all of these steps have been completed, we can begin computing the small-world features and determining their statistical significance.
These findings add to the previously known characteristics of people suffering from such diseases. It is well-documented that patients with these diseases exhibit dissociative symptoms in their daily lives. This study sheds light on the impairments in these patients’ functional connectivity patterns, allowing us to determine the cause of these dissociative behavioral symptoms. The increase in GE values compared to healthy controls, as well as the decrease in CC and Q, all indicate somewhat random (or chaotic) brain patterns. Future studies can use this analysis pipeline to develop biomarkers (or neuromarkers) that can better quantify the severity of functional connectivity pattern impairments.
Connectivity patterns laterality in connectivity patterns
Laterality is a measurement of hemispheric symmetry. We discovered a higher left-sided dominance of psychiatric patients than healthy controls. Both patient groups relied on node 3 as a hub of decision making, while HC employed node 14 on the right dorsolateral PFC for the same task. Similar results were obtained with fNIRS analysis, which revealed a left dominance for the Stroop Task in OCD and SCZ patients.35,81,82.
Neuroscientific results
According to neuropsychiatric research, patients with OCD and SCZ exhibit many symptoms in common. Their behavioral results (minds) support this claim, as evidenced by the similarity of the CQ values shown in Fig. 4b. However, their brains behave differently, as shown in Fig. 5. The combination of these mind-body features yields far superior performance than either alone. It appears that it may be better to consider behavioral and physiological data together rather than attempting to find a causal explanation for behavioral findings using correlation analysis.
No single neuropathological marker has been identified for either SCZ or OCD. The relationship between the neuroanatomical and neuropsychological mechanisms underlying SCZ and OCD is complex. Although both disorders exhibit frontal lobe pathology, functional neuroimaging studies typically show prefrontal hypoactivity in SCZ83 and increased activity in the prefrontal cortex in OCD84. Hence, it appears logical that in the search for sensitive features, markers focusing on frontal brain regions should be investigated. Furthermore, collecting fNIRS data from the prefrontal cortex is an important and precise method for distinguishing between these disorders. It is essential to acknowledge that although frontal lobe pathology is common to both SCZ and OCD, the underlying neural circuits may involve different structures and neurotransmitter systems. For example, in SCZ, hypofrontality may be associated with a dopaminergic deficit in the frontal cortex5, whereas OCD is primarily associated with serotonergic dysregulation in the orbitofrontal cortex84,85. Given that the Stroop task has been shown to elicit activations in the dorsolateral prefrontal cortex and anterior cingulate38,86–89, it may provide useful insights but might not be sufficient for a comprehensive understanding of the differences in frontal lobe pathology in these disorders.
Figure 7b demonstrates a small-world phenomenon, with higher CC networks having lower GE values. Hence, there appears to be a trade-off between CC and GE for a network to communicate efficiently, as evidenced by the lower GE and higher CC values of healthy controls compared to those of people suffering from OCD and SCZ, as shown in Fig. 7b. It might be appropriate to refer to global efficiency as global cost because it is a measure of the extensive effort required to communicate information over longer distances.
Limitations of the study
fNIRS signals contain a wealth of information, of which only a small portion was used in this study. Temporal features of these signals (e.g. mean, amplitude variations, temporal delays) were not used in the study. These temporal and local values extracted from single channels are known to be closely related to the neurobiology and neurovascular dynamics of the task at hand, as long as these signals are free of contamination from surface fluctuations or other task-unrelated systemic fluctuations. A large body of research has focused on this “cleaning” operation to achieve task-related dynamics. Due to a lack of agreement on the best signal processing pipeline for this problem, this paper concentrated more on overall collective dynamics rather than single channel changes. Therefore, further studies must include these single-channel features to improve the clinical decision-making process, as in90–92.
To extract meaningful features from a complex dataset, a pipeline of data manipulation steps is required. There are two methods for determining this optimal pipeline: (1) exhaustive search (data-driven) and (2) model-based (hypothesis-driven). In this study, we chose the second approach. This method also necessitates a basic understanding of the model under investigation (i.e. how the brain works). There could be alternatives to the assumptions made in this paper. For example, in our previous paper44, no background subtraction was performed because the PCA-based approach was assumed to eliminate all background task-unrelated connectivity topologies.
Conclusion
A pipeline for data processing from the fNIRS modality is proposed to demonstrate that people with OCD and SCZ exhibit small-world characteristics similar to random networks. We used a back-subtraction method to eliminate the common network topology, which allowed us to better understand this shift toward randomness. The typical characteristics of small-worldness (GE, CC, Q, and ) indicated that the connectivity patterns of these patients were similar to random networks. This means that running the same operation as healthy controls costs more, as evidenced by higher GE values and lower CC values. To our knowledge, this is the first study to use the fNIRS modality to compare the small-world features of people with OCD and SCZ and how they are similar to random networks.
Acknowledgements
This project was sponsored by a grant from TUBITAK Project No: 108S101 and Bogazici University Research Fund (BURF Project No: 5106). The authors wish to thank Deniz Nevsehirli for his contributions to fNIRS optode development, Dr. Nermin Topaloĝu and Dr. Sinem Burcu Erdoĝan for data collection. We acknowledge the collaboration of Dr. Hasan Herken, Gülfizar Varna and in patient recruitment, hypothesis generation, and discussion of the findings.
Author contributions
A.A. directed the project, performed data analysis and wrote the main manuscript, E.Y. helped in methodology, contributed to the introduction and discussion parts, O.C.O. & B.S. helped in methodology, data curation and contributed to the introduction and discussion parts, C.E.K. & E.E.K. helped in methodology, data curation and analysis. contributed to discussion part, S.N.D. helped in methodology, data curation and contributed to the introduction part, G.Y. helped in methodology, data curation and contributed to the introduction, results and discussion parts, and S.B.E. helped in methodology, data curation and contributed to the main manuscript.
Data availability
The datasets used and/or analysed and the MATLAB codes created during the current study available from the corresponding author on reasonable request.
Competing interests
The authors declare no competing interests.
Footnotes
Publisher's note
Springer Nature remains neutral with regard to jurisdictional claims in published maps and institutional affiliations.
These authors contributed equally: Ozan Cem Öztürk, Bernis Sütçübaşı, Ceyhun Kırımlı and Elçim Elgün Kırımlı.
References
- 1.Bassett, D. S. & Bullmore, E. Small-world brain networks. Neuroscientist12, 512–23. 10.1177/1073858406293182 (2006). [DOI] [PubMed] [Google Scholar]
- 2.Achard, S. & Bullmore, E. T. Efficiency and cost of economical brain functional networks. PLoS Comput. Biol.3, 174–183. 10.1371/journal.pcbi.0030017 (2007). [DOI] [PMC free article] [PubMed] [Google Scholar]
- 3.Bullmore, E. & Sporns, O. Complex brain networks: Graph theoretical analysis of structural and functional systems. Nat. Rev. Neurosci.10, 186–198. 10.1038/nrn2575 (2009). [DOI] [PubMed] [Google Scholar]
- 4.Rubinov, M. & Sporns, O. Complex network measures of brain connectivity: Uses and interpretations. Neuroimage52, 1059–1069 (2010). [DOI] [PubMed] [Google Scholar]
- 5.Andreasen, N. C. et al. Defining the phenotype of schizophrenia: Cognitive dysmetria and its neural mechanisms. Biol. Psychiatry46, 908–920 (1999). [DOI] [PubMed] [Google Scholar]
- 6.Yu, M. et al. Convergence and divergence of brain network dysfunction in deficit and non-deficit schizophrenia. Schizophr. Bull.43, 1315–1328. 10.1093/schbul/sbx014 (2017). [DOI] [PMC free article] [PubMed] [Google Scholar]
- 7.Deuker, L. et al. Reproducibility of graph metrics of human brain functional networks. Neuroimage47, 1460–1468. 10.1016/j.neuroimage.2009.05.035 (2009). [DOI] [PubMed] [Google Scholar]
- 8.Klados, M. A. et al. A graph theoretical approach to study the organization of the cortical networks during different mathematical tasks. PLoS One8, e71800. 10.1371/journal.pone.0071800 (2013). [DOI] [PMC free article] [PubMed] [Google Scholar]
- 9.Niu, H. et al. Test-retest reliability of graph metrics in functional brain networks: A resting-state FNIRS study. PLoS One8, e72425. 10.1371/journal.pone.0072425 (2013). [DOI] [PMC free article] [PubMed] [Google Scholar]
- 10.Akin, A. Partial correlation-based functional connectivity analysis for functional near-infrared spectroscopy signals. J. Biomed. Opt.22, 1–10. 10.1117/1.JBO.22.12.126003 (2017). [DOI] [PubMed] [Google Scholar]
- 11.Palva, S., Monto, S. & Palva, J. M. Graph properties of synchronized cortical networks during visual working memory maintenance. Neuroimage49, 3257–3268. 10.1016/j.neuroimage.2009.11.031 (2010). [DOI] [PubMed] [Google Scholar]
- 12.Adolphs, R. Cognitive neuroscience of human social behaviour. Nat. Rev. Neurosci.4, 165–178. 10.1038/nrn1056 (2003). [DOI] [PubMed] [Google Scholar]
- 13.Adolphs, R. Investigating the cognitive neuroscience of social behavior. Neuropsychologia41, 119–126 (2003). [DOI] [PubMed] [Google Scholar]
- 14.Adolphs, R. The social brain: Neural basis of social knowledge. Annu. Rev. Psychol.60, 693–716. 10.1146/annurev.psych.60.110707.163514 (2009). [DOI] [PMC free article] [PubMed] [Google Scholar]
- 15.Gao, Z. et al. The whole-brain connectome landscape in patients with schizophrenia: A systematic review and meta-analysis of graph theoretical characteristics. Neurosci. Biobehav. Rev.148, 105144. 10.1016/j.neubiorev.2023.105144 (2023). [DOI] [PubMed] [Google Scholar]
- 16.Thorsen, A. L. et al. Effects of Bergen 4-day treatment on resting-state graph features in obsessive-compulsive disorder. Biol. Psychiatry Cogn. Neurosci. Neuroimaging6, 973–982. 10.1016/j.bpsc.2020.01.007 (2021). [DOI] [PubMed] [Google Scholar]
- 17.Li, X. et al. Characterizing multiscale modular structures in medication-free obsessive-compulsive disorder patients with no comorbidity. Hum. Brain Mapp.43, 2391–2399. 10.1002/hbm.25794 (2022). [DOI] [PMC free article] [PubMed] [Google Scholar]
- 18.Li, X. et al. Application of graph theory across multiple frequency bands in drug-naïve obsessive-compulsive disorder with no comorbidity. J. Psychiatr. Res.150, 272–278. 10.1016/j.jpsychires.2022.03.041 (2022). [DOI] [PubMed] [Google Scholar]
- 19.Anticevic, A. et al. Global resting-state functional magnetic resonance imaging analysis identifies frontal cortex, striatal, and cerebellar dysconnectivity in obsessive-compulsive disorder. Biol. Psychiatry75, 595–605. 10.1016/j.biopsych.2013.10.021 (2014). [DOI] [PMC free article] [PubMed] [Google Scholar]
- 20.Gonçalves, Ó. F. et al. Patterns of default mode network deactivation in obsessive compulsive disorder. Sci. Rep.7, 44468. 10.1038/srep44468 (2017). [DOI] [PMC free article] [PubMed] [Google Scholar]
- 21.Lillevik Thorsen, A. et al. Stable inhibition-related inferior frontal hypoactivation and fronto-limbic hyperconnectivity in obsessive-compulsive disorder after concentrated exposure therapy. Neuroimage Clin.28, 102460. 10.1016/j.nicl.2020.102460 (2020). [DOI] [PMC free article] [PubMed] [Google Scholar]
- 22.Ehlis, A.-C., Schneider, S., Dresler, T. & Fallgatter, A. J. Application of functional near-infrared spectroscopy in psychiatry. Neuroimage85, 478–488 (2014). [DOI] [PubMed] [Google Scholar]
- 23.Azechi, M. et al. Discriminant analysis in schizophrenia and healthy subjects using prefrontal activation during frontal lobe tasks: A near-infrared spectroscopy. Schizophr. Res.117, 52–60. 10.1016/j.schres.2009.10.003 (2010). [DOI] [PubMed] [Google Scholar]
- 24.Song, H. et al. Automatic schizophrenic discrimination on FNIRS by using complex brain network analysis and SVM. BMC Med. Inform. Decis. Mak.17, 166. 10.1186/s12911-017-0559-5 (2017). [DOI] [PMC free article] [PubMed] [Google Scholar]
- 25.Hazari, N., Narayanaswamy, J. C. & Venkatasubramanian, G. Neuroimaging findings in obsessive-compulsive disorder: A narrative review to elucidate neurobiological underpinnings. Indian J. Psychiatry61, S9–S29. 10.4103/psychiatry.IndianJPsychiatry_525_18 (2019). [DOI] [PMC free article] [PubMed]
- 26.Fajnerova, I. et al. Functional connectivity changes in obsessive-compulsive disorder correspond to interference control and obsessions severity. Front. Neurol.11, 568. 10.3389/fneur.2020.00568 (2020). [DOI] [PMC free article] [PubMed] [Google Scholar]
- 27.Akgul, C. B., Akin, A. & Sankur, B. Extraction of cognitive activity-related waveforms from functional near-infrared spectroscopy signals. Med. Biol. Eng. Comput.44, 945–958. 10.1007/s11517-006-0116-3 (2006). [DOI] [PubMed] [Google Scholar]
- 28.Akin, Ata et al. Cerebrovascular dynamics in patients with migraine: Near-infrared spectroscopy study. Neurosci. Lett.400, 86–91. 10.1016/j.neulet.2006.02.016 (2006). [DOI] [PubMed] [Google Scholar]
- 29.Ciftçi, K., Sankur, B., Kahya, Y. P. & Akin, A. Multilevel statistical inference from functional near-infrared spectroscopy data during Stroop interference. IEEE Trans. Biomed. Eng.55, 2212–20. 10.1109/TBME.2008.923918 (2008). [DOI] [PubMed] [Google Scholar]
- 30.Dadgostar, M., Setarehdan, S. K., Shahzadi, S. & Akin, A. Functional connectivity of the PFC via partial correlation. Optik-Int. J. Light Electron Opt.127, 4748–4754 (2016). [Google Scholar]
- 31.Dalmis, M. U. & Akin, A. Similarity analysis of functional connectivity with functional near-infrared spectroscopy. J. Biomed. Opt.20, 86012. 10.1117/1.JBO.20.8.086012 (2015). [DOI] [PubMed] [Google Scholar]
- 32.Einalou, Z., Maghooli, K., Setarehdan, S. K. & Akin, A. Functional near infrared spectroscopy for functional connectivity during Stroop test via mutual information. Adv. Biores.6, 62–67 (2015). [Google Scholar]
- 33.Einalou, Z., Maghooli, K., Setarehdan, S. K. & Akin, A. Effective channels in classification and functional connectivity pattern of prefrontal cortex by functional near infrared spectroscopy signals. Optik-Int. J. Light Electron Opt.127, 3271–3275 (2016). [Google Scholar]
- 34.Einalou, Z., Maghooli, K., Setarehdan, S. K. & Akin, A. Graph theoretical approach to functional connectivity in prefrontal cortex via FNIRS. Neurophotonics4, 041407. 10.1117/1.NPh.4.4.041407 (2017). [DOI] [PMC free article] [PubMed] [Google Scholar]
- 35.Koray Ciftci, Bulent Sankur, Yasemin P Kahya & Ata Akin. Multilevel statistical inference from functional near-infrared spectroscopy data during stroop interference. IEEE Trans Biomed Eng55, 2212–2220, 10.1109/TBME.2008.923918 (2008). [DOI] [PubMed]
- 36.Sergul Aydore, M., Mihcak, K., Ciftci, K. & Akin, A. On temporal connectivity of PFC via Gauss–Markov modeling of FNIRS signals. IEEE Trans. Biomed. Eng.57, 761–768. 10.1109/TBME.2009.2020792 (2010). [DOI] [PubMed] [Google Scholar]
- 37.Erdoğan, S. B. & Yükselen, G. Four-class classification of neuropsychiatric disorders by use of functional near-infrared spectroscopy derived biomarkers. Sensors22, 5407 (2022). [DOI] [PMC free article] [PubMed] [Google Scholar]
- 38.Zysset, S., Müller, K., Lohmann, G. & von Cramon, D. Y. Color-word matching Stroop task: Separating interference and response conflict. Neuroimage13, 29–36. 10.1006/nimg.2000.0665 (2001). [DOI] [PubMed] [Google Scholar]
- 39.Townsend, J. T. & Ashby, F. G. Stochastic Modeling of Elementary Psychological Processes (CUP Archive, 1983).
- 40.Woltz, D. J. & Was, C. A. Availability of related long-term memory during and after attention focus in working memory. Mem. Cognit.34, 668–84. 10.3758/bf03193587 (2006). [DOI] [PubMed] [Google Scholar]
- 41.Aydöre, S., Mihçak, M. K., Çiftçi, K. & Akın, A. On temporal connectivity of PFC via Gauss–Markov modeling of fNIRS signals. IEEE Trans. Biomed. Eng.57, 761–768 (2010). [DOI] [PubMed] [Google Scholar]
- 42.Erdogan, S. B., Yücel, M. A. & Akın, A. Analysis of task-evoked systemic interference in fNIRS measurements: Insights from fMRI. Neuroimage87, 490–504. 10.1016/j.neuroimage.2013.10.024 (2014). [DOI] [PubMed] [Google Scholar]
- 43.Einalou, Z., Maghooli, K., Setarehdan, S. K. & Akin, A. Functional near infrared spectroscopy to investigation of functional connectivity in schizophrenia using partial correlation. Univ. J. Biomed. Eng.2, 5–8 (2014). [Google Scholar]
- 44.Akin, A. FNIRS-derived neurocognitive ratio as a biomarker for neuropsychiatric diseases. Neurophotonics[SPACE]10.1117/1.NPh.8.3.035008 (2021). [DOI] [PMC free article] [PubMed] [Google Scholar]
- 45.Piccardi, M. Background subtraction techniques: A review. In 2004 IEEE International Conference on Systems, Man and Cybernetics (IEEE Cat. No. 04CH37583). Vol. 4. 3099–3104 (IEEE, 2004).
- 46.Oliver, N. M., Rosario, B. & Pentland, A. P. A Bayesian computer vision system for modeling human interactions. IEEE Trans. Pattern Anal. Mach. Intell.22, 831–843 (2000). [Google Scholar]
- 47.Elgammal, A., Harwood, D. & Davis, L. Non-parametric model for background subtraction. In European Conference on Computer Vision. 751–767 (Springer, 2000).
- 48.Horprasert, T., Harwood, D. & Davis, L. S. A statistical approach for real-time robust background subtraction and shadow detection. In IEEE ICCV. Vol. 99. 1–19 (Citeseer, 1999).
- 49.Raichle, M. E. et al. A default mode of brain function. Proc. Natl. Acad. Sci. USA98, 676–682 (2001). [DOI] [PMC free article] [PubMed] [Google Scholar]
- 50.Ralchle, M. E. & Snyder, A. Z. A default mode of brain function: A brief history of an evolving idea. Neuroimage37, 1083–1090. 10.1016/j.neuroimage.2007.02.041 (2007). [DOI] [PubMed] [Google Scholar]
- 51.Fox, M. D. et al. The human brain is intrinsically organized into dynamic, anticorrelated functional networks. Proc. Natl. Acad. Sci. USA102, 9673–9678. 10.1073/pnas.0504136102 (2005). [DOI] [PMC free article] [PubMed] [Google Scholar]
- 52.Hofman, M. A. Evolution of the human brain: When bigger is better. Front. Neuroanat.8, 15. 10.3389/fnana.2014.00015 (2014). [DOI] [PMC free article] [PubMed] [Google Scholar]
- 53.Hofman, M. A. Design principles of the human brain: An evolutionary perspective. Prog. Brain Res.195, 373–90. 10.1016/B978-0-444-53860-4.00018-0 (2012). [DOI] [PubMed] [Google Scholar]
- 54.Yeo, B. T. T. et al. The organization of the human cerebral cortex estimated by intrinsic functional connectivity. J. Neurophysiol.106, 1125–65. 10.1152/jn.00338.2011 (2011). [DOI] [PMC free article] [PubMed] [Google Scholar]
- 55.Nandi, D. et al. Principal component analysis in medical image processing: A study. Int. J. Image Min.1, 65–86 (2015). [Google Scholar]
- 56.Rodarmel, C. & Shan, J. Principal component analysis for hyperspectral image classification. Surv. Land Inf. Sci.62, 115–122 (2002). [Google Scholar]
- 57.Xia, Y., Wen, L., Eberl, S., Fulham, M. & Feng, D. Genetic algorithm-based PCA eigenvector selection and weighting for automated identification of dementia using FDG-pet imaging. Annu. Int. Conf. IEEE Eng. Med. Biol. Soc.4812–5, 2008. 10.1109/IEMBS.2008.4650290 (2008). [DOI] [PubMed] [Google Scholar]
- 58.Wang, M., Yuan, Z. & Niu, H. Reliability evaluation on weighted graph metrics of FNIRS brain networks. Quant. Imaging Med. Surg.9, 832–841 10.21037/qims.2019.05.08 (2019). [DOI] [PMC free article] [PubMed]
- 59.Drakesmith, M. et al. Overcoming the effects of false positives and threshold bias in graph theoretical analyses of neuroimaging data. Neuroimage118, 313–33. 10.1016/j.neuroimage.2015.05.011 (2015). [DOI] [PMC free article] [PubMed] [Google Scholar]
- 60.Alexander-Bloch, A. F. et al. Disrupted modularity and local connectivity of brain functional networks in childhood-onset schizophrenia. Front. Syst. Neurosci.4, 147. 10.3389/fnsys.2010.00147 (2010). [DOI] [PMC free article] [PubMed] [Google Scholar]
- 61.He, Y. & Evans, A. Graph theoretical modeling of brain connectivity. Curr. Opin. Neurol.23, 341–350. 10.1097/WCO.0b013e32833aa567 (2010). [DOI] [PubMed] [Google Scholar]
- 62.Skidmore, F. et al. Connectivity brain networks based on wavelet correlation analysis in Parkinson fMRI data. Neurosci. Lett.499, 47–51. 10.1016/j.neulet.2011.05.030 (2011). [DOI] [PubMed] [Google Scholar]
- 63.Bassett, D. S. & Bullmore, E. T. Small-world brain networks revisited. Neuroscientist23, 499–516. 10.1177/1073858416667720 (2017). [DOI] [PMC free article] [PubMed] [Google Scholar]
- 64.Bassett, D. S. et al. Cognitive fitness of cost-efficient brain functional networks. Proc. Natl. Acad. Sci. USA106, 11747–52. 10.1073/pnas.0903641106 (2009). [DOI] [PMC free article] [PubMed] [Google Scholar]
- 65.Hartston, H. J. & Swerdlow, N. R. Visuospatial priming and Stroop performance in patients with obsessive compulsive disorder. Neuropsychology13, 447–57. 10.1037/0894-4105.13.3.447 (1999). [DOI] [PubMed] [Google Scholar]
- 66.Martinot, J. et al. Obsessive-compulsive disorder: A clinical, neuropsychological and positron emission tomography study. Acta Psychiatr. Scand.82, 233–242 (1990). [DOI] [PubMed] [Google Scholar]
- 67.Hollander, E. et al. A pilot study of the neuropsychology of obsessive-compulsive disorder and Parkinson’s disease: Basal ganglia disorders. J. Neuropsychiatry Clin. Neurosci.5, 104–7. 10.1176/jnp.5.1.104 (1993). [DOI] [PubMed] [Google Scholar]
- 68.Schmidtke, K., Schorb, A., Winkelmann, G. & Hohagen, F. Cognitive frontal lobe dysfunction in obsessive-compulsive disorder. Biol. Psychiatry43, 666–73. 10.1016/s0006-3223(97)00355-7 (1998). [DOI] [PubMed] [Google Scholar]
- 69.Lieberman, J. A. Is schizophrenia a neurodegenerative disorder? A clinical and neurobiological perspective. Biol. Psychiatry46, 729–39. 10.1016/s0006-3223(99)00147-x (1999). [DOI] [PubMed] [Google Scholar]
- 70.Pérez-Neri, I., Ramírez-Bermúdez, J., Montes, S. & Ríos, C. Possible mechanisms of neurodegeneration in schizophrenia. Neurochem. Res.31, 1279–94. 10.1007/s11064-006-9162-3 (2006). [DOI] [PubMed] [Google Scholar]
- 71.Cummings, J. L. Toward a molecular neuropsychiatry of neurodegenerative diseases. Ann. Neurol.54, 147–154 (2003). [DOI] [PubMed] [Google Scholar]
- 72.Graybiel, A. M. & Rauch, S. L. Toward a neurobiology of obsessive-compulsive disorder. Neuron28, 343–347 (2000). [DOI] [PubMed] [Google Scholar]
- 73.Tükel, R. et al. Neuropsychological function in obsessive-compulsive disorder. Comprehens. Psychiatry53, 167–175 (2012). [DOI] [PubMed] [Google Scholar]
- 74.Whitney, K. A., Fastenau, P. S., Evans, J. D. & Lysaker, P. H. Comparative neuropsychological function in obsessive-compulsive disorder and schizophrenia with and without obsessive-compulsive symptoms. Schizophrenia Res.69, 75–83 (2004). [DOI] [PubMed] [Google Scholar]
- 75.Moritz, S. et al. Executive functioning in obsessive-compulsive disorder, unipolar depression, and schizophrenia. Arch. Clin. Neuropsychol.17, 477–483 (2002). [PubMed] [Google Scholar]
- 76.Chan, R. C., Shum, D., Toulopoulou, T. & Chen, E. Y. Assessment of executive functions: Review of instruments and identification of critical issues. Arch. Clin. Neuropsychol.23, 201–216 (2008). [DOI] [PubMed] [Google Scholar]
- 77.Park, C.-H., Kim, S. Y., Kim, Y.-H. & Kim, K. Comparison of the small-world topology between anatomical and functional connectivity in the human brain. Phys. A Stat. Mech. Appl.387, 5958–5962 (2008). [Google Scholar]
- 78.Kambeitz, J. et al. Aberrant functional whole-brain network architecture in patients with schizophrenia: A meta-analysis. Schizophr Bull42(Suppl 1), S13-21. 10.1093/schbul/sbv174 (2016). [DOI] [PMC free article] [PubMed] [Google Scholar]
- 79.Yu, Q. et al. Altered small-world brain networks in temporal lobe in patients with schizophrenia performing an auditory oddball task. Front. Syst. Neurosci.5, 7. 10.3389/fnsys.2011.00007 (2011). [DOI] [PMC free article] [PubMed] [Google Scholar]
- 80.Sun, Y., Collinson, S. L., Suckling, J. & Sim, K. Dynamic reorganization of functional connectivity reveals abnormal temporal efficiency in schizophrenia. Schizophr. Bull.45, 659–669. 10.1093/schbul/sby077 (2019). [DOI] [PMC free article] [PubMed] [Google Scholar]
- 81.Aleksandrowicz, A. et al. Frontal brain activity in individuals at risk for schizophrenic psychosis and bipolar disorder during the emotional Stroop task—An FNIRS study. Neuroimage Clin.26, 102232. 10.1016/j.nicl.2020.102232 (2020). [DOI] [PMC free article] [PubMed] [Google Scholar]
- 82.Ehlis, A.-C., Herrmann, M. J., Wagener, A. & Fallgatter, A. J. Multi-channel near-infrared spectroscopy detects specific inferior-frontal activation during incongruent Stroop trials. Biol. Psychol.69, 315–331. 10.1016/j.biopsycho.2004.09.003 (2005). [DOI] [PubMed] [Google Scholar]
- 83.Hazlett, E. A. et al. Hypofrontality in unmedicated schizophrenia patients studied with pet during performance of a serial verbal learning task. Schizophr. Res.43, 33–46. 10.1016/s0920-9964(99)00178-4 (2000). [DOI] [PubMed] [Google Scholar]
- 84.Machlin, S. R. et al. Elevated medial-frontal cerebral blood flow in obsessive-compulsive patients: A spect study. Am. J. Psychiatry148, 1240–2. 10.1176/ajp.148.9.1240 (1991). [DOI] [PubMed] [Google Scholar]
- 85.Saxena, S. & Rauch, S. L. Functional neuroimaging and the neuroanatomy of obsessive-compulsive disorder. Psychiatr. Clin. N. Am.23, 563–86. 10.1016/s0193-953x(05)70181-7 (2000). [DOI] [PubMed] [Google Scholar]
- 86.Scarpina, F. & Tagini, S. The Stroop color and word test. Front. Psychol.8, 557 (2017). [DOI] [PMC free article] [PubMed] [Google Scholar]
- 87.Schroeter, M. L., Zysset, S., Wahl, M. & von Cramon, D. Y. Prefrontal activation due to Stroop interference increases during development-an event-related fNIRS study. Neuroimage23, 1317–1325. 10.1016/j.neuroimage.2004.08.001 (2004). [DOI] [PubMed] [Google Scholar]
- 88.Silton, R. L. et al. The time course of activity in dorsolateral prefrontal cortex and anterior cingulate cortex during top-down attentional control. NeuroImage50, 1292–1302. 10.1016/j.neuroimage.2009.12.061 (2010). [DOI] [PMC free article] [PubMed] [Google Scholar]
- 89.Zhang, L., Sun, J., Sun, B., Luo, Q. & Gong, H. Studying hemispheric lateralization during a stroop task through near-infrared spectroscopy-based connectivity. J. Biomed. Opt.19, 57012. 10.1117/1.JBO.19.5.057012 (2014). [DOI] [PubMed] [Google Scholar]
- 90.Huang, W. et al. A graph signal processing perspective on functional brain imaging. Proc. IEEE106, 868–885 (2018). [Google Scholar]
- 91.Ménoret, M., Farrugia, N., Pasdeloup, B. & Gripon, V. Evaluating graph signal processing for neuroimaging through classification and dimensionality reduction. In 2017 IEEE Global Conference on Signal and Information Processing (GlobalSIP). 618–622 (IEEE, 2017).
- 92.Ortega, A., Frossard, P., Kovačević, J., Moura, J. M. & Vandergheynst, P. Graph signal processing: Overview, challenges, and applications. Proc. IEEE106, 808–828 (2018). [Google Scholar]
Associated Data
This section collects any data citations, data availability statements, or supplementary materials included in this article.
Data Availability Statement
The datasets used and/or analysed and the MATLAB codes created during the current study available from the corresponding author on reasonable request.