

Abstract
There is increasing interest in the pathophysiological role of arginine metabolism in schizophrenia, particularly in relation to the modulation of the endogenous messenger nitric oxide (NO). The assessment of specific arginine metabolites that, unlike NO, are stable can provide useful insights into NO regulatory enzymes such as isoform 1 of dimethylarginine dimethylaminohydrolase (DDAH1) and arginase. We investigated the role of arginine metabolomics in schizophrenia by conducting a systematic review and meta-analysis of the circulating concentrations of arginine metabolites associated with DDAH1, arginase, and NO synthesis [arginine, citrulline, asymmetric dimethylarginine (ADMA), symmetric dimethylarginine (SDMA), dimethylamine, and ornithine] in this patient group. We searched PubMed, Scopus, and Web of Science from inception to the 31st of May 2023 for studies investigating arginine metabolites in patients with schizophrenia and healthy controls. The JBI Critical Appraisal Checklist for analytical studies and GRADE were used to assess the risk of bias and the certainty of evidence, respectively (PROSPERO registration number: CRD42023433000). Twenty-one studies were identified for analysis. There were no significant between-group differences in arginine, citrulline, and SDMA. By contrast, patients with schizophrenia had significantly higher ADMA (DDAH1 substrate, standard mean difference, SMD = 1.23, 95% CI 0.86–1.61, p < 0.001; moderate certainty of evidence), dimethylamine (DDAH1 product, SMD = 0.47, 95% CI 0.24–0.70, p < 0.001; very low certainty of evidence), and ornithine concentrations (arginase product, SMD = 0.32, 95% CI 0.16–0.49, p < 0.001; low certainty of evidence). In subgroup analysis, the pooled SMD for ornithine was significantly different in studies of untreated, but not treated, patients. Our study suggests that DDAH1 and arginase are dysregulated in schizophrenia. Further studies are warranted to investigate the expression/activity of these enzymes in the brain of patients with schizophrenia and the effects of targeted treatments.
Subject terms: Schizophrenia, Diagnostic markers
Introduction
Significant advances have been made over the last 50 years in identifying the biochemical and metabolic pathways involved in the onset and the progression of schizophrenia. Specific alterations in schizophrenia affect dopamine, glutamate, and the cholinergic, serotonergic, and the γ-aminobutyric acid systems [1, 2]. However, despite the increasing availability of safe and effective antipsychotic drugs targeting these pathways, a significant proportion of patients with schizophrenia are resistant to treatment. Treatment resistance reduces the quality of life and imposes a significant financial and public health burden in this group [3]. The frequent occurrence of treatment resistance also suggests that the pathophysiology of schizophrenia is not fully understood, which warrants the identification of novel druggable targets and therapies [4–6].
In the ongoing quest for druggable targets in schizophrenia, increasing attention has been given to nitric oxide (NO). This endogenous messenger is synthetised by the three isoforms of NO synthase (endothelial, eNOS, neuronal, nNOS, and inducible, iNOS; Fig. 1) [7–10]. Whilst NO has been initially investigated in the pathophysiology of atherosclerosis and cardiovascular disease [11], a significant body of research over the last 30 years has shown that NO also modulates critical homeostatic processes within the central nervous system. Such processes include synaptic activity, neural plasticity, and neuronal survival and differentiation [12, 13]. In the context of schizophrenia, NO has been shown to interact with glutamate receptors as well as dopaminergic and serotonergic pathways [14–16]. Although uncertainty exists regarding the role of dysregulated NO synthesis in schizophrenia [17], post-mortem investigations have reported a reduction in nitrergic neurons, nNOS-containing neurons, and NOS activity in the brain of schizophrenic patients [18–21]. Furthermore, studies have reported reduced circulating concentrations of the NO metabolites nitrite and nitrate in patients with schizophrenia compared to healthy controls [22, 23]. These studies support the proposition that measuring circulating NO metabolites can be used as an indicator of NO synthesis in the central nervous system. However, analytical issues and the potential influence of dietary factors have curtailed the routine assessment of nitrite and nitrate in clinical research and patient care [24, 25].
Fig. 1. Relevant arginine metabolic pathways.
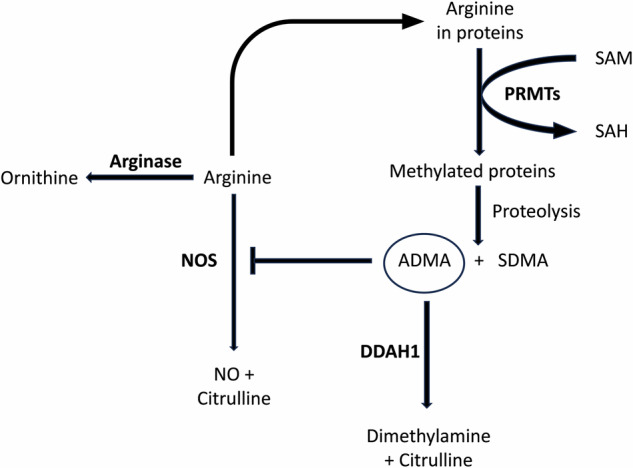
SAM S-Adenosyl methionine; S-Adenosyl homocysteine, PRMTs protein arginine methyltransferases, ADMA asymmetric dimethylarginine, SDMA symmetric dimethylarginine, DDAH1 isoform 1 of dimethylarginine dimethylaminohydrolase, NOS nitric oxide synthase.
Additional methodological issues associated with the direct measurement of NO and derived oxidants in biological matrices have prompted the search for alternative circulating biomarkers of NO synthesis [26, 27]. These studies have led to the identification of specific substrates or products of enzymes involved in the regulation of NO synthesis, particularly isoform 1 of dimethylarginine dimethylaminohydrolase (DDAH1) and arginase. DDAH1, unlike isoform 2 (DDAH2), catalyses the conversion of asymmetric dimethylarginine (ADMA), a potent endogenous inhibitor of the three NOS isoforms, into citrulline and dimethylamine (Fig. 1) [28–31]. On the other hand, the two isoforms of arginase, arginase 1 and 2, catalyse the biotransformation of arginine, also a NOS substrate, into ornithine and urea (Fig. 1) [32]. Notably, both DDAH1 and arginase are expressed in various organs and systems, including the brain [28, 32–34]. Therefore, specific arginine metabolites might be useful in assessing dysregulated NO synthesis in schizophrenia resulting from diminished DDAH1 activity (i.e., increased ADMA concentrations and reduced citrulline and dimethylamine concentrations) and/or increased arginase activity (i.e., reduced arginine concentrations and increased ornithine concentrations). We sought to address this issue by conducting a systematic review and meta-analysis of arginine, citrulline, ADMA, dimethylamine, ornithine, and symmetric dimethylarginine (SDMA), another methylated arginine shown to indirectly inhibit NO synthesis [35], in patients with schizophrenia and healthy controls.
Materials and methods
Search strategy, eligibility criteria, and study selection
We conducted a systematic literature search in the electronic databases PubMed, Web of Science, and Scopus, from inception to the 31st of May 2023, using the following terms and their combination: “schizophrenia” OR “acute psychotic disorder” OR “schizoaffective disorder” AND “arginine” OR “asymmetric dimethylarginine” OR “ADMA” OR “symmetric dimethylarginine” OR “SDMA” OR “dimethylamine” OR “citrulline” OR “ornithine”. Individual abstracts were independently screened by two investigators. If relevant, the two investigators independently reviewed the full articles. Eligibility criteria included: (i) the assessment of arginine and/or ADMA and/or SDMA and/or dimethylamine and/or citrulline and/or ornithine in the plasma or serum of patients with schizophrenia and healthy controls (case-control design), (ii) the inclusion of participants ≥18 years, (iii) the use of English language, and (iv) the availability of full-text. The references of individual articles were also searched for additional studies. Any disagreement between the reviewers was resolved by a third investigator.
The following variables were independently extracted from each selected article: year of publication, first author, country, and continent where the study was conducted, sample size, age, sex distribution, pharmacological treatment for schizophrenia, and analytical method used.
We used the Joanna Briggs Institute Critical Appraisal Checklist for analytical studies to assess the risk of bias [36]. Studies addressing ≥75% of checklist items were considered as having a low risk of bias. We used the Grades of Recommendation, Assessment, Development and Evaluation (GRADE) Working Group system to assess the certainty of evidence. GRADE considers the study design, risk of bias, unexplained heterogeneity, indirectness of evidence, imprecision of the results, effect size (small, moderate, and large for standard mean differences, SMDs, of <0.5, 0.5–0.8, and >0.8, respectively [37]), and publication bias [38]. The study complied with the Preferred Reporting Items for Systematic reviews and Meta-Analyses (PRISMA) 2020 statement (Supplementary Tables 1 and 2) [39]. The protocol was registered in the International Prospective Register of Systematic Reviews (PROSPERO registration number: CRD42023433000).
Statistical analysis
Standardized mean differences (SMDs) and 95% confidence intervals (CIs) were used to generate forest plots of continuous data and to assess differences in serum concentrations of individual arginine metabolites between patients with schizophrenia and healthy controls (statistical significance set at p < 0.05). If necessary, means and standard deviations were extrapolated from medians and interquartile ranges or medians and ranges using published methods [40, 41], or the Graph Data Extractor software (San Diego, CA, USA). Heterogeneity of the SMD across studies was assessed using the Q statistic (statistical significance set at p < 0.10). Low, moderate, and high heterogeneity was indicated by I2 values of ≤25%, >25% and <75%, and ≥75%, respectively [42, 43]. Random-effect models based on the inverse-variance method were used in the presence of moderate-high heterogeneity. Sensitivity analysis was conducted to investigate the influence of individual studies on the overall risk estimate [44]. The Begg’s and Egger’s tests were used to assess for the presence of publication bias (statistical significance set at p < 0.05) [45, 46]. The Duval and Tweedie “trim-and-fill” procedure was performed to further test and eventually correct the funnel plot asymmetry arising from publication bias [47]. Univariate meta-regression and subgroup analyses were conducted to investigate possible associations between the effect size and year of publication, study continent, sample size, age, proportion of males, pharmacological treatment for schizophrenia, and analytical method used to measure individual metabolites. Statistical analyses were performed using Stata 14 (Stata Corp., College Station, TX, USA).
Results
Systematic search
We initially identified 1398 studies, of which 1375 were excluded because they were either duplicates or irrelevant. After a full-text review of the remaining 23 articles, a further two were excluded because of missing data, leaving 21 studies for final analysis (Fig. 2 and Table 1) [48–68]. All studies investigated patients with schizophrenia diagnosed according to current diagnostic criteria, barring one study group of patients with schizoaffective disorder [66], and two studies of patients with first-episode psychosis [60, 62].
Fig. 2.
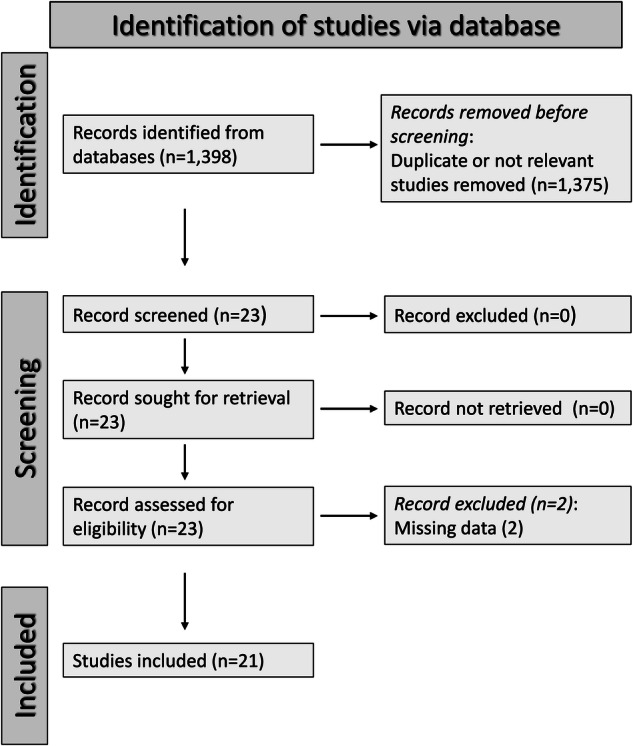
PRISMA 2020 flow diagram.
Table 1.
Study characteristics.
| Study | Healthy controls | Patients with schizophrenia | ||||||||
|---|---|---|---|---|---|---|---|---|---|---|
| n | Age (Years) | M/F | Arginine ADMA SDMA (Mean ± SD) | Dimethylamine Citrulline Ornithine (Mean ± SD) | n | Age (Years) | M/F | Arginine ADMA SDMA (Mean ± SD) | Dimethylamine Citrulline Ornithine (Mean ± SD) | |
| Rao ML et al. (a), 1990, Germany [48] | 90 | NR | NR |
107 ± 18 NR NR |
NR 36 ± 9 88 ± 12 |
20 | NR | NR |
116 ± 19 NR NR |
NR 32 ± 11 86 ± 21 |
| Rao ML et al. (b), 1990, Germany [48] | 90 | NR | NR |
107 ± 18 NR NR |
NR 36 ± 9 88 ± 12 |
23 | NR | NR |
113 ± 17 NR NR |
NR 48 ± 18 86 ± 13 |
| Das I et al., 1996, UK [49] | 12 | 28 | 11/1 |
NR 0.58 ± 0.18 0.82 ± 0.48 |
NR NR NR |
16 | 29 | 15/1 |
NR 0.84 ± 0.33 0.49 ± 0.25 |
NR NR NR |
| Celik C et al., 2011, Turkey [50] | 30 | 25 | 30/0 |
NR 0.95 ± 0.95 NR |
NR NR NR |
49 | 24 | 49/0 |
NR 3.59 ± 0.39 NR |
NR NR NR |
| He Y et al., 2012, Germany [51] | 216 | 39 | 112/104 |
99 ± 49 NR NR |
NR NR 78 ± 40 |
265 | 37 | 161/104 |
88 ± 40 NR NR |
NR NR 96 ± 51 |
| Zincir S et al., 2014, Turkey [52] | 30 | NR | NR |
NR 1.02 ± 1.02 NR |
NR NR NR |
49 | NR | NR |
NR 3.6 ± 1.5 NR |
NR NR NR |
| Jorgensen A et al., 2015, Denmark [53] | 40 | 31 | 20/20 |
128 ± 37 0.37 ± 0.08 NR |
NR NR NR |
40 | 33 | 20/20 |
126 ± 22 0.37 ± 0.08 NR |
NR NR NR |
| Misiak B et al., 2016, Poland [54] | 73 | 26 | 46/27 |
112.8 ± 45.2 0.38 ± 0.05 0.33 ± 0.04 |
0.94 ± 0.39 24.54 ± 6.11 NR |
73 | 27 | 44/29 |
104.6 ± 39.8 0.45 ± 0.08 0.34 ± 0.08 |
1.06 ± 0.24 24.08 ± 4.60 NR |
| Nonaka-Hashida S et al., 2016, Japan [55] | 63 | 48 | 39/24 |
67.5 ± 8.4 0.40 ± 0.07 0.48 ± 0.16 |
NR NR NR |
101 | 50 | 56/45 |
84.3 ± 20.3 0.46 ± 0.09 0.52 ± 0.15 |
NR NR NR |
| Telo S et al., 2016, Turkey [56] | 40 | 39 | 20/20 |
NR 0.29 ± 0.44 NR |
NR NR NR |
80 | 43 | 42/38 |
NR 0.38 ± 0.08 NR |
NR NR NR |
| Yang YJ et al., 2016, China [57] | 45 | 32 | 22/23 |
NR 1.39 ± 0.13 NR |
NR NR NR |
47 | 30 | 24/23 |
NR 2.51 ± 0.93 NR |
NR NR NR |
| Kageyama Y et al., 2017, Japan [58] | 19 | 36 | 10/9 |
NR NR NR |
NR 31.9 ± 11.0 NR |
17 | 34 | 8/9 |
NR NR NR |
NR 32.9 ± 12.8 NR |
| Cao B et al., 2018, China [59] | 175 | 39 | 121/54 |
71.4 ± 25.2 125 ± 40 NR |
NR 28.4 ± 6.86 70.35 ± 28.34 |
208 | 39 | 135/73 |
98.1 ± 35.1 131 ± 56 NR |
NR 29.83 ± 8.85 86.45 ± 41.06 |
| Leppik L et al. (a)a, 2018, Estonia [60] | 37 | 25 | 25 |
141 ± 33 0.35 ± 0.10 0.53 ± 0.11 |
0.61 ± 0.15 24.6 ± 9.6 48.8 ± 17.2 |
38 | 25 | 25 |
135 ± 32 0.42 ± 0.09 0.57 ± 0.14 |
0.69 ± 0.15 21.4 ± 6.4 58.4 ± 21.3 |
| Leppik L et al. (b)a, 2018, Estonia [60] | 37 | 25 | 25 |
141 ± 33 0.35 ± 0.10 0.53 ± 0.11 |
0.61 ± 0.15 24.6 ± 9.6 48.8 ± 17.2 |
36 | 25 | 25 |
139 ± 32 0.40 ± 0.08 0.52 ± 0.10 |
0.69 ± 0.12 23.6 ± 5.9 51.6 ± 16 |
| Yu ZM et al., 2019, China [61] | 30 | 32 | 16/14 |
NR 1.41 ± 0.14 NR |
NR NR NR |
29 | 31 | 14/15 |
NR 2.42 ± 0.84 NR |
NR NR NR |
| Garip B et al. (a)a, 2019, Turkey [62] | 35 | 22 | NR |
90 ± 38b NR NR |
NR 33.5 ± 20b 107 ± 42b |
40 | 22 | NR |
197 ± 82b NR NR |
NR 63.2 ± 19b 106 ± 35b |
| Garip B et al. (b)a, 2019, Turkey [62] | 35 | 22 | NR |
90 ± 38b NR NR |
NR 33.5 ± 20b 107 ± 42b |
40 | 22 | NR |
227 ± 76b NR NR |
NR 75 ± 19b 116 ± 32b |
| Safaei M et al. (a), 2019, Iran [63] | 20 | NR | NR |
NR 1.13 ± 0.44 NR |
NR NR NR |
18 | NR | NR |
NR 1.77 ± 0.54 NR |
NR NR NR |
| Safaei M et al. (b), 2019, Iran [63] | 20 | NR | NR |
NR 1.13 ± 0.44 NR |
NR NR NR |
20 | NR | NR |
NR 2.56 ± 1.01 NR |
NR NR NR |
| Safei M et al. (c), 2019, Iran [63] | 20 | NR | NR |
NR 1.13 ± 0.44 NR |
NR NR NR |
19 | NR | NR |
NR 1.22 ± 0.35 NR |
NR NR NR |
| Parksepp M et al. (a), 2020, Estonia [64] | 37 | 25 | 16/21 |
163 ± 36 0.42 ± 0.08 0.55 ± 0.10 |
NR 27.8 ± 8.4 56.8 ± 17.2 |
52 | 27 | 31/21 |
144 ± 33 0.45 ± 0.10 0.56 ± 0.13 |
NR 22.5 ± 5.8 63.9 ± 25.2 |
| Parksepp M et al. (b), 2020, Estonia [64] | 37 | 25 | 16/21 |
163 ± 36 0.42 ± 0.08 0.55 ± 0.10 |
NR 27.8 ± 8.4 56.8 ± 17.2 |
37 | 32 | 23/14 |
143 ± 50 0.58 ± 0.19 0.57 ± 0.25 |
NR 25.8 ± 13.7 81.5 ± 22.1 |
| Ustundag MF et al., 2020, Turkey [65] | 30 | 35 | 12/18 |
74.7 ± 9.2 5.72 ± 1.81 3.67 ± 0.98 |
NR NR NR |
30 | 40 | 14/16 |
97.1 ± 21.9 12.12 ± 3.01 4.87 ± 0.81 |
NR NR NR |
| Braun D et al. (a), 2021, Germany [66] | 16 | 31 | 8/8 |
NR 82.0 ± 12.6b NR |
NR NR NR |
62 | 42 | 26/36 |
NR 116 ± 37.7b NR |
NR NR NR |
| Braun D et al. (b)c, 2021, Germany [66] | 16 | 31 | 8/8 |
NR 82 ± 12.6b NR |
NR NR NR |
18 | 45 | 11/7 |
NR 123 ± 46.5b NR |
NR NR NR |
| Mednova IA et al., 2020, Russia [67] | 36 | 33 | 22/14 |
56.3 ± 8.9 NR NR |
NR 19.1 ± 3.7 84.9 ± 12.8 |
37 | 35 | 19/18 |
48.4 ± 8.6 NR NR |
NR 23.1 ± 5.1 94.9 ± 20.2 |
| Ma Q et al., 2022, China [68] | 79 | 33 | 40/39 |
19.0 ± 5.1 NR NR |
NR NR 10.94 ± 4.07 |
76 | 28 | 40/36 |
14.4 ± 5.0 NR NR |
NR NR 11.97 ± 3.8 |
The concentration is expressed in µmol/L except where otherwise indicated.
ADMA asymmetric dimethylarginine, SDMA symmetric dimethylarginine, M/F male/female, NR not reported.
aPatients with first-episode psychosis.
bng/mL.
cPatients with schizoaffective disorder.
Individual metabolites
Arginine
Study characteristics
Twelve studies, including 16 study groups, reported serum arginine concentrations in 1116 patients with schizophrenia (mean age 35 years, 58% males) and 1110 healthy controls (mean age 34 years, 55% males) [48, 51, 53–55, 59, 60, 62, 64, 65, 67, 68]. Six studies were conducted in Europe [48, 51, 53, 54, 60, 64], and the remaining six in Asia [55, 59, 62, 65, 67, 68]. Liquid chromatography was used in all studies for the determination of arginine. Eight studies utilised mass spectrometry detection [51, 54, 59, 60, 62, 64, 67, 68], three fluorimetric detection [53, 55, 65], whilst the remaining one did not provide details regarding the detection method [48]. Patients received pharmacological treatment for schizophrenia in eight study groups [48, 53–55, 60, 62, 64, 67], and no treatment in five [48, 59, 60, 62, 64]. Both treated and untreated patients were included in two study groups [51, 68], whereas no treatment-specific information was provided in the remaining one [65].
Risk of bias
All studies had a low risk of bias (Supplementary Table 3) [48, 51, 53–55, 59, 60, 62, 64, 65, 67, 68].
Results of individual studies and syntheses
Random-effects models were used given the high heterogeneity observed (I2 = 94.4%, p < 0.001). Pooled results showed no significant differences in serum arginine concentrations between patients with schizophrenia and controls (SMD = 0.26, 95% CI −0.13 to 0.65, p = 0.19; Supplementary Fig. 1). Sensitivity analysis showed stability of the results, with an effect size ranging between 0.17 and 0.34 (Supplementary Fig. 2).
Publication bias
There was no evidence of publication bias according to either the Begg’s (p = 0.08) or the Egger’s (p = 0.59) test. Accordingly, the “trim-and-fill” method did not identify any missing study to be added to the funnel plot to ensure symmetry (Supplementary Fig. 3).
Meta-regression and sub-group analyses
No significant associations were observed in univariate meta-regression between the effect size and age (t = 0.64, p = 0.54), proportion of males (t = −0.78, p = 0.45), publication year (t = −0.28, p = 0.79), or sample size (t = −0.20, p = 0.84).
In subgroup analysis, a trend toward a significant difference (p = 0.066) was observed in the effect size between European (SMD = −0.12, 95% CI −0.31 to 0.07, p = 0.20; I2 = 53.3%, p = 0.03) and Asian studies (SMD = 0.74, 95% CI −0.05 to 1.53, p = 0.07; I2 = 96.7%, p < 0.001), with a lower between-study variance in the former subgroup (Supplementary Fig. 4). No significant differences (p = 0.33) in pooled SMD were observed between studies using mass spectrometry (SMD = 0.10, 95% CI −0.39 to 0.59, p = 0.69; I2 = 95.4%, p < 0.001) and fluorimetric detection (SMD = 0.75, 95% CI −0.04 to 1.54, p = 0.06; I2 = 89.8%, p < 0.001; Supplementary Fig. 5). Similarly, no significant differences (p = 0.69) in pooled SMD were observed between studies conducted in untreated (SMD = 0.45, 95% CI −0.24 to 1.13, p = 0.20; I2 = 93.4%, p < 0.001) and treated patients (SMD = 0.23, 95% CI −0.36 to 0.82, p = 0.45; I2 = 93.4%, p < 0.001; Supplementary Fig. 6).
Certainty of evidence
The initial low level of certainty, due to the cross-sectional nature of the selected studies (rating 2, ⊕⊕⊖⊖), was downgraded to very low (rating 1, ⊕⊖⊖⊖) after considering the relatively high imprecision (confidence intervals with threshold crossing).
Asymmetric dimethylarginine
Study characteristics
Fifteen studies, including 21 study groups, reported circulating ADMA concentrations in 1050 patients with schizophrenia (mean age 36 years, 57% males) and 830 controls (mean age 33 years, 59% males) [49, 50, 52–57, 59–61, 63–66]. Nine studies were performed in Asia [50, 52, 55–57, 59, 61, 63, 65], and the remaining six in Europe [49, 53, 54, 60, 64, 66]. ADMA was measured using liquid chromatography in 14 studies [49, 50, 52–57, 59–61, 64–66], and enzyme-linked immunosorbent assay (ELISA) in the remaining one [63]. Among the liquid chromatography studies, four utilized mass spectrometry detection [54, 59, 60, 64], nine fluorometric detection [50, 52, 53, 55–57, 59, 61, 65, 66], whereas no relevant information was provided in the remaining one [49]. Patients received pharmacological treatment for schizophrenia in 13 study groups [53–57, 60, 61, 63–66], and no treatment in seven [50, 52, 59–61, 63, 64]. In one study group, the studied cohort included both treated and untreated patients [49].
Risk of bias
All studies had a low risk of bias (Supplementary Table 3) [49, 50, 52–57, 59–61, 63–66].
Results of individual studies and syntheses
Random-effects models were used because of the high heterogeneity observed (I2 = 92.5%, p˂0.001). Pooled results showed that serum ADMA concentrations were significantly higher in patients with schizophrenia compared to controls (SMD = 1.23, 95% CI 0.86–1.61, p < 0.001; Fig. 3). In sensitivity analysis, the corresponding pooled SMD values were stable, with an effect size ranging between 1.00 and 1.29 (Supplementary Fig. 7).
Fig. 3.

Forest plot of studies reporting serum ADMA concentrations in patients with schizophrenia and healthy controls.
Publication bias
There was a significant publication bias according to both the Begg’s (p = 0.012) and the Egger’s (p = 0.001) tests. Accordingly, the “trim-and-fill” method identified nine missing studies to be added to the left side of the funnel plot to ensure symmetry (Supplementary Fig. 8). The resulting effect size, albeit attenuated, remained significant (SMD = 0.52, 95% CI 0.11–0.92, p = 0.01).
Meta-regression and sub-group and analyses
No significant associations were observed in meta-regression between the effect size and age (t = −0.64, p = 0.53), proportion of males (t = 0.03, p = 0.98), publication year (t = −0.81, p = 0.43), or sample size (t = −0.85, p = 0.41).
In subgroup analysis, there were no significant (p = 0.16) differences in pooled SMD between European (SMD = 0.72, 95% CI 0.43–1.00, p < 0.001; I2 = 66.7%, p = 0.002) and Asian studies (SMD = 1.69, 95% CI 1.05–2.33, p < 0.001; I2 = 95.4%, p < 0.001; Supplementary Fig. 9), with a lower variance in the former subgroup. There were also no significant differences (p = 0.83) in pooled SMD between studies using liquid chromatography (SMD = 1.26, 95% CI 0.85–1.67 p < 0.001; I2 = 93.3%, p < 0.001) and ELISA (SMD = 1.11, 95% CI 0.15–2.06, p = 0.023; I2 = 82.4%, p < 0.001; Supplementary Fig. 10). Furthermore, no significant differences in pooled SMD (p = 0.20) were observed between liquid chromatography studies using fluorimetric detection (SMD = 1.73, 95% CI 1.05–2.40, p < 0.001; I2 = 94.5%, p < 0.001) and mass spectrometry detection (SMD = 0.60, 95% CI 0.23–0.98, p = 0.002; I2 = 83.4%, p < 0.001; Supplementary Fig. 11). Similarly, there were no significant differences (p = 0.44) in pooled SMD between studies investigating untreated (SMD = 1.68, 95% CI 0.71–2.64, p = 0.001; I2 = 96.6%, p < 0.001) and treated patients (SMD = 1.09, 95% CI 0.75–1.42, p˂0.001; I2 = 83.3%, p < 0.001; Supplementary Fig. 12).
Certainty of evidence
The initial level of certainty was low because of the cross-sectional nature of the selected studies (rating 2, ⊕⊕⊖⊖). This was upgraded to moderate (rating 3, ⊕⊕⊕⊖) after taking into account the relatively large effect size (SMD = 1.26) [37].
Symmetric dimethylarginine
Study characteristics
Six studies, including eight study groups, assessed circulating SDMA concentrations in 383 patients with schizophrenia (mean age 34 years, 56% males) and 326 healthy controls (mean age 31 years, 53% males) [49, 54, 55, 60, 64, 65]. Four studies were conducted in Europe [49, 54, 60, 64], and the remaining two in Asia [55, 65]. All studies used liquid chromatography, three with mass spectrometry detection [54, 60, 64], two with fluorometric detection [55, 65], whereas no relevant information was provided in the remaining one [49]. Patients received pharmacological treatment in five study groups [54, 55, 60, 64, 65], and no treatment in two study groups [60, 64]. One study group investigated both treated and untreated patients [49].
Risk of bias
The risk of bias was considered low in all studies (Supplementary Table 3) [49, 54, 55, 60, 64, 65].
Results of individual studies and syntheses
The moderate between-study heterogeneity (I2 = 72.4%, p = 0.001) warranted the use of random-effects models. Pooled results showed no significant differences in serum SDMA concentrations different between patients with schizophrenia and healthy controls (SMD = 0.21, 95% CI −0.09 to 0.51, p = 0.17; Supplementary Fig. 13). Sensitivity analysis showed that the corresponding pooled SMD values were stable, with an effect size ranging between 0.11 and 0.30 (Supplementary Fig. 14).
Publication bias
Assessment of publication bias could not be performed because of the small number of studies.
Meta-regression and sub-group and analysis
The small number of studies prevented the conduct of meta-regression analysis.
In sub-group analysis, there were no significant differences (p = 0.10) in pooled SMD between Asian (SMD = 0.79, 95% CI −0.17 to 0.29, p = 0.61; I2 = 35.6%, p = 0.17) and European studies (SMD = 0.06, 95% CI −0.17 to 0.29, p = 0.13; I2 = 90.0%, p < 0.001; Supplementary Fig. 15), with a reduced between-study variance in the former subgroup. No significant differences (p = 0.11) in pooled SMD were also observed between studies using mass spectrometry (SMD = 0.14, 95% CI −0.05 to 0.32, p = 0.14; I2 = 0.0%, p = 0.85) and fluorimetric detection (SMD = 0.79, 95% CI −0.23 to 1.80, p = 0.13; I2 = 90.0%, p = 0.002; Supplementary Fig. 16), with a virtual absence of between-study variance in the former subgroup. Similarly, there were no significant differences (p = 0.75) in pooled SMD between studies performed in treated (SMD = 0.34, 95% CI −0.03 to 0.71, p = 0.07; I2 = 75.7%, p = 0.002) and untreated patients (SMD = 0.20, 95% CI −0.11 to 0.51, p = 0.20; I2 = 0.0%, p = 0.47; Supplementary Fig. 17).
Certainty of evidence
The initial level of certainty was considered low because of the cross-sectional nature of the selected studies (rating 2, ⊕⊕⊖⊖). This was downgraded to extremely low (rating 0, ⊖⊖⊖⊖) after considering the relatively high imprecision (confidence intervals with threshold crossing) and the lack of assessment of publication bias.
Arginine/asymmetric dimethylarginine ratio
Study characteristics
Three studies, including four study groups, reported serum arginine/ADMA ratios in 202 patients with schizophrenia (mean age 29 years, 58% males) and 187 controls (mean age 27 years, 52% males) [53, 54, 64]. All studies were performed in Europe and used liquid chromatography, two with mass spectrometry detection [54, 64], and one with fluorometric detection [53]. Patients were treated in three study groups [53, 54, 64], and untreated in one [64].
Risk of bias
The risk of bias was considered low in all studies (Supplementary Table 3) [53, 54, 64].
Results of individual studies and syntheses
Random-effects models were used because of the moderate heterogeneity observed (I2 = 54.3%, p = 0.087). Pooled results showed that the arginine/ADMA ratio was significantly lower in patients with schizophrenia compared to controls (SMD = −0.35, 95% CI −0.65 to −0.04; p = 0.026; Fig. 4). In sensitivity analysis, the corresponding pooled SMD values were stable, with an effect size ranging between −0.46 and −0.25 (Supplementary Fig. 18).
Fig. 4.

Forest plot of studies reporting arginine/ADMA ratios in patients with schizophrenia and healthy controls.
Publication bias
The assessment of publication bias could not be performed because of the small number of studies.
Meta-regression and sub-group and analysis
Meta-regression and sub-group analyses could not be performed because of the small number of studies.
Certainty of evidence
The initial level of certainty for cross-sectional studies (rating 2, ⊕⊕⊖⊖) was downgraded to very low (rating 1, ⊕⊖⊖⊖) after considering the lack of assessment of publication bias.
Citrulline
Study characteristics
Eight studies, including 12 study groups, reported circulating citrulline concentrations in 599 patients with schizophrenia (mean age 31 years, 59% males) and 697 healthy controls (mean age 30 years, 58% males) [48, 54, 58–60, 62, 64, 67]. Four studies were conducted in Europe [48, 54, 60, 64], and the remaining four in Asia [58, 59, 62, 67]. All studies used liquid chromatography, six with mass spectrometry detection [54, 59, 60, 62, 64, 67], and one with ultraviolet detection [58], whereas no relevant information was provided in the remaining one [48]. Patients received pharmacological treatment in six study groups [48, 58–60, 62, 64], and no treatment in the remaining six [48, 54, 60, 62, 64, 67].
Risk of bias
The risk of bias was considered low in all studies (Supplementary Table 3) [48, 54, 58–60, 62, 64, 67].
Results of individual studies and syntheses
The high between-study heterogeneity observed (I2 = 91%, p < 0.001) warranted the use of random-effects models. Pooled results showed no significant differences in serum citrulline concentrations between patients with schizophrenia and controls (SMD = 0.32, 95% CI −0.10 to 0.74 p = 0.13; Supplementary Fig. 19). Sensitivity analysis showed stability of the corresponding pooled SMD values, with an effect size ranging between 0.15 and 0.42 (Supplementary Fig. 20).
Publication bias
There was no evidence of publication bias according to either the Begg’s (p = 0.15) or the Egger’s (p = 0.45) test. Accordingly, the “trim-and-fill” method did not identify any missing study to be added to the funnel plot to ensure symmetry (Supplementary Fig. 21).
Meta-regression and sub-group and analyses
There were no significant associations between the effect size and age (t = −0.81, p = 0.44), proportion of males (t = −2.12, p = 0.08), publication year (t = 0.00, p = 0.99), or sample size (t = −0.30, p = 0.77) in univariate meta-regression analysis.
In subgroup analysis, the pooled SMD was significantly different in Asian (SMD = 0.95, 95% CI 0.19 to 1.72, p = 0.015; I2 = 93.4%, p < 0.001) but not European studies (SMD = −0.15, 95% CI −0.51 to 0.21, p = 0.41; I2 = 75.1%, p = 0.001; Supplementary Fig. 22). No significant differences (p = 0.26) were also observed in pooled SMD values between studies in untreated (SMD = 0.03, 95% CI −0.54 to 0.60, p = 0.41; I2 = 90.3%, p < 0.001) and treated patients (SMD = 0.61, 95% CI −0.08 to 1.30, p = 0.08; I2 = 92.2%, p < 0.001; Supplementary Fig. 23).
Certainty of evidence
The initial level of certainty was considered low because of the cross-sectional nature of the selected studies (rating 2, ⊕⊕⊖⊖). This was downgraded to extremely low (rating 0, ⊖⊖⊖⊖) after considering the high, unexplained, heterogeneity and the relatively high imprecision (confidence intervals with threshold crossing).
Ornithine
Study characteristics
Eight studies, including 12 study groups, reported circulating ornithine concentrations in 872 patients with schizophrenia (mean age 33 years, 59% males) and 904 healthy controls (mean age 34 years, 55% males) [48, 51, 59, 60, 62, 64, 67, 68]. Four studies were conducted in Europe [48, 51, 60, 64], and the remaining four in Asia [59, 62, 67, 68]. Liquid chromatography was used in all studies, seven with mass spectrometry detection [51, 59, 60, 62, 64, 67, 68], whereas no relevant information was provided in the remaining one [48]. Patients received pharmacological treatment in five study groups [48, 59, 60, 62, 64], an no treatment in other five [48, 60, 62, 64, 67]. Two study groups investigated both treated and untreated patients [51, 68].
Risk of bias
The risk of bias was considered low in all studies (Supplementary Table 3) [48, 51, 59, 60, 62, 64, 67, 68].
Results of individual studies and syntheses
Random-effects models were used given the moderate heterogeneity observed (I2 = 59.9%, p = 0.004). Pooled results showed that serum ornithine concentrations were significantly higher in patients with schizophrenia compared to controls (SMD = 0.32, 95% CI 0.16–0.49, p < 0.001; Fig. 5). The corresponding pooled SMD values remained stable, with an effect size ranging between 0.28 and 0.36 (Supplementary Fig. 24).
Fig. 5.

Forest plot of studies reporting serum ornithine concentrations in patients with schizophrenia and healthy controls.
Publication bias
There was no significant publication bias according to either the Begg’s (p = 1.00) or the Egger’s (p = 0.56) test. Accordingly, the “trim-and-fill” method did not identify any missing study to be added to the funnel plot to ensure symmetry (Supplementary Fig. 25).
Meta-regression and sub-group and analysis
In meta-regression analysis, there were no significant associations between the effect size and age (t = 1.28, p = 0.24), proportion of males (t = 1.14, p = 0.30), publication year (t = −0.28, p = 0.79), or sample size (t = −0.28, p = 0.78).
In subgroup analysis, there were no significant differences (p = 0.94) in effect size between European (SMD = 0.33, 95% CI 0.04–0.62, p = 0.026; I2 = 73.2%, p = 0.001) and Asian studies (SMD = 0.34, 95% CI 0.17–0.51, p < 0.001; I2 = 21.1%, p = 0.28; Supplementary Fig. 26), with a substantial reduction in between-study variance in the latter subgroup. Notably, the pooled SMD was significantly different in studies of untreated (SMD = 0.26, 95% CI 0.02–0.50, p = 0.034; I2 = 49.0%, p = 0.098) but not treated patients (SMD = 0.41, 95% CI −0.04 to 0.87, p = 0.077; I2 = 78.9%, p = 0.001; Supplementary Fig. 27).
Certainty of evidence
The initial level of certainty was low because of the cross-sectional nature of the selected studies (rating 2, ⊕⊕⊝⊝). This remained low after considering the low risk of bias in all studies, the moderate but partially explained heterogeneity, the lack of indirectness, the relatively low imprecision, the relatively small effect size, and the lack of publication bias.
Dimethylamine
Study characteristics
Two studies, including three study groups, reported circulating dimethylamine concentrations in 147 patients (mean age 26 years, 52% males) and 147 healthy controls (mean age 24 years, 53% males) [54, 60]. Both studies were performed in Europe and used liquid chromatography with mass spectrometry detection [54, 60]. Patients received pharmacological treatment in two study groups [54, 60], and no treatment in the remaining one [60].
Risk of bias
The risk of bias was considered low in both studies (Supplementary Table 3) [54, 60].
Results of individual studies and syntheses
Fixed-effects models were used given the virtual absence of between-study heterogeneity (I2 = 0.0%, p = 0.68). Pooled results showed that dimethylamine serum concentrations were significantly higher in patients with schizophrenia compared to controls (SMD = 0.47, 95% CI 0.24 to 0.70, p < 0.001; Fig. 6).
Fig. 6.

Forest plot of studies reporting serum dimethylamine concentrations in patients with schizophrenia and healthy controls.
Publication bias
Assessment of publication bias could not be performed because of the small number of studies.
Meta-regression and sub-group and analysis
Meta-regression and sub-group analyses could not be performed because of the small number of studies.
Certainty of evidence
The initial level of certainty for cross-sectional studies (rating 2, ⊕⊕⊝⊝) was downgraded to very low (rating 1, ⊕⊝⊝⊝) after considering the lack of assessment of publication bias.
Discussion
The results of this systematic review and meta-analysis highlight the presence of significant alterations in the circulating concentrations of specific arginine metabolites in patients with schizophrenia. Such metabolites reflect possible changes in the expression and/or activity of two enzymes regulating NO synthesis, DDAH1 (ADMA and dimethylamine) and arginase (ornithine). By contrast, no significant schizophrenia-associated changes were observed in arginine, citrulline, or SDMA. In meta-regression and subgroup analyses, the effect size of the reported differences was not associated with pre-defined study and patient characteristics, barring geographical location (citrulline) and pharmacological treatment for schizophrenia (ornithine). Notably, in sensitivity analyses the pooled SMD values of each analyte were not substantially influenced by the sequential removal of individual studies, suggesting that the results of the meta-analysis were stable.
The increased concentrations of ADMA observed in patients with schizophrenia suggest DDAH1 downregulation whereas the increased concentrations of ornithine suggest arginase upregulation (Fig. 1). The concomitant observation of higher concentrations of dimethylamine, a DDAH1 product, in patients with schizophrenia is apparently counterintuitive. However, the evidence supporting higher dimethylamine concentrations in schizophrenia was derived from the meta-analysis of only two studies [54, 60]. Therefore, additional research is warranted to confirm this finding. Furthermore, changes in dimethylamine concentrations can be secondary to factors independent of DDAH1, such as dietary choline, lecithin, and gut bacteria [69, 70]. Similarly, the reported increase in the arginase product ornithine was not associated with a concomitant reduction in the substrate arginine. However, arginine is also a NOS substrate [71]. Similarly, citrulline is the product of both NOS and DDAH1, and both analytes play a key role in the urea cycle, further highlighting the complexity of assessing arginine metabolic pathways (Fig. 1) [28, 71–73]. These issues notwithstanding, the increased ADMA (NOS inhibitor) concentrations and arginase activity (with reduced availability of arginine for NO synthesis) are in line with the results of studies reporting a relative deficit in NO synthesis in schizophrenia [10]. Although the observed alterations involve circulating arginine metabolite concentrations, a post-mortem study has reported the concomitant reduction in eNOS expression and the increased protein level of arginase 2 in the frontal cortex of patients with schizophrenia. Notably, significant correlations were observed in this study between arginase activity and the age of onset of schizophrenia and between tissue concentrations of ornithine and disease duration. These observations support the pathophysiological role of excess arginase activity in schizophrenia [74]. Furthermore, a recent murine and human study has reported that DDAH1 is diffusely expressed across the central nervous system, including brain areas that are commonly affected in schizophrenia [33, 75].
The importance of investigating the concentrations of NO and NO-associated arginine metabolites in different areas of the brain in future research is further supported by the results of studies in experimental models of schizophrenia. In these studies, alterations in NO concentrations as well as their temporal changes were observed in some regions but not others [76, 77]. Interventional studies using the antipsychotics clozapine and haloperidol in animal models of schizophrenia have also shown inconsistent results on NO concentrations in different areas of the brain [78, 79]. An additional element of complexity is related to the different biological and clinical significance of NO synthesis from the inducible, iNOS, vs. the constitutive, eNOS and nNOS, NOS isoforms [7–10]. Experimental models of schizophrenia have shown the upregulation of iNOS, an isoform notoriously activated in conditions of inflammation and oxidative stress, in the brain [80, 81]. Notably, treatment with the antipsychotic aripiprazole was associated with a significant downregulation of iNOS [81].
Another interesting finding in our meta-analysis was the presence, in subgroup analysis, of significant differences in the pooled SMD values for ornithine concentrations in studies of untreated patients but not in those of patients receiving pharmacological treatment for schizophrenia. Albeit hypothesis-generating, this observation suggests that antipsychotic drug treatment might exert an inhibitory effect on arginase activity. This, in turn, would reduce ornithine levels to values observed in healthy subjects. This proposition is supported by studies reporting that the antipsychotic drug chlorpromazine significantly reduces arginase activity in experimental models [82]. However, additional research is needed to investigate the effects of antipsychotic agents on arginase activity and whether these effects may account for their therapeutic effects in schizophrenia. Future studies are also warranted to confirm the presence of specific alterations in the expression and/or activity of DDAH1 and arginase and the concentrations of ADMA and ornithine. Such studies should also assess temporal changes associated with antipsychotic treatment. If positive, the results of these investigations would likely stimulate additional research on effective strategies enhancing DDAH1 activity and/or inhibiting arginase activity in schizophrenia. Such strategies have been recently investigated in other disease models [83–85].
Strengths of our study include a comprehensive assessment of arginine metabolites in patients with schizophrenia, the conduct of meta-regression and subgroup analyses to identify associations between the effect size and pre-defined patient and study characteristics, and a rigorous assessment of the risk of bias and the certainty of evidence. A significant limitation is the presence of moderate-high between-study heterogeneity, barring studies assessing dimethylamine. However, potential sources of heterogeneity were identified in subgroup analysis for arginine (study continent), ADMA (study continent), SDMA (study continent and liquid chromatography detection method), and ornithine (study continent).
Conclusion
The results of our systematic review and meta-analysis highlight the potential role of a dysregulation of arginine metabolic pathways, assessed measuring arginine metabolites associated with enzymes involved in NO regulation, i.e., DDAH1 and arginase, in schizophrenia. Further research is warranted to confirm whether these alterations are also present in specific areas of the brain and to investigate the effects of treatments targeting these metabolic pathways.
Supplementary information
Author contributions
AZ, ST, and AAM generated the idea; AZ, ST, CC, SS, and AAM contributed to the study planning and design; AZ and AAM conducted the literature search; AZ conducted the statistical analysis; AZ, ST, CC, SS, and AAM interpreted the data; AAM wrote the first draft of the paper; AZ, ST, CC, SS, and AAM critically reviewed further drafts and the final version.
Competing interests
The authors declare no competing interests.
Footnotes
Publisher’s note Springer Nature remains neutral with regard to jurisdictional claims in published maps and institutional affiliations.
Supplementary information
The online version contains supplementary material available at 10.1038/s41398-024-03157-7.
References
- 1.Patel KR, Cherian J, Gohil K, Atkinson D. Schizophrenia: overview and treatment options. P T. 2014;39:638–45. [PMC free article] [PubMed] [Google Scholar]
- 2.McCutcheon RA, Abi-Dargham A, Howes OD. Schizophrenia, Dopamine and the Striatum: From Biology to Symptoms. Trends Neurosci. 2019;42:205–20. 10.1016/j.tins.2018.12.004. [DOI] [PMC free article] [PubMed] [Google Scholar]
- 3.Potkin SG, Kane JM, Correll CU, Lindenmayer JP, Agid O, Marder SR, et al. The neurobiology of treatment-resistant schizophrenia: paths to antipsychotic resistance and a roadmap for future research. NPJ Schizophr. 2020;6:1. 10.1038/s41537-019-0090-z. [DOI] [PMC free article] [PubMed] [Google Scholar]
- 4.Fisar Z. Biological hypotheses, risk factors, and biomarkers of schizophrenia. Prog Neuropsychopharmacol Biol Psychiatry. 2023;120:110626 10.1016/j.pnpbp.2022.110626. [DOI] [PubMed] [Google Scholar]
- 5.Kondej M, Stepnicki P, Kaczor AA. Multi-Target Approach for Drug Discovery against Schizophrenia. Int J Mol Sci. 2018;19. 10.3390/ijms19103105. [DOI] [PMC free article] [PubMed]
- 6.Sotiropoulos MG, Poulogiannopoulou E, Delis F, Dalla C, Antoniou K, Kokras N. Innovative screening models for the discovery of new schizophrenia drug therapies: an integrated approach. Expert Opin Drug Discov. 2021;16:791–806. 10.1080/17460441.2021.1877657. [DOI] [PubMed] [Google Scholar]
- 7.Thomas DD, Ridnour LA, Isenberg JS, Flores-Santana W, Switzer CH, Donzelli S, et al. The chemical biology of nitric oxide: implications in cellular signaling. Free Radic Biol Med. 2008;45:18–31. 10.1016/j.freeradbiomed.2008.03.020. [DOI] [PMC free article] [PubMed] [Google Scholar]
- 8.Toledo JC Jr., Augusto O. Connecting the chemical and biological properties of nitric oxide. Chem Res Toxicol. 2012;25:975–89. 10.1021/tx300042g. [DOI] [PubMed] [Google Scholar]
- 9.Lundberg JO, Weitzberg E. Nitric oxide signaling in health and disease. Cell. 2022;185:2853–78. 10.1016/j.cell.2022.06.010. [DOI] [PubMed] [Google Scholar]
- 10.Pitsikas N. The role of nitric oxide donors in schizophrenia: Basic studies and clinical applications. Eur J Pharmacol. 2015;766:106–13. 10.1016/j.ejphar.2015.09.045. [DOI] [PubMed] [Google Scholar]
- 11.Napoli C, de Nigris F, Williams-Ignarro S, Pignalosa O, Sica V, Ignarro LJ. Nitric oxide and atherosclerosis: an update. Nitric Oxide. 2006;15:265–79. 10.1016/j.niox.2006.03.011. [DOI] [PubMed] [Google Scholar]
- 12.Prast H, Philippu A. Nitric oxide as modulator of neuronal function. Prog Neurobiol. 2001;64:51–68. 10.1016/s0301-0082(00)00044-7. [DOI] [PubMed] [Google Scholar]
- 13.Calabrese V, Mancuso C, Calvani M, Rizzarelli E, Butterfield DA, Stella AM. Nitric oxide in the central nervous system: neuroprotection versus neurotoxicity. Nat Rev Neurosci. 2007;8:766–75. 10.1038/nrn2214. [DOI] [PubMed] [Google Scholar]
- 14.Lorrain DS, Hull EM. Nitric oxide increases dopamine and serotonin release in the medial preoptic area. Neuroreport. 1993;5:87–9. 10.1097/00001756-199310000-00024. [DOI] [PubMed] [Google Scholar]
- 15.Brenman JE, Bredt DS. Synaptic signaling by nitric oxide. Curr Opin Neurobiol. 1997;7:374–8. 10.1016/s0959-4388(97)80065-7. [DOI] [PubMed] [Google Scholar]
- 16.Javitt DC. Glutamate and schizophrenia: phencyclidine, N-methyl-D-aspartate receptors, and dopamine-glutamate interactions. Int Rev Neurobiol. 2007;78:69–108. 10.1016/S0074-7742(06)78003-5. [DOI] [PubMed] [Google Scholar]
- 17.Bernstein HG, Keilhoff G, Steiner J, Dobrowolny H, Bogerts B. Nitric oxide and schizophrenia: present knowledge and emerging concepts of therapy. CNS Neurol Disord Drug Targets. 2011;10:792–807. 10.2174/187152711798072392. [DOI] [PubMed] [Google Scholar]
- 18.Akbarian S, Bunney WE Jr., Potkin SG, Wigal SB, Hagman JO, Sandman CA, et al. Altered distribution of nicotinamide-adenine dinucleotide phosphate-diaphorase cells in frontal lobe of schizophrenics implies disturbances of cortical development. Arch Gen Psychiatry. 1993;50:169–77. 10.1001/archpsyc.1993.01820150007001. [DOI] [PubMed] [Google Scholar]
- 19.Lauer M, Johannes S, Fritzen S, Senitz D, Riederer P, Reif A. Morphological abnormalities in nitric-oxide-synthase-positive striatal interneurons of schizophrenic patients. Neuropsychobiology. 2005;52:111–7. 10.1159/000087555. [DOI] [PubMed] [Google Scholar]
- 20.Bernstein HG, Stanarius A, Baumann B, Henning H, Krell D, Danos P, et al. Nitric oxide synthase-containing neurons in the human hypothalamus: reduced number of immunoreactive cells in the paraventricular nucleus of depressive patients and schizophrenics. Neuroscience. 1998;83:867–75. 10.1016/s0306-4522(97)00461-2. [DOI] [PubMed] [Google Scholar]
- 21.Xing G, Chavko M, Zhang LX, Yang S, Post RM. Decreased calcium-dependent constitutive nitric oxide synthase (cNOS) activity in prefrontal cortex in schizophrenia and depression. Schizophr Res. 2002;58:21–30. 10.1016/s0920-9964(01)00388-7. [DOI] [PubMed] [Google Scholar]
- 22.Suzuki E, Nakaki T, Nakamura M, Miyaoka H. Plasma nitrate levels in deficit versus non-deficit forms of schizophrenia. J Psychiatry Neurosci. 2003;28:288–92. [PMC free article] [PubMed] [Google Scholar]
- 23.Lee BH, Kim YK. Reduced plasma nitric oxide metabolites before and after antipsychotic treatment in patients with schizophrenia compared to controls. Schizophr Res. 2008;104:36–43. 10.1016/j.schres.2008.06.005. [DOI] [PubMed] [Google Scholar]
- 24.Viinikka L. Nitric oxide as a challenge for the clinical chemistry laboratory. Scand J Clin Lab Invest. 1996;56:577–81. 10.3109/00365519609090591. [DOI] [PubMed] [Google Scholar]
- 25.Tsikas D. Methods of quantitative analysis of the nitric oxide metabolites nitrite and nitrate in human biological fluids. Free Radic Res. 2005;39:797–815. 10.1080/10715760500053651. [DOI] [PubMed] [Google Scholar]
- 26.Goshi E, Zhou G, He Q. Nitric oxide detection methods in vitro and in vivo. Med Gas Res. 2019;9:192–207. 10.4103/2045-9912.273957. [DOI] [PMC free article] [PubMed] [Google Scholar]
- 27.Moller MN, Rios N, Trujillo M, Radi R, Denicola A, Alvarez B. Detection and quantification of nitric oxide-derived oxidants in biological systems. J Biol Chem. 2019;294:14776–802. 10.1074/jbc.REV119.006136. [DOI] [PMC free article] [PubMed] [Google Scholar]
- 28.Palm F, Onozato ML, Luo Z, Wilcox CS. Dimethylarginine dimethylaminohydrolase (DDAH): expression, regulation, and function in the cardiovascular and renal systems. Am J Physiol Heart Circ Physiol. 2007;293:H3227–45. 10.1152/ajpheart.00998.2007. [DOI] [PubMed] [Google Scholar]
- 29.Wadham C, Mangoni AA. Dimethylarginine dimethylaminohydrolase regulation: a novel therapeutic target in cardiovascular disease. Expert Opin Drug Metab Toxicol. 2009;5:303–19. 10.1517/17425250902785172. [DOI] [PubMed] [Google Scholar]
- 30.Jarzebska N, Mangoni AA, Martens-Lobenhoffer J, Bode-Boger SM, Rodionov RN The Second Life of Methylarginines as Cardiovascular Targets. Int J Mol Sci. 2019;20. 10.3390/ijms20184592. [DOI] [PMC free article] [PubMed]
- 31.Ragavan VN, Nair PC, Jarzebska N, Angom RS, Ruta L, Bianconi E, et al. A multicentric consortium study demonstrates that dimethylarginine dimethylaminohydrolase 2 is not a dimethylarginine dimethylaminohydrolase. Nat Commun. 2023;14:3392. 10.1038/s41467-023-38467-9. [DOI] [PMC free article] [PubMed] [Google Scholar]
- 32.Caldwell RW, Rodriguez PC, Toque HA, Narayanan SP, Caldwell RB. Arginase: A Multifaceted Enzyme Important in Health and Disease. Physiol Rev. 2018;98:641–65. 10.1152/physrev.00037.2016. [DOI] [PMC free article] [PubMed] [Google Scholar]
- 33.Kozlova AA, Ragavan VN, Jarzebska N, Lukianova IV, Bikmurzina AE, Rubets E, et al. Divergent Dimethylarginine Dimethylaminohydrolase Isoenzyme Expression in the Central Nervous System. Cell Mol Neurobiol. 2022;42:2273–88. 10.1007/s10571-021-01101-7. [DOI] [PMC free article] [PubMed] [Google Scholar]
- 34.Yu H, Iyer RK, Kern RM, Rodriguez WI, Grody WW, Cederbaum SD. Expression of arginase isozymes in mouse brain. J Neurosci Res. 2001;66:406–22. 10.1002/jnr.1233. [DOI] [PubMed] [Google Scholar]
- 35.Mangoni AA. The emerging role of symmetric dimethylarginine in vascular disease. Adv Clin Chem. 2009;48:73–94. 10.1016/s0065-2423(09)48003-x. [DOI] [PubMed] [Google Scholar]
- 36.Moola S, Munn Z, Tufanaru C, Aromataris E, Sears K, Sfetc R, et al. Systematic reviews of etiology and risk. In: Aromataris E, Munn Z, editors. Joanna Briggs Institute Reviewer’s Manual. Adelaide, Australia: Johanna Briggs Institute; 2017.
- 37.Cohen J. Statistical Power Analysis. Curr Dir Psychol Sci. 1992;1:98–101. [Google Scholar]
- 38.Balshem H, Helfand M, Schünemann HJ, Oxman AD, Kunz R, Brozek J, et al. GRADE guidelines: 3. Rating the quality of evidence. J Clin Epidemiol. 2011;64:401–6. 10.1016/j.jclinepi.2010.07.015. [DOI] [PubMed] [Google Scholar]
- 39.Page MJ, McKenzie JE, Bossuyt PM, Boutron I, Hoffmann TC, Mulrow CD, et al. The PRISMA 2020 statement: an updated guideline for reporting systematic reviews. BMJ. 2021;372:n71 10.1136/bmj.n71. [DOI] [PMC free article] [PubMed] [Google Scholar]
- 40.Wan X, Wang W, Liu J, Tong T. Estimating the sample mean and standard deviation from the sample size, median, range and/or interquartile range. BMC Med Res Methodol. 2014;14:135 10.1186/1471-2288-14-135. [DOI] [PMC free article] [PubMed] [Google Scholar]
- 41.Hozo SP, Djulbegovic B, Hozo I. Estimating the mean and variance from the median, range, and the size of a sample. BMC Med Res Methodol. 2005;5:13 10.1186/1471-2288-5-13. [DOI] [PMC free article] [PubMed] [Google Scholar]
- 42.Higgins JP, Thompson SG. Quantifying heterogeneity in a meta-analysis. Stat Med. 2002;21:1539–58. 10.1002/sim.1186. [DOI] [PubMed] [Google Scholar]
- 43.Higgins JP, Thompson SG, Deeks JJ, Altman DG. Measuring inconsistency in meta-analyses. BMJ. 2003;327:557–60. 10.1136/bmj.327.7414.557. [DOI] [PMC free article] [PubMed] [Google Scholar]
- 44.Tobias A. Assessing the influence of a single study in the meta-analysis estimate. Stata Technical Bulletin. 1999;47:15–7. [Google Scholar]
- 45.Begg CB, Mazumdar M. Operating characteristics of a rank correlation test for publication bias. Biometrics. 1994;50:1088–101. [PubMed] [Google Scholar]
- 46.Sterne JA, Egger M. Funnel plots for detecting bias in meta-analysis: guidelines on choice of axis. J Clin Epidemiol. 2001;54:1046–55. 10.1016/s0895-4356(01)00377-8. [DOI] [PubMed] [Google Scholar]
- 47.Duval S, Tweedie R. Trim and fill: A simple funnel-plot-based method of testing and adjusting for publication bias in meta-analysis. Biometrics. 2000;56:455–63. 10.1111/j.0006-341x.2000.00455.x. [DOI] [PubMed] [Google Scholar]
- 48.Rao ML, Gross G, Strebel B, Braunig P, Huber G, Klosterkotter J. Serum amino acids, central monoamines, and hormones in drug-naive, drug-free, and neuroleptic-treated schizophrenic patients and healthy subjects. Psychiatry Res. 1990;34:243–57. 10.1016/0165-1781(90)90003-n. [DOI] [PubMed] [Google Scholar]
- 49.Das I, Khan NS, Puri BK, Hirsch SR. Elevated endogenous nitric oxide synthase inhibitor in schizophrenic plasma may reflect abnormalities in brain nitric oxide production. Neurosci Lett. 1996;215:209–11. 10.1016/0304-3940(96)12972-4. [DOI] [PubMed] [Google Scholar]
- 50.Celik C, Cayci T, Ozdemir B, Akgul EO, Zincir S, Balikci A, et al. Plasma asymmetric dimethylarginine (ADMA) concentrations in patients with first and multiple episode schizophrenia. Psychiatry Res. 2011;190:177–80. 10.1016/j.psychres.2011.06.003. [DOI] [PubMed] [Google Scholar]
- 51.He Y, Yu Z, Giegling I, Xie L, Hartmann AM, Prehn C, et al. Schizophrenia shows a unique metabolomics signature in plasma. Transl Psychiatry. 2012;2:e149. 10.1038/tp.2012.76. [DOI] [PMC free article] [PubMed] [Google Scholar]
- 52.Zincir S, Zincir SB, Doruk A, Erdem M, Celik C, Ak M, et al. Asymmetric dimethylarginine (ADMA) and treatment response relationship in male patients with first-episode schizophrenia: a controlled study. Psychiatry Res. 2014;220:76–80. 10.1016/j.psychres.2014.07.013. [DOI] [PubMed] [Google Scholar]
- 53.Jorgensen A, Knorr U, Soendergaard MG, Lykkesfeldt J, Fink-Jensen A, Poulsen HE, et al. Asymmetric dimethylarginine in somatically healthy schizophrenia patients treated with atypical antipsychotics: a case-control study. BMC Psychiatry. 2015;15:67. 10.1186/s12888-015-0455-4. [DOI] [PMC free article] [PubMed] [Google Scholar]
- 54.Misiak B, Wisniewski J, Fleszar MG, Frydecka D. Alterations in l-arginine metabolism in first-episode schizophrenia patients: Further evidence for early metabolic dysregulation. Schizophr Res. 2016;178:56–7. 10.1016/j.schres.2016.08.032. [DOI] [PubMed] [Google Scholar]
- 55.Nonaka-Hashida S, Sekine M, Ozeki Y, Fujii K, Akiyama K, Shimoda K, et al. Plasma concentrations of three methylated arginines, endogenous nitric oxide synthase inhibitors, in schizophrenic patients undergoing antipsychotic drug treatment. Psychiatry Res. 2016;238:203–10. 10.1016/j.psychres.2016.02.029. [DOI] [PubMed] [Google Scholar]
- 56.Telo S, Gurok MG. Asymmetric dimethylarginine (ADMA), 4-OH-nonenal and Vitamin E levels in chronic schizophrenic patients. Psychiatry Res. 2016;240:295–9. 10.1016/j.psychres.2016.04.047. [DOI] [PubMed] [Google Scholar]
- 57.Yang YJ, Xiong JW, Zhao Y, Zhan JQ, Chen HB, Yan K, et al. Increased plasma asymmetric dimethylarginine is associated with cognitive deficits in patients with schizophrenia. Psychiatry Res. 2016;246:480–4. 10.1016/j.psychres.2016.10.015. [DOI] [PubMed] [Google Scholar]
- 58.Kageyama Y, Kasahara T, Morishita H, Mataga N, Deguchi Y, Tani M, et al. Search for plasma biomarkers in drug-free patients with bipolar disorder and schizophrenia using metabolome analysis. Psychiatry Clin Neurosci. 2017;71:115–23. 10.1111/pcn.12461. [DOI] [PubMed] [Google Scholar]
- 59.Cao B, Wang D, Brietzke E, McIntyre RS, Pan Z, Cha D, et al. Characterizing amino-acid biosignatures amongst individuals with schizophrenia: a case-control study. Amino Acids. 2018;50:1013–23. 10.1007/s00726-018-2579-6. [DOI] [PubMed] [Google Scholar]
- 60.Leppik L, Kriisa K, Koido K, Koch K, Kajalaid K, Haring L, et al. Profiling of Amino Acids and Their Derivatives Biogenic Amines Before and After Antipsychotic Treatment in First-Episode Psychosis. Front Psychiatry. 2018;9:155 10.3389/fpsyt.2018.00155. [DOI] [PMC free article] [PubMed] [Google Scholar]
- 61.Yu ZM, Zhao Y, Zhan JQ, Luo T, Xiong JW, Yu B, et al. Treatment Responses of Cognitive Function and Plasma Asymmetric Dimethylarginine to Atypical Antipsychotic in Patients With Schizophrenia. Front Psychiatry. 2018;9:733 10.3389/fpsyt.2018.00733. [DOI] [PMC free article] [PubMed] [Google Scholar]
- 62.Garip B, Kayir H, Uzun O. l-Arginine metabolism before and after 10 weeks of antipsychotic treatment in first-episode psychotic patients. Schizophr Res. 2019;206:58–66. 10.1016/j.schres.2018.12.015. [DOI] [PubMed] [Google Scholar]
- 63.Safaei M, Akhondpoor Manteghi A, Shahini N, Mohammadpour AH. Comparison of serum levels of asymmetric dimethylarginine between patients who take two types of atypical anti psychotics. Med J Islam Repub Iran. 2019;33:114. 10.34171/mjiri.33.114. [DOI] [PMC free article] [PubMed] [Google Scholar]
- 64.Parksepp M, Leppik L, Koch K, Uppin K, Kangro R, Haring L, et al. Metabolomics approach revealed robust changes in amino acid and biogenic amine signatures in patients with schizophrenia in the early course of the disease. Sci Rep. 2020;10:13983. 10.1038/s41598-020-71014-w. [DOI] [PMC free article] [PubMed] [Google Scholar]
- 65.Ustundag MF, Ozcan H, Gencer AG, Yilmaz ED, Uğur K, Oral E, et al. Nitric oxide, asymmetric dimethylarginine, symmetric dimethylarginine and L-arginine levels in psychotic exacerbation of schizophrenia and bipolar disorder manic episode. Saudi Med J. 2020;41:38–45. 10.15537/smj.2020.1.24817. [DOI] [PMC free article] [PubMed] [Google Scholar]
- 66.Braun D, Schlossmann J, Haen E. Asymmetric dimethylarginine in psychiatric disorders. Psychiatry Res. 2021;300:113901. 10.1016/j.psychres.2021.113901. [DOI] [PubMed] [Google Scholar]
- 67.Mednova IA, Chernonosov AA, Kasakin MF, Kornetova EG, Semke AV, Bokhan NA, et al. Amino Acid and Acylcarnitine Levels in Chronic Patients with Schizophrenia: A Preliminary Study. Metabolites. 2021;11. 10.3390/metabo11010034. [DOI] [PMC free article] [PubMed]
- 68.Ma Q, Gao F, Zhou L, Fan Y, Zhao B, Xi W, et al. Characterizing serum amino acids in schizophrenic patients: Correlations with gut microbes. J Psychiatr Res. 2022;153:125–33. 10.1016/j.jpsychires.2022.07.006. [DOI] [PubMed] [Google Scholar]
- 69.Asatoor AM, Simenhoff ML. The origin of urinary dimethylamine. Biochim Biophys Acta. 1965;111:384–92. 10.1016/0304-4165(65)90048-6. [DOI] [PubMed] [Google Scholar]
- 70.Zeisel SH, DaCosta KA, Fox JG. Endogenous formation of dimethylamine. Biochem J. 1985;232:403–8. 10.1042/bj2320403. [DOI] [PMC free article] [PubMed] [Google Scholar]
- 71.Robbins RA, Grisham MB. Nitric oxide. Int J Biochem Cell Biol. 1997;29:857–60. 10.1016/s1357-2725(96)00167-7. [DOI] [PubMed] [Google Scholar]
- 72.Mangoni AA, Rodionov RN, McEvoy M, Zinellu A, Carru C, Sotgia S. New horizons in arginine metabolism, ageing and chronic disease states. Age Ageing. 2019;48:776–82. 10.1093/ageing/afz083. [DOI] [PubMed] [Google Scholar]
- 73.Morris SM Jr. Arginine Metabolism Revisited. J Nutr. 2016;146:2579S–86S. 10.3945/jn.115.226621. [DOI] [PubMed] [Google Scholar]
- 74.Liu P, Jing Y, Collie ND, Dean B, Bilkey DK, Zhang H. Altered brain arginine metabolism in schizophrenia. Transl Psychiatry. 2016;6:e871. 10.1038/tp.2016.144. [DOI] [PMC free article] [PubMed] [Google Scholar]
- 75.Karlsgodt KH, Sun D, Cannon TD. Structural and Functional Brain Abnormalities in Schizophrenia. Curr Dir Psychol Sci. 2010;19:226–31. 10.1177/0963721410377601. [DOI] [PMC free article] [PubMed] [Google Scholar]
- 76.Tellez-Merlo G, Morales-Medina JC, Camacho-Ábrego I, Juárez-Díaz I, Aguilar-Alonso P, de la Cruz F, et al. Prenatal immune challenge induces behavioral deficits, neuronal remodeling, and increases brain nitric oxide and zinc levels in the male rat offspring. Neuroscience. 2019;406:594–605. 10.1016/j.neuroscience.2019.02.018. [DOI] [PubMed] [Google Scholar]
- 77.Camacho-Abrego I, Gonzalez-Cano SI, Aguilar-Alonso P, Brambila E, la Cruz F, Flores G. Changes in nitric oxide, zinc and metallothionein levels in limbic regions at pre-pubertal and post-pubertal ages presented in an animal model of schizophrenia. J Chem Neuroanat. 2021;111:101889. 10.1016/j.jchemneu.2020.101889. [DOI] [PubMed] [Google Scholar]
- 78.Bringas ME, Morales-Medina JC, Flores-Vivaldo Y, Negrete-Diaz JV, Aguilar-Alonso P, León-Chávez BA. Clozapine administration reverses behavioral, neuronal, and nitric oxide disturbances in the neonatal ventral hippocampus rat. Neuropharmacology. 2012;62:1848–57. 10.1016/j.neuropharm.2011.12.008. [DOI] [PubMed] [Google Scholar]
- 79.Negrete-Díaz JV, Baltazar-Gaytán E, Bringas ME, Vazquez-Roque RA, Newton S, Aguilar-Alonso P, et al. Neonatal ventral hippocampus lesion induces increase in nitric oxide [NO] levels which is attenuated by subchronic haloperidol treatment. Synapse. 2010;64:941–7. 10.1002/syn.20835. [DOI] [PubMed] [Google Scholar]
- 80.Zamora R, Vodovotz Y, Billiar TR. Inducible nitric oxide synthase and inflammatory diseases. Mol Med. 2000;6:347–73. [PMC free article] [PubMed] [Google Scholar]
- 81.Flores-Gómez GD, Apam-Castillejos DJ, Juárez-Díaz I, Fuentes-Medel E, Díaz A, Tendilla-Beltrán H, et al. Aripiprazole attenuates the medial prefrontal cortex morphological and biochemical alterations in rats with neonatal ventral hippocampus lesion. J Chem Neuroanat. 2023;132:102316. 10.1016/j.jchemneu.2023.102316. [DOI] [PubMed] [Google Scholar]
- 82.Palacios M, Padron J, Glaria L, Rojas A, Delgado R, Knowles R, et al. Chlorpromazine inhibits both the constitutive nitric oxide synthase and the induction of nitric oxide synthase after LPS challenge. Biochem Biophys Res Commun. 1993;196:280–6. 10.1006/bbrc.1993.2246. [DOI] [PubMed] [Google Scholar]
- 83.Kopaliani I, Jarzebska N, Billoff S, Kolouschek A, Martens-Lobenhoffer J, Bornstein SR, et al. Overexpression of dimethylarginine dimethylaminohydrolase 1 protects from angiotensin II-induced cardiac hypertrophy and vascular remodeling. Am J Physiol Heart Circ Physiol. 2021;321:H825–H38. 10.1152/ajpheart.00064.2021. [DOI] [PubMed] [Google Scholar]
- 84.Doman AJ, Tommasi S, Perkins MV, McKinnon RA, Mangoni AA, Nair PC. Chemical similarities and differences among inhibitors of nitric oxide synthase, arginase and dimethylarginine dimethylaminohydrolase-1: Implications for the design of novel enzyme inhibitors modulating the nitric oxide pathway. Bioorg Med Chem. 2022;72:116970 10.1016/j.bmc.2022.116970. [DOI] [PubMed] [Google Scholar]
- 85.Pham TN, Liagre B, Girard-Thernier C, Demougeot C. Research of novel anticancer agents targeting arginase inhibition. Drug Discov Today. 2018;23:871–8. 10.1016/j.drudis.2018.01.046. [DOI] [PubMed] [Google Scholar]
Associated Data
This section collects any data citations, data availability statements, or supplementary materials included in this article.