Abstract
Background
This study investigates the integration of Artificial Intelligence (AI) in compensating the lack of time-of-flight (TOF) of the GE Omni Legend PET/CT, which utilizes BGO scintillation crystals.
Methods
The current study evaluates the image quality of the GE Omni Legend PET/CT using a NEMA IQ phantom. It investigates the impact on imaging performance of various deep learning precision levels (low, medium, high) across different data acquisition durations. Quantitative analysis was performed using metrics such as contrast recovery coefficient (CRC), background variability (BV), and contrast to noise Ratio (CNR). Additionally, patient images reconstructed with various deep learning precision levels are presented to illustrate the impact on image quality.
Results
The deep learning approach significantly reduced background variability, particularly for the smallest region of interest. We observed improvements in background variability of 11.8, 17.2, and 14.3 for low, medium, and high precision deep learning, respectively. The results also indicate a significant improvement in larger spheres when considering both background variability and contrast recovery coefficient. The high precision deep learning approach proved advantageous for short scans and exhibited potential in improving detectability of small lesions. The exemplary patient study shows that the noise was suppressed for all deep learning cases, but low precision deep learning also reduced the lesion contrast (about −30), while high precision deep learning increased the contrast (about 10).
Conclusion
This study conducted a thorough evaluation of deep learning algorithms in the GE Omni Legend PET/CT scanner, demonstrating that these methods enhance image quality, with notable improvements in CRC and CNR, thereby optimizing lesion detectability and offering opportunities to reduce image acquisition time.
Keywords: Time of flight, Contrast recovery coefficient, Background variability, Contrast to noise ratio, Deep learning, GE Omni Legend
Background
Positron emission tomography (PET) takes a leading role in the early detection, precise characterization, and accurate staging of tumors. PET/CT scanners, by integrating diverse sets of data, play a pivotal role in formulating treatment strategies across a wide range of applications, including traditional uses like disease staging and physiological studies, cardiovascular disease assessment, drug development, and emerging fields such as theranostics [1–4].
The efficacy of PET systems largely hinges on the characteristics and arrangement of their detection components, which consist of scintillation crystals coupled to photomultipliers. In recent years, most PET scanners available on the market have been manufactured using lutetium-(yttrium) oxyorthosilicate (L(Y)SO) crystals. These crystals are chosen for their excellent timing resolution, which enhances the time-of-flight (TOF) capabilities of the scanners [1, 5, 6]. Nonetheless, the push towards improving spatial resolution and overall sensitivity of PET systems continues to drive research [7, 8]. Efforts to boost scanner sensitivity have included expanding the axial field of view (AFOV) and re-evaluating alternative scintillation materials. Bismuth germanium oxide (BGO) is a notable example, while other materials currently used in the market include sodium iodide (NaI) and gadolinium oxyorthosilicate (GSO), though these are less common [9, 10]. BGO, known for its superior stopping power, has been shown to offer increased sensitivity over L(Y)SO [11], a factor that has been leveraged by GE in their Omni Legend PET/CT system. However, BGO-based PET systems lack TOF capability due to the limited timing resolution of the BGO scintillation crystal.
Moreover, the advent of artificial intelligence (AI) has ushered in new opportunities for innovation across multiple fields, including medical imaging [12]. AI’s integration into PET technology promises to revolutionize how we approach diagnostics and treatment planning, marking a significant leap forward in medical science. The application of AI can enhance diagnostic accuracy, improved efficiency in image processing, and results in tailored patient care via sophisticated algorithmic analyses [13–15].
Recently, GE introduced the GE Omni Legend PET/CT tomograph [16, 17]. This system employs BGO crystals, which are known for their high stopping power and consequently high sensitivity. [18–20]. The camera design includes some of the traditional limitations of BGO crystals, such as their lack of inherent TOF imaging capabilities. However, integration of AI technologies for image post-processing contributes to producing higher-quality scans compared to conventional non-TOF images [21, 22]. The scanner features a relatively long AFOV of 32 cm, which can be expanded in the future to 64 cm, or 128 cm [17].
Assessing the imaging capabilities of the GE Omni Legend PET/CT scanner, especially through image quality phantom measurements, becomes crucial for gauging diagnostic precision [23]. Therefore, the principal aim of this investigation is to conduct a thorough assessment of the GE Omni Legend PET/CT scanner’s imaging performance. Additionally, this study places a significant emphasis on examining the broad spectrum of reconstruction parameters available with the scanner. This detailed comparison aims to identify the optimal set of parameters that maximize the GE Omni Legend scanner’s ability to deliver the most accurate and high-definition images.
Methods
The PET-CT scanner
The PET-CT scanner used for this evaluation is the Omni Legend from GE Healthcare installed in June 2023 in the University Hospital of Ghent, UZ Ghent (Fig. 1).
Fig. 1.
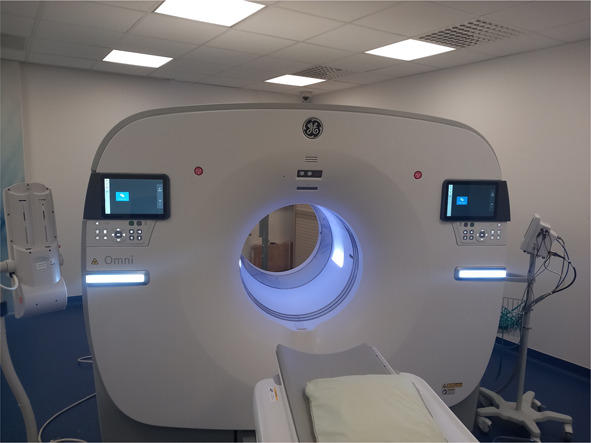
GE Omni Legend 32, operational at the University Hospital of Ghent
The PET component consists of 6 detector rings each containing 22 detector units resulting in an axial field of view (AFOV) of 32 cm. Within each detector unit there are 4 blocks, each containing 6 x 12 BGO crystals coupled to 3 x 6 SiPMs (6 x 6 mm2 each). The use of BGO results in a sensitivity of 47.03 cps/kBq at the center of the field of view (FOV)[16]. BGO scintillation crystals have relatively slow scintillation decay times compared to other scintillation materials like lutetium oxyorthosilicate (LSO) [24]. This slower scintillation decay time results in photons reaching the SiPMs over a longer time-frame, resulting in a slower pile-up of the SiPM signals and thereby reducing the time resolution for the detector. This complicates the precise temporal determination of gamma-ray emissions along the line of response [25]. Therefore, the system is not able to perform TOF measurements.
The deep learning algorithm implemented on the GE Omni was trained on hundreds of TOF datasets from different sites. It uses a convolutional network, more specifically a residual U-Net architecture, to predict the TOF BSREM (block sequential regularized expectation maximization) image from the non-TOF BSREM reconstruction [22]. Three separate models were trained with differing levels of contrast-enhancement-to-noise trade off: low precision (LP) for more noise reduction, medium precision (MP) as a middle ground, and high precision (HP) for better contrast enhancement. These three models were obtained by training on BSREM reconstructions with different ? parameters, where a higher ? value corresponds to a higher degree of regularization (and therefore, more noise reduction but lower contrast), and vice versa. Therefore, the LP model was trained on higher ? values, and the HP model on lower ? values. When the model is used for inference on the GE Omni, it is applied as a post-processing step after the conventional non-TOF BSREM reconstruction. Any of the three models can be used with any ? value, but it is logical to use a ? value within the range for which the model was trained.
Phantom study
For this study we used the NEMA IQ phantom featuring six spheres with diameters of 10, 13, 17, 22, 28 and 37 mm, along with a lung insert. The phantom was filled according to the NEMA NU 2-2018 Image Quality test procedure with fluorodeoxyglucose F18 (FDG), using a total activity of 20.38 MBq [26]. The activity concentration ratio between spheres and background was 4:1. The phantom was scanned using two bed positions with 25% overlap, with the spheres positioned in the overlap region. This was done three consecutive times, each with a duration of 90 s/bed position, to increase statistical confidence. Data acquisition was done in list mode to allow reconstruction of shorter acquisition times (60, 30 and 10 s/bed position). Reconstruction of the images was done with the software of the GE Omni Legend, using an iterative reconstruction (VUE Point HD) with Bayesian penalized likelihood (Q.Clear) and Precision Deep Learning (PDL), using a matrix size of 384x384 ( pixels) and a slice thickness of 2.07 mm. The choice of the beta value of Q.Clear depended on the specific deep learning method applied, with values of 350, 650 and 850 for High Precision Deep Learning (HPDL), Medium Precision Deep Learning (MPDL) and Low Precision Deep Learning (LPDL), respectively. For comparative analysis, No Deep Learning (NDL) images were also made for Q.Clear beta values of 350, 650 and 850. These values were within the midrange suggested by GE for each of the methods. On each of the reconstructions, regions of interest (ROIs) were drawn using Amide [27]. On the central slice six ROIs with diameters of 10, 13, 17, 22, 28 and 37 mm were drawn on the spheres. Background ROIs were drawn on the central slice and at ± 1 cm and ± 2 cm from the central slice, according to NEMA NU 2-2018 specifications. Each sphere size had 12 background ROIs per slice, resulting in a total of 60 background ROIs per sphere size. Image quality was determined using the contrast recovery coefficient (CRC), background variablity (BV) and contrast-to-noise ratio (CNR). These values were then averaged over the three acquisitions.
The CRC for sphere ’j’ was determined as:
where represents the average counts in ROI of sphere ’j’, is the average counts in background ROIs with same size as sphere ’j’ and represent the activity concentration ratio between the hot spheres and the background.
Percent background variability was calculated as:
where is the standard deviation of the 60 background ROIs.
The CNR was calculated as:
where the and are the mean pixel values of two distinct ROI in an image, and and are the square root of the average of their variances. This metric effectively measures the distinguishability of features in the presence of noise, with higher CNR values indicating superior image quality and contrast resolution [28]. This analysis provides information about the contrast recovery, background variability and noise characteristics of the image. By calculating these characteristics, we aimed to evaluate the impact of different deep learning settings with various precisions offered by the tomograph under investigation on its image quality.
Patient study
To compare the performance of each reconstruction condition in the GE Omni PET/CT, two patients were selected: a twenty years old male with a body mass index (BMI) of and a twenty nine years old female with a BMI of . Both patients were diagnosed with a lung nodule. The acquired data from each patient were reconstructed using various deep learning precision levels. The reconstructed images were visualized using AMIDE software, which enabled the plotting of line intensity profiles over the nodule in the transverse (T), coronal (C), and sagittal (S) planes. This approach allowed for a detailed evaluation of the imaging performance across different reconstruction techniques and their impact on nodule visualization.
Results
NEMA image quality phantom
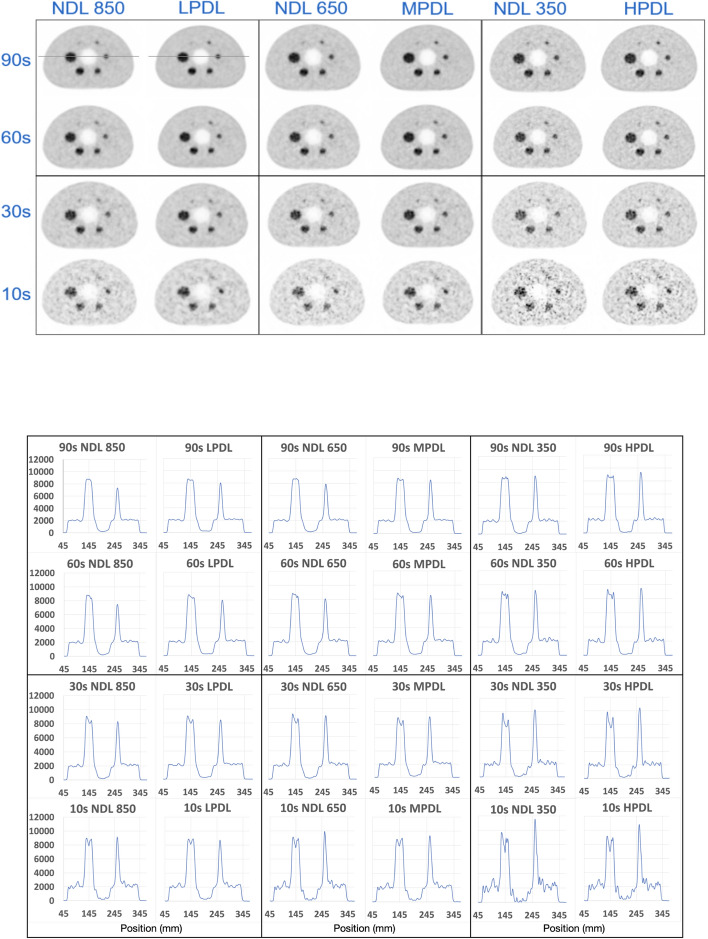
In this section, we present the experimental results, offering insights into the relationship between images processed using deep learning and those without deep learning. Figure 2 illustrates the image quality phantom reconstructions with various DL methods and various acquisition times (90, 60, 30, and 10 s).
Fig. 2.
Transverse slice of the IQ reconstructed images using various DL methods for different scan times (upper part). The example line profiles has been illustrated on the NDL 850 and LPDL at 90 s. The corresponding line intensity profiles for each image are shown (lower part)
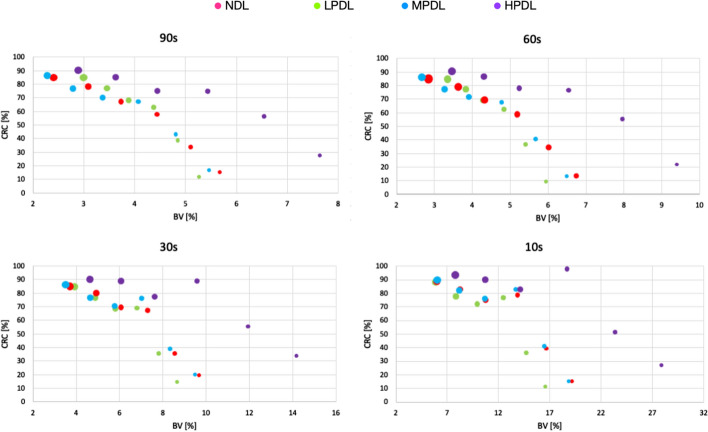
In Fig. 3 we present the CRC as a percentage, plotted against the background variability also expressed as a percentage. This graph illustrates the performance of different deep learning modes and non-deep learning mode for several acquisition times.
Fig. 3.
CRC as a function of BV across different scan duration for various deep learning types.The size of the circle correspond with the diameter of the sphere in the IQ phantom
Each data point on the graphs corresponds to the size of the NEMA IQ phantom’s sphere. It is clear that, for ROIs of the same size, the deep learning algorithm leads to an improvement of the background variability compared to the non-deep learning mode. Furthermore, as sphere size increases, BV decreases while CRC increases. For shorter acquisition times the BV increases but the CRC stays approximately the same. For the smallest spheres (10, 13, 17 mm) the LPDL results in the lowest BV. However, for optimal contrast recovery coefficient, the HPDL outperforms the others.
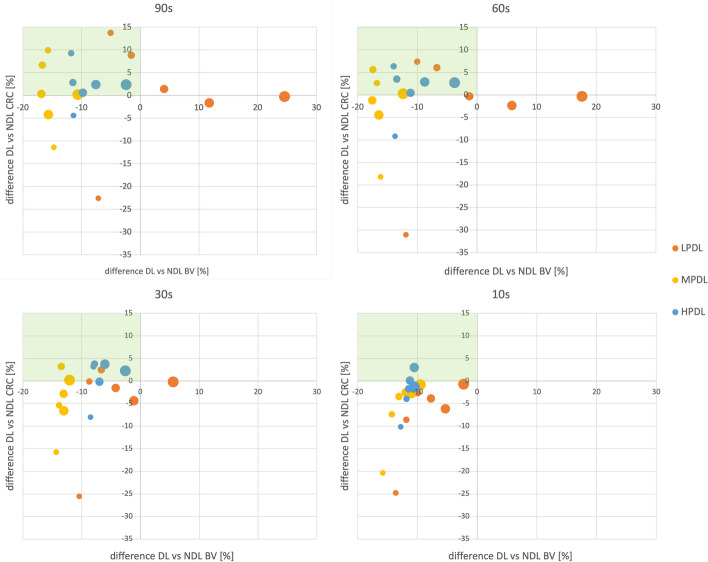
To gain better insights in the relative performance of the different deep learning modes, the differences in CRC and BV between each deep learning mode and its corresponding non-deep learning mode are analyzed. The results are shown in Fig. 4 for different acquisition times. Again, the size of the data points corresponds to the size of the NEMA IQ phantom’s sphere sizes. To highlight the zones with a reduction in background variability and an increase in contrast recovery coefficient, these regions are shaded with a green background. HPDL consistently exhibits the best performance, achieving a decrease in BV and an increase in CRC for almost every sphere size. It is worth noting that the 10 mm sphere always falls outside of the desired zone, always showing a decrease in CRC. Additionally, the MPDL mode shows the highest decrease of BV, while LPDL has an increase in BV, particularly for larger sphere sizes and longer acquisition times.
Fig. 4.
% difference CRC in function of % difference BV between different deep learning types (LPDL, MPDL, HPDL) and no deep learning (NDL)
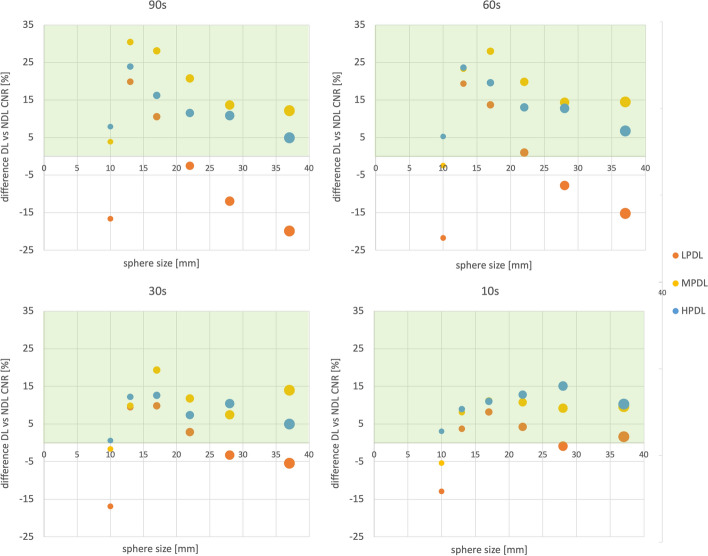
The difference in CNR between deep learning and non-deep learning algorithms given as a percentage is displayed in Fig. 5, with larger datapoints corresponding to larger sphere sizes. For larger spheres and larger acquisition times MPDL results in the highest increase in contrast to noise ratio. LPDL decreases CNR most of the time. We note that HPDL always has the highest increase in CNR for the smallest sphere. LPDL always performs the worst.
Fig. 5.
Difference in CNR between DL and non-deep learning algorithms given in percentage. The desired region is indicated with a green background
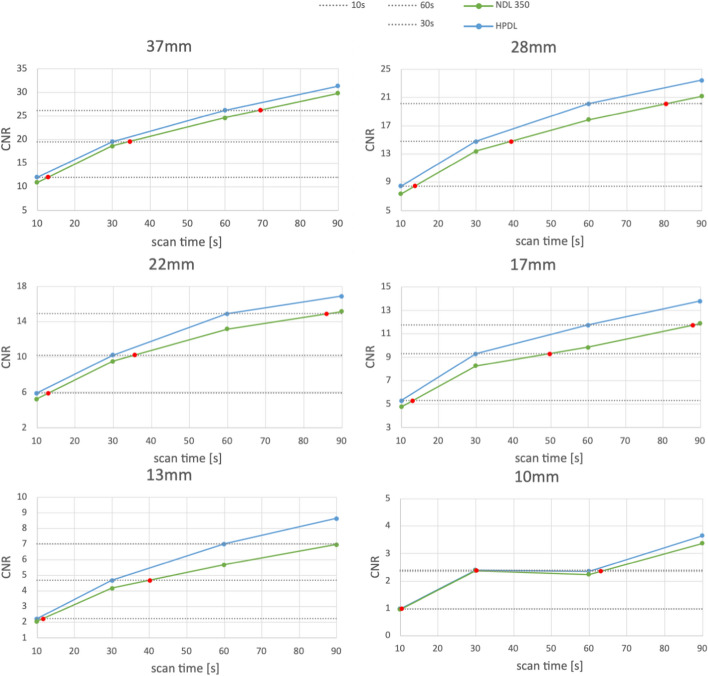
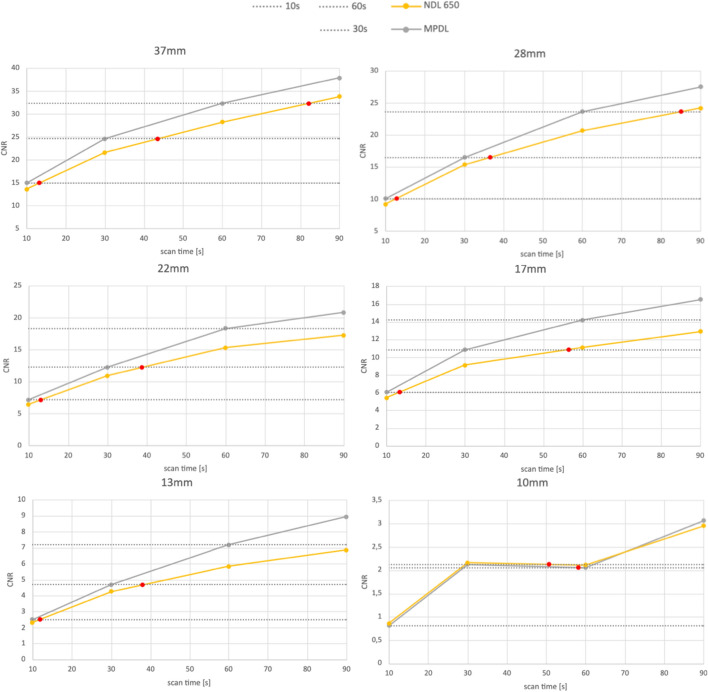
To asses the impact of acquisition time on the different deep learning modes, CNR was evaluated as a function of scan time for HPDL and MPDL. The results are displayed in Figs. 6 and 7, respectively. In these figures, the red dots indicate the scan time required to achieve the same CNR as HPDL or MPDL if no DL was used. A detailed breakdown of these results can be found in Table 1 and Table 2. In these tables a summary of scan times needed to attain the same CNR as HPDL or MPDL for scan durations of 60, 30 and 10 s is provided. The relative increase in scan time is indicated in parentheses. For instance, when considering a scan duration of 60 s with HPDL, an equivalent CNR would require a scan duration of 69.45 s without deep learning - an increase of 15.75%. A first observation tells us that the deep learning modes increase the CNR in comparison to non-deep learning.
Fig. 6.
CNR in function of scan time for HPDL and NDL. The red dots indicate the scan time necessary for the NDL to reach the same CNR as HPDL
Fig. 7.
CNR in function of scan time for MPDL and NDL. The red dots indicate the scan time necessary for the NDL to reach the same CNR as MPDL
Table 1.
Scan time necessary (in seconds) to achieve same CNR as HPDL for scan duration of 60, 30 and 10 s. Between parentheses the relative increase in scan time is displayed
| HPDL ->NDL | 37 mm | 28 mm | 22 mm | 17 mm | 13 mm | 10 mm |
|---|---|---|---|---|---|---|
| 60 s |
69.45 (15.75%) |
80.51 (34.19%) |
86.08 (43.47%) |
88.00 (46.66%) |
90.74 (51.23%) |
63.08 (55.46%) |
| 30 s |
34.68 (15.59%) |
39.31 (31.02%) |
35.70 (19.01%) |
49.84 (66.12%) |
40.18 (33.94%) |
30.02 (40.14%) |
| 10 s |
12.91 (29.14%) |
13.68 (36.83%) |
13.11 (31.09%) |
12.97 (29.70%) |
11.71 (17.07%) |
10.41 (13.41%) |
Table 2.
Scan time necessary (in seconds) to achieve same CNR as MPDL for scan duration of 60, 30 and 10 s. Between parentheses the relative increase in scan time is displayed
| MPDL ->NDL | 37 mm | 28 mm | 22 mm | 17 mm | 13 mm | 10 mm |
|---|---|---|---|---|---|---|
| 60 s |
82.09 (36.82%) |
84.98 (41.63%) |
105.05 (76.76%) |
111.32 (85.55%) |
99.24 (65.40%) |
58.14 (61.26%) |
| 30 s |
43.59 (45.31%) |
36.48 (21.61%) |
38.88 (29.60%) |
38.05 (88.13%) |
50.67 (26.85%) |
50.67 (49.84%) |
| 10 s |
13.28 (32.84%) |
12.75 (27.47%) |
13.08 (30.79%) |
13.32 (33.22%) |
11.92 (19.21%) |
9.29 (12.18%) |
Patient
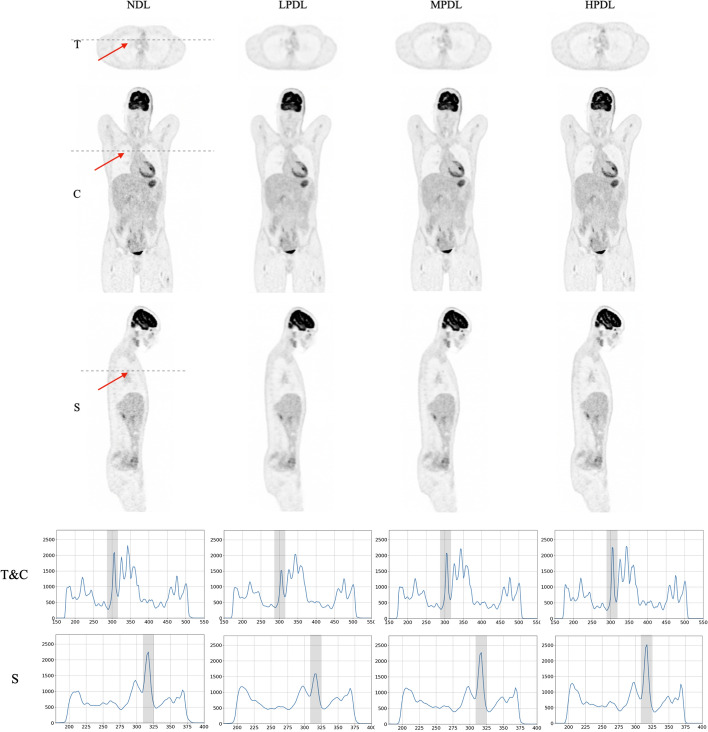
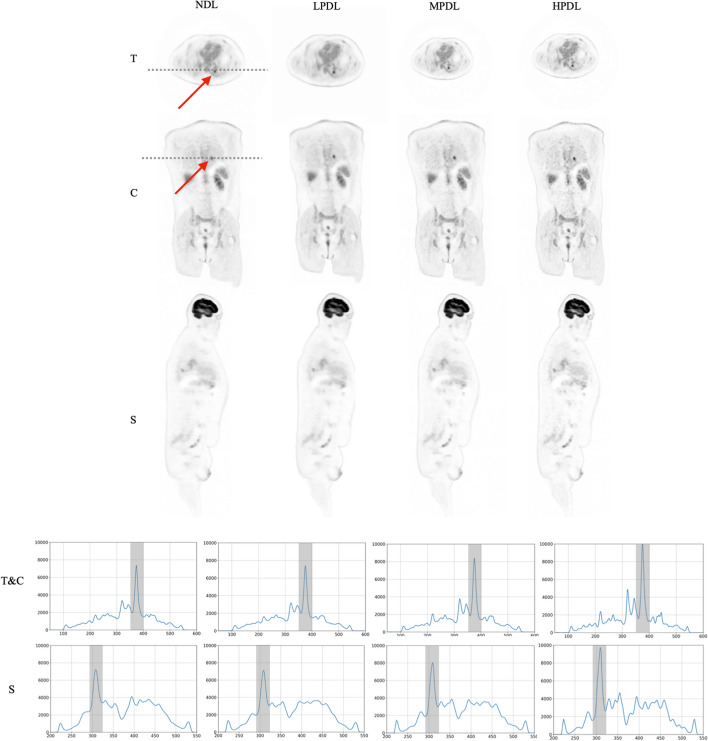
Reconstructed images of the lung nodules from the selected patients, utilizing various precision levels of deep learning methods on the GE Omni Legend, are presented in Figs. 8 and 9. The comparison highlights the impact of different reconstruction techniques on nodule visualization, with line intensity profiles plotted in the transverse, coronal, and sagittal planes.
Fig. 8.
Illustration of a male patient with the BMI of 20 (), with various deep learning settings in transverse (T), coronal (C) and sagittal (S) views. Corresponding line intensity profiles over the tumor (indicated by red arrow and marked with gray bar on the profiles) are shown in the two lower rows
Fig. 9.
Illustration of the patient with the BMI of 35 (), with various deep learning settings in transverse (T), coronal (C) and sagittal (S) views. Corresponding line intensity profiles over the tumor (indicated by red arrow and marked with gray bar on the profiles) are shown in the two lower rows
To assess the image quality across different orientations and reconstruction precisions, the line intensity profiles for a representative patient in both transverse and sagittal views are illustrated in Fig. 8. These profiles exhibit trends consistent with those observed in Fig. 2, demonstrating the application of the GE Omni Legend reconstruction algorithm at low, medium, and high precision levels of deep learning. The patient study indicates that noise levels were reduced across all deep learning approaches when compared to the results from the NDL. However, LPDL led to a decrease in the lesion’s contrast, whereas in MPDL, the contrast of the lesion remained similar and the HPDL profiles demonstrate an enhancement in lesion contrast in comparison to the NDL results.
Discussion
The primary objective of this study was to assess the performance of the GE Omni Legend PET/CT across various deep learning methods characterized by low, medium, and high precision levels. To achieve this, the NEMA IQ phantom, recognized as a standard and universal tool, was employed for evaluation purposes.
Impact of DL on BV and CRC
Our study revealed consistent improvements in background variability when applying deep learning algorithms, indicating their effectiveness in reducing background noise and enhancing overall image quality. For the smallest spheres, LPDL results in greatest reduction in BV, as expected, since the LPDL model was trained for noise reduction. As sphere size increases, a decrease in BV coupled with an increase in CRC can be observed, indicating that the DL algorithms enhance image contrast and recovery in larger structures. For the longer acquisition times, HPDL seems to outperform the other DL methods concerning CRC for most sphere sizes. This too can be explained by the fact that HPDL was trained for contrast enhancement. However, MPDL, advertised as a trade-off between contrast enhancement and noise reduction, demonstrated the greatest reduction of BV and the greatest improvement in CNR, at least for all except the smallest spheres. Notably, for the 10-second acquisition time, HPDL showed the best CNR improvement. These findings indicate that for the detection of small lesions, the HPDL emerges as the optimal choice.
We note that the DL method was developed to improve image quality by using non-TOF (low-quality) and TOF (high-quality) image pairs for training. One of the main (visual) differences between TOF and non-TOF images, is the improved signal-to-noise ratio of TOF reconstructions. Based on our CNR results, the DL algorithms do indeed succeed in improving the signal-to-noise ratio. However, whether or not the output images are indistinguishable from true TOF images, is another question, which would likely require an observer study with nuclear physicists, which is out of the scope for this study.
Effect of acquisition time on DL methods
The effect of acquisition time on CNR was investigated, focusing on HPDL and MPDL. The LPDL was excluded from this analysis due to its primary function of background noise reduction, which resulted in higher CNR for NDL at the same acquisition times for certain spheres. The results demonstrate that HPDL and MPDL consistently outperformed NDL, regardless of acquisition time, highlighting the efficiency of DL in reducing image acquisition time while maintaining image quality. Specifically, NDL required longer acquisition times to achieve the same CNR as HPDL and MPDL. These findings emphasize the practical advantage of DL, offering the potential for faster and more efficient diagnostics.
Patients
The study included two patients, a 20-year-old male with a BMI of 20 kg/m² and the 29-year-old female with a BMI of 35 kg/m², to evaluate the effectiveness of the GE Omni Legend’s precision deep learning reconstruction methods in enhancing image quality. Analysis of the reconstructed images revealed a consistent reduction in noise across all deep learning settings compared to the NDL method. However, it was observed that while the LPDL approach resulted in decreased lesion contrast, the MPDL method maintained similar contrast levels to NDL, and the HPDL method improved lesion contrast. These findings highlight the potential of HPDL algorithms in optimizing image clarity and contrast, particularly in patients with varying body compositions, underscoring the importance of selecting appropriate precision settings for enhanced diagnostic accuracy.
Conclusion
In this study a comprehensive evaluation of the deep learning algorithms of the Omni Legend scanner from GE Healthcare was conducted. We first examined the performance of three deep learning models - LPDL, MPDL and HPDL - in comparison to non-deep learning methods. Through the analysis of contrast recovery coefficient, background variability and contrast-to-noise ratio consistent improvements in image quality were observed when DL methods were applied. HPDL exhibited superior CRC, demonstrating its efficacy in contrast enhancement. MPDL, on the other hand, struck a balance between contrast enhancement and noise reduction, yielding significant improvements in CNR. Our results highlight the suitability of HPDL for the detection of small lesions. For larger structures MPDL proved to be an effective choice, offering a favorable trade-off between contrast enhancement and noise reduction. Furthermore, the influence of acquisition time on DL methods was investigated, focusing on HPDL and MPDL. The results revealed that DL outperformed NDL and could lead to reduced image acquisition time while preserving image quality.
The selection among these approaches for clinical use needs to be determined by qualified specialists, who can consider all relevant aspects of the scan in their decision-making process.
Acknowledgements
Not applicable.
Author contributions
MD and AV performed the majority of Experiments, defining the measurments, and providing of the manuscript. JM was responsible for the pre-and post-processing of the data and revised the manuscript. YD and SV guided the project and revised the final manuscript.
Funding
Not applicable.
Availibility of data and materials
The data used and/or analysed during the current study are available from the corresponding author upon request.
Declarations
Ethics approval and consent to participate
All procedures performed in studies involving human participants were in accordance with the ethical standards of the institutional and/or national research committee and with the 1964 Declaration of Helsinki and its later amendments or comparable ethical standards. Written informed consent was obtained from all individual participants included in the study.
Consent for publication
Not applicable.
Competing interests
Dr. Stefaan Vandenberghe is the Editor in Chief of the journal of EJNMMI Physics.
Footnotes
Publisher's Note
Springer Nature remains neutral with regard to jurisdictional claims in published maps and institutional affiliations.
Meysam Dadgar and Amaryllis Verstraete contributed equally to this work.
References
- 1.Vandenberghe S, Moskal P, Karp J. State of the art in total body pet. EJNMMI Phys. 2020;7:1–33. [DOI] [PMC free article] [PubMed] [Google Scholar]
- 2.Basu S, Kwee T, Surti S, Akin E, Yoo D, Alavi A. Fundamentals of pet and pet/ct imaging. Ann N Y Acad Sci. 2011;1228:1–18. [DOI] [PubMed] [Google Scholar]
- 3.Gill B, Pai S, McKenzie S, Beriwal S. Utility of pet for radiotherapy treatment planning. PET Clin. 2015;10:541–54. [DOI] [PubMed] [Google Scholar]
- 4.Specht L, Berthelsen A. Pet/ct in radiation therapy planning. Semin Nucl Med. 2018;48:67–75. [DOI] [PubMed] [Google Scholar]
- 5.Gundacker S, Auffray E, Pauwels K, Lecoq P. Measurement of intrinsic rise times for various l(y)so and luag scintillators with a general study of prompt photons to achieve 10 ps in tof-pet. Phys Med Biol. 2016;61:2802–37. [DOI] [PubMed] [Google Scholar]
- 6.Cates J, Levin C. Evaluation of a clinical tof-pet detector design that achieves ⩽100 ps coincidence time resolution. Phys Med Biol. 2018;63: 115011. [DOI] [PMC free article] [PubMed] [Google Scholar]
- 7.Surti S, Viswanath V, Daube-Witherspoon M, Conti M, Casey M, Karp J. Benefit of improved performance with state-of-the art digital pet/ct for lesion detection in oncology. J Nucl Med. 2020;61:1684–90. [DOI] [PMC free article] [PubMed] [Google Scholar]
- 8.Layden C, Klein K, Matava W, Sadam A, Abouzahr F, Proga M, Majewski S, Nuyts J, Lang K. Design and modeling of a high resolution and high sensitivity pet brain scanner with double-ended readout. Biomed Phys Eng Express. 2022;8:2. [DOI] [PubMed] [Google Scholar]
- 9.Spencer B, Berg E, Schmall J, Omidvari N, Leung E, Abdelhafez Y, et al. Performance evaluation of the uexplorer total-body pet/ct scanner based on nema nu 2–2018 with additional tests to characterize pet scanners with a long axial field of view. J Nucl Med. 2021;62:6–861870. [DOI] [PMC free article] [PubMed] [Google Scholar]
- 10.Kennedy J, Palchan-Hazan T, Maronnier Q, Caselles O, Courbon F, Levy M, Keidar Z. An extended bore length solid-state digital-bgo pet/ct system: design, preliminary experience, and performance characteristics. Eur J Nucl Med Mol Imaging. 2023;51:954–64. [DOI] [PubMed] [Google Scholar]
- 11.Du J, Ariño-Estrada G, Bai X, Cherry S. Performance comparison of dual-ended readout depth-encoding pet detectors based on bgo and lyso crystals. Phys Med Biol. 2020;65(23): 235030. [DOI] [PMC free article] [PubMed] [Google Scholar]
- 12.Najjar R. Redefining radiology: a review of artificial intelligence integration in medical imaging. Diagnostics (Basel). 2023;13:17–2760. [DOI] [PMC free article] [PubMed] [Google Scholar]
- 13.Gore J. Artificial intelligence in medical imaging. Magn Reson Imaging. 2020;68:1–4. [DOI] [PubMed] [Google Scholar]
- 14.Decuyper M, Maebe J, Van Holen R, Vandenberghe S. Artificial intelligence with deep learning in nuclear medicine and radiology. EJNMMI Phys. 2021;8:1–81. [DOI] [PMC free article] [PubMed] [Google Scholar]
- 15.Wei L, El Naqa I. Artificial intelligence for response evaluation with pet/ct. Semin Nucl Med. 2021;51:157–69. [DOI] [PMC free article] [PubMed] [Google Scholar]
- 16.Yamagishi S, Miwa K, Kamitaki S, Anraku K, Sato S, Yamao T, Kubo H, Miyaji N, Oguchi K. Performance characteristics of a new-generation digital bismuth germanium oxide pet/ct system, omni legend 32, according to nema nu 2–2018 standards. J Nucl Med. 2023;64:1990–7. [DOI] [PubMed] [Google Scholar]
- 17.GE Omni Legend. https://www.gehealthcare.com/products/molecular-imaging/pet-ct/omni-legend
- 18.Du J. Performance of dual-ended readout pet detectors based on bgo arrays and baso4 reflector. IEEE Trans Radiat Plasma Med Sci. 2022;6:522–8. [DOI] [PMC free article] [PubMed] [Google Scholar]
- 19.Dadgar M, Parzych S, Baran J, et al. Comparative studies of the sensitivities of sparse and full geometries of total-body pet scanners built from crystals and plastic scintillators. EJNMMI Phys. 2023;10:62. [DOI] [PMC free article] [PubMed] [Google Scholar]
- 20.Dadgar M, Maebe J, Abi Akl M, et al. A simulation study of the system characteristics for a long axial fov pet design based on monolithic bgo flat panels compared with a pixelated lso cylindrical. EJNMMI Phys. 2023;10(1):75. [DOI] [PMC free article] [PubMed] [Google Scholar]
- 21.Vandenberghe S, Mikhaylova E, D’Hoe E, Mollet P, Karp J. Recent developments in time-of-flight pet. EJNMMI Phys. 2016;3:1–3. [DOI] [PMC free article] [PubMed] [Google Scholar]
- 22.Mehranian A, Wollenweber S, Walker M, Bradley KM, et al. Deep learning-based time-of-flight (tof) image enhancement of non-tof pet scans. Eur J Nucl Med Mol Imaging. 2022;49:3740–3749. [DOI] [PMC free article] [PubMed] [Google Scholar]
- 23.Lu S, Zhang P, Li C, Sun J, Liu W, Zhang P. A nim pet/ct phantom for evaluating the pet image quality of micro-lesions and the performance parameters of ct. BMC Med Imaging. 2021;21:1–165. [DOI] [PMC free article] [PubMed] [Google Scholar]
- 24.Zatcepin A, Ziegler S. Detectors in positron emission tomography. Z Med Phys. 2023;33:4–12. [DOI] [PMC free article] [PubMed] [Google Scholar]
- 25.Lee D, Cherry S, Kwon S. Colored reflectors to improve coincidence timing resolution of bgo-based time-of-flight pet detectors. Phys Med Biol. 2023;68:18. [DOI] [PMC free article] [PubMed] [Google Scholar]
- 26.Performance Measurements of Positron Emission Tomographs (PET). https://www.nema.org/standards/view/Performance-Measurements-of-Positron-Emission-Tomographs
- 27.AMIDE: Amide’s a Medical Imaging Data Examiner. URL: https://https://amide.sourceforge.net
- 28.Yan J, Schaefferkoette J, Conti M, Townsend D. A method to assess image quality for low-dose pet: analysis of snr, cnr, bias and image noise. Cancer Imaging. 2016;16:1–26. [DOI] [PMC free article] [PubMed] [Google Scholar]
Associated Data
This section collects any data citations, data availability statements, or supplementary materials included in this article.
Data Availability Statement
The data used and/or analysed during the current study are available from the corresponding author upon request.


