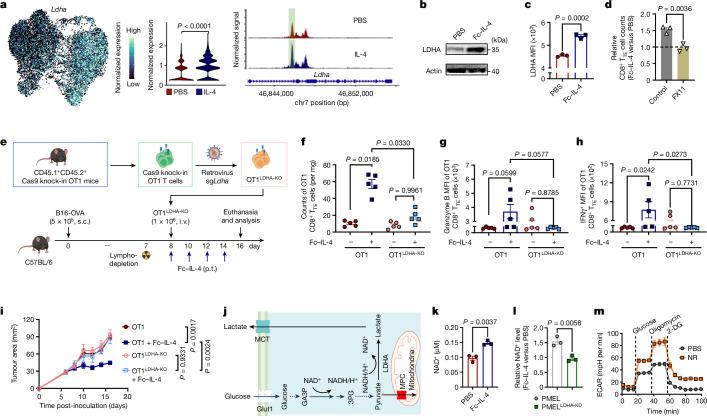
Fig. 5. Fc–IL-4 promotes LDHA-mediated glycolysis and cellular NAD+ levels of CD8+ TTE cells.
a, Expression of Ldha on the joint UMAP in Fig. 4i and pseudo-bulk chromatin accessibility tracks in the genomic region of Ldha. The enhancer element predicted by ENCODE is highlighted in green. b,c, Western blot (b) and flow cytometry (c) analyses of LDHA expression in ex vivo-induced CD8+ TTE cells with or without treatment of Fc–IL-4 (n = 3 biological replicates). d, Relative counts of Fc–IL-4-treated ex vivo-induced CD8+ TTE cells normalized by those in the PBS group with or without FX11 (n = 3 biological replicates). e–i, Mice bearing B16-OVA tumours received ACT of activated WT OT1 or OT1LDHA-KO T cells (1 × 10⁶, i.v.) 1 day after lymphodepletion, followed by treatment with Fc–IL-4 (20 µg, p.t.) or PBS every other day for four doses (n = 5 animals). Shown are the experimental timeline (e), counts (f), granzyme B MFI (g) and IFNγ MFI (h) of tumour-infiltrating OT1 CD8+ TTE cells, and average tumour growth curves (i). j, Schematic illustration of LDHA-mediated NAD+/NADH recycling. k, Cellular NAD+ level of ex vivo-induced CD8+ TTE cells with or without treatment of Fc–IL-4 (n = 3 biological replicates). l, Relative NAD+ levels in Fc–IL-4-treated ex vivo-induced PMEL and PMELLDHA-KD CD8+ TTE cells (normalized by those in the PBS group) (n = 3 biological replicates). m, Real-time ECAR analysis of ex vivo-induced CD8+ TTE cells with or without the treatment with nicotinamide riboside (NR) (n = 5 biological replicates). Data are a single representative of three independent experiments. All data represent mean ± s.e.m. and are analysed by two-sided unpaired Student’s t-test (a, c, d, k and l) or one-way ANOVA and Tukey’s test (f–i). Schematics in e,j created using BioRender (https://Biorender.com).

